
Design and Layout Planning of a Green Hydrogen Production Facility

 , , and
Abstract
1. Introduction
2. Methodology
2.1. Technical Visit
2.2. Layout Planning
Rationale for Equipment Sizing and Spatial Allocation
2.3. Safety Analysis
2.4. Software
3. Results
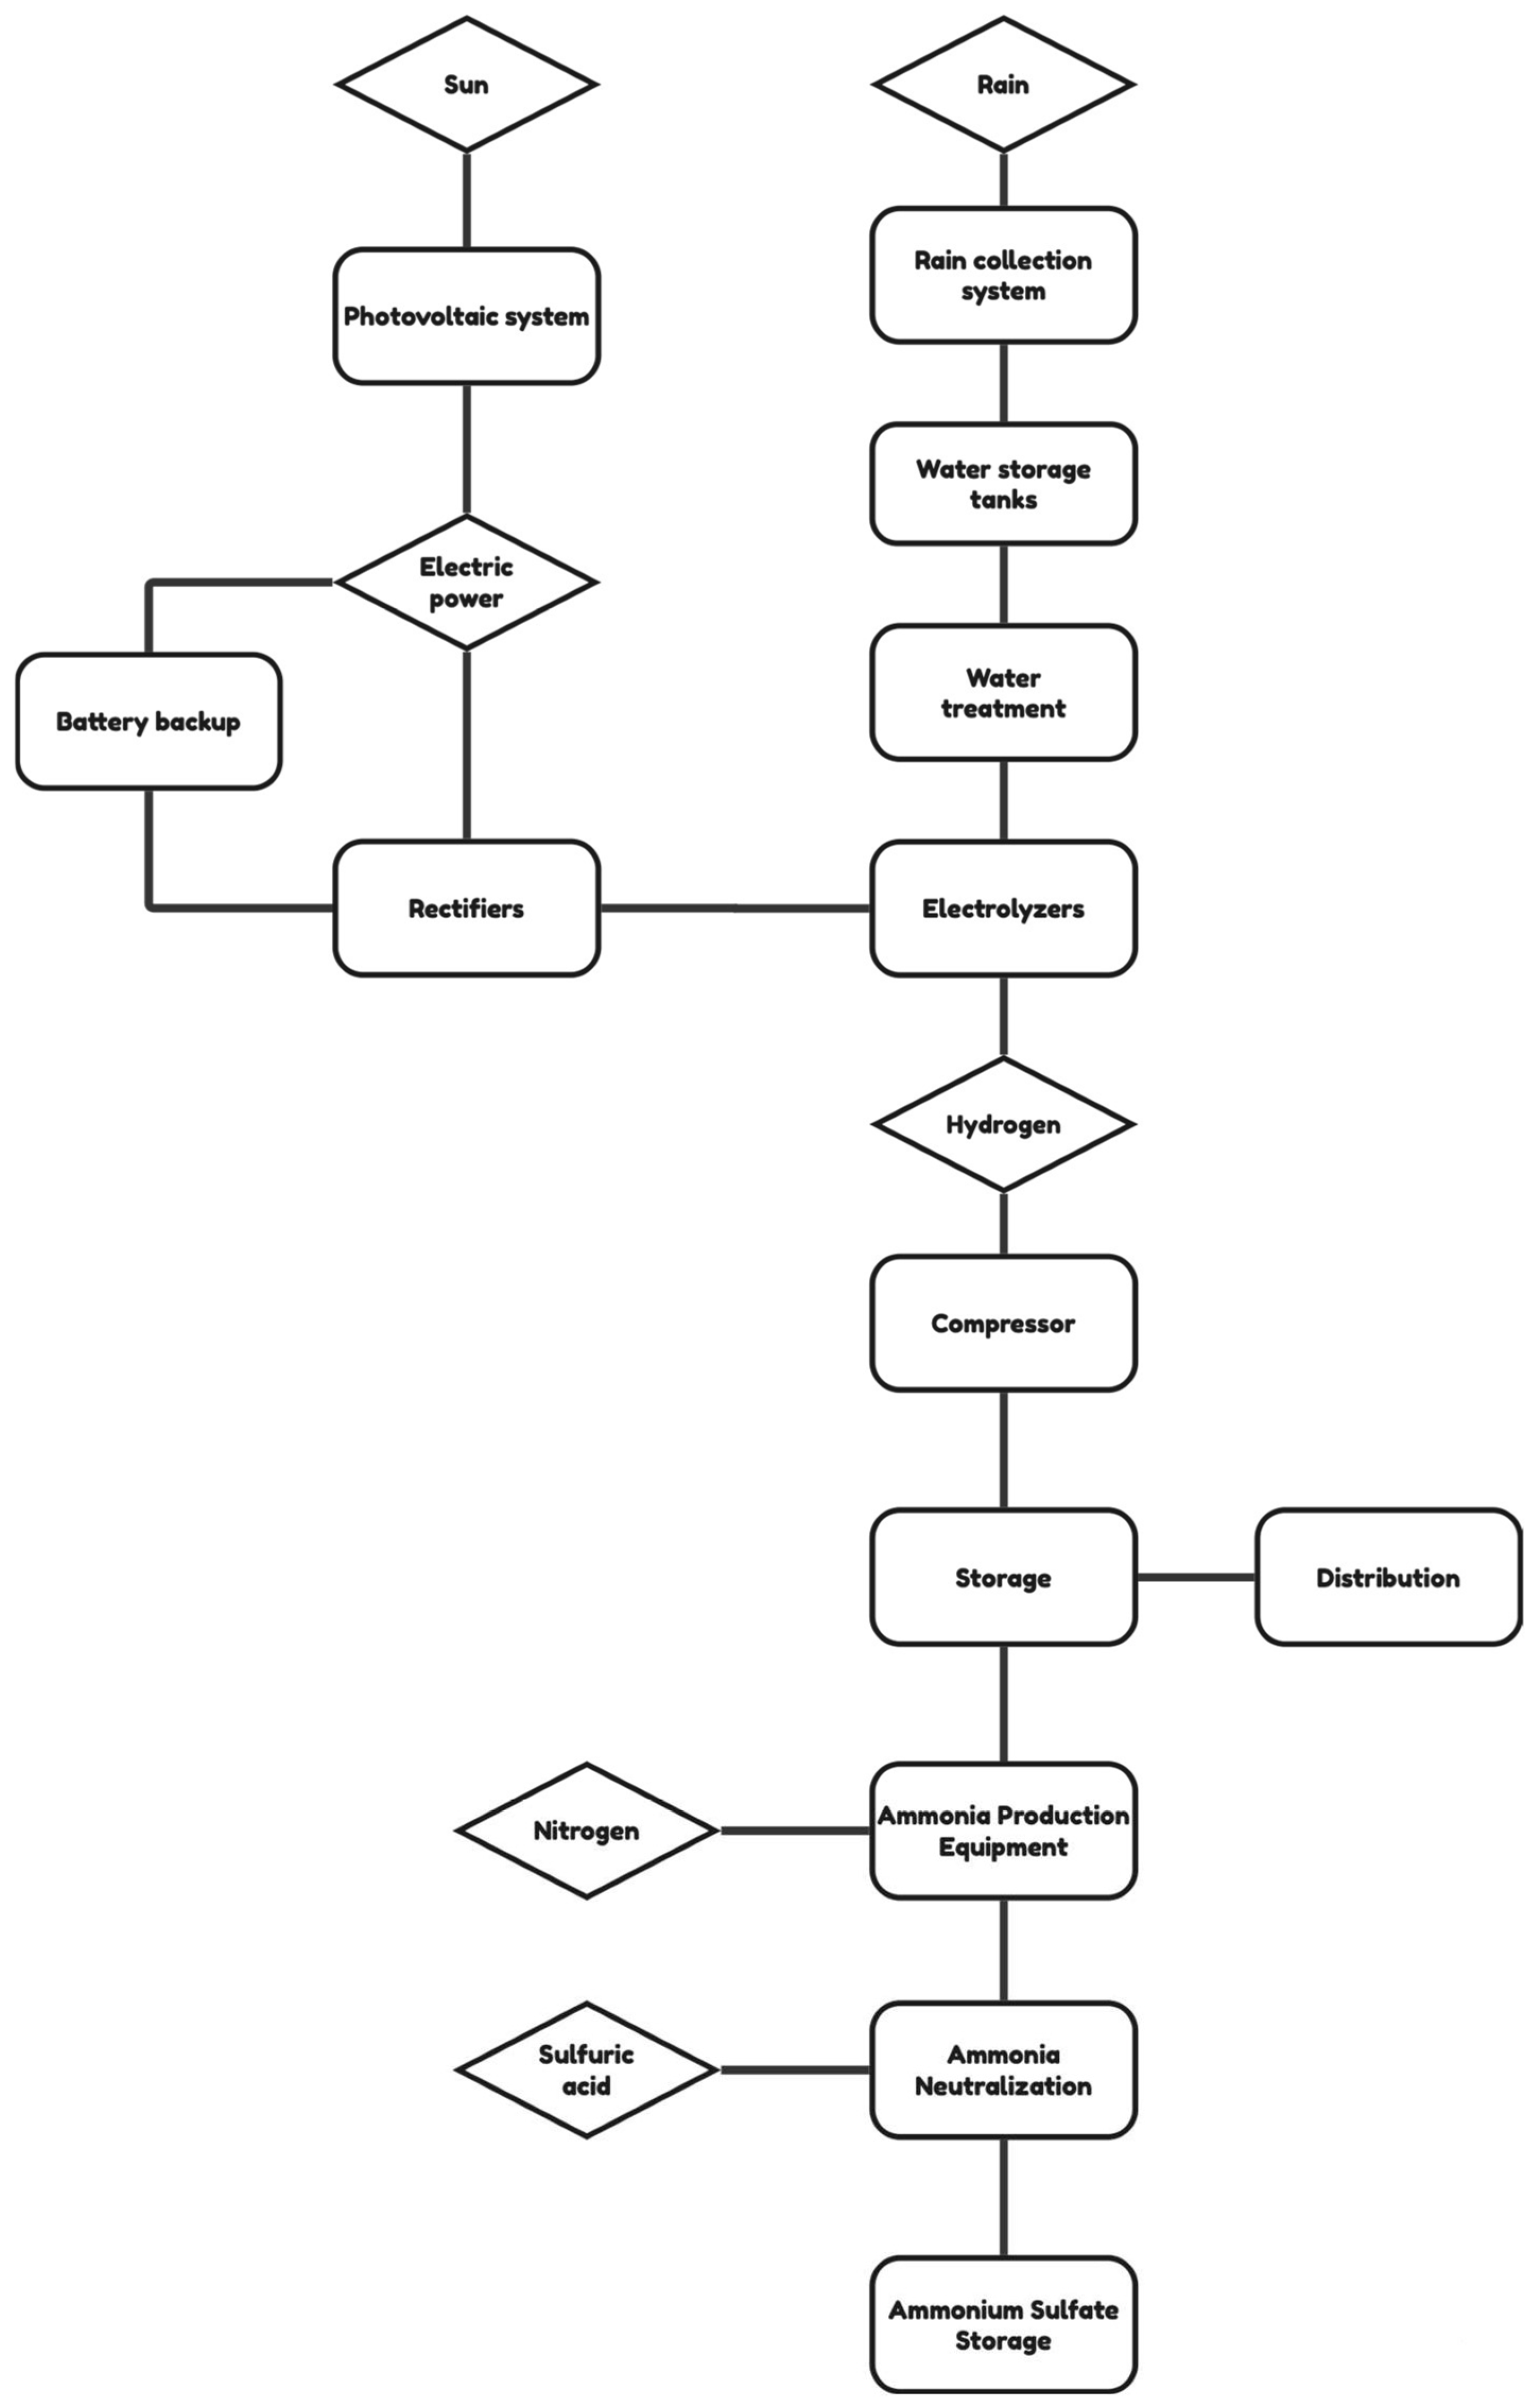
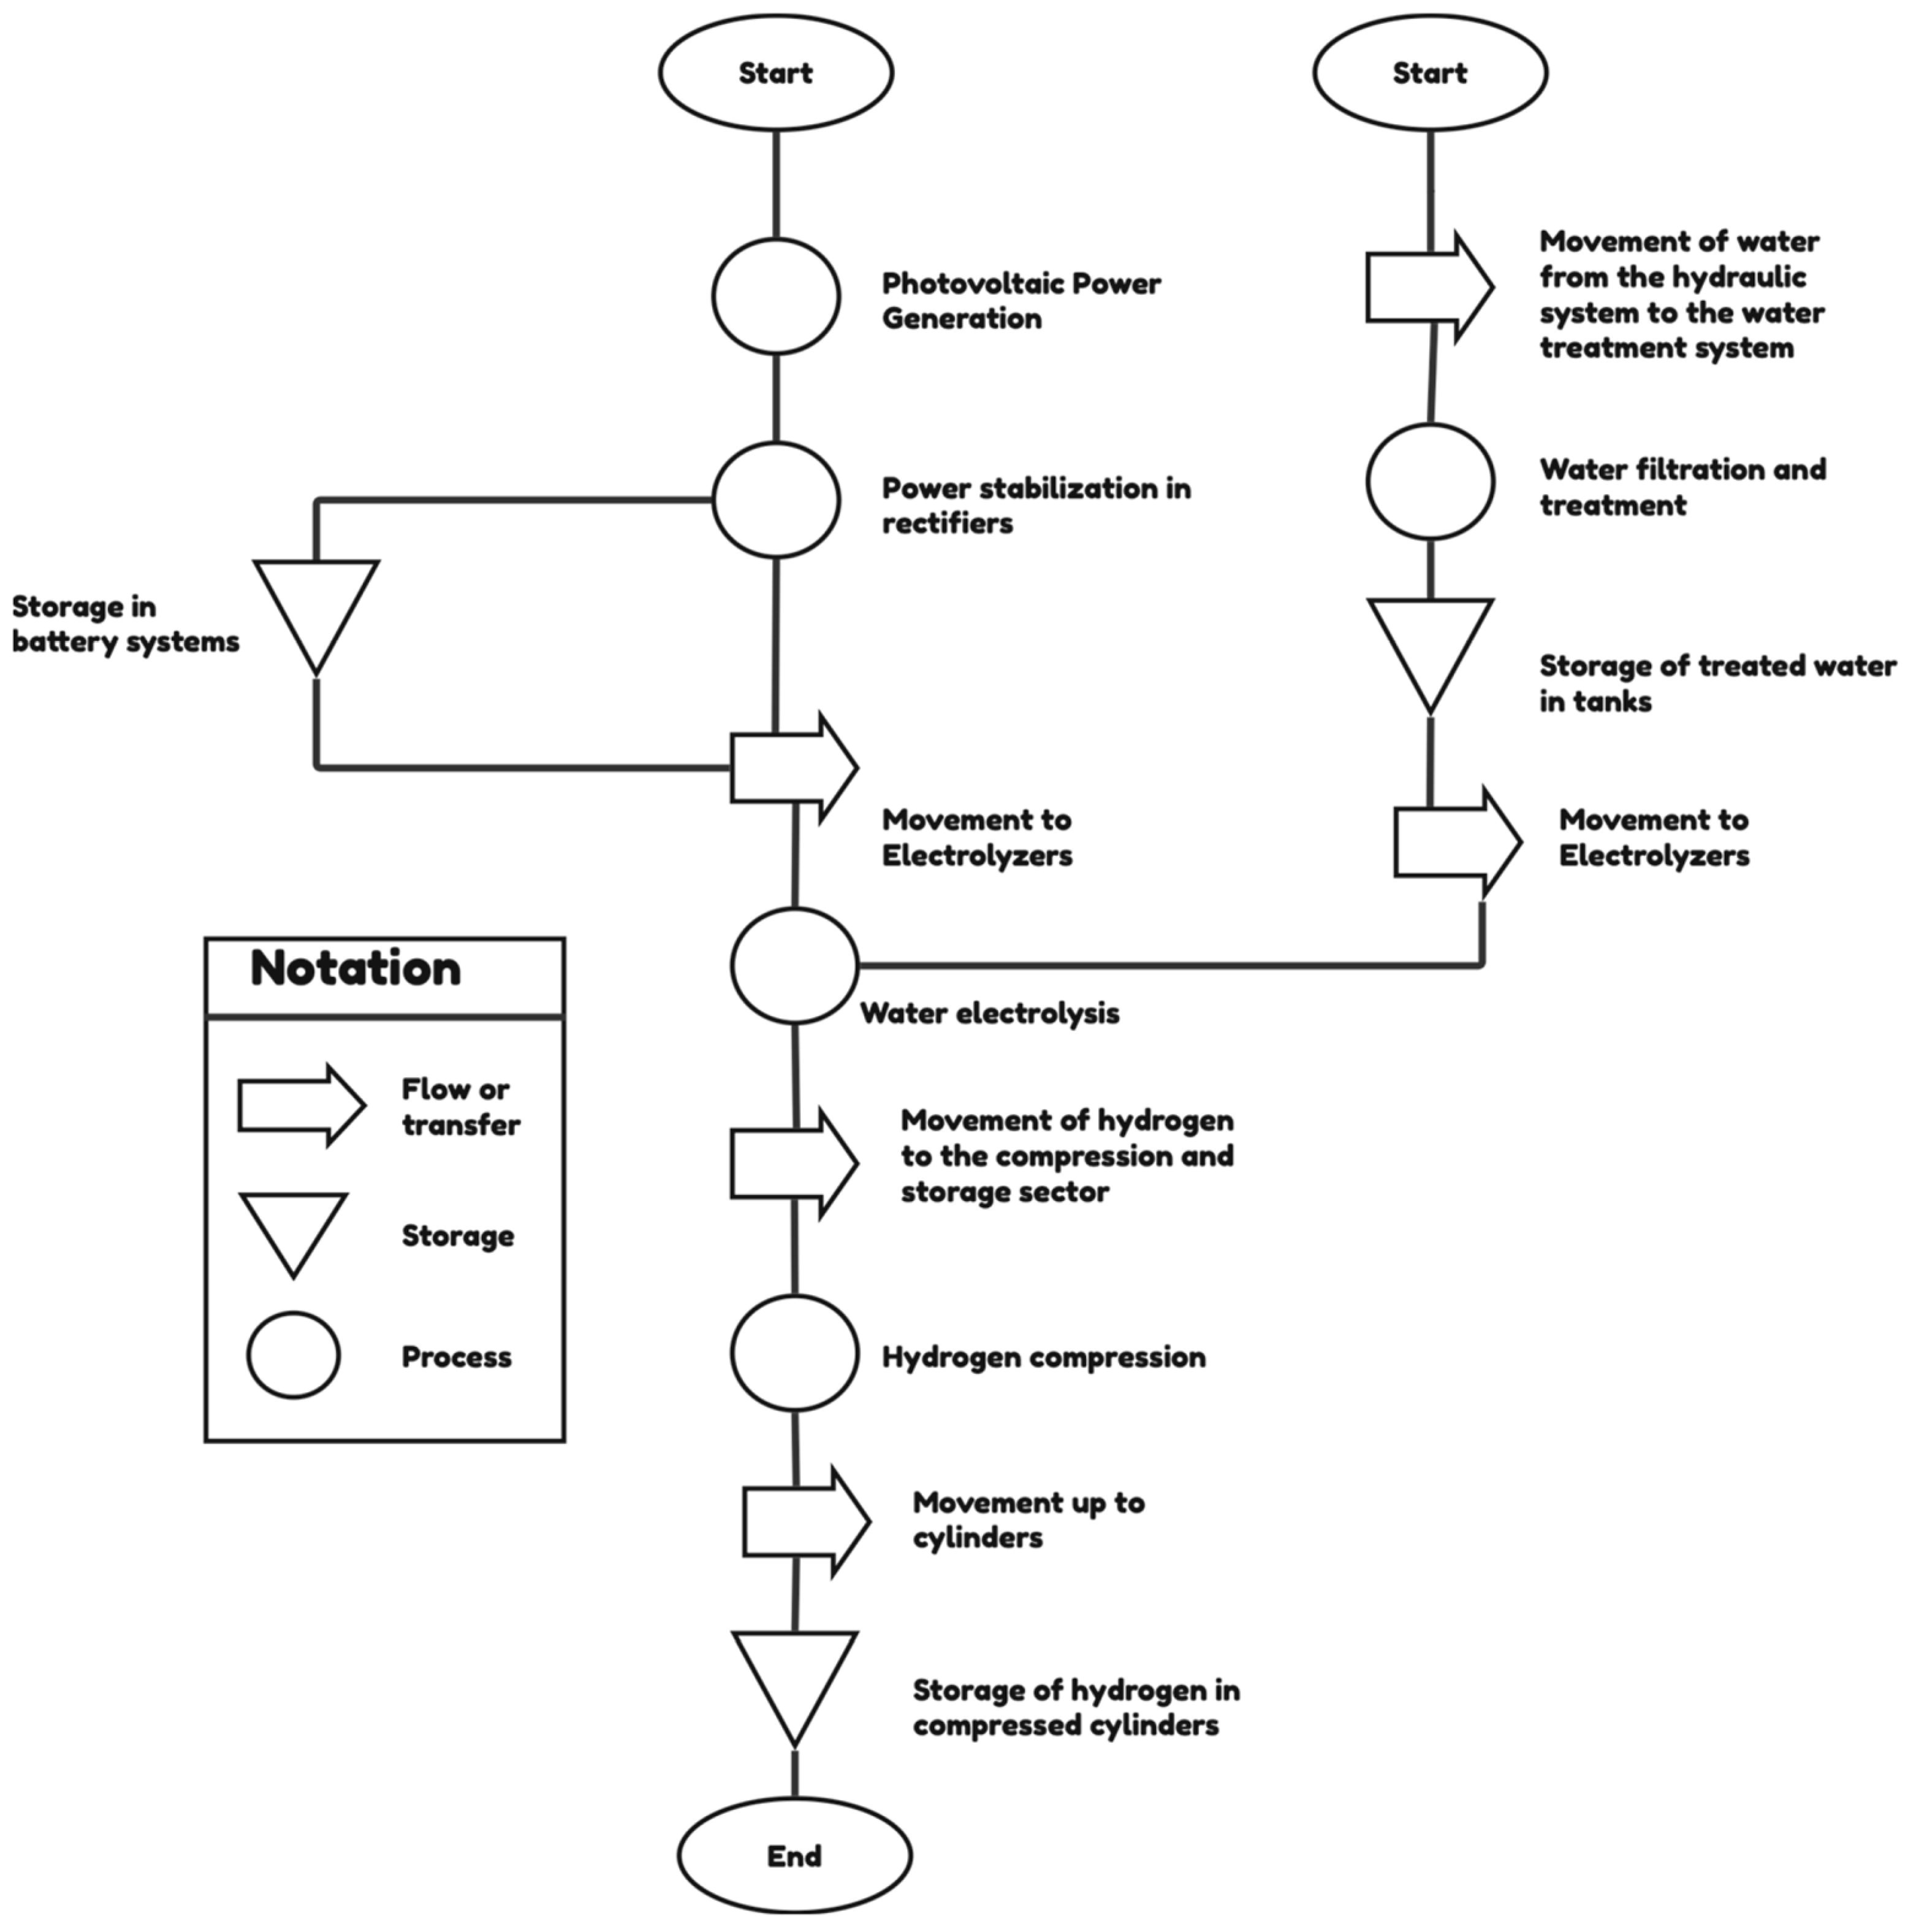
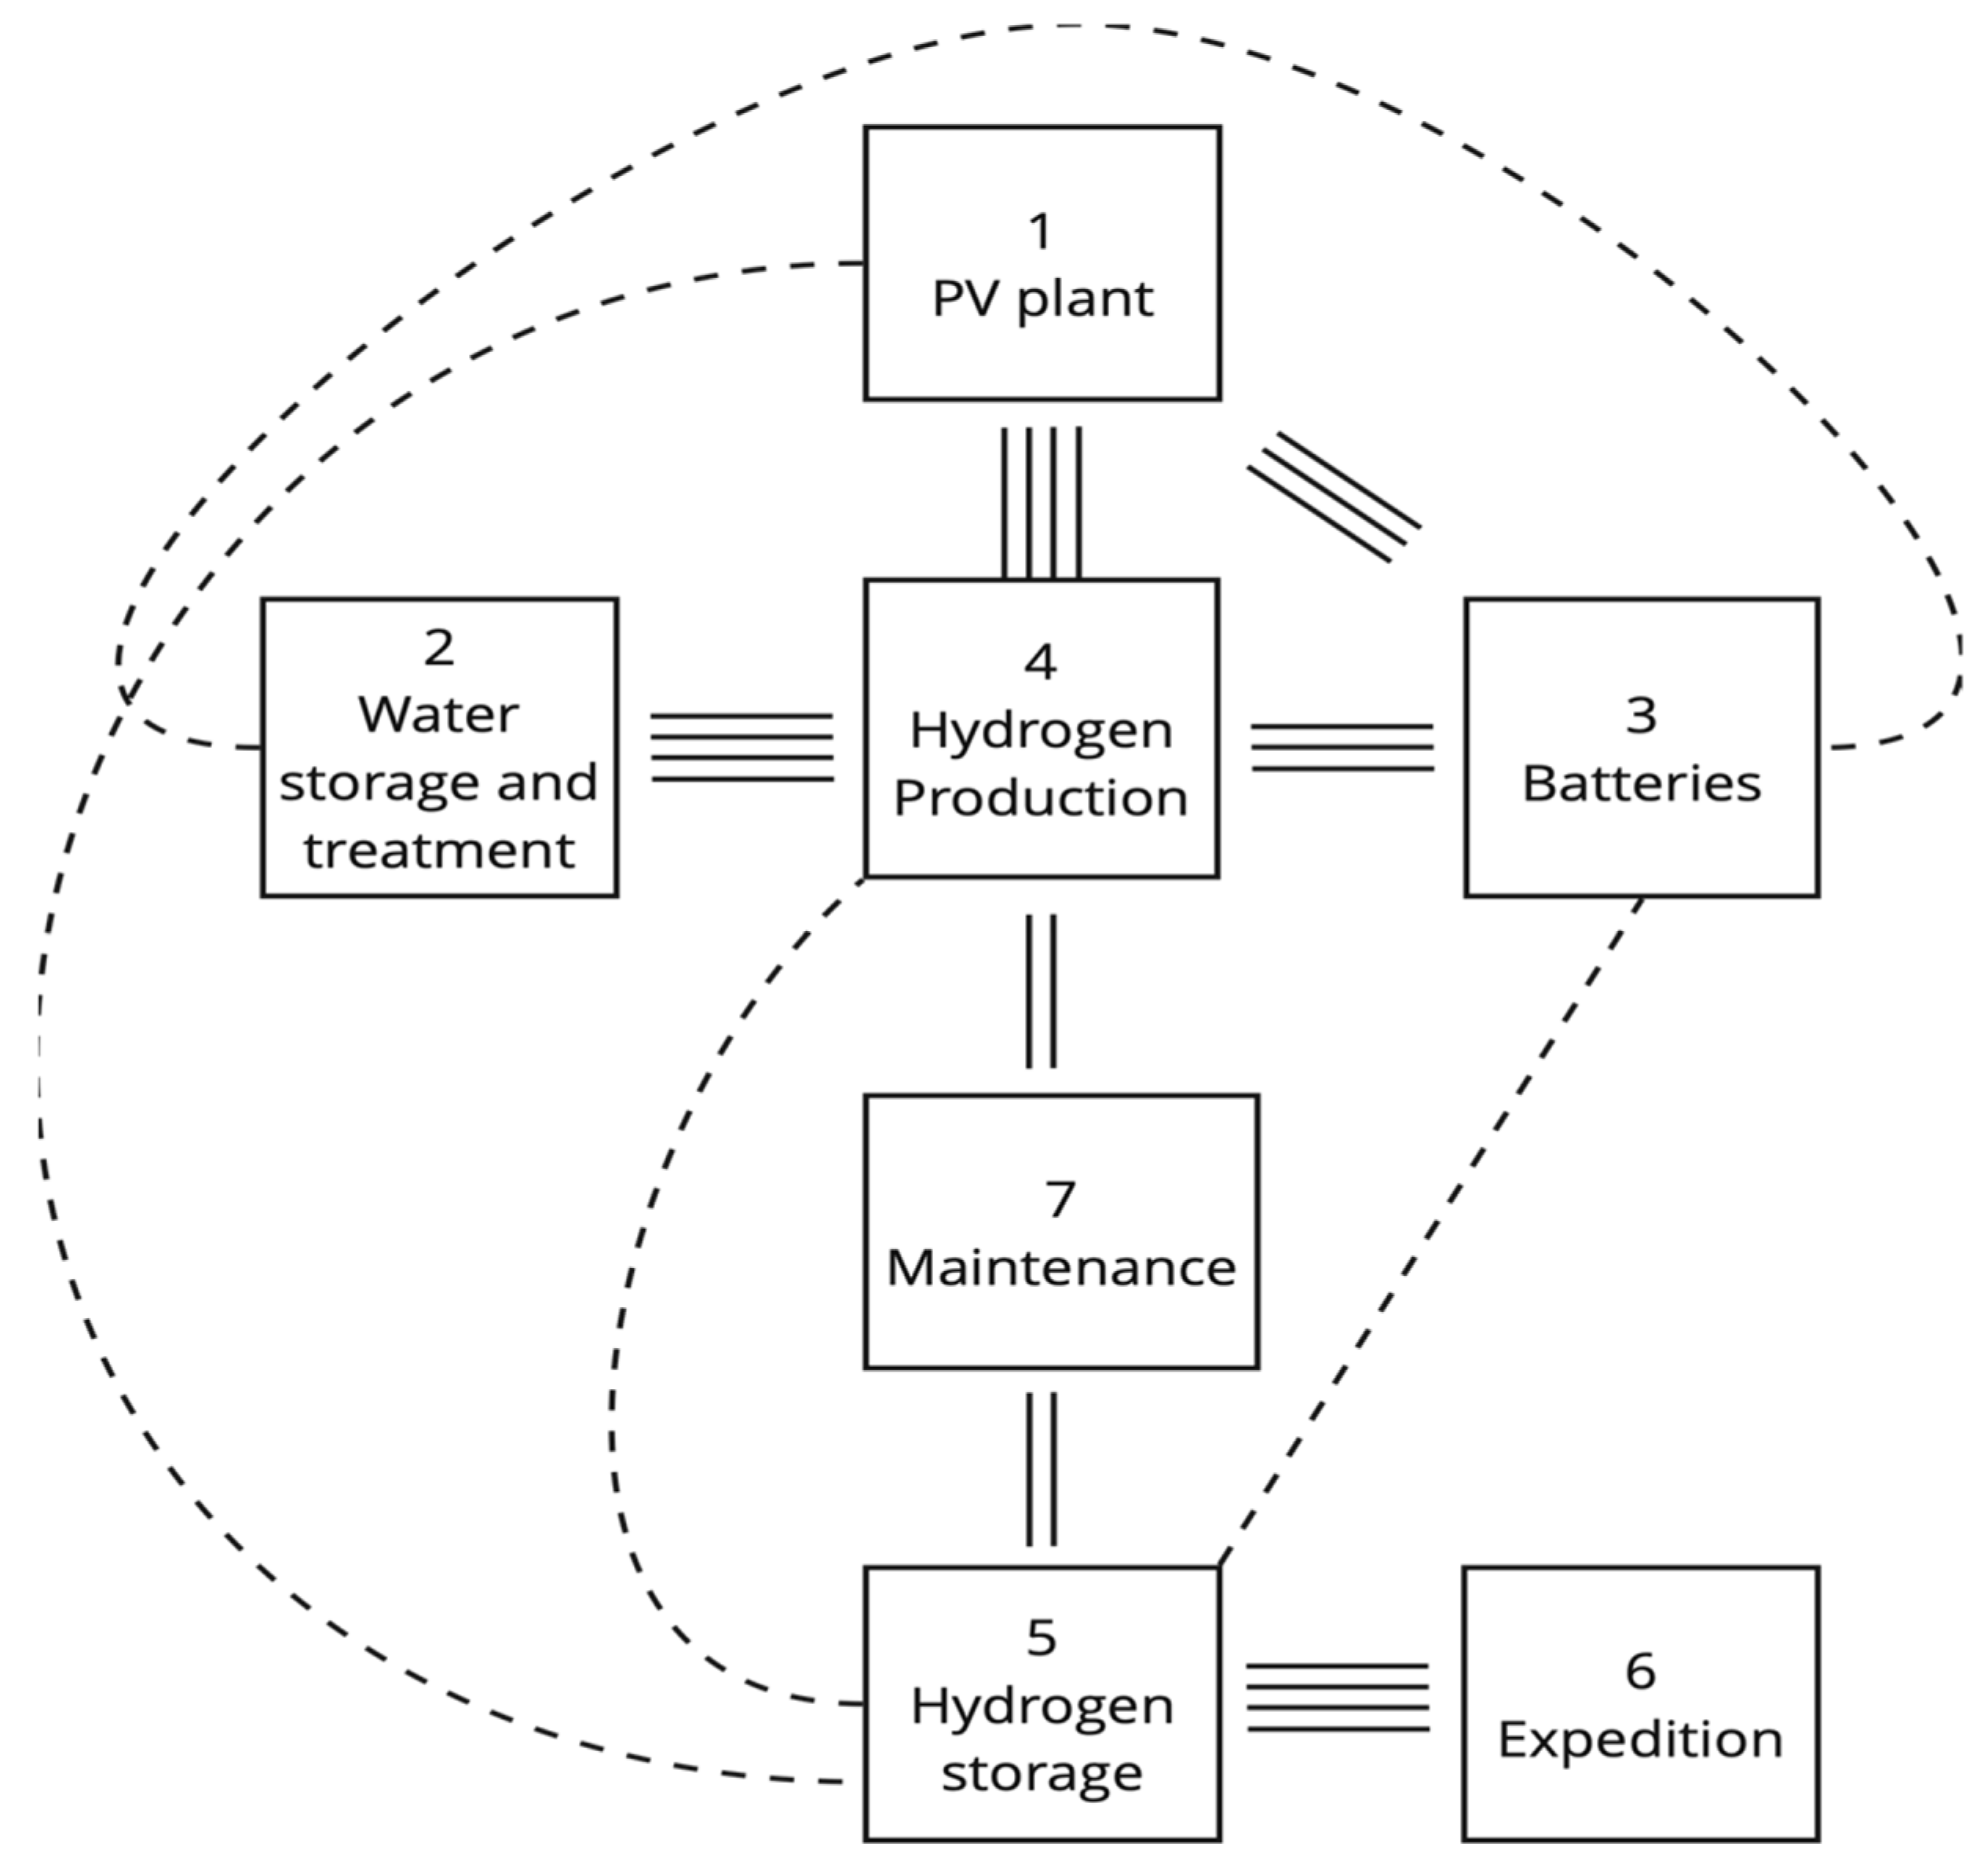
3.1. The Green Hydrogen Value Chain
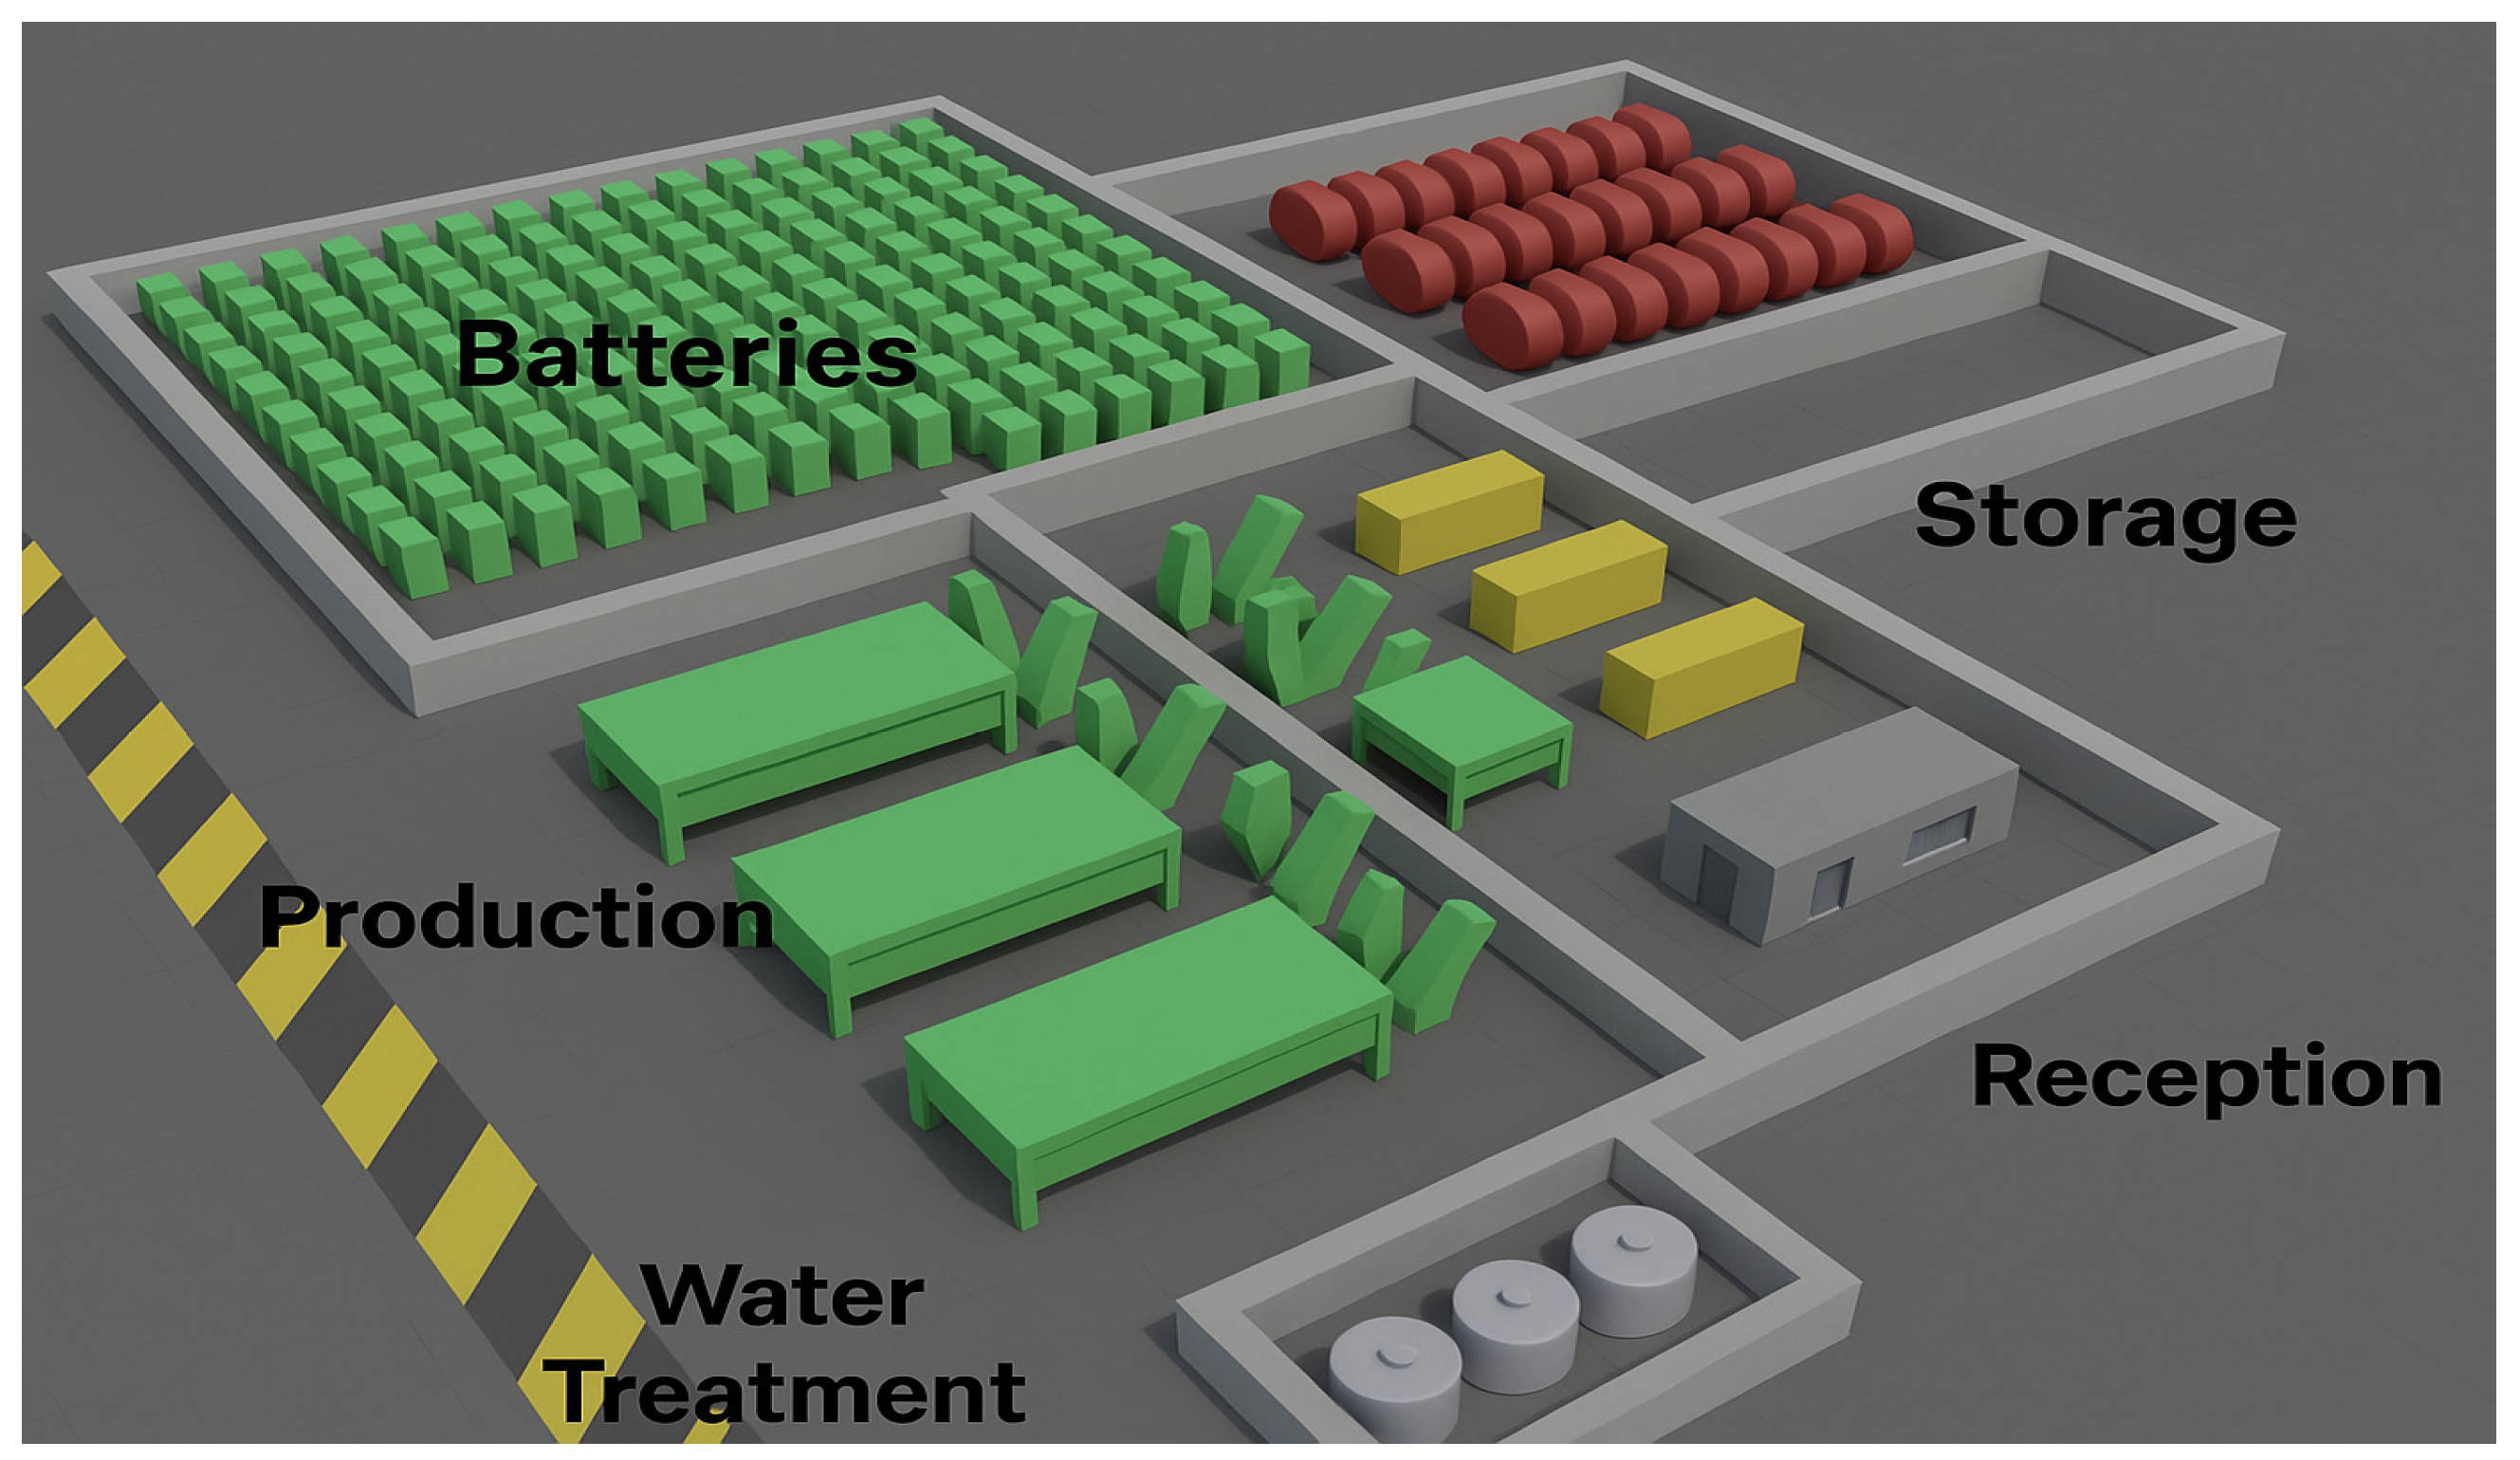
3.2. Layout Design for the Green Hydrogen Plant
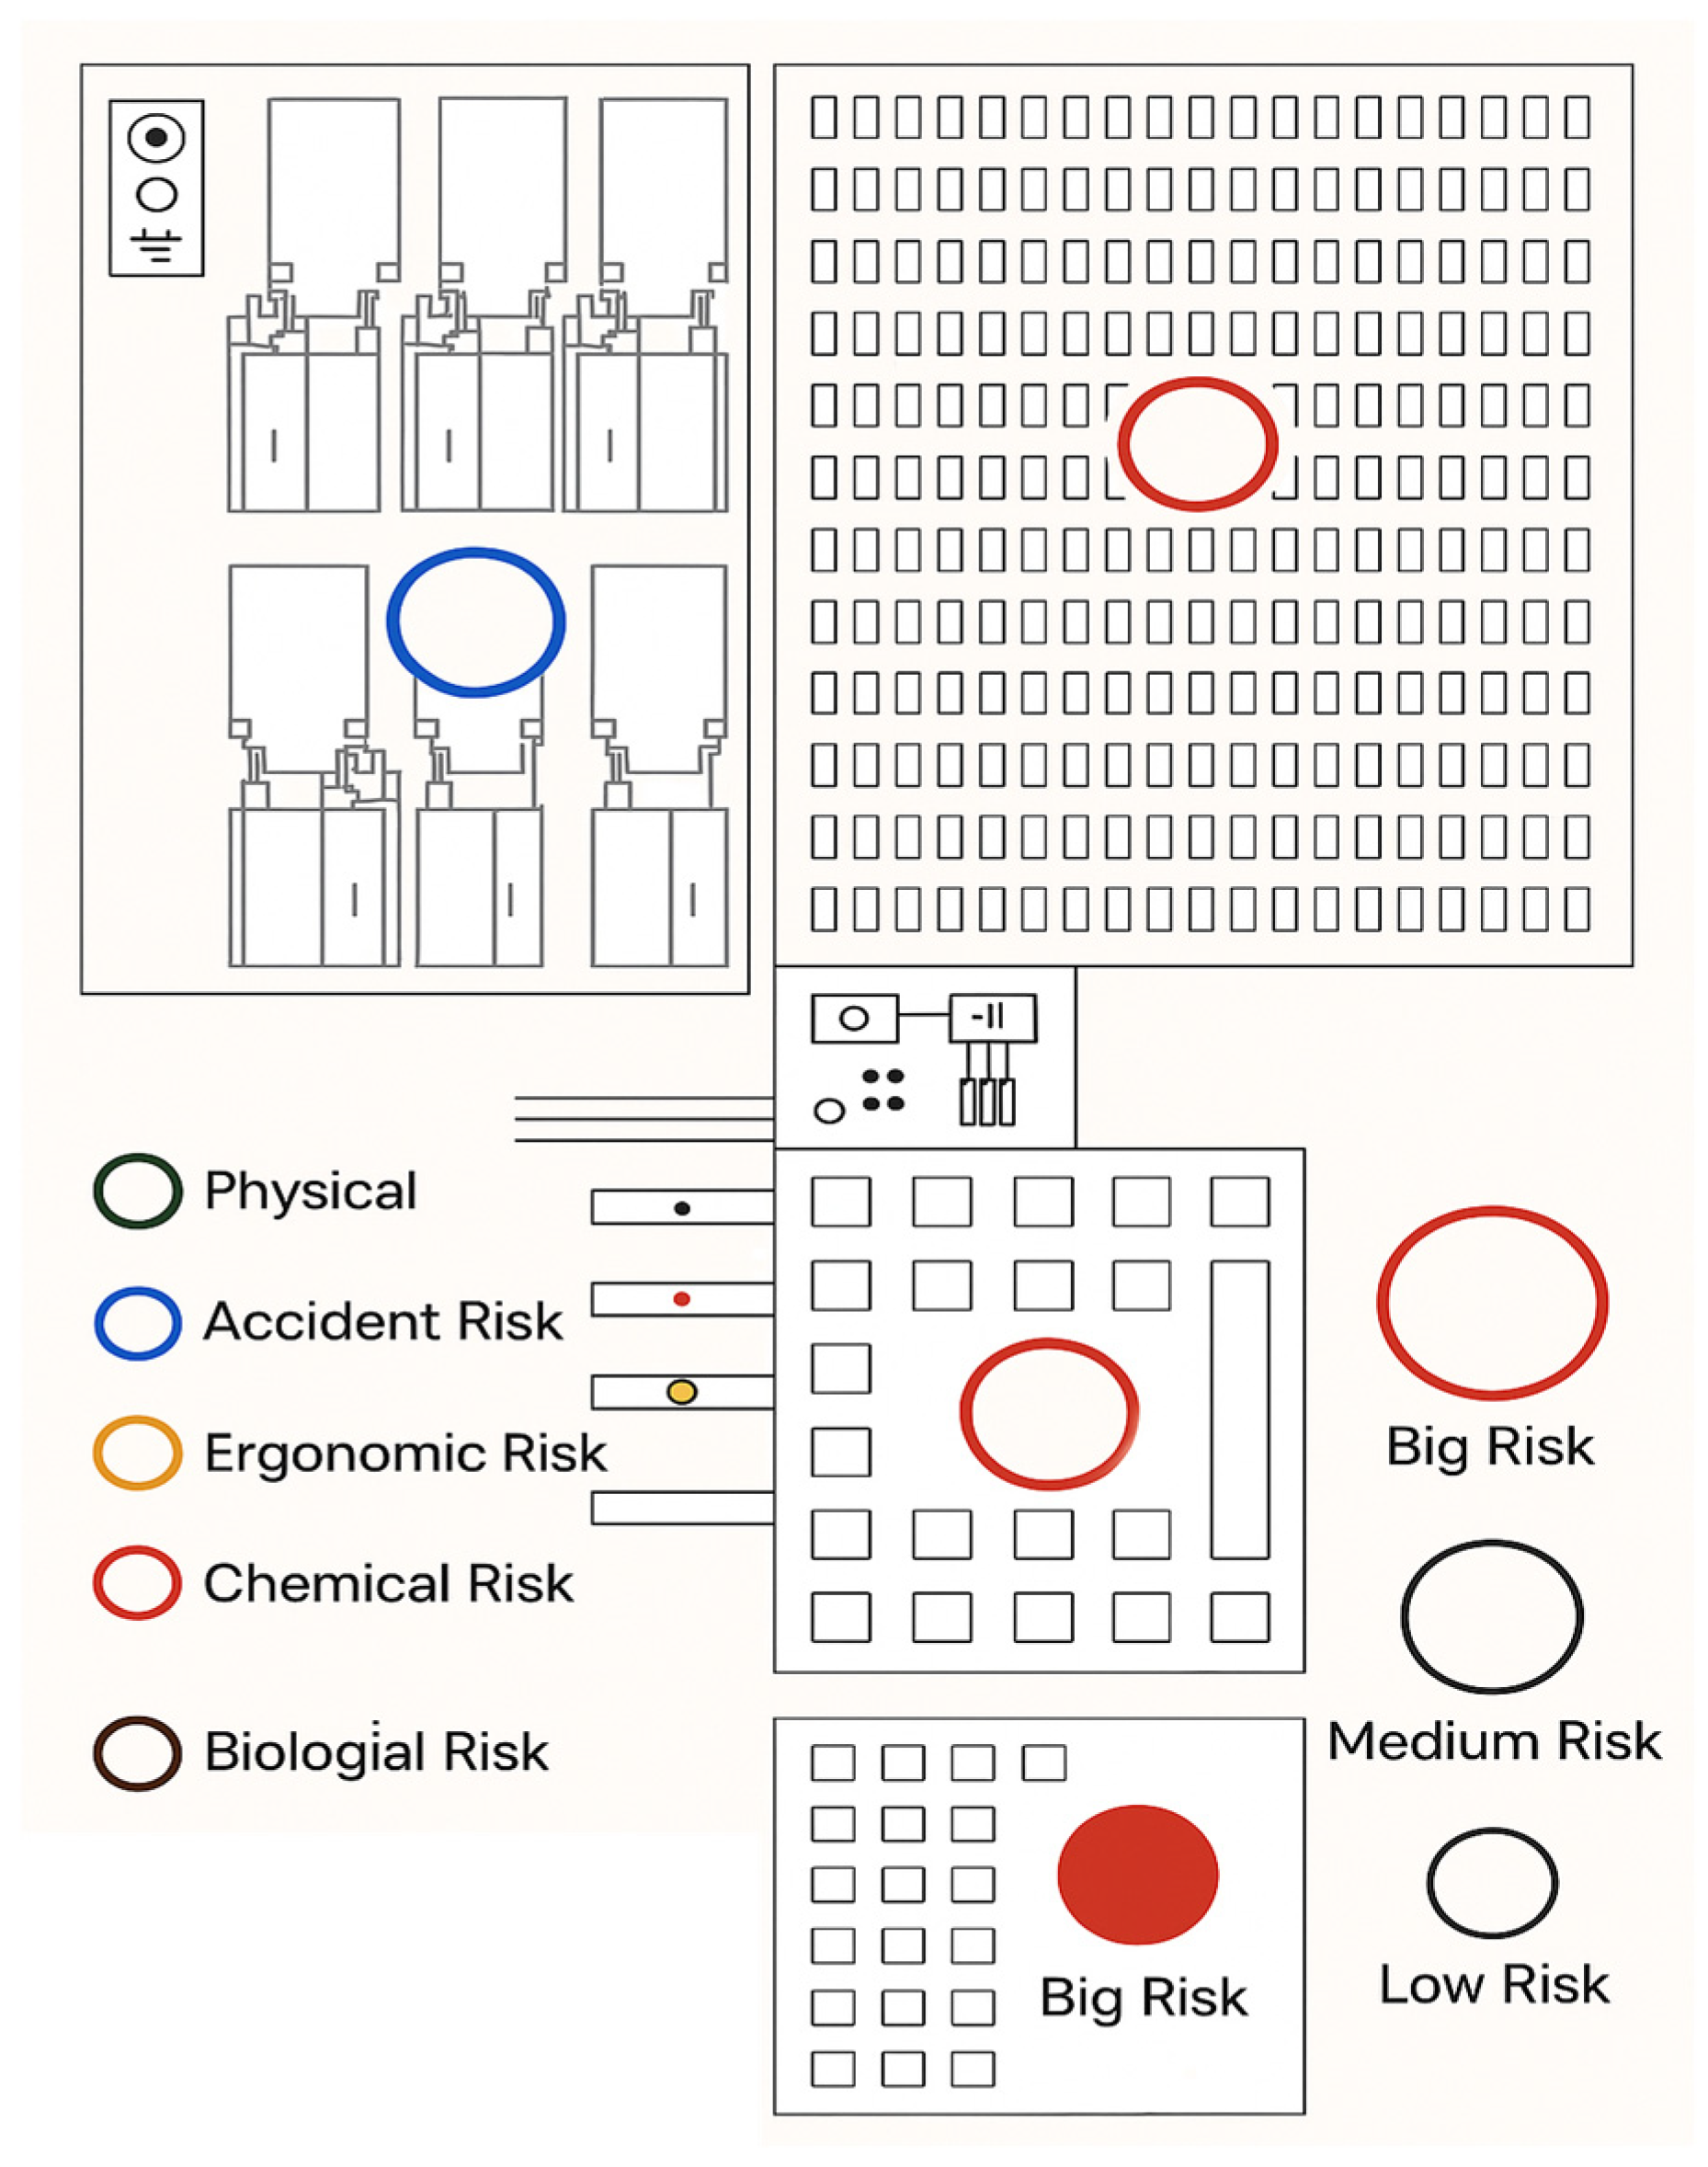
3.3. Designing Workplace Safety Measures
4. Discussion
5. Conclusions
Author Contributions
Funding
Institutional Review Board Statement
Informed Consent Statement
Data Availability Statement
Conflicts of Interest
References
- Fagundes, J.D.; de Paula, G.M.; Lago, I.; Streck, N.A.; Bisognin, D.A. Global warming: Effects on growth, development, and yield of potato. Cienc. Rural. 2010, 40, 1464–1472. [Google Scholar] [CrossRef]
- Kumar, P.M.; Pooja, R. Global Warming, Impacts and Mitigation Measures: An Overview. Disaster Adv. 2020, 13, 82–96. [Google Scholar]
- Han, H.; Zeeshan, Z.; Talpur, B.A.; Sadiq, T.; Bhatti, U.A.; Awwad, E.M.; Al-Razgan, M.; Ghadi, Y.Y. Studying Long Term Relationship between Carbon Emissions, Soil, and Climate Change: Insights from a Global Earth Modeling Framework. Int. J. Appl. Earth Obs. Geoinf. 2024, 130, 103902. [Google Scholar] [CrossRef]
- IPCC. Climate Change 2021: The Physical Science Basis; Contribution of Working Group I to the Sixth Assessment Report of the Intergovernmental Panel on Climate Change; Intergovernmental Panel on Climate Change (IPCC): Geneva, Switzerland, 2021. [Google Scholar]
- Carfí, D.; Donato, A.; Schiliró, D. Coopetitive Solutions of Environmental Agreements for the Global Economy after COP21 in Paris. J. Environ. Manag. 2019, 249, 109331. [Google Scholar] [CrossRef]
- Akashi, O.; Hijioka, Y.; Masui, T.; Hanaoka, T.; Kainuma, M. GHG Emission Scenarios in Asia and the World: The Key Technologies for Significant Reduction. Energy Econ. 2012, 34, S346–S358. [Google Scholar] [CrossRef]
- Ahang, M.; del Granado, P.C.; Tomasgard, A. Investments in Green Hydrogen as a Flexibility Source for the European Power System by 2050: Does It Pay Off? Appl. Energy 2025, 378, 124656. [Google Scholar] [CrossRef]
- Braga, H.; Gouvea, R.; Gutierrez, M. Brazilian Export Processing Zones & Green Powershoring: Challenges & Opportunities. Mod. Econ. 2023, 14, 1366–1392. [Google Scholar] [CrossRef]
- Kigle, S.; Schmidt-Achert, T.; Pérez, M.Á.M. The Impact of Country-Specific Investment Risks on the Levelized Costs of Green Hydrogen Production. Int. J. Hydrogen Energy 2024, 73, 20–31. [Google Scholar] [CrossRef]
- de Andrade, J.V.B.; da Costa, V.B.F.; Bonatto, B.D.; Áquila, G.; Pamplona, E.d.O.; Bhandari, R. Perspective under Uncertainty and Risk in Green Hydrogen Investments: A Stochastic Approach Using Monte Carlo Simulation. Int. J. Hydrogen Energy 2024, 49, 385–404. [Google Scholar] [CrossRef]
- Dos Santos Puga, M.; Asencios, Y.J.O. Avanços e Limitações da Produção, Armazenamento e Transporte de Hidrogênio Verde. Lat. Am. J. Energy Res. 2023, 10, 74–93. [Google Scholar] [CrossRef]
- International Energy Agency (IEA). Global EV Outlook 2019; IEA: Paris, France, 2019. [Google Scholar]
- Kelman, R.; Gaspar, L.d.S.; Geyer, F.S.; Barroso, L.A.N.; Pereira, M.V.F. Can Brazil Become a Green Hydrogen Powerhouse? J. Power Energy Eng. 2020, 8, 21–32. [Google Scholar] [CrossRef]
- Sánchez-Squella, A.; Muñoz, M.; Toledo, M.; Yanine, F. Techno-Economic Assessment of a Green Hydrogen Production Plant for a Mining Operation in Chile. Int. J. Hydrogen Energy 2025, 112, 531–543. [Google Scholar] [CrossRef]
- Zoghi, M.; Gharaie, S.; Hosseinzadeh, N.; Zare, A. Thermo-Economic and Environmental Comparison of Renewable Feed Compressed Air Energy Storage Systems for Stable Green Hydrogen Production. J. Energy Storage 2025, 110, 115326. [Google Scholar] [CrossRef]
- He, Y.; Yuan, J.; Liao, N. West-East Hydrogen Transmission: Mode Selection and Key Factor Analysis of Green Hydrogen Supply Chain. J. Environ. Manag. 2025, 376, 124472. [Google Scholar] [CrossRef] [PubMed]
- Dehshiri, S.S.H.; Firoozabadi, B. Hydrogen Penetration in Textile Industry: A Hybrid Renewable Energy System, Evolution Programming and Feasibility Analysis. Energy 2025, 318, 134785. [Google Scholar] [CrossRef]
- Mazza, A.; Forte, A.; Bompard, E.; Cavina, G.; Angelini, A.M.; Melani, M. Assessment of the Role of Green Hydrogen as the Commodity Enabling a New Green Dialogue among the Mediterranean Shores. Energy Convers. Manag. X 2024, 23, 100614. [Google Scholar] [CrossRef]
- Kumar, S.S.; Lim, H. An Overview of Water Electrolysis Technologies for Green Hydrogen Production. Energy Rep. 2022, 8, 13793–13813. [Google Scholar] [CrossRef]
- Hunt, J.D.; Nascimento, A.; Romero, O.J.; Zakeri, B.; Jurasz, J.; Dąbek, P.B.; Strzyżewski, T.; Đurin, B.; Leal Filho, W.; Freitas, M.A.V.; et al. Hydrogen Storage with Gravel and Pipes in Lakes and Reservoirs. Nat. Commun. 2024, 15, 7723. [Google Scholar] [CrossRef]
- Caiafa, C.; Romijn, H.; de Coninck, H. Identifying Opportunities and Risks from Green Hydrogen: A Framework and Insights from a Developing Region in Brazil. Clim. Policy 2024, 25, 612–630. [Google Scholar] [CrossRef]
- Muther, R. Planejamento Do Layout: Sistema SLP; E. Blucher: São Paulo, Brazil, 1978. [Google Scholar]
- Fahad, M.; Naqvi, S.A.A.; Atir, M.; Zubair, M.; Shehzad, M.M. Energy Management in a Manufacturing Industry through Layout Design. In Procedia Manufacturing; Elsevier B.V.: Amsterdam, The Netherlands, 2017; Volume 8, pp. 168–174. [Google Scholar]
- Olivério, J.L. Projeto de Fábrica: Produtos, Processos e Instalações Industriais; IBLC: São Paulo, Brazil, 1985; p. 23. [Google Scholar]
- Longi Eletrolisador de Água Alcalina. Available online: https://www.longi.com/br/news/ (accessed on 12 March 2025).
- Minnuo Hydrogen Compressor. Available online: https://mncompressor.com/gas_compressor/hydrogen-compressor/ (accessed on 12 March 2025).
- Iberdrola Presentación de Resultados 2022. Available online: https://www.iberdrola.com/documents/20125/2955414/Resultados-22FY.pdf (accessed on 12 March 2025).
- Atlas Renewable Energy Planta Solar Do Futuro. Available online: https://pt.atlasrenewableenergy.com/proyectos/planta-solar-sol-do-futuro-ceara-brasil/ (accessed on 12 March 2025).
- Operador Nacional Do Sistema Elétrico—ONS Capacidade Instalada de Geraçao. Available online: https://www.ons.org.br/Paginas/resultados-da-operacao/historico-da-operacao/evolucao_capacidade_instalada.aspx (accessed on 12 March 2025).
- AMP NOVA Sistemas Comerciais de Armazenamento de Energia (AC) Amp Nova Battery. Available online: https://solarbatterymanufacturer.com/pt/commercial-energy-storage-systems-ac (accessed on 13 March 2025).
- INMETRO. O Sistema Internacional de Unidades. Available online: https://www.gov.br/inmetro/pt-br/centrais-de-conteudo/publicacoes/documentos-tecnicos-em-metrologia/si_versao_final.pdf/view (accessed on 13 March 2025).
- Abdelwahed, S.B.; Gassoumi, M.; Hamdi, F.; Ennetta, R. Experimental Assessment of the Effects of Water Quality and PV Panel Orientation on Green Hydrogen Production. Int. J. Thermofluids 2025, 26, 101118. [Google Scholar] [CrossRef]
- Horri, B.A.; Ozcan, H. Green Hydrogen Production by Water Electrolysis: Current Status and Challenges. Curr. Opin. Green Sustain. Chem. 2024, 47, 100932. [Google Scholar] [CrossRef]
- Corpo de Bombeiros Militar do Ceará Carga de Incêndio Nas Edificações e Áreas de Risco. Available online: https://www.cepi.cb.ce.gov.br/wp-content/uploads/sites/100/2019/04/NT-005-%E2%80%93-Sa%C3%ADdas-de-Emerg%C3%AAncia.pdf (accessed on 13 March 2025).
- Associação Brasileira De Normas Técnicas Sinalização de Segurança Contra Incêndio e Pânico. Available online: https://www.gmfmontagens.com.br/assets/content/downloads/fd85e8d663a986cfc01397e13ce063ff.pdf (accessed on 13 March 2025).
- Wolf, N.; Neuber, R.; Mädlow, A.; Höck, M. Techno-Economic Analysis of Green Hydrogen Supply for a Hydrogen Refueling Station in Germany. Int. J. Hydrogen Energy 2025, 106, 318–333. [Google Scholar] [CrossRef]
- He, H.; Huang, Y.; Nakadomari, A.; Masrur, H.; Krishnan, N.; Hemeida, A.M.; Mikhaylov, A.; Senjyu, T. Potential and Economic Viability of Green Hydrogen Production from Seawater Electrolysis Using Renewable Energy in Remote Japanese Islands. Renew. Energy 2023, 202, 1436–1447. [Google Scholar] [CrossRef]
- Pingkuo, L.; Junqing, G. Comparative Analysis on the Development Potential of Green Hydrogen Industry in China, the United States and the European Union. Int. J. Hydrogen Energy 2024, 84, 700–717. [Google Scholar] [CrossRef]
- Zhang, S.; Geng, Z.; Li, Y.; Li, X.; Chen, L. A Novel Two-Stage Optimal Layout Model of Hydrogen Refueling Facility Network Based on Green Electricity Hydrogen Production: Beijing-Tianjin-Hebei Region of China as Case Study. Renew. Energy 2024, 237, 121597. [Google Scholar] [CrossRef]
- Kiran, D.R. Systematic Layout Planning. In Production Planning and Control; Elsevier: Amsterdam, The Netherlands, 2019; pp. 279–292. [Google Scholar]
- Khariwal, S.; Kumar, P.; Bhandari, M. Layout Improvement of Railway Workshop Using Systematic Layout Planning (SLP)—A Case Study. In Materials Today: Proceedings; Elsevier: Amsterdam, The Netherlands, 2020; Volume 44, pp. 4065–4071. [Google Scholar]
- Zhang, W.; Jin, Y.; Zhang, R.; Wang, Y. Layout Optimization of Irregular Storage Areas under Class Storage Strategy Based on Clustering and Multi-Bin Size Packing Problem. PLoS ONE 2024, 19, e0307218. [Google Scholar] [CrossRef]
- Dobrovoczki, P.; Kovács, A.; Sakata, H.; Tsutsumi, D. Integrated System Configuration and Layout Planning for Flexible Manufacturing Systems. J. Manuf. Syst. 2024, 77, 384–397. [Google Scholar] [CrossRef]
- Klar, M.; Schworm, P.; Wu, X.; Simon, P.; Glatt, M.; Ravani, B.; Aurich, J.C. Transferable Multi-Objective Factory Layout Planning Using Simulation-Based Deep Reinforcement Learning. J. Manuf. Syst. 2024, 74, 487–511. [Google Scholar] [CrossRef]
- Figueiredo, R.L.; Ortiz, C.E.A.; Silva, J.M. Green Hydrogen As Renewable Energy Source in The Mining Industry. Conexões 2024, 18, e022003. [Google Scholar] [CrossRef]
- Delgadillo, C.A. Catalisadores Contendo Metais de Transição Sobre Estruturas de Nitrogênio e Carbono Para Produção de Hidrogênio Por Meio Da Eletrólise de Água Salgada. Master’s Thesis, Instituto de Pesquisas Energéticas e Nucleares—IPEN-C/SP, São Paulo, Brazil, 2021. [Google Scholar]
- Bohler, M.C. A Utilização Da Abordagem SLP Para Fabricação de Pranchas de Surfe: Um Estudo de Caso Prático. Bachelor’s Thesis, Universidade Federal de Santa Catarina, Florianópolis, Brazil, 2023. [Google Scholar]
- Esteves, N.B.; Sigal, A.; Leiva, E.P.M.; Rodríguez, C.R.; Cavalcante, F.S.A.; de Lima, L.C. Wind and Solar Hydrogen for the Potential Production of Ammonia in the State of Ceará—Brazil. Int. J. Hydrogen Energy 2015, 40, 9917–9923. [Google Scholar] [CrossRef]
- de Souza, A.; de Oliveira-Júnior, J.F.; Abreu, M.C.; de Medeiros, E.S.; Gautam, S. Statistical Distribution Modeling of Global Solar Radiation in Alagoas, Brazil: A Comparative Study (2008–2016). Geosyst. Geoenviron. 2025, 100352, in press, journal pre-proof. [Google Scholar] [CrossRef]
- Hunt, J.; Neves, N.P., Jr.; Salgado, B.C.B.; Fernandes, J.T.; Murta, A.L.S. Aspectos Sobre o Armazenamento e Transporte de Hidrogênio; LaSUS FAU UnB: Brasília, DF, Brazil, 2023. [Google Scholar]
- Madsen, H.T. Tratamento de Água Para a Geração de Hidrogênio Verde: O Que Você Precisa Saber. Available online: https://tratamentodeagua.com.br/artigo/tratamento-agua-geracao-hidrogenio-verde/ (accessed on 14 March 2025).
- Costa, M.d.S.Q. Modelo de Critérios Para Macrolocalização de Usinas de Hidrogênio Verde No Brasil. Master’s Thesis, Federal University of Santa Catarina (UFSC), Florianópolis, Brazil, 2024. [Google Scholar]
- Bezerra, F.D. Hidrogênio Verde: Nasce Um Gigante No Setor De Energia. Cad. Setorial ETENE 2021, 6. [Google Scholar]
- de Souza, E.G.; Nadaleti, W.C.; Thue, P.S.; dos Santos, M.C. Exploring the Capacity and Economic Viability of Green Hydrogen Production by Utilising Surplus Energy from Wind Farms and Small Hydropower Plants in Southern Brazil. Int. J. Hydrogen Energy 2024, 64, 1–14. [Google Scholar] [CrossRef]
- Rashid, M.M.; Al Mesfer, M.K.; Naseem, H.; Danish, M. Hydrogen Production by Water Electrolysis: A Review of Alkaline Water Electrolysis, PEM Water Electrolysis and High Temperature Water Electrolysis. Int. J. Eng. Adv. Technol 2015, 4, 2249–8958. [Google Scholar]


| Sector | Productive Means | Amount | Width (m) | Length (m) | Needed Area |
|---|---|---|---|---|---|
| Battery room | Batteries | 450 | 2.2 | 1.1 | 1089 |
| Water treatment | Purifier | 1 | 2.5 | 1.1 | 2.75 |
| Tanks | 3 | 3.2 | 3.2 | 30.72 | |
| Production | Electrolyser | 8 | 8 | 35 | 2240 |
| Storage | Compressor | 23 | 4 | 2.85 | 262.20 |
| Cylinders | 7200 | 0.23 | 0.23 | 380.88 | |
| Maintenance | Cylinders | 50 | 0.23 | 0.23 | 2.65 |
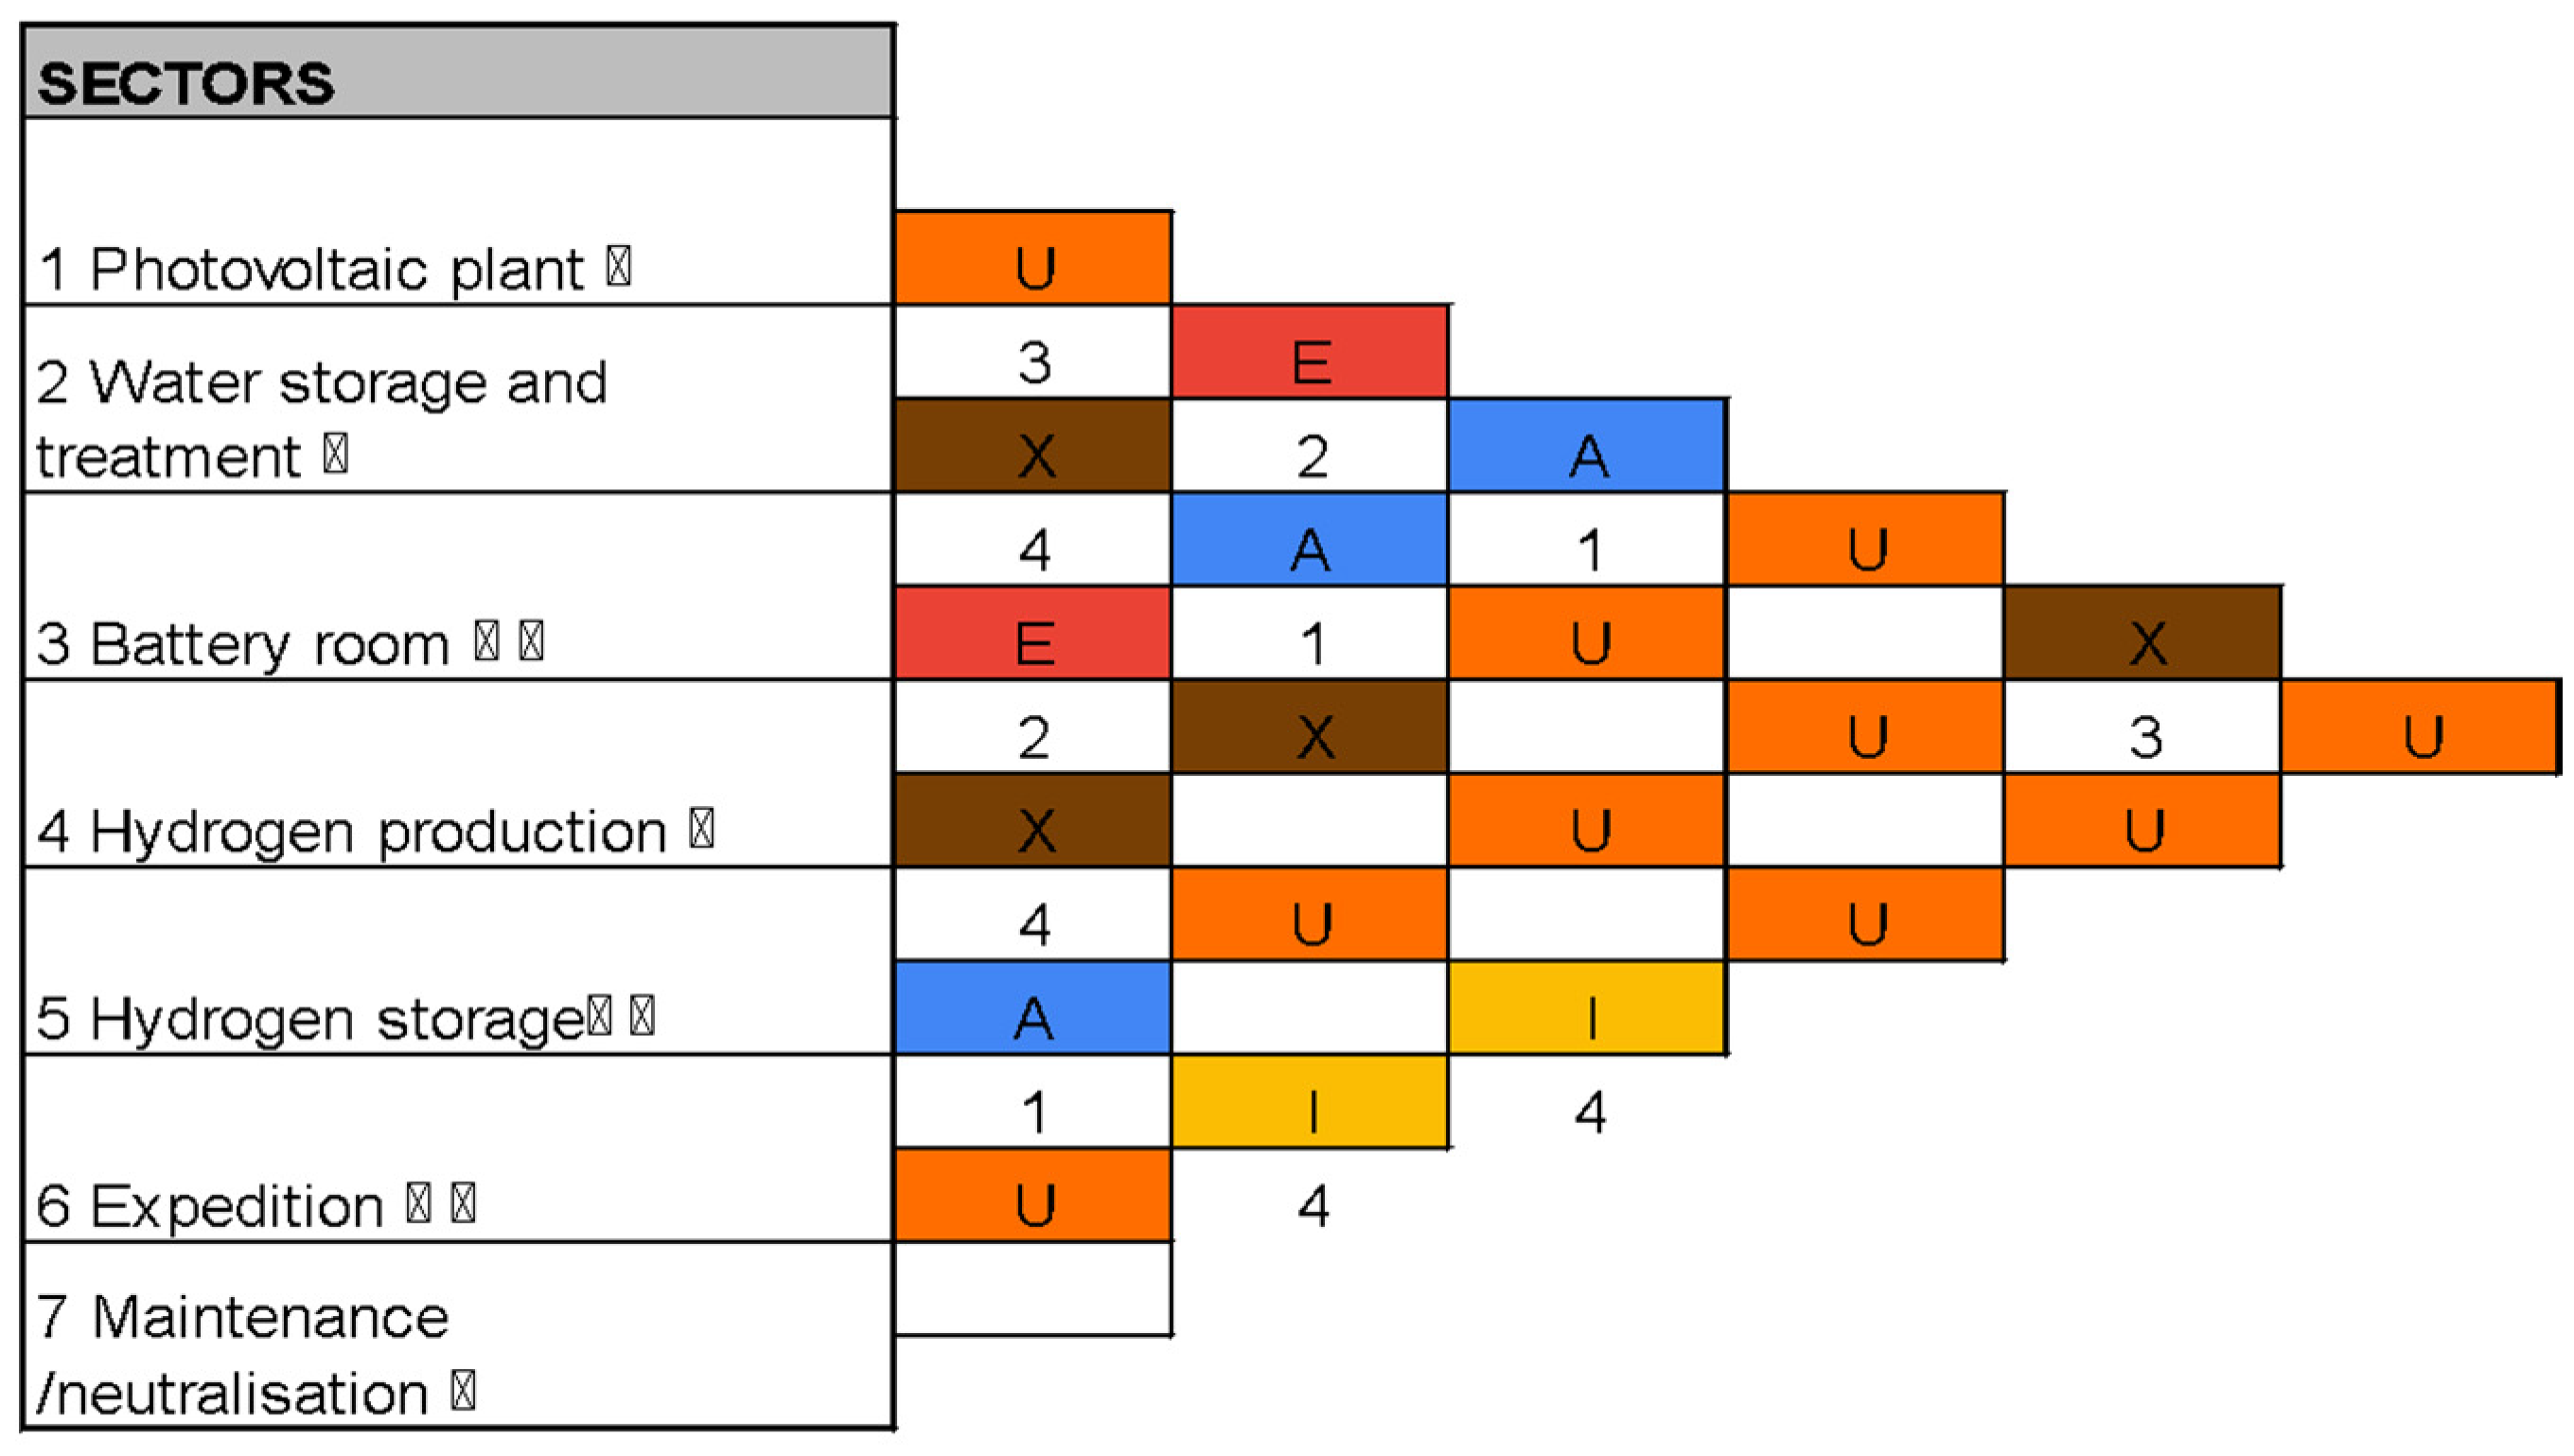
| Colour | Code | Proximity | Code | Reason |
|---|---|---|---|---|
| A | Absolutely necessary | 1 | Direct movement of materials/product | |
| E | Especially necessary | 2 | Indirect movement of materials/product | |
| I | Important | 3 | No movement of material/product | |
| O | Not very important | 4 | Accident risk/safety standard | |
| U | Unimportant | |||
| X | Undesirable | |||
| Sectors | Equipment | Amount (n) | Width (m) | Length (m) | Free Edges (n) | Sp (m2) | So (m2) | Sc (m2) | St by Station (Sp + So + Sc) | ST (St × n) (m2) | Total Area (m2) |
|---|---|---|---|---|---|---|---|---|---|---|---|
| Battery room | Batteries | 450 | 2.2 | 1.1 | 4 | 2.42 | 4.84 | 2.5 | 9.76 | 4392 | 4392 |
| Water treatment | Purifier | 1 | 2.5 | 1.1 | 4 | 2.75 | 5.5 | 0 | 8.25 | 8.25 | 101 |
| Tanks | 3 | 3.2 | 3.2 | 3 | 10.24 | 20.48 | 0 | 30.72 | 92.16 | ||
| H2 production | Electrolyser | 8 | 8 | 35 | 4 | 280 | 172 | 0 | 452 | 3616 | 3616 |
| H2 storage | Compressor | 23 | 4 | 2.85 | 4 | 11.40 | 22.8 | 0 | 34.20 | 786.6 | 1930 |
| Cylinders | 7200 | 0.23 | 0.23 | 1 | 0.05 | 0.05 | 0.0529 | 0.16 | 1142.64 | ||
| Maintenance | Cylinders | 48 | 0.23 | 0.23 | 1 | 0.05 | 0.05 | 0 | 0.16 | 7.62 | 8 |
| Expedition | Supply area | 8 | 3 | 15 | 3 | 45 | 57 | 3 | 105 | 840 | 840 |
| Total | 10,886 | ||||||||||
| Categories | |||||||||
|---|---|---|---|---|---|---|---|---|---|
| Risk | Cause | Consequence | Frequency | Severity | Risk Level | Mitigation Measures | |||
| Chemical | Potential leak of hydrogen gas, a highly flammable and reactive element | Asphyxia, explosion, and fire | D | IV | 5 | 1: Install appropriately sized exhaust fans to quickly remove hazardous gases. 2: Install specific sensors with visual and audible alarms to detect leaks and allow for immediate response. 3: Equip the team with PPE. 4: Train the team in emergency procedures and conduct evacuation and response drills. | |||
| Physical | Physical risks due to prolonged exposure to machine noise | Stress, irritability, hearing loss | D | II | 3 | Use of PPE. | |||
| Biological | Lack of hygiene in restrooms and changing rooms | Possible infection due to accumulation of bacteria in the environments | D | II | 3 | Daily cleaning and ventilation of environments. | |||
| Ergonomic | Repetitive movements and improper postures | Repetitive strain injuries due to repetitive movements and tingling in lower limbs | C | II | 2 | Take breaks and perform work gymnastics. | |||
| Mechanical | Mechanical risks related to handling and maintenance of machines | Injury of moderate and high severity | D | IV | 5 | Allow handling only by workers qualified for the task, giving their full attention and use of PPE. | |||
| Convention: | |||||||||
| Frequency | Colour | Severity | Risk Level | ||||||
| A—Very Unlikely | 5 | I—Negligible | 1—Negligible | ||||||
| B—Unlikely | 4 | II—Marginal | 2—Minor | ||||||
| C—Occasional | 3 | III—Critical | 3—Moderate | ||||||
| D—Likely | 2 | IV—Catastrophic | 4—Serious | ||||||
| E—Frequent | 1 | 5—Critical | |||||||
Disclaimer/Publisher’s Note: The statements, opinions and data contained in all publications are solely those of the individual author(s) and contributor(s) and not of MDPI and/or the editor(s). MDPI and/or the editor(s) disclaim responsibility for any injury to people or property resulting from any ideas, methods, instructions or products referred to in the content. |
© 2025 by the authors. Licensee MDPI, Basel, Switzerland. This article is an open access article distributed under the terms and conditions of the Creative Commons Attribution (CC BY) license (https://creativecommons.org/licenses/by/4.0/).
Share and Cite
Rodrigues Vaz, C.; Battisti Leite, E.; Uriona Maldonado, M.; Herrera, M.M.; Zapata, S. Design and Layout Planning of a Green Hydrogen Production Facility. Sustainability 2025, 17, 4498. https://doi.org/10.3390/su17104498
Rodrigues Vaz C, Battisti Leite E, Uriona Maldonado M, Herrera MM, Zapata S. Design and Layout Planning of a Green Hydrogen Production Facility. Sustainability. 2025; 17(10):4498. https://doi.org/10.3390/su17104498
Chicago/Turabian StyleRodrigues Vaz, Caroline, Eduardo Battisti Leite, Mauricio Uriona Maldonado, Milton M. Herrera, and Sebastian Zapata. 2025. "Design and Layout Planning of a Green Hydrogen Production Facility" Sustainability 17, no. 10: 4498. https://doi.org/10.3390/su17104498
APA StyleRodrigues Vaz, C., Battisti Leite, E., Uriona Maldonado, M., Herrera, M. M., & Zapata, S. (2025). Design and Layout Planning of a Green Hydrogen Production Facility. Sustainability, 17(10), 4498. https://doi.org/10.3390/su17104498