Article

Optimizing Crop Structure to Alleviate Groundwater Pressure Under Climate Change—A Case Study of the North China Plain

1
School of Civil Engineering & State Key Laboratory of Hydraulic Engineering Intelligent Construction and Operation, Tianjin University, Tianjin 300350, China
2
School of Civil Engineering, Tianjin University, Tianjin 300350, China
3
Tianjin Eco-Environmental Monitoring Center, Tianjin 300191, China
4
Amhara Design and Supervision Works Enterprise, Bahirdar P.O. Box 1921, Ethiopia
*
Author to whom correspondence should be addressed.
These authors contributed equally to this work.
Sustainability 2025, 17(10), 4484; https://doi.org/10.3390/su17104484
Submission received: 8 April 2025 / Revised: 24 April 2025 / Accepted: 29 April 2025 / Published: 14 May 2025

Abstract

:
Agricultural production faces significant uncertainty due to climate change, complicating groundwater issues in the North China Plain. This study introduces the groundwater footprint concept to alleviate groundwater pressure through an optimized crop structure amid climate change. By forecasting groundwater recharge, crop water demand, and food demand, a multi-objective optimization model based on groundwater footprint constraints is developed. This thesis analyzes the groundwater pressure from irrigation with historical and optimized crop structures. The findings indicate that under the historical crop structure, irrigation during dry years causes severe stress on the groundwater system as a whole, and extreme stress on 40.87% of the area; during normal years, it results in severe stress overall and extreme stress on 39.02% of the area. With the optimized crop structure, irrigation during dry years only mildly stresses the groundwater system, reducing groundwater consumption by 66.04%; during normal years, it causes light stress, reducing consumption by 50.79%. Optimizing agricultural production’s crop types and spatial layout aids in addressing climate change challenges and alleviating groundwater pressure in the North China Plain.

1. Background

Agricultural irrigation is the primary factor driving groundwater over-extraction in the North China Plain [1], causing significant stress on the groundwater resources. Under the conditions of climate change, key agricultural factors such as the water supply [2], crop productivity [3], and food demand [4] are expected to undergo substantial changes, further complicating the groundwater issues in the region. A systematic approach is urgently needed to alleviate the groundwater resource pressure in the North China Plain while balancing water utilization, food security, and economic benefits. Optimizing the crop planting structure by integrating water resource utilization, food security, and economic efficiency offers a viable solution [5].
Extensive studies have demonstrated that crop structure optimization can meet diverse agricultural development demands. Galan-Martin et al. optimized the allocation of irrigated and rainfed cropland, enhancing the food supply while reducing the agriculture’s environmental impact [6]. Chen et al. adjusted the planting areas of rice, maize, and soybeans to balance the economic benefits and environmental pollution mitigation under climate change [7]. Wang et al. combined an optimized crop structure with improved field techniques, achieving significant progress in the crop yield and environmental quality [8]. Despite differences in perspective, the approach remains consistent—optimizing planting structure.
Traditional crop structure optimization models typically treat agricultural water use as a single unit. Some scholars have refined this by distinguishing blue water, green water, and grey water to enable more detailed analyses of water resource utilization. For instance, Zhang Lili et al. evaluated water resources from the perspective of the water footprint and analyzed the temporal and spatial changes in water resource security in the Hotan area [9], which provided great help for water resource security decision-making. Yang Jun et al. investigated the spatial evolution characteristics and driving factors of the water footprints of major crops in the Sichuan Basin, China [10]. Huang Li et al. calculated the water footprint and water consumption of major food crops in five Central Asian countries from 1992 to 2017 and predicted the indicators for 2042 [11]. This study propelled the development of the water footprint from static analysis to dynamic prediction. Scholars like Ping G. et al. refined the water footprint theories and quantification methods by calculating blue, green, and grey water footprints across irrigation districts, constructing a multi-objective optimization model for planting structures under water footprint constraints [12]. Their work introduced an integrated framework combining multi-objective water allocation and decision evaluation models, enhancing the methodologies for optimizing planting structures under quantified water footprint constraints.
However, the existing water footprint studies inadequately assess groundwater utilization in agricultural irrigation. At present, the pressure on the groundwater resources in the Huang Huai Hai region is becoming increasingly severe. It has become increasingly important to incorporate groundwater factors into the optimization systems of planting structures. In 2012, Gleeson and other scholars proposed the concept of the groundwater footprint (GWF), which quantifies the impact of groundwater extraction on ecosystems and sustainability [13]. This is the first tool suitable for continuously evaluating the use, renewal, and ecosystem requirements of groundwater at the scale of aquifers, meaning the areas required to maintain groundwater use and the ecosystem services dependent on groundwater. Kumar et al. discussed groundwater vulnerability analysis in different methods [14]. Goyal et al. presented the DRASTIC index (groundwater depth, net recharge, aquifer properties, soil properties, topography, seepage zone influence, and hydraulic conductivity) and compared numerical methods and index-based methods, discussing their advantages and disadvantages [15]. They all focus on groundwater vulnerability. Despite its significance, the current GWF research faces critical limitations: (1) reliance on static threshold analyses without dynamic coupling with high-resolution remote sensing data, and (2) insufficient integration into multi-objective optimization models to support policy simulations under complex scenarios.
To address these gaps, this study develops a water–food–economy synergy optimization model that incorporates GWF and climate change projections. This study introduces the concept of the “groundwater footprint” into the field of agricultural water resource management, and introduces a new indicator that can quantitatively evaluate the demand for groundwater resources, improving the quantitative evaluation system for agricultural irrigation groundwater utilization. Constructing a multi-objective crop structure optimization model of “water–grain–economy”, while taking into account future climate change factors, provides a reference for addressing the climate change challenges and alleviating the groundwater pressure in the region. This has met the demand for relieving the groundwater pressure in the North China Plain and provided ideas for relieving groundwater pressure in other regions of the world, especially in arid areas. Evaluating the pressure on groundwater systems under climate change scenarios has strong typicality and generalizability, and aims to provide scientifically reliable and actionable decision support for the management of the overexploitation of groundwater.

2. Methodology and Data

2.1. Research Framework

The research framework is illustrated in Figure 1, with the objective of alleviating the groundwater resource pressure in the North China Plain under climate change through crop structure optimization. The specific steps are as follows: (1) Forecasting the crop water demand, precipitation infiltration, and food demand in the study area under climate change scenarios. (2) Introducing groundwater footprint constraints to develop a multi-objective crop structure optimization model. The optimized crop structure is determined, while the historical crop structure is established based on the existing data. (3) Evaluating the stress on the groundwater system under climate change conditions by comparing the irrigation impacts using the historical crop structure and the optimized crop structure from a groundwater footprint perspective. (4) Assessing the alleviation effects of crop structure optimization on the groundwater pressure from the perspectives of crop composition and spatial layout.

2.2. Study Area and Data Sources

The North China Plain lies between 112°11′–120°19′ E longitude and 40°27′–32°8′ N latitude, spanning seven provinces and municipalities: Beijing, Tianjin, Hebei, Shandong, Henan, Anhui, and Jiangsu. It accounts for 13.7% of China’s arable land, 5.9% of its orchard land, and 2.8% of the country’s water resources, serving as a critical agricultural production base. Due to the long-term dependence on pumping fresh groundwater for irrigation, the overdraft in the North China Plain is also serious. In the northeast region of China, due to the large proportion of rice planting areas and high irrigation quota, the long-term and large-scale extraction of groundwater for irrigation has caused a serious shortage of groundwater resources. Due to the unique climate and soil conditions in the Northeast Plain, the sustainable development of water resources should prioritize optimizing the irrigation methods and improving the water use efficiency. In the North China Plain, the planting structures should be optimized according to the local conditions to ensure the sustainable development of groundwater.
The study area is divided into 46 subregions based on the administrative boundaries of the provincial-level municipalities and prefecture-level cities. Fourteen representative crops, covering over 90% of the cultivated area, are selected, including staple grains (rice, wheat, maize, soybeans), oilseeds (peanuts), cotton, vegetables (Chinese cabbage, cucumbers, tomatoes, snap beans, radishes), and fruits (apples, pears, peaches). Chinese cabbage, cucumbers, and snap beans are considered as both spring and autumn crops.
Historical meteorological data are obtained from the China Regional Ground Meteorological Dataset, the China Near-Surface Daily Temperature Dataset, and NASA CERES Data Products, while the future climate projections are sourced from 14 climate models under the CMIP6, a global climate modeling framework coordinated by the World Climate Research Programme (WCRP). The groundwater depth data are derived from the China Geological Environment Monitoring Groundwater Level Yearbook. The soil data come from the Harmonized World Soil Database (HWSD) and the Second National Soil Survey. The historical land use data are provided by GlobeLand30, while the future projections are based on the research of Chen et al. [16]. Digital elevation data are sourced from the Shuttle Radar Topography Mission (SRTM). Crop growth cycle data are gathered from the agricultural guidelines issued by regional agricultural authorities and the study of Yang et al. [17]. The crop coefficients are adopted from the Food and Agriculture Organization’s Irrigation and Drainage Paper No. 56 (FAO56) and the work of Aiwan Duan et al. [18]. Data on the arable and orchard areas are obtained from the Third National Land Survey. The irrigation water source data are extracted from the Third National Agricultural Census. Crop demand and caloric data are sourced from the Food and Agriculture Organization Corporate Statistical Database (FAOSTAT). Crop economic data are obtained from the Compilation of National Agricultural Product Costs and Returns. The historical crop yield data come from the China Agricultural Yearbook, while the future yield projections are taken from FOFA 2050 Country Data. Historical GDP and population data are retrieved from World Bank Open Data, and the future GDP and population data are sourced from the SSP Database.

2.3. Groundwater Footprint

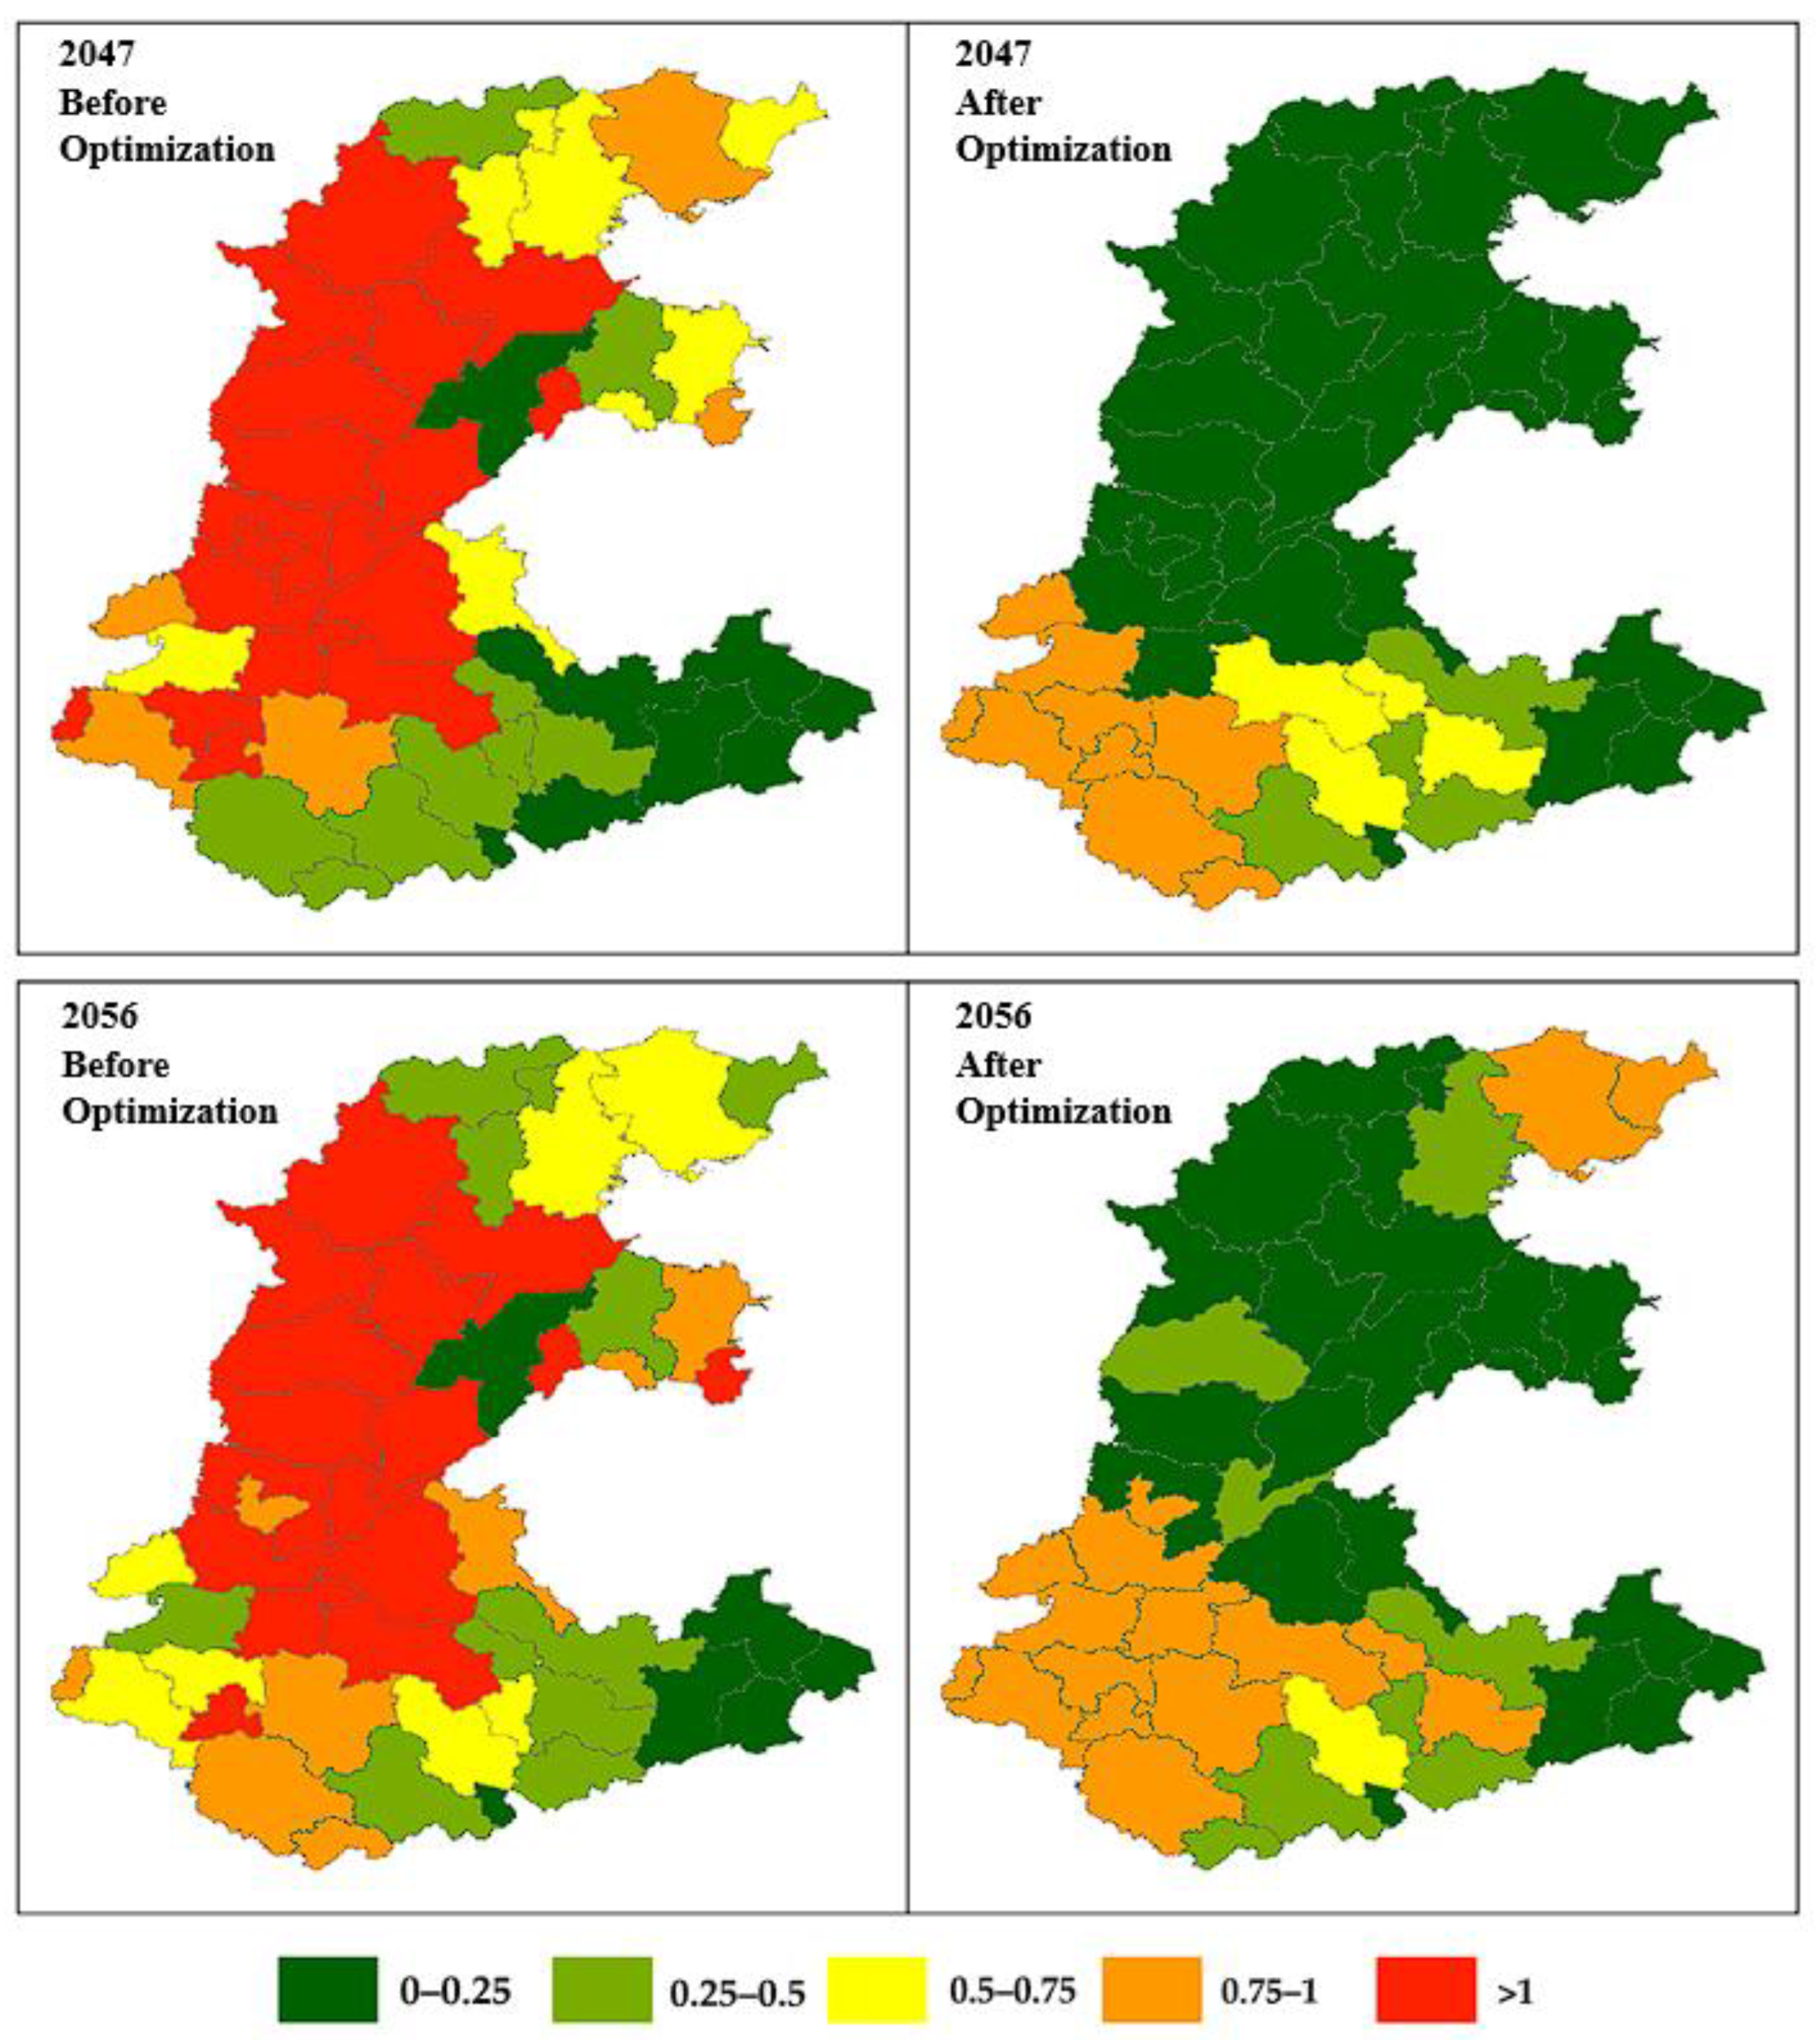
The groundwater footprint (GF) refers to the area required to sustain groundwater use and groundwater-dependent ecosystem services, essentially representing the balance between aquifer inflows and outflows. This research adopts the ratio of the groundwater footprint to the aquifer area (GF/A) as an evaluation index to assess the impacts of different crop structures on groundwater depletion under climate change scenarios in the North China Plain. The calculation follows the following formula:
G F A = C R E
where GF: groundwater footprint (km2); A: aquifer area (km2); C: groundwater consumption (m3/year); R: groundwater recharge (m3/year); and E: groundwater contribution to environmental flow (m3/year).
The research adopts Esnault et al.’s formula for calculating specific crop groundwater footprints [19], applying a method that allocates no groundwater for the environmental flow [1] to estimate the agricultural groundwater footprint in each subregion of the study area, as per the following equation:
G F m = n = 1 17 C I m , n S I m , n p m R m η m
In the equation, subscript m denotes the region number corresponding to each of the 46 regions; subscript n denotes the crop number corresponding to each of the 17 crops; GFm refers to the groundwater footprint of each subregion; CIm,n (m3/year) denotes the irrigation water demand for different crops in each subregion; SIm,n (km2) signifies the irrigation area for different crops in each subregion; pm indicates the proportion of the groundwater used for irrigation within each subregion; Rm refers to the groundwater recharge of each subregion; and ηm represents the effective irrigation water utilization coefficient in each subregion.
The CropWat and WetSpass models provide CIm,n and Rm, respectively. SIm,n is determined by the 2016 irrigated areas of each crop in the North China Plain and the areas resulting from the multi-objective optimization model to respond to the climate change challenges. The proportion pm is identified by Third National Agricultural Census data. According to the “Technical Standards for Water-Saving Irrigation Projects”, ηm is set at 0.8 for the groundwater irrigation districts.

2.4. Parameter Forecasting Under Climate Change Context

2.4.1. Future Climate Data Correction

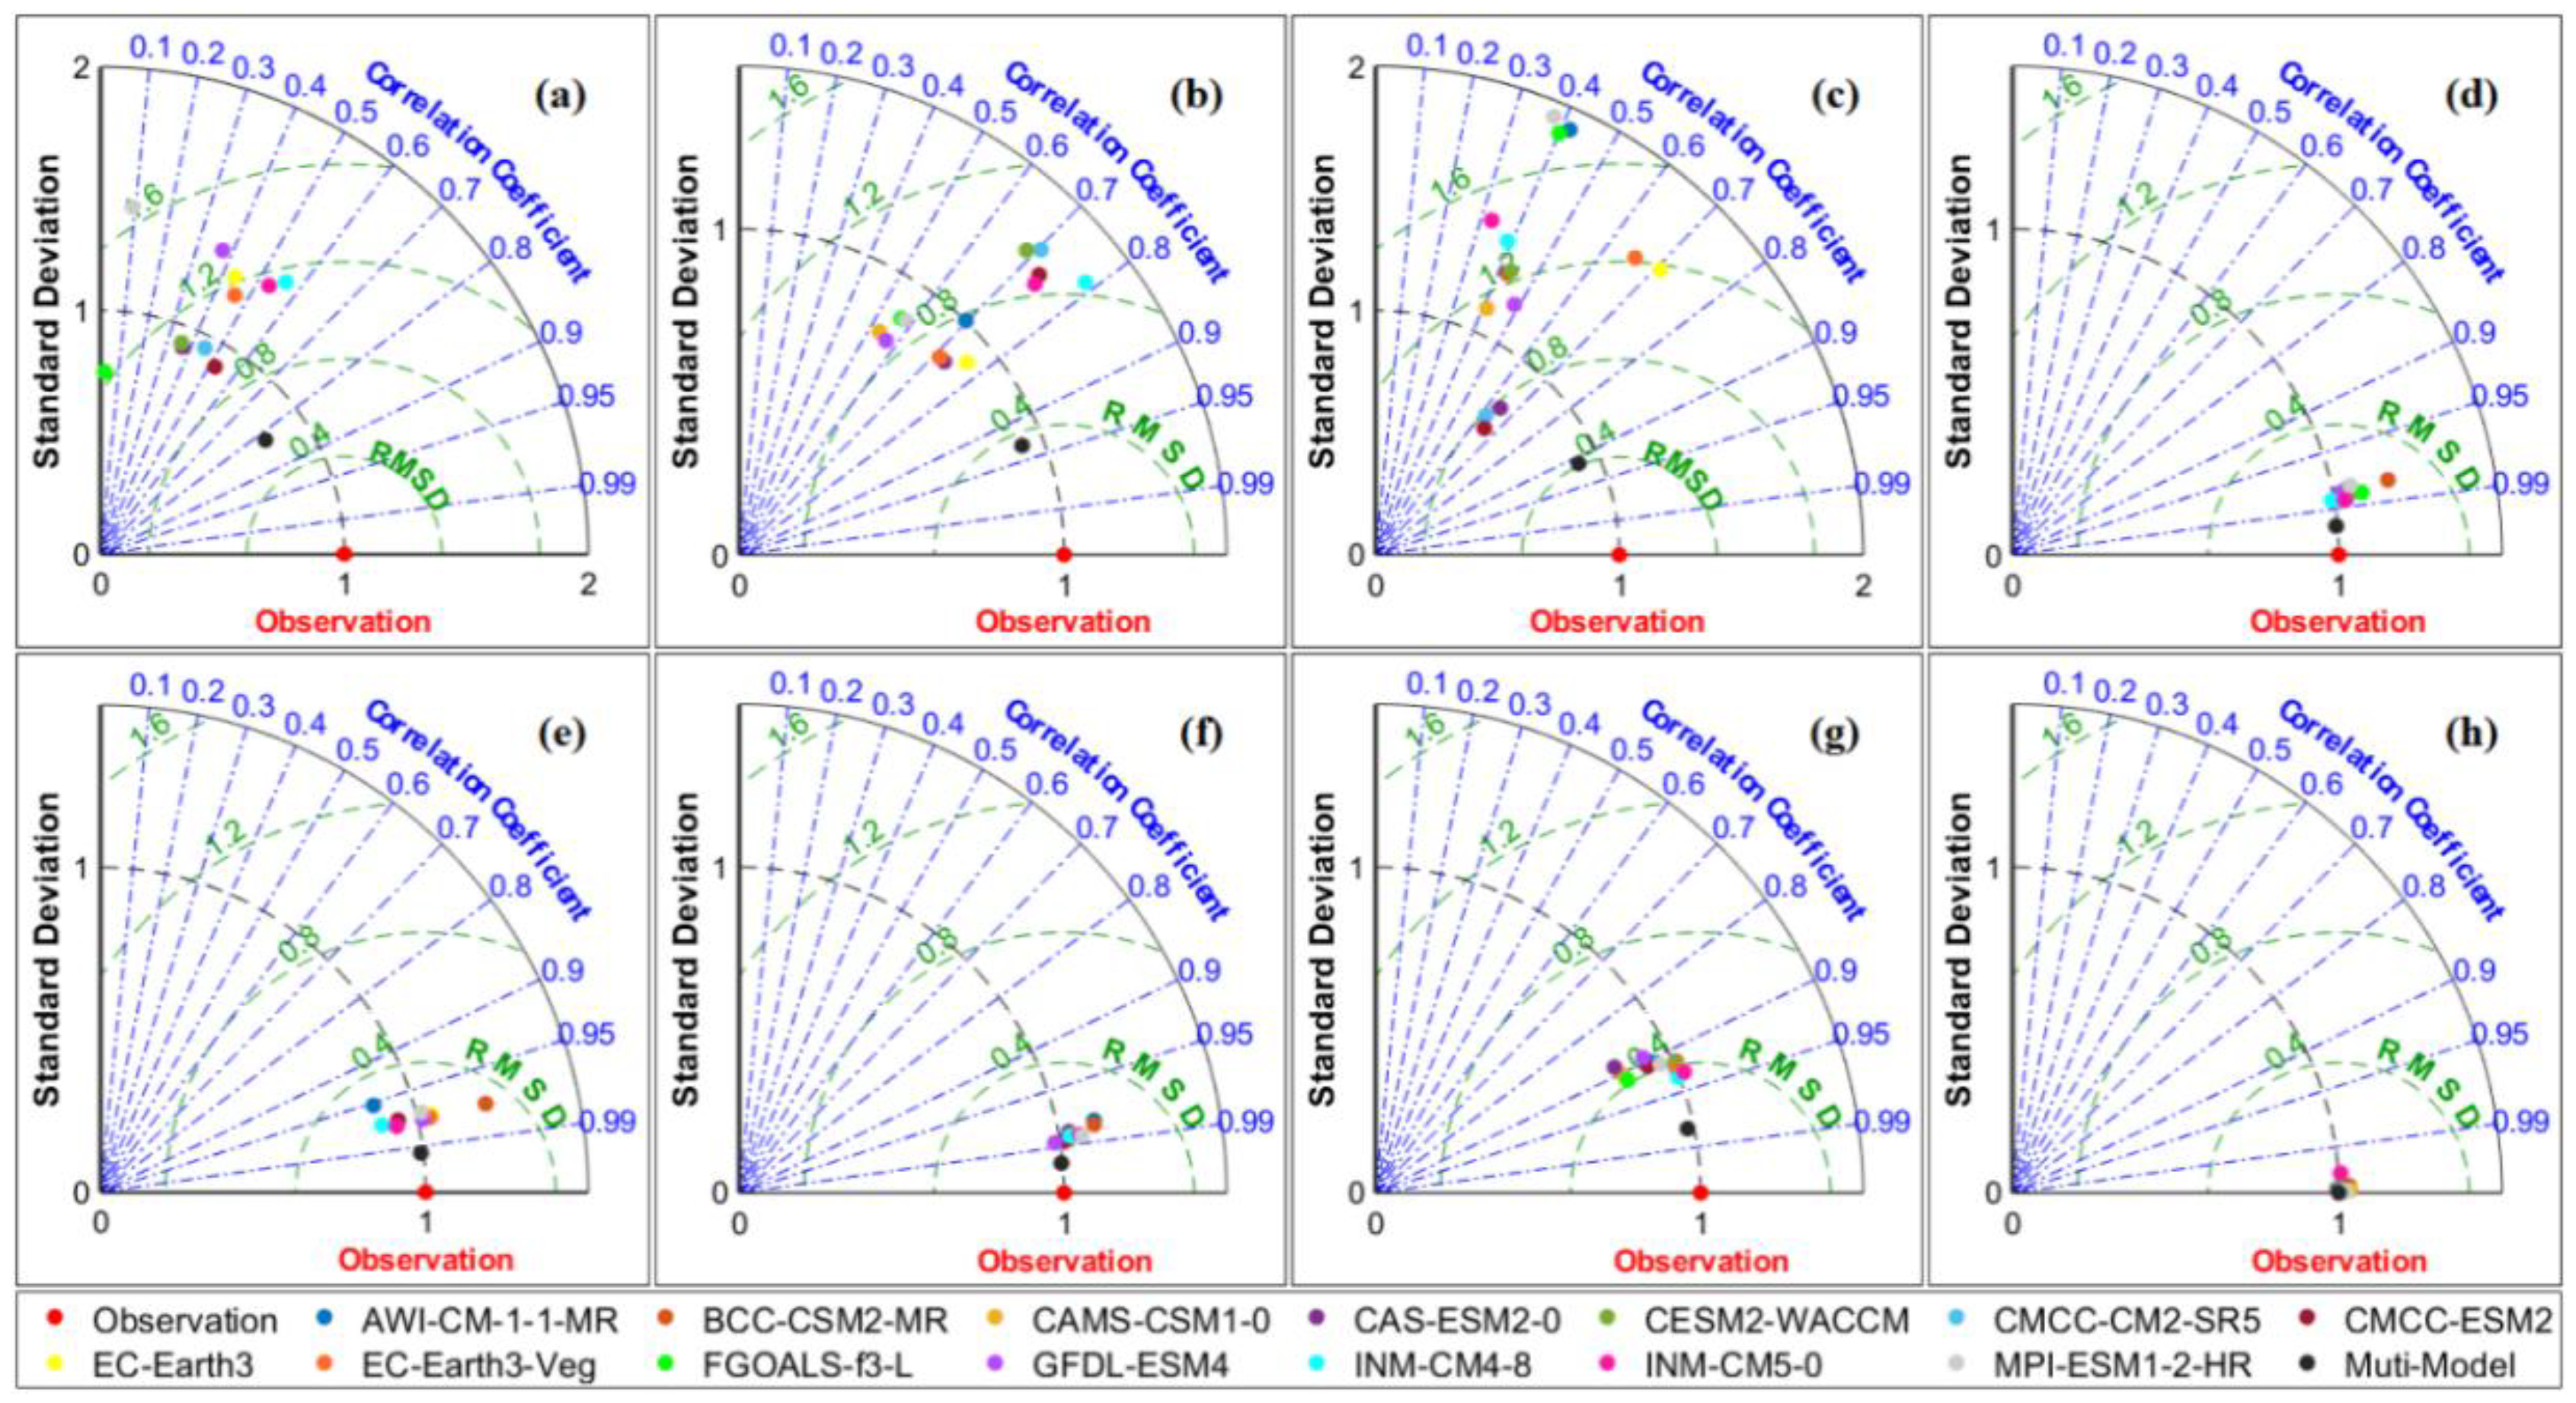
The Coupled Model Intercomparison Project Phase 6 (CMIP6) is a global climate modeling framework coordinated by the World Climate Research Programme (WCRP). It provides a standardized set of climate simulations produced by multiple international modeling centers to project future climates under various greenhouse gas concentration scenarios.
The climate data for the future stem from the CMIP6 model simulations under the SSP3-7.0 scenario, including those from AWI-CM-1-1-MR, BCC-CSM2-MR, CAMS-CSM1-0, CAS-ESM2-0, CESM2-WACCM, CMCC-CM2-SR5, CMCC-ESM2, EC-Earth3, EC-Earth3-Veg, FGOALS-f3-L, GFDL-ESM4, INM-CM4-8, INM-CM5-0, MPI-ESM1-2-HR, and others, totaling 14 models. The data are bilinearly interpolated to 0.1° × 0.1° and corrected using the Mean Drift Correction (MDC) and Multi-Model Ensemble Mean (MME) methods [20].

2.4.2. Crop Irrigation Water Demand Forecasting

The CropWat model, developed by the Food and Agriculture Organization (FAO) in 1992 as a decision-support tool, is used for estimating the crop irrigation water demand. It calculates the reference crop evapotranspiration, crop water demand, and crop irrigation water demand.

2.4.3. Groundwater Recharge Projection

The WetSpass model is applied to estimate the precipitation infiltration recharge. WetSpass is a spatial water balance model designed to calculate the long-term average groundwater recharge based on land cover, soil texture, topography, and hydrometeorological parameters. The model uses a grid-based structure as its fundamental calculation unit. The water balance of an individual grid is computed as the sum of the independent water balances across the vegetated areas, bare land, open water, and impermeable surfaces within the grid. The total water balance for the study area is derived from the aggregation of the water balances across all grid cells [21,22].

2.4.4. Grain Demand Projection

Relevant studies indicate a correlation between a country’s per capita caloric food demand and its per capita GDP. This correlation provides a feasible approach for projecting future grain demand [23]. This study establishes a model based on the historical relationship between GDP and grain demand. The future grain demand is then projected using the GDP and population data under the SSP3 scenario, provided by the SSP Database [24].

2.5. Multi-Objective Crop Structure Optimization Model

The optimization model focuses on integrated water, food, and economic benefits. The objective functions include maximizing the crop economic benefits and minimizing the total irrigation water demand. The constraints encompass the groundwater footprint limits, food security, agricultural land area, crop category planting proportions, yield proportions within the crop categories, and non-negativity conditions. The evaluation metrics for the optimization schemes are the crop economic benefits and total irrigation water demand. The multi-objective crop structure optimization model is solved using the built-in multi-objective genetic algorithm function (gamultiobj) in Matlab [25]. The coupled entropy-weighted TOPSIS evaluation method is employed to compare and rank the optimization schemes [26].

2.5.1. Objective Functions

Maximizing Crop Economic Benefits: The crop economic benefits are assessed based on the crop production values. These values are derived using the producer prices of various crops and the cultivated areas and yields under both irrigated and rainfed conditions within the study area.
F 1 = m = 1 46 n = 1 17 P n S I m , n Y I n + S R m , n Y R n ( 1 + I R ) t
where subscript m refers to the region number corresponding to each of the 46 regions; subscript n denotes the crop number corresponding to each of the 17 crops; Pn represents the producer prices of different crops in 2020; SRm,n indicates the rainfed areas of different crops in each subregion; YIn and YRn represent the unit area yields under irrigated and rainfed conditions, respectively; IR is the inflation rate, taken as the annual average growth rate of the national agricultural product producer price index from 1978 to 2019; and t denotes the time interval between 2020 and the research year.
Minimizing Total Irrigation Water Demand: The total irrigation water demand for the study area is calculated based on the irrigation water demand and the irrigated areas for different crops.
F 2 = m = 1 46 n = 1 17 C I m , n S I m , n

2.5.2. Constraints

Groundwater footprint constraint: The ratio of the groundwater footprint to the area in each subregion must be less than 1 to ensure that irrigation does not result in groundwater depletion.
G F m A m < 1
Food security constraint: The caloric content provided by the grain produced in the study area must meet a proportion higher than the historical level relative to the national grain caloric demand for that year to ensure food security.
m = 1 46 n = 1 4 C a l n S I m , n Y I n + S R m , n Y I n > k c a l D c a l
where Caln (kcal) denotes the caloric content provided by the unit weights of the various grain crops; kcal represents the ratio of the caloric output of grain in the study area in 2016 to the national caloric demand for grain; and Dcal signifies the national caloric demand for grain.
Constraint on agricultural land area: It is required that the sum of the planting areas for the grain, oilseeds, cotton, and vegetables in each region during any period does not exceed the arable land area, and the planting area for fruits does not exceed the orchard area.
n = 1 14 x i , n S I m , n + S R m , n < S F
n = 15 17 S I m , n + S R m , n < S G
where subscript i denotes the period number, corresponding to six periods; xi,n is a binary variable, taking 1 if the growth period of crop n includes period I and otherwise taking 0; SF (km2) denotes the arable land area of each subregion; and SG (km2) represents the orchard area of each subregion.
Constraint on planting proportions of main crop categories: The planting proportions of the major crop categories in each subregion must remain below an upper limit, which is set as the highest planting proportion of the major crop categories within the study area in 2020.
n = 1 17 y j , n S I m , n + S R m , n n = 1 17 S I m , n + S R m , n < S k j
where subscript j represents the major crop category number, corresponding to five main categories: grain, oilseeds, cotton, vegetables, and fruits; yj,n is a binary variable, taking 1 if crop n belongs to the major crop category j and otherwise taking 0; and Skj denotes the maximum planting proportions of the different major crop categories in each subregion.
Constraint on yield within major crop categories: The total yield proportion of each crop within the study area to the total yield of that major crop category is fixed based on the proportions observed in the study area in 2020.
m = 1 46 S I m , n Y I n + S R m , n Y I n m = 1 46 n = a j b j S I m , n Y I n + S R m , n Y I n = Y k n
where “Ykn” represents the proportion of each crop yield within the research area to the total yield of that crop category.
Non-negativity constraint:
S I m , n > 0 ,   S R m , n > 0

3. Results and Analysis

3.1. Calibration and Validation

3.1.1. Results of Future Climate Data Calibration

Figure 2 displays the simulation capability of each model in a comprehensive Taylor diagram format, revealing that the post-calibration multi-model ensemble average shows improved consistency with the observational values. A hydrological frequency analysis of the calibrated precipitation data identifies 2047 (a dry year) and 2056 (a normal year) as study years.

3.1.2. Model Validation

The CropWat model simulated the crop water demand from 2015 to 2019 for Beijing and Baoding. The results were compared to the crop water demand values reported in previous studies [27,28]. The WetSpass model estimated the groundwater recharge for the study area in 2020, with the recharge values in the subregions compared to the groundwater resource data published in the 2020 regional water resource bulletins. The food demand projection model was used to estimate the per capita caloric demand from 1961 to 2020. These estimates were compared to the values from the FAOSTAT database. The correlation coefficient (R2), mean absolute error (MAE), root mean square error (RMSE), and normalized root mean square error (NRMSE) were used to assess the differences between the model-simulated and reference values, ensuring the precision of each model. The comparison results are presented in Table 1.

3.2. Projected Parameters Under Climate Change Scenarios

3.2.1. Projected Results of Crop Irrigation

Water Demand: Using the corrected meteorological data, crop coefficients, growth periods, and soil parameters, the CropWat model simulated the irrigation water demand for the different crops across the subregions of the North China Plain in 2047 and 2056. The results are shown in Figure 3.

3.2.2. Groundwater Recharge Projection Results

Using the corrected hydrometeorological, land cover, and soil texture data, the WetSpass model simulated the groundwater recharge in the North China Plain for 2047 and 2056. The results are presented in Figure 4.

3.2.3. Grain Demand Projection Results

Based on the population and GDP projections under the SSP3 scenario for China, as well as the relationship between the per capita GDP and the per capita caloric demand, the grain caloric demand was projected to be 20,375.5 trillion kilocalories in 2047 and 19,542.6 trillion kilocalories in 2056.

3.3. Historical and Optimized Crop Structures

The crop structure for 2016, derived from regional statistical yearbooks, served as the baseline (pre-optimization crop structure). By solving the model using the genetic algorithm and ranking solutions with the entropy-weighted TOPSIS method, the crop structure with the highest comprehensive score was identified as the optimized crop structure. In 2047, adopting the optimized crop structure reduced the study area’s irrigation water demand, total grain caloric output, and total crop production value by 59.18% and 1.71% and increased the production value by 31.60%, respectively. In 2056, the irrigation water demand and total grain caloric output decreased by 49.01% and 1.40%, while the total crop production value increased by 67.07%. These findings demonstrate that optimizing the crop structure effectively balances multiple objectives, alleviating groundwater stress while ensuring food security and enhancing the economic returns.
The crop structures across the subregions under different climate change adaptation strategies are shown in Figure 5. Using the Yellow River as a dividing line, the optimized crop structure indicates that the northern part of the study area primarily adopts a rainfed farming system, while the southern part relies predominantly on irrigated agriculture. In particular, during dry years, the northern region almost exclusively practices rainfed farming. In 2047 and 2056, the grain planting areas in the northern region accounted for 92.59% and 70.18% of the total planting area, respectively, while in the southern region, the grain planting areas comprised 43.08% and 45.40%, respectively. This spatial configuration results in the northern region achieving per-unit land economic returns that are 73.63% and 58.91% lower than those in the southern region. The significant economic disparity between the regions may drive agricultural producers to make non-cooperative decisions, such as overexploiting the groundwater to develop irrigated agriculture. To prevent this, the government should implement measures, such as increasing grain subsidies and minimum purchase prices, to compensate grain producers adequately.

3.4. Analysis of Groundwater Resource Pressure

3.4.1. Evaluation of Groundwater Stress Levels

The groundwater stress levels due to irrigation were assessed using the ratio of the groundwater footprint (GF) to the regional area (A), referred to as GF/A. This ratio is an important indicator of the sustainability of groundwater use, where a higher ratio indicates greater pressure on the groundwater resources. The stress levels were classified into five categories based on the established empirical research and theoretical frameworks on groundwater sustainability—minor stress: 0 < GF/A ≤ 0.25, low stress: 0.25 < GF/A ≤ 0.5, moderate stress: 0.5 < GF/A ≤ 0.75, high stress: 0.75 < GF/A ≤ 1, and severe stress: GF/A > 1. These categories are derived from the framework developed by Gleeson et al. (2012) [13], which examines the sustainability of groundwater use based on the balance between the groundwater extraction and aquifer recharge rates. The classification aligns with the general empirical findings in hydrology, which suggest that a GF/A ratio exceeding 1 represents a scenario where the extraction outpaces the natural recharge, leading to significant long-term depletion risks. Stress levels under 0.25 are considered minor, indicating minimal pressure on the groundwater resources. A ratio approaching or exceeding 0.5 generally signals a more concerning rate of extraction, where the groundwater sustainability is increasingly compromised. Ratios greater than 1 are considered severe, indicating unsustainable groundwater use that could lead to significant environmental and socio-economic consequences.
The stress status of the groundwater footprint (GF/A) before and after optimization in the study area for the years 2047 and 2056 is illustrated in Figure 6. In 2047, before optimization, the overall GF/A in the study area was 0.96; after optimization, it dropped to 0.24. In 2056, the pre-optimization GF/A was 0.88, which was reduced to 0.42 post-optimization. This outcome indicates that optimizing the crop structure substantially alleviates the groundwater stress, assisting in relieving the groundwater resource pressure in the study area. Before optimization in 2047, significant groundwater stress caused by irrigation affected 40.87% of the North China Plain, while in 2056, it impacted 39.02%. The over-extraction of groundwater is primarily concentrated in Hebei, Shandong, and Henan, regions currently serving as important agricultural production bases in China and identified as a “farmland water imbalance belt” [29]. These regions, with minimal potential for surface water development, primarily rely on excessive groundwater extraction for irrigation, necessitating a shift in the groundwater utilization methods. In the southern parts of the study area, most regions experienced increased groundwater stress post-optimization, suggesting that this area could justifiably increase groundwater use to take on more agricultural production tasks.

3.4.2. Impact of Crop Structure on Groundwater Resource Pressure

The groundwater consumption of the major crop categories under different climate change adaptation strategies is depicted in Figure 7. In 2047, before optimization, the percentages of groundwater consumption by the major crop categories relative to the total groundwater consumption were 79.68%, 1.37%, 3.27%, 10.78%, and 4.9%, respectively. After optimization, the percentages were 61.98%, 0%, 0%, 37.98%, and 0.04%, respectively. Post-optimization in 2047, the groundwater consumption by the major crop categories decreased by 73.58%, 100%, and 100%, increased by 19.63%, and decreased by 99.74%. In 2056, the pre-optimization percentages were 80.10%, 2.04%, 3.22%, 10.04%, and 4.60%, respectively, whereas post-optimization, they were 67.87%, 0%, 0%, 31.90%, and 0.24%, respectively. Post-optimization in 2056, the groundwater consumption the by major crop categories decreased by 58.31%, 100%, and 100%, increased by 56.28%, and decreased by 97.46%.
Grain remains the largest water-consuming sector for groundwater irrigation. However, by leveraging the spatial variations in the irrigation water demand and the production potential of rainfed grain farming, adjusting the spatial layout of grain cultivation and actively promoting rainfed systems can significantly reduce the groundwater consumption. In regions and years with relatively abundant water resources, increasing the water allocation for grain can decrease the total cultivated area, freeing up more land for high-value crops. Oilseeds and cotton, given their low economic returns per unit of water input, receive no irrigation allocation in the optimized scenario. Only a small amount of rainfed oilseed is cultivated during the dry years. This decision aligns with the current trend of declining oilseed and cotton cultivation areas in the North China Plain. While both vegetables and fruits generate high economic returns, the productivity of fruit trees is less affected by rainfed systems. Therefore, under the optimized layout, the fruits rely primarily on rainfed cultivation, leading to a significant reduction in groundwater consumption, whereas the groundwater consumption for the vegetables increases slightly.

3.4.3. Impact of Spatial Layout on Groundwater Resource Pressure

The groundwater consumption in the northern and southern parts of the study area under different climate change adaptation strategies is illustrated in Figure 8. By 2047, the post-optimization groundwater consumption decreases by 96.97% in the northern region and 24.19% in the southern region. In 2056, the groundwater consumption is reduced by 70.07% in the northern region and 30.37% in the southern region. These results indicate substantial room for optimization in both regions. The natural conditions in the northern part are less favorable for irrigated agriculture. The optimization model suggests a rainfed approach in dry years, while the irrigation is moderately expanded in normal years. This strategy significantly reduces the groundwater consumption caused by irrigation. Additionally, with grain as the dominant crop in the northern region, the pressure on grain production in the southern region is alleviated, effectively mitigating the groundwater resource stress in the southern region [30,31].

4. Conclusions

The study explores the groundwater resource pressure caused by irrigation under different crop structure scenarios in the North China Plain in the context of climate change. It provides a reference for addressing climate change challenges and alleviating groundwater stress in the region. Compared with traditional studies, this thesis introduces the concept of the groundwater footprint into a multi-objective crop structure optimization model. This ensures that irrigation does not impose severe stress on the groundwater system, meeting the needs of the North China Plain for groundwater stress mitigation while offering a practical approach for similar regions.
The North China Plain is an important grain industry base in China. However, its surface freshwater resources are scarce, and cannot meet the demand for agricultural water. A long-term reliance on groundwater extraction for irrigation has led to the severe overexploitation of the groundwater and ecological imbalance [32]. Related studies have indicated that optimizing the allocation to rainfed and irrigated cropping areas is an effective measure to improve the groundwater resource utilization efficiency and reduce the GF of crop production in the irrigation areas [
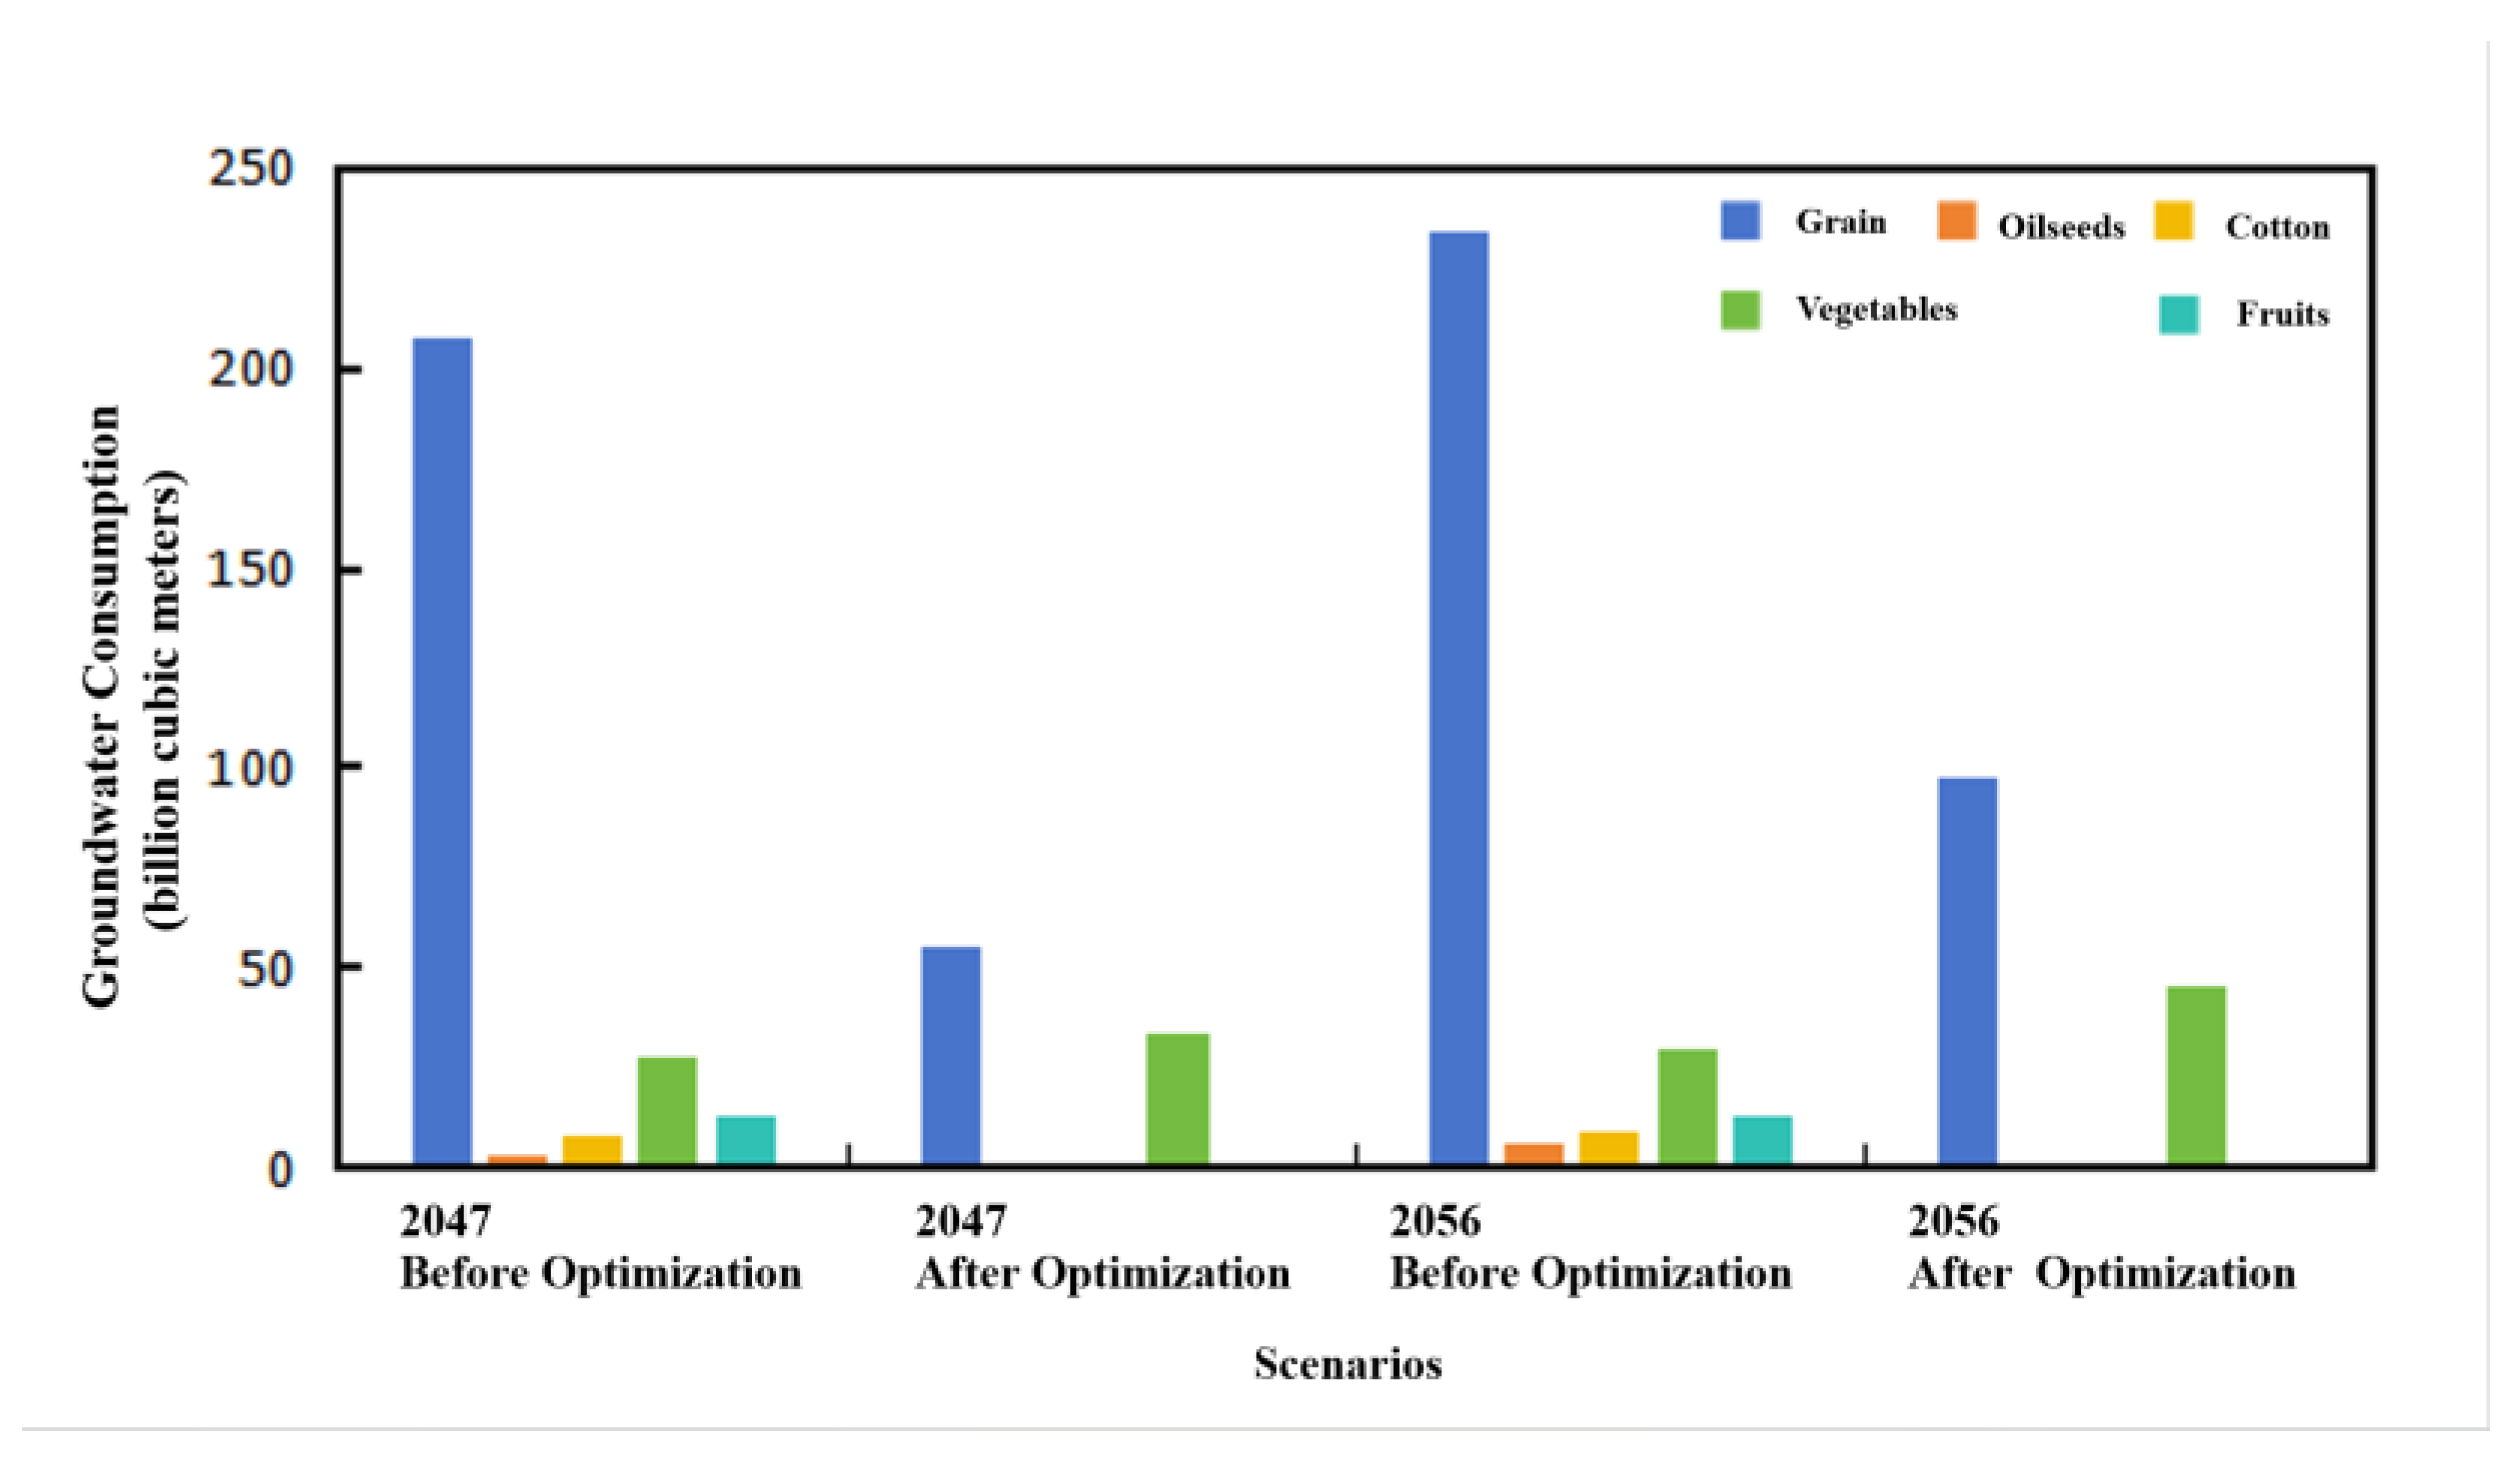
33]. This is consistent with the conclusion of this article. The research results indicate that under the historical crop structure in the North China Plain, irrigation during dry years imposes significant stress on the overall groundwater system, with 40.87% of the region experiencing severe stress. During normal years, irrigation causes considerable stress on the groundwater system, affecting 39.02% of the region with severe stress. When adopting an optimized crop structure, irrigation in dry years results in only minor stress on the groundwater system, reducing the groundwater consumption by 66.04%. In normal years, irrigation causes low stress on the groundwater system, with the groundwater consumption decreasing by 50.79%. Galan-Martin et al. present a novel systematic method for agricultural planning in Spain. The conclusion of that study is consistent with that of this study [6]. Previous studies have shown that under the basic premise of food crop yield, reducing the planting areas of wheat and corn and increasing cash crops can increase the economic income, ensure social equity, improve the irrigation water use efficiency, and reduce the negative environmental effects simultaneously, which is consistent with the conclusion of this study [
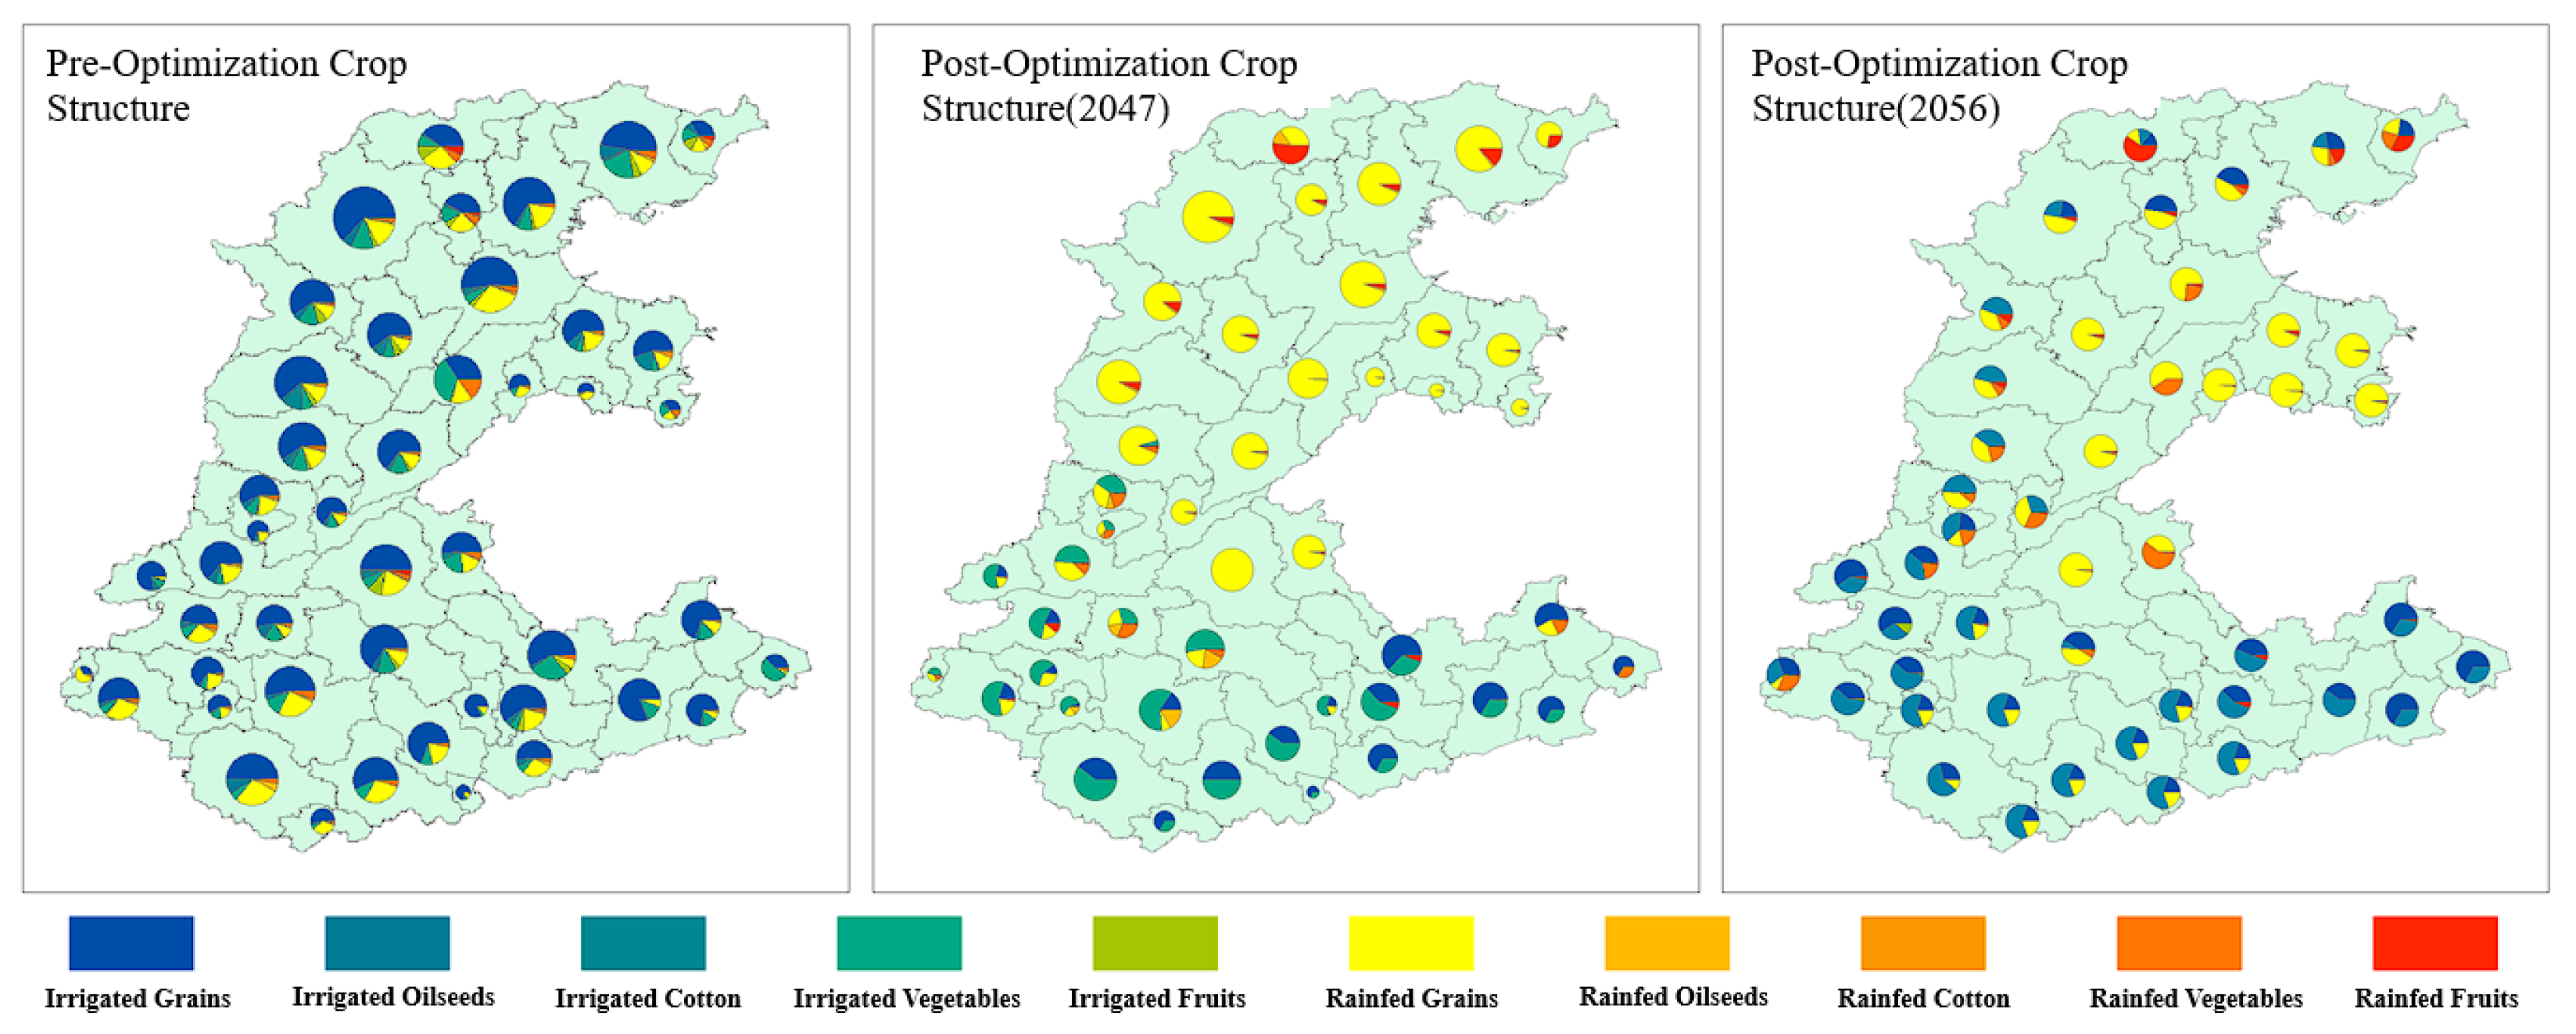
12]. Adjusting the crop structure and spatial layout through optimization can help the North China Plain address the challenges of climate change and alleviate groundwater resource stress. Based on the research findings, the following recommendations are proposed:
(1) Adjust Crop Variety Structure Ensuring food security is a top priority for national stability and livelihood. While reducing the irrigated area for grain, the total grain cultivation area can be expanded to increase the land resource investment, thereby reducing the groundwater consumption for grain production. Crops with low water-use efficiency, such as oilseeds and cotton, should have their cultivation areas reduced. In years and regions with abundant water resources, the irrigated area for vegetables can be moderately increased. Since rainfed farming has a minimal impact on the productivity of fruit trees, the widespread adoption of rainfed fruit tree cultivation should be promoted. Vigorously promoting rainfed planting can effectively reduce production costs. The crops mainly rely on natural precipitation, which can significantly reduce the irrigation water demand and save water and electricity costs, water pump and other tool costs, labor and other costs, and agricultural costs.
(2) Optimize Spatial Layout of Crops Based on the differences in the water and soil resource distributions in the North China Plain, implementing an appropriate irrigation ratio is an effective measure for alleviating the groundwater resource stress. The uneven distribution of precipitation resources in the North China Plain results in an increase in precipitation from north to south [34]. In the northern part of the region, the water resource investment for agricultural irrigation should be reduced, and rainfed cropping systems should be promoted. Efforts should focus on developing drought-resistant crop varieties and improving water retention, soil moisture preservation, and rainwater harvesting techniques. In the southern part of the region, the irrigation ratio can be increased to capitalize on the advantages of the abundant water resources fully. Due to the changes in the planting structure, farmers need to adapt to new crop planting techniques and re-establish stable sales channels and processing systems. Therefore, in the early stages of this transformation, there are significant market risks. Therefore, the government needs to provide training and subsidies to strengthen the sales management under the new model in order to reduce the market risks.
(3) Strengthen Policy Support and Subsidies Reducing groundwater consumption while ensuring food security may lower the economic benefits of farming, which significantly influences farmers’ decisions. To prevent farmers from resorting to non-cooperative decisions, such as over-extracting groundwater to maintain unsustainable irrigation practices, the government should increase the subsidies for grain cultivation and rainfed farming. Promoting mechanized and large-scale agricultural production will enhance efficiency and reduce costs, ensuring that the farmers’ individual economic interests are safeguarded while pursuing broader public benefits.

Author Contributions

Conceptualization, L.H. and X.S.; methodology, L.H.; software, P.L.; validation, B.Z.A.; formal analysis, P.L. and J.W.; data curation, P.L.; writing—original draft preparation, J.W.; writing—review and editing, J.W.; visualization, P.L.; supervision, L.H.; project administration, X.S. All authors have read and agreed to the published version of the manuscript.

Funding

This research was funded by [National Natural Science Foundation of China] grant number [52079088], [National Key R&D Program of China grant number [2020YFC1807904], [the CAS Interdisciplinary Innovation Team] grant number [JCTD-2019-04].

Institutional Review Board Statement

Not applicable.

Informed Consent Statement

Not applicable.

Data Availability Statement

The historical meteorological data are publicly available at https://cstr.cn/18406.11.AtmosphericPhysics.tpe.249369.file (accessed on 20 April 2021); https://doi.org/10.5281/zenodo.5502275; and https://ceres.larc.nasa.gov/data/. (accessed on 16 May 2023) The future climate projections and soil data are both publicly available at https://pcmdi.llnl.gov/CMIP6/ (accessed on 15 February 2022), and https://gaez.fao.org/pages/hwsd (accessed on 20 January 2023), respectively. The historical land use data are provided by GlobeLand30, while the future projections are based on the research of Chen (doi: 10.1038/s41597-022-01208-6).

Conflicts of Interest

Author Xinshuang Song was employed by the company Tianjin Eco-Environmental Monitoring Center. The remaining authors declare that the research was conducted in the absence of any commercial or financial relationships that could be construed as a potential conflict of interest.

References

  1. Tian, Y.; Zhang, G.; Wang, Q.; Yan, M.; Wang, W.; Wang, J. Groundwater Safeguard Capacity and Dependency Degree of Agricultural Irrigation on Groundwater in the Huang-Huai-Hai Plain. Acta Geogr. Sin. 2016, 37, 257–265. [Google Scholar] [CrossRef]
  2. Lu, S.; Bai, X.; Li, W.; Wang, N. Impacts of climate change on water resources and grain production. Technol. Forecast. Soc. Chang. 2019, 143, 76–84. [Google Scholar] [CrossRef]
  3. Jägermeyr, J.; Müller, C.; Ruane, A.C.; Elliott, J.; Balkovic, J.; Castillo, O.; Faye, B.; Foster, I.; Folberth, C.; Franke, J.A.; et al. Climate impacts on global agriculture emerge earlier in new generation of climate and crop models. Nat. Food 2021, 2, 873–885. [Google Scholar] [CrossRef] [PubMed]
  4. Sheng, Y.; Song, L. Agricultural production and food consumption in China: A long-term projection. China Econ. Rev. 2019, 53, 15–29. [Google Scholar] [CrossRef]
  5. Ma, Q.; Yang, Y.; Sheng, Z.; Han, S.; Yang, Y.; Moiwo, J.P. Hydro-economic model framework for achieving groundwater, food, and economy trade-offs by optimizing crop patterns. Water Res. 2022, 226, 119199. [Google Scholar] [CrossRef]
  6. Galán-Martín, Á.; Vaskan, P.; Antón, A.; Esteller, L.J.; Guillén-Gosálbez, G. Multi-objective optimization of rainfed and irrigated agricultural areas considering production and environmental criteria: A case study of wheat production in Spain. J. Clean. Prod. 2017, 140, 816–830. [Google Scholar] [CrossRef]
  7. Chen, Y.; Zhou, Y.; Fang, S.; Li, M.; Wang, Y.; Cao, K. Crop pattern optimization for the coordination between economy and environment considering hydrological uncertainty. Sci. Total Environ. 2022, 809, 151152. [Google Scholar] [CrossRef]
  8. Wang, Z.; Yin, Y.; Wang, Y.; Tian, X.; Ying, H.; Zhang, Q.; Xue, Y.; Oenema, O.; Li, S.; Zhou, F.; et al. Integrating crop redistribution and improved management towards meeting China' s food demand with lower environmental costs. Nat. Food 2022, 3, 1031–1039. [Google Scholar] [CrossRef]
  9. Zhang, L.; Deng, X.; Long, A.; Gao, H.; Ren, C.; Li, Z. Spatial-temporal assessment of water resource security based on the agricultural water footprint: A case in the Hotan Prefecture of Xinjiang. Arid Zone Res. 2022, 39, 436–447. [Google Scholar] [CrossRef]
  10. Yang, J.; Xiao, Z.; Xu, W. Analysis of spatiotemporal evolution and driving factors of crop water footprint in the Sichuan Basin based on LMDI model. Water Res. Prot. 2025, 41, 160–169. [Google Scholar] [CrossRef]
  11. Huang, L.; Wang, W. Water Footprint and Water Consumption Prediction of Food Crop Production in Five Central Asian Countries. Econ. Geogr. 2021, 41, 118–126. [Google Scholar] [CrossRef]
  12. Guo, P.; Zhao, M.; Zhang, Y.; Zhang, X.; Zhang, F. Optimization and evaluation of multi- objective planting structure in Hetao irrigation district based on water footprint. Trans. Chin. Soc. Agric. Mach. 2021, 52, 346–357. [Google Scholar] [CrossRef]
  13. Gleeson, T.; Wada, Y.; Bierkens, M.F.P.; Van Beek, L.P.H. Water balance of global aquifers revealed by groundwater footprint. Nature 2012, 488, 197–200. [Google Scholar] [CrossRef] [PubMed]
  14. Kumar, P.; Bansod, B.K.; Debnath, S.K.; Thakur, P.K.; Ghanshyam, C. Index- based groundwater vulnerability mapping models using hydrogeological settings: A critical evaluation. Environ. Impact Assess. Rev. 2015, 51, 38–49. [Google Scholar] [CrossRef]
  15. Goyal, D.; Haritash, A.; Singh, S. A comprehensive review of groundwater vulnerability assessment using index-based, modelling, and coupling methods. J. Environ. Manag. 2021, 296, 113161. [Google Scholar] [CrossRef]
  16. Chen, G.; Li, X.; Liu, X. Global land projection based on plant functional types with a 1-km resolution under socio-climatic scenarios. Sci. Data 2022, 9, 125. [Google Scholar] [CrossRef]
  17. Yang, Y.; Yang, Y.; Moiwo, J.P.; Hu, Y. Estimation of irrigation requirement for sustainable water resources reallocation in North China. Agric. Water Manag. 2010, 97, 1711–1721. [Google Scholar] [CrossRef]
  18. Duan, A. Irrigation Water Quotas for Major Crops in Northern China; China Agricultural Science and Technology Press: Beijing, China, 2004. [Google Scholar]
  19. Esnault, L.; Gleeson, T.; Wada, Y.; Heinke, J.; Gerten, D.; Flanary, E.; Bierkens, M.F.P.; van Beek, L.P.H. Linking groundwater use and stress to specific crops using the groundwater footprint in the Central Valley and High Plains aquifer systems, US. Water Resour. Res. 2014, 50, 4953–4973. [Google Scholar] [CrossRef]
  20. Pan, M. Sea Surface Temperature Prediction over 2–5 Years Based on CMIP5 and CMIP6 Data. Ph.D. thesis, Nanjing University of Information Science and Technology, Nanjing, China, 2022. [Google Scholar]
  21. Batelaan, O.; De Smedt, F. GIS-based recharge estimation by coupling surface-subsurface water balances. J. Hydrol. 2007, 337, 337–355. [Google Scholar] [CrossRef]
  22. Batelaan, O.; De Smedt, F. WetSpass: A flexible, GIS based, distributed recharge methodology for regional groundwater modelling. Impact Hum. Act. Groundw. Dyn. 2001, 269, 11–17. [Google Scholar]
  23. Tilman, D.; Clark, M. Global diets link environmental sustainability and human health. Nature 2014, 515, 518. [Google Scholar] [CrossRef] [PubMed]
  24. Tian, X.; Engel, B.A.; Qian, H.; Hua, E.; Sun, S.; Wang, Y. Will reaching the maximum achievable yield potential meet future global food demand? J. Clean. Prod. 2021, 294, 126285. [Google Scholar] [CrossRef]
  25. Auger, A.; Brockhoff, D.; Hansen, N.; Tušar, D.; Tušar, T.; Wagner, T. Benchmarking MATLAB's gamultiobj ( NSGA-II ) on the Bi-objective BBOB-2016 Test Suite. In Proceedings of the 2016 Genetic and Evolutionary Computation Conference (GECCO'16 Companion), Denver, CO, USA, 20–24 July 2016; pp. 1233–1239. [Google Scholar] [CrossRef]
  26. dos Santos, B.M.; Godoy, L.P.; Campos, L.M.S. Performance evaluation of green suppliers using entropy-TOPSIS-F. J. Clean. Prod. 2019, 207, 498–509. [Google Scholar] [CrossRef]
  27. Zhou, X. Research on the Optimal Utilization of Agricultural Water Resources in Beijing. Ph.D. Thesis, China Agricultural University, Beijing, China, 2005. [Google Scholar]
  28. China Irrigation and Drainage Development Center Research and Applications of ET Monitoring Technology Using Remote Sensing; China Agricultural Science and Technology Press: Beijing, China, 2003.
  29. Huang, F.; Yang, X.; Fang, Y.; Wang, S.; Kang, S. Exploring Water-and-Land-Adapted Spatial Layout of Crop Planting in North China. Strateg. Study CAE 2022, 24, 89–96. [Google Scholar] [CrossRef]
  30. Yang, X.L.; Huang, J.; Chen, F. Comparative study on temporal and spatial variation characteristics of maize water demand in Huang-Huai-Hai agricultural area. China Agric. Univ. 2011, 16, 26–31. [Google Scholar]
  31. Zhang, J.T.; Li, G.Q.; Zang, H.Z.; Zhang, J.; Zhao, Q.; Chen, D.; Wang, M.; Zheng, G. Changes of water supply and demand and temporal andspatial distribution characteristics of summer peanut in Henan Province. Southwest Agric. J. 2020, 33, 2384–2392. [Google Scholar] [CrossRef]
  32. Hou, M.P. Research on Agricultural Structure Adjustment and Agricultural Development Strategy in Huang Huai Hai Plain. Ph.D. Thesis, China Agricultural University, Beijing, China, 2004. [Google Scholar]
  33. Sun, H.; Zhang, X.; Liu, X.; Liu, X.; Shao, L.; Chen, S.; Wang, J.; Dong, X. Impact of different cropping systems and irrigation schedules on evapotranspiration, grain yield and groundwater level in the North China Plain. Agric. Water Manag. 2019, 211, 202–209. [Google Scholar] [CrossRef]
  34. Sun, S. Research on the Spatial-Temporal Variation of Water Footprint of Crop Production in Nearly 50 Years in Hetao Irrigation District. Ph.D. Thesis, University of Chinese Academy of Sciences, Beijing, China, 2013. [Google Scholar]
Figure 1. Multi-objective crop structure optimization framework.
Sustainability 17 04484 g001
Figure 2. Taylor diagrams of simulated and observed values of eight climate parameters in North China Plain from 1978 to 2014. (a) Relative humidity; (b) precipitation; (c) wind speed; (d) air temperature; (e) maximum temperature; (f) minimum temperature; (g) downward surface shortwave radiation; (h) TOA incident shortwave radiation.
Sustainability 17 04484 g002
Figure 3. Estimation of crop irrigation water demand in study area for research years using CropWat model.
Sustainability 17 04484 g003
Figure 4. Groundwater recharge in study area simulated by WetSpass model for study years (mm).
Sustainability 17 04484 g004
Figure 5. Crop structures in subregions under different climate change adaptation strategies.
Sustainability 17 04484 g005
Figure 6. Ratio of groundwater footprint to area in each subregion before and after optimization in study years.
Sustainability 17 04484 g006
Figure 7. Groundwater consumption of major crop categories under different climate change adaptation strategies.
Sustainability 17 04484 g007
Figure 8. Groundwater consumption in northern and southern study regions under different climate change adaptation strategies.
Sustainability 17 04484 g008
Table 1. Comparison of model-simulated and reference values.
ModelParameterR2MAERMSENRMSE
CropWat ModelRice Water Demand0.990.1711.675.60%
Wheat Water Demand0.98−0.398.835.20%
Maize Water Demand0.996.5710.788.75%
Soybean Water Demand0.992.765.154.03%
Peanut Water Demand0.990.696.165.08%
Cotton Water Demand0.993.996.324.60%
Vegetable Water Demand0.92−0.2323.5516.21%
Fruit Tree Water Demand0.994.26.345.43%
WetSpass ModelGroundwater Recharge0.84−2.0921.2113.25%
Food Demand Projection ModelFood Demand0.960.02226.886.96%
Disclaimer/Publisher’s Note: The statements, opinions and data contained in all publications are solely those of the individual author(s) and contributor(s) and not of MDPI and/or the editor(s). MDPI and/or the editor(s) disclaim responsibility for any injury to people or property resulting from any ideas, methods, instructions or products referred to in the content.

