
Coupling Coordination Between New Urbanization and Economic Development Level in Wuhan


Abstract
1. Introduction
2. Materials
3. Methods
3.1. Research Methods
3.1.1. Data Normalization
3.1.2. Entropy Weight Method
3.1.3. Calculation of the Composite Indices
3.1.4. Coupling Coordination Degree Model
3.1.5. Geodetector
3.2. Indicator Systems and Data Sources
3.2.1. Construction of the Indices Systems
3.2.2. Data Sources
4. Results
4.1. Results of Subsystems Analysis
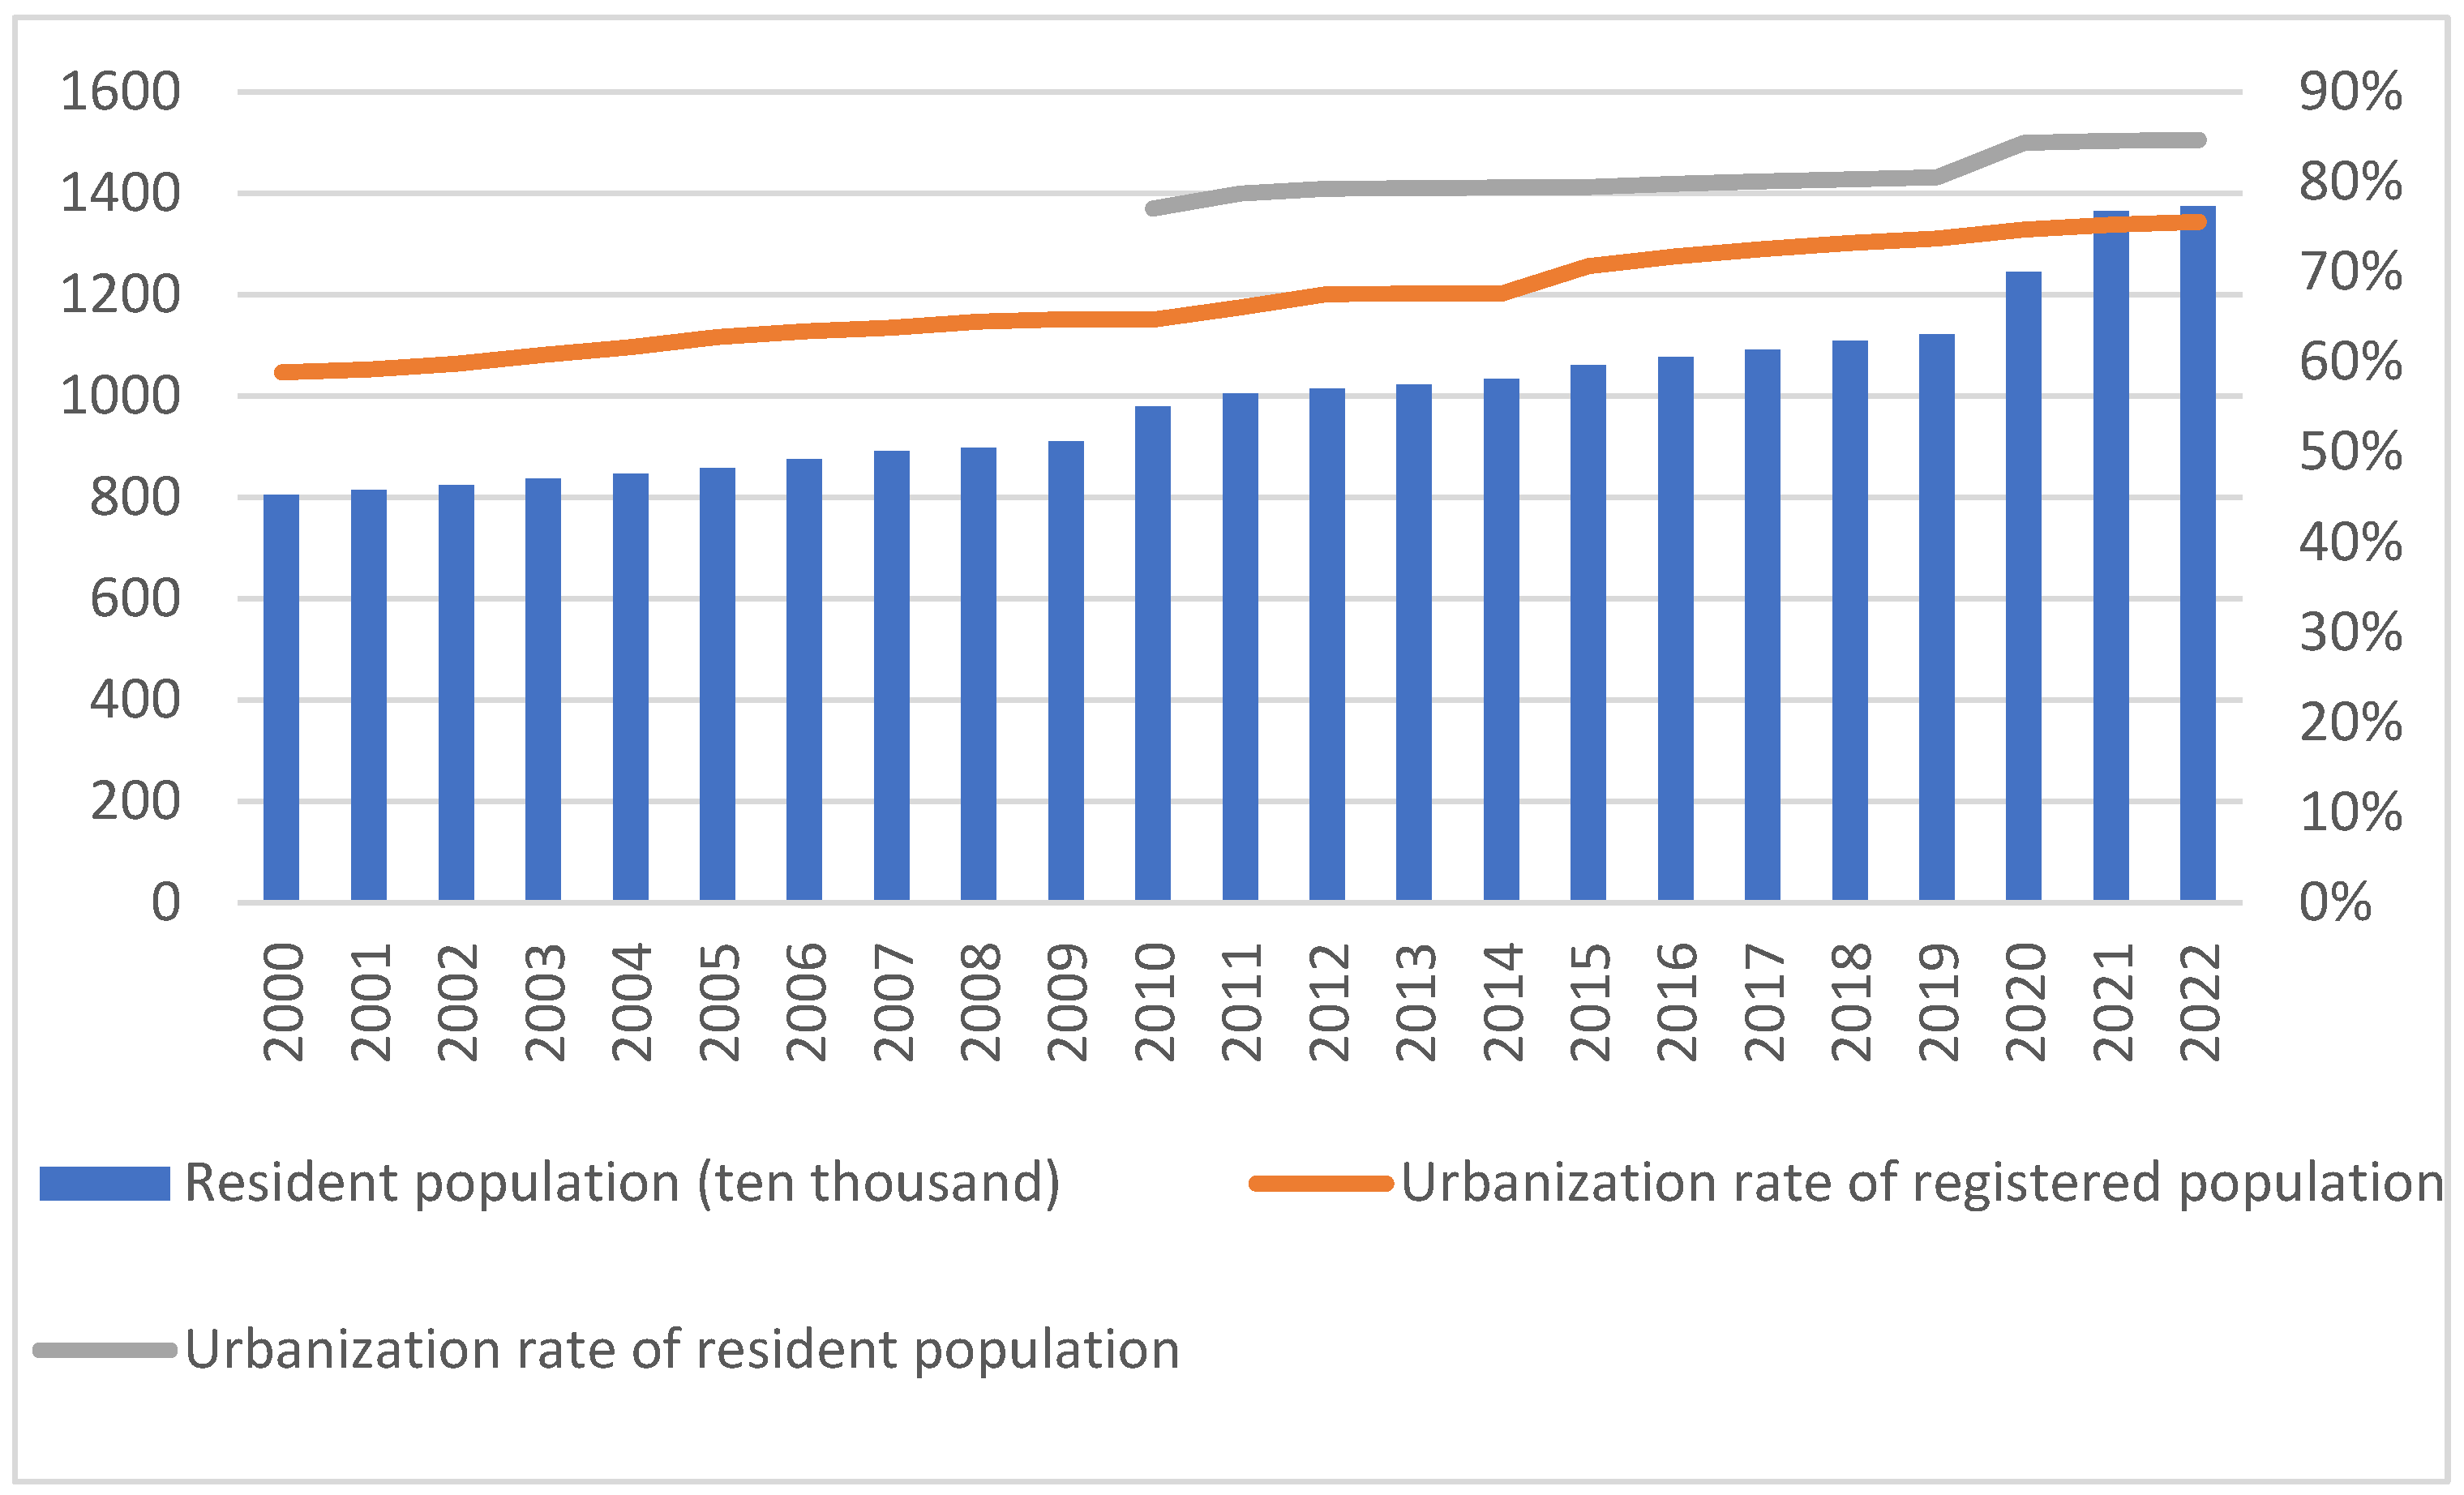
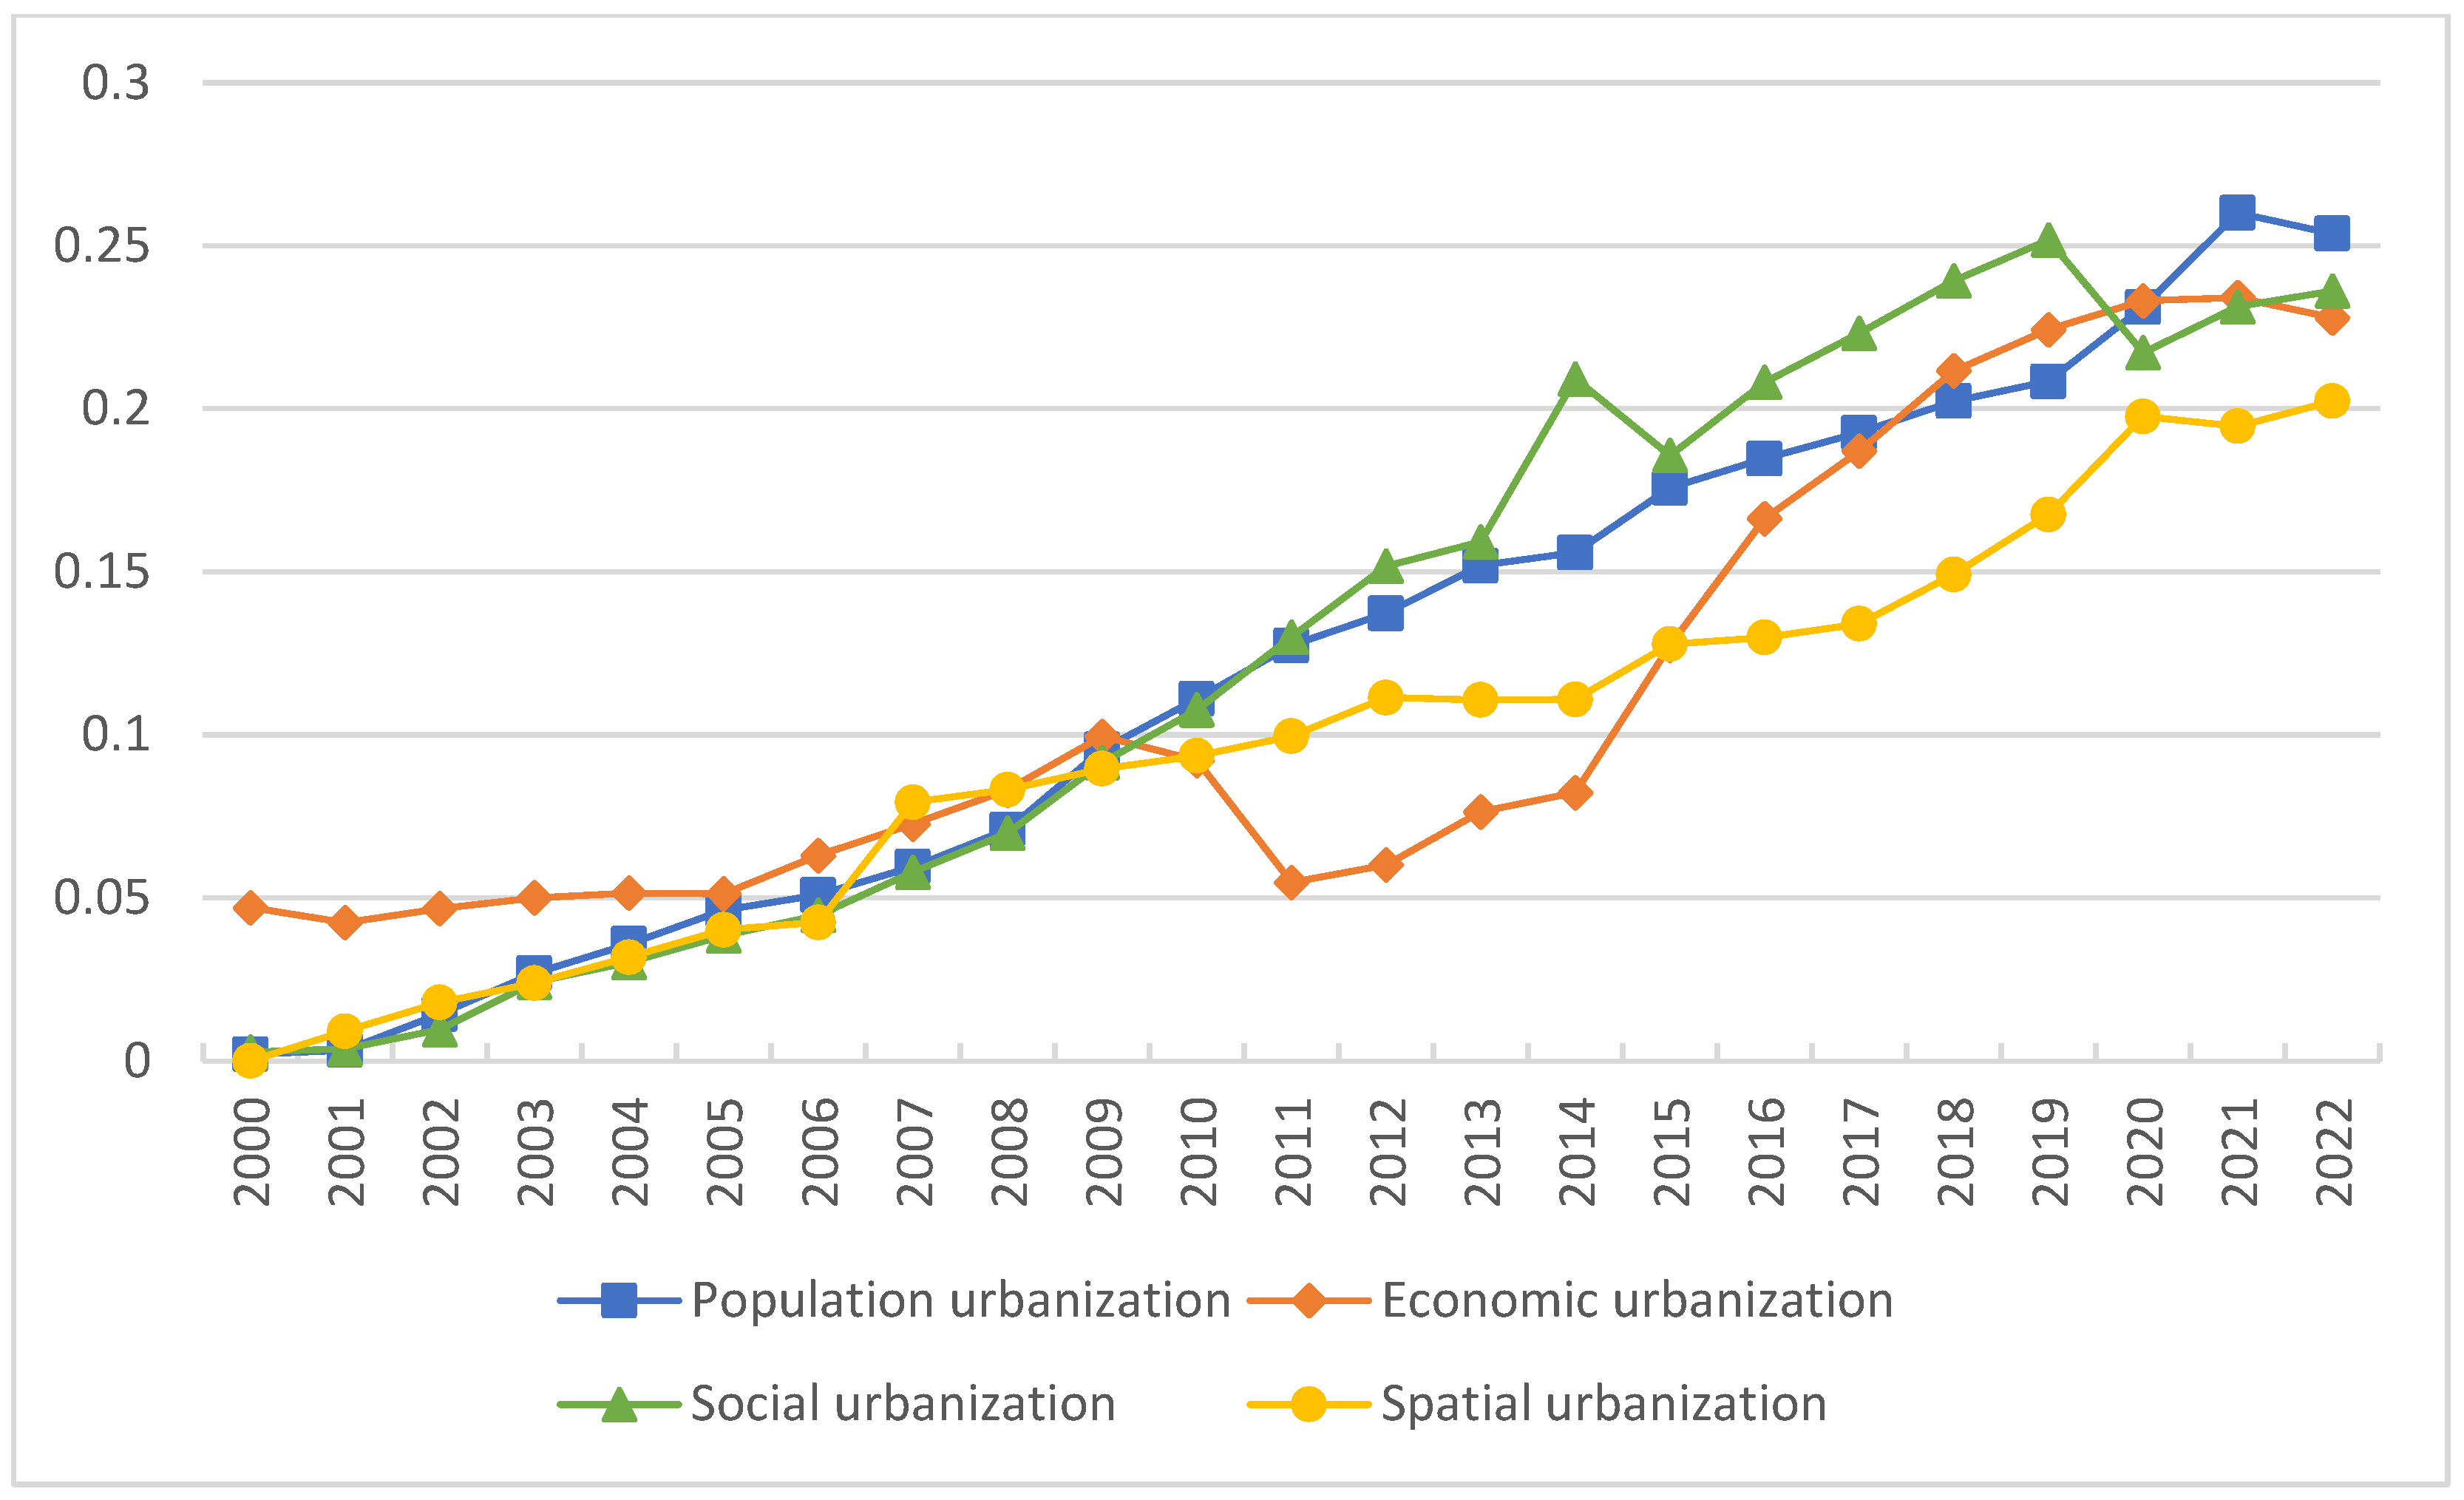
4.1.1. New Urbanization Subsystem Analysis Results
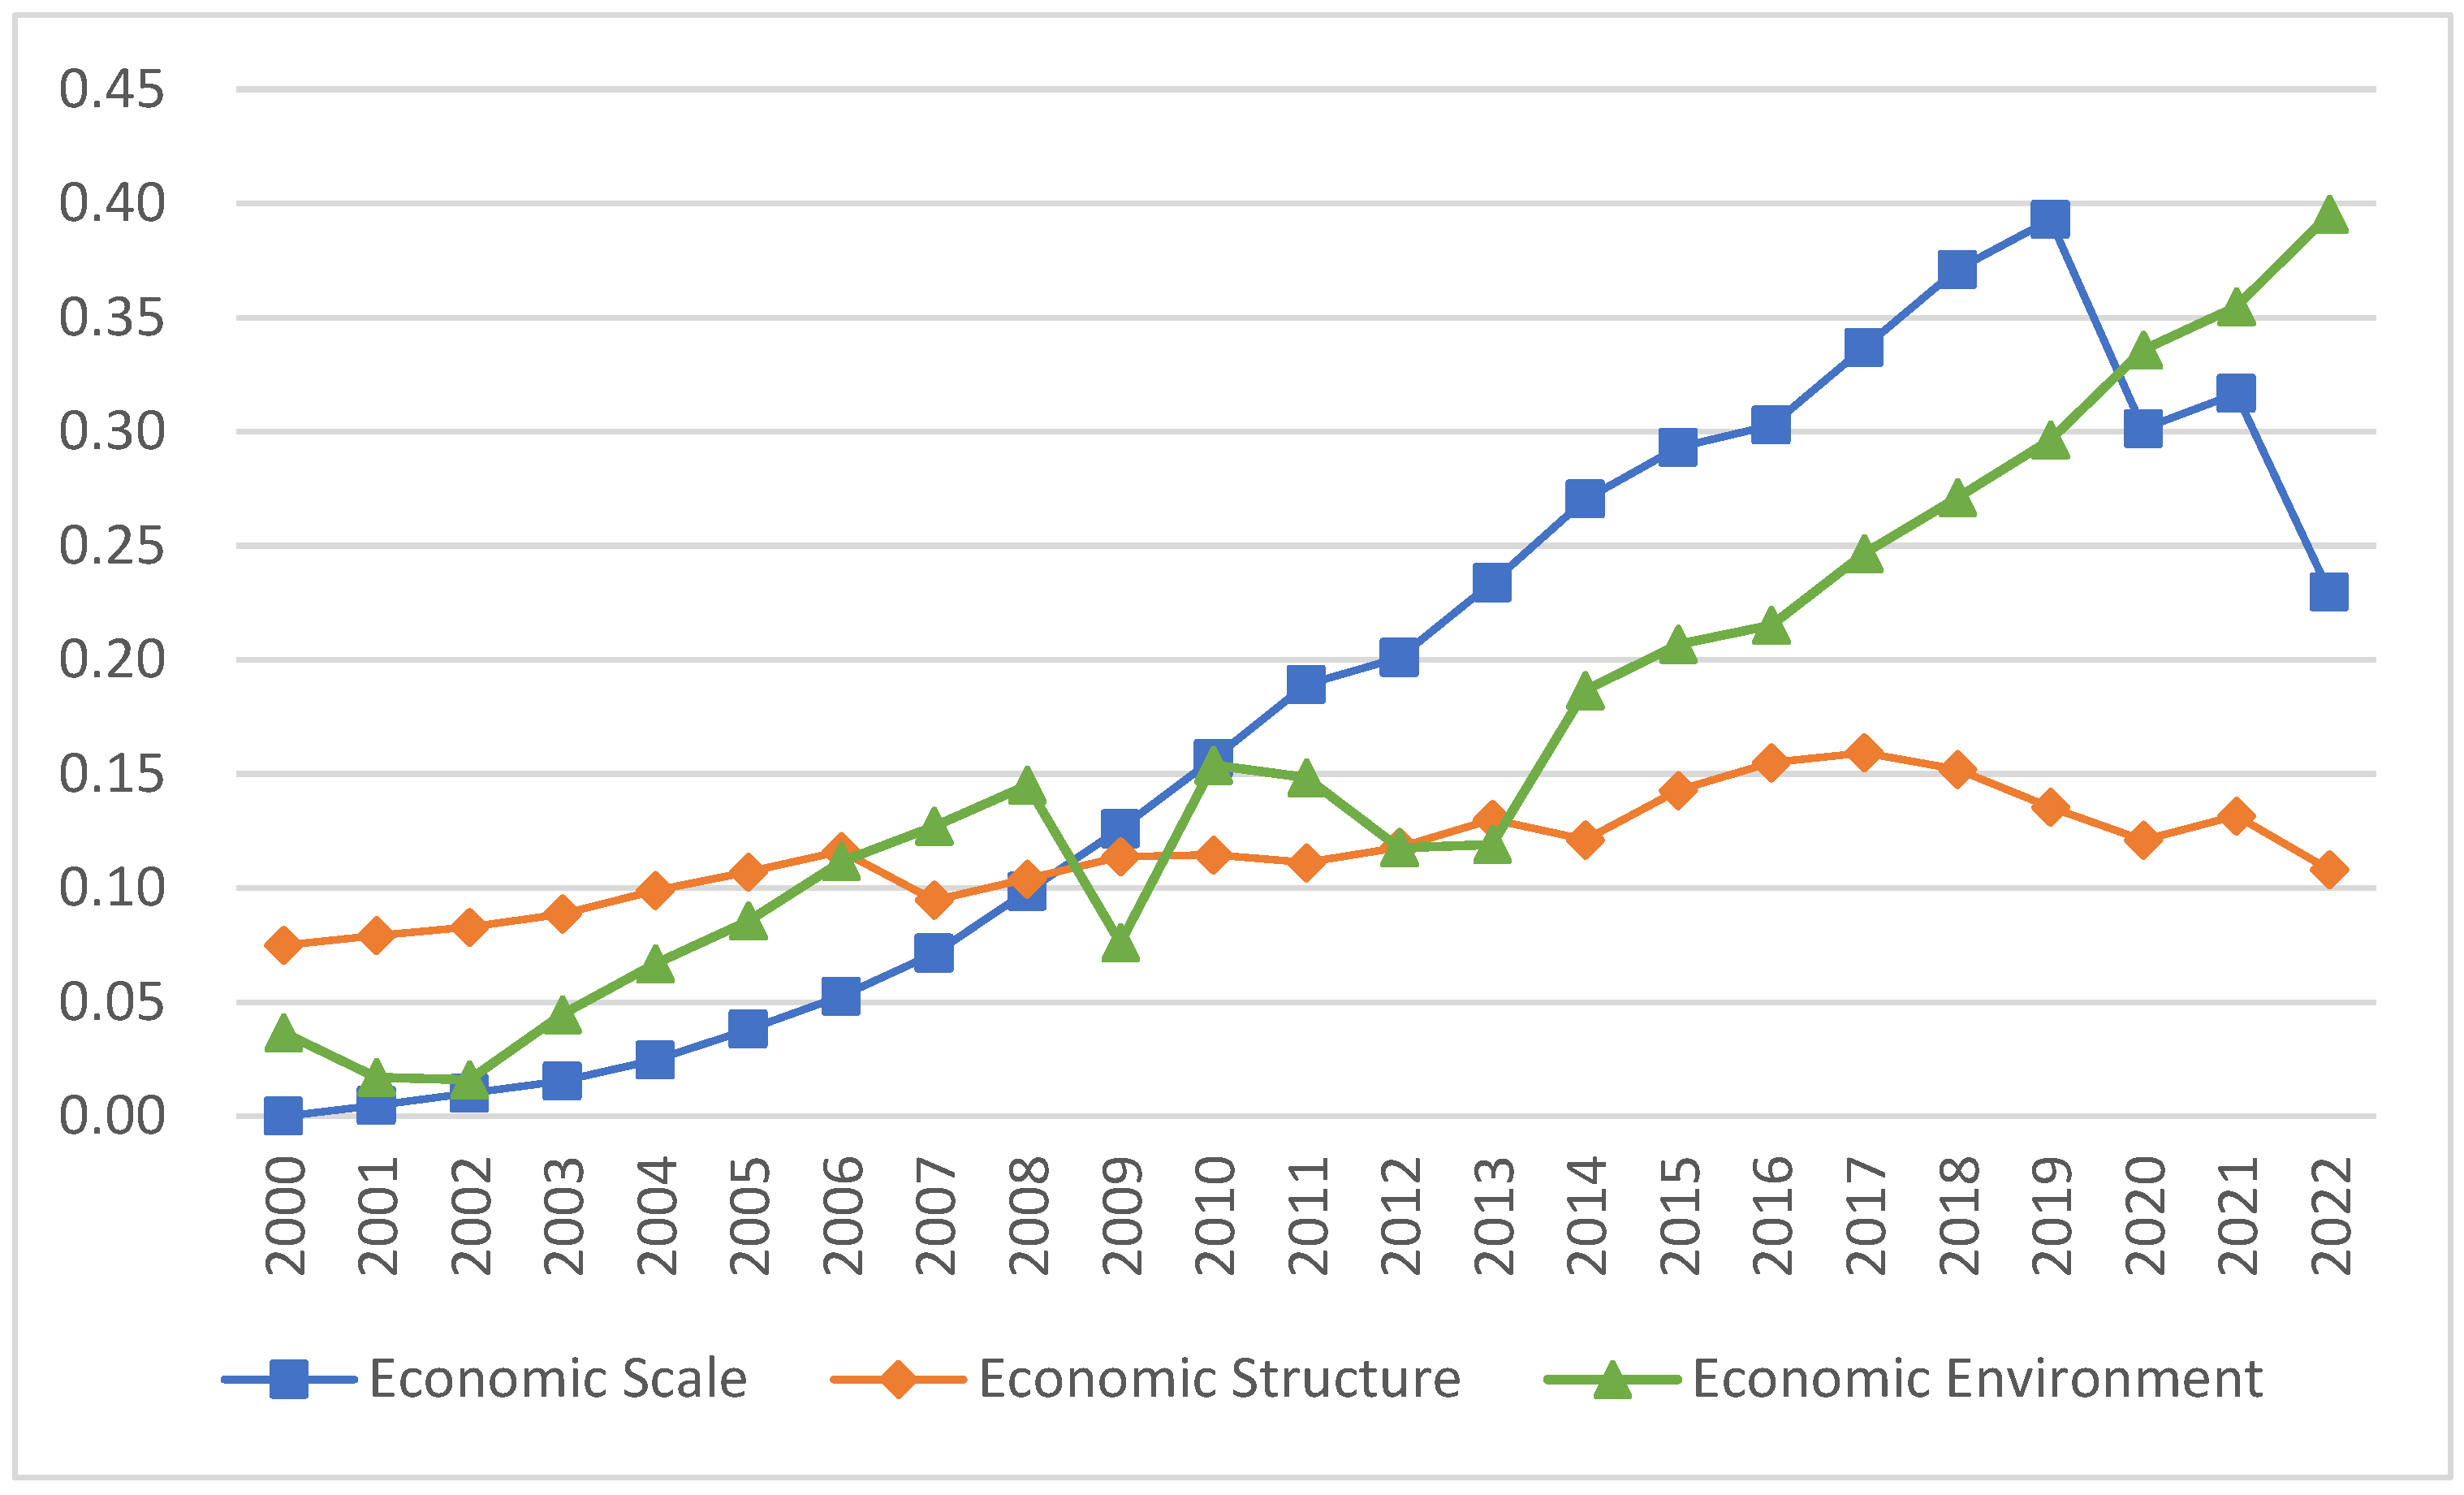
4.1.2. Economic Subsystem Analysis Results
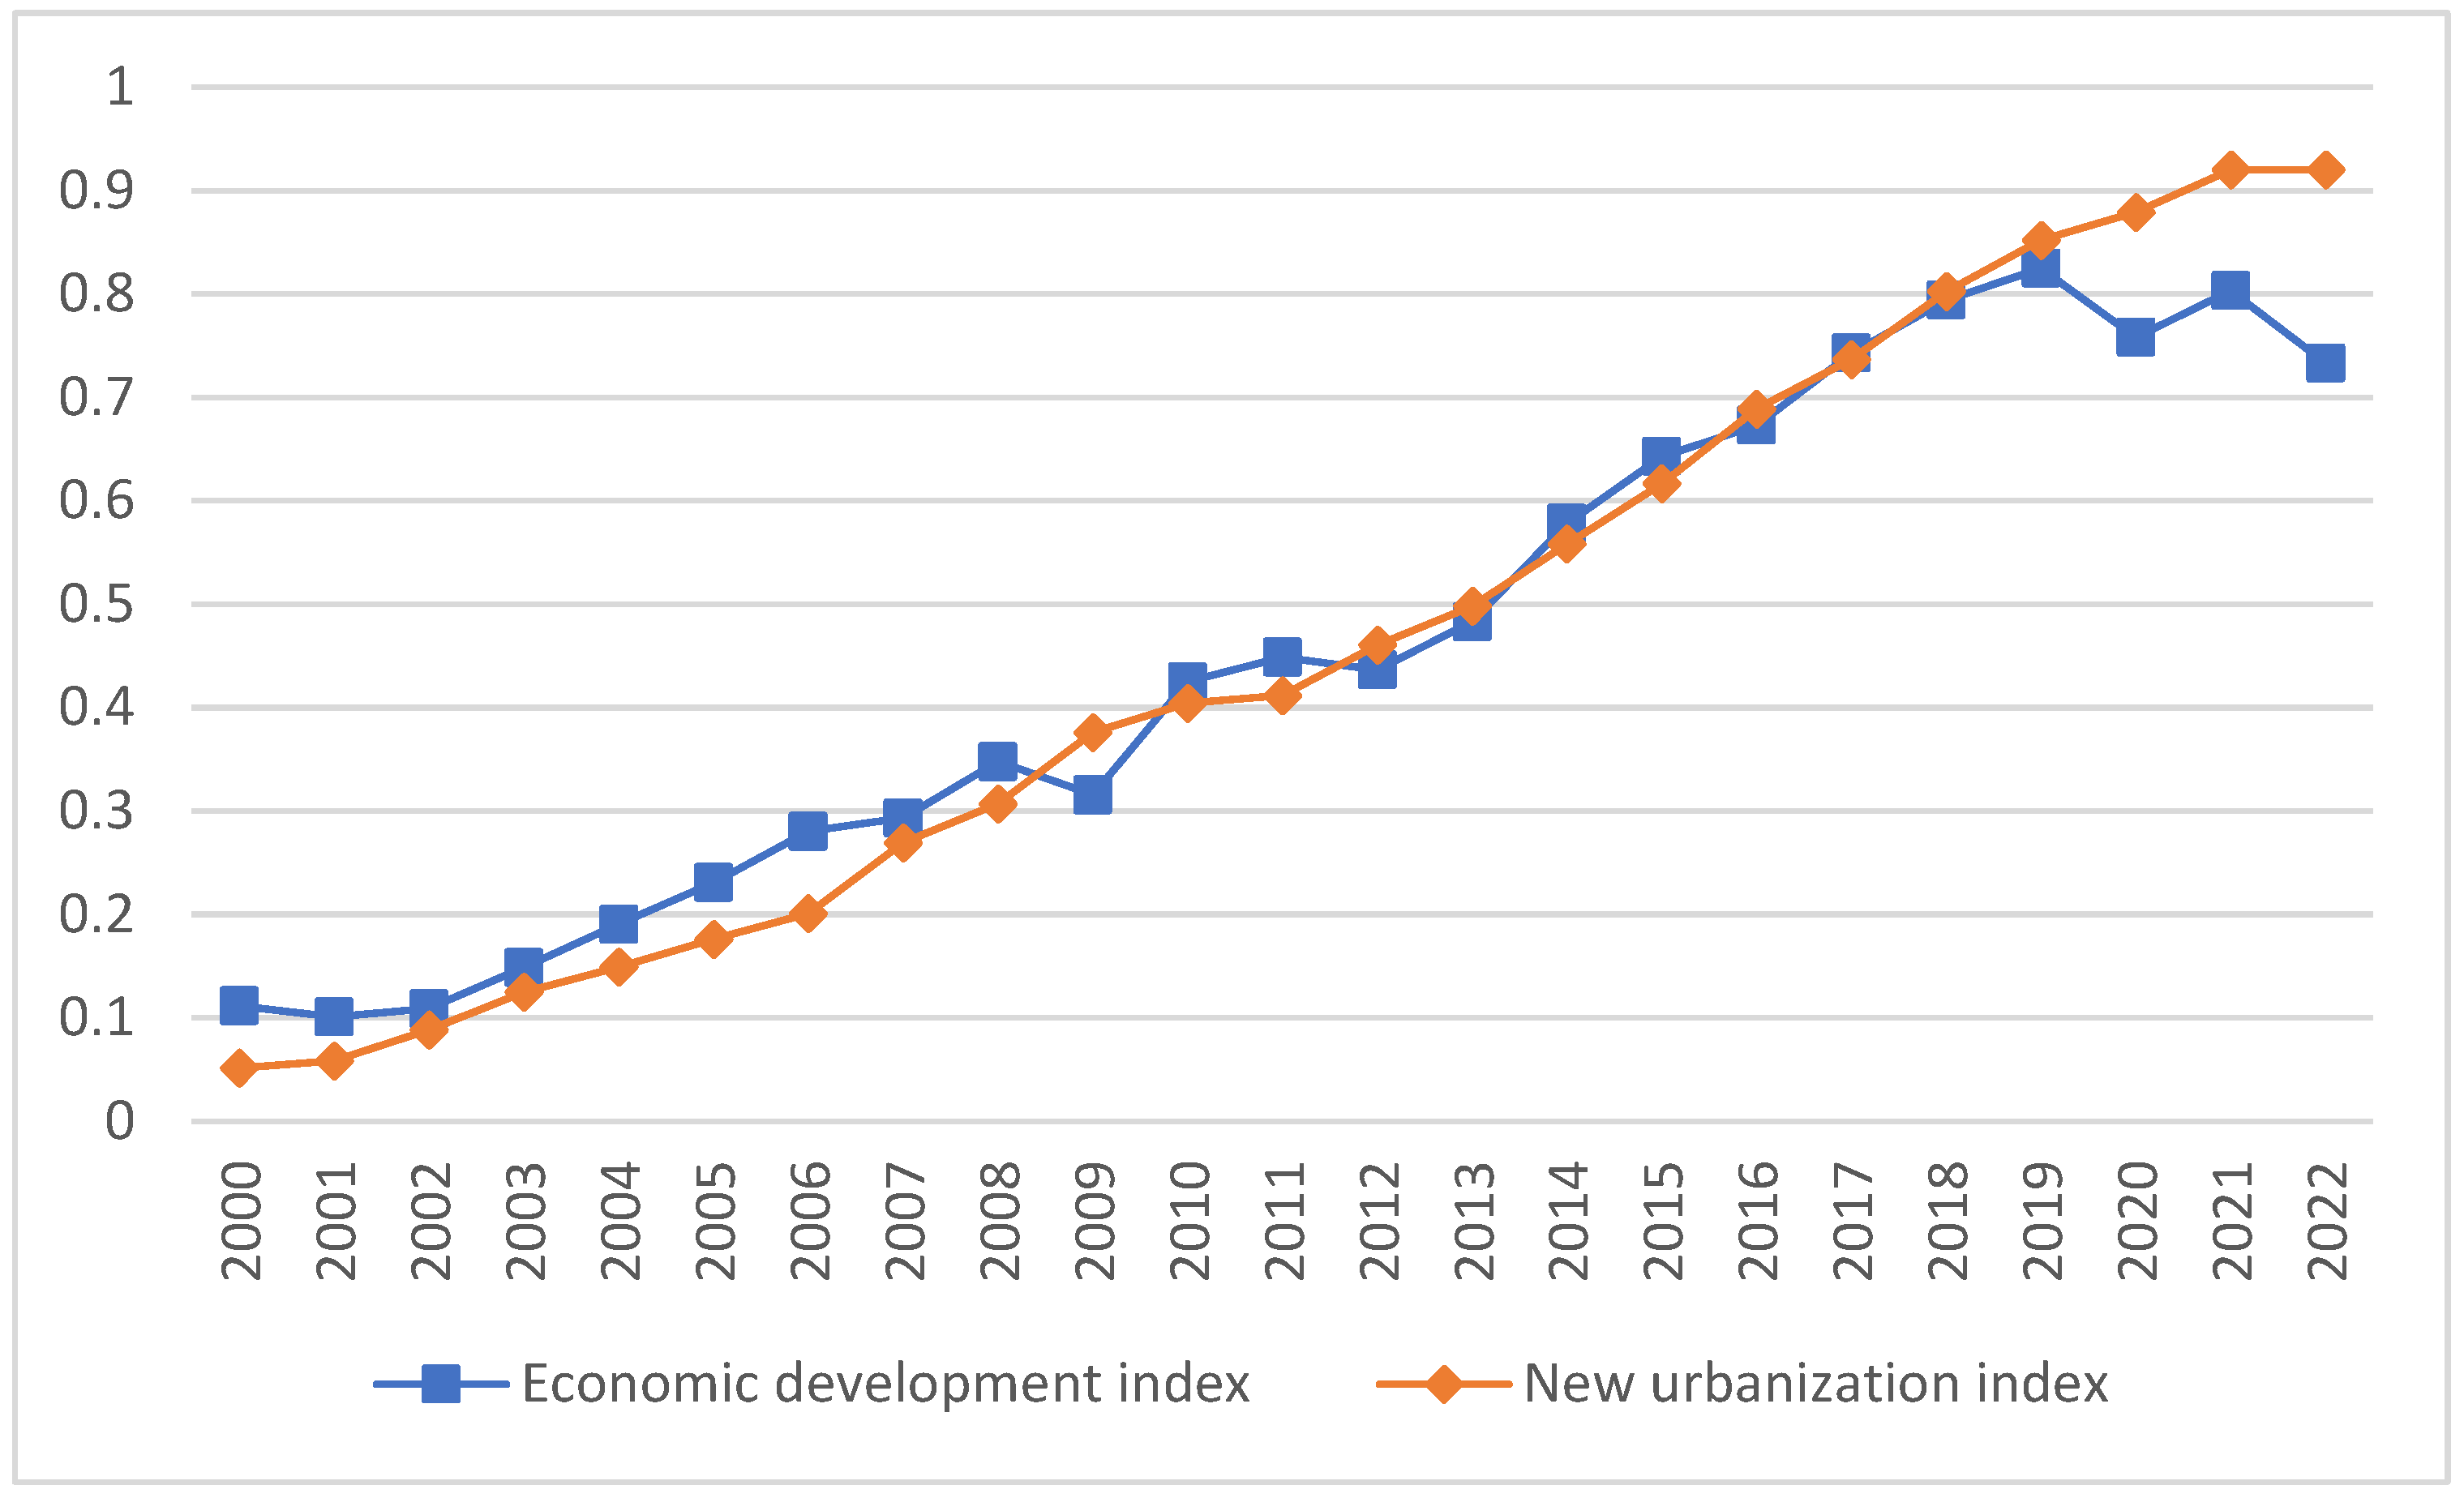
4.2. Comprehensive Evaluation Index Analysis
4.3. Characterization of the Time-Series Variation in the Coupling Coordination Degree
4.4. Impact Factor Analysis
5. Conclusions
- (1)
- The population, economic, social, and spatial urbanization indices of Wuhan as a whole all show an increasing trend. However, the development trends are different in the economy subsystems. Among these, the economic structure has developed relatively smoothly, the economic environment as a whole shows an upward trend, and the economic scale grew steadily in 2000–2019 but decreased significantly due to the impact of the pandemic after 2019.
- (2)
- The comprehensive evaluation index of new urbanization and economic development in Wuhan from 2000 to 2019 showed a fluctuating upward trend overall, indicating that both the urbanization and the economy of Wuhan are increasing. However, in 2020, the urbanization and the economy of Wuhan declined due to the impact of the pandemic. Urbanization lagged behind economic growth from 2000 to 2008, developed synchronously during 2009–2019, and surpassed economic development between 2020 and 2022.
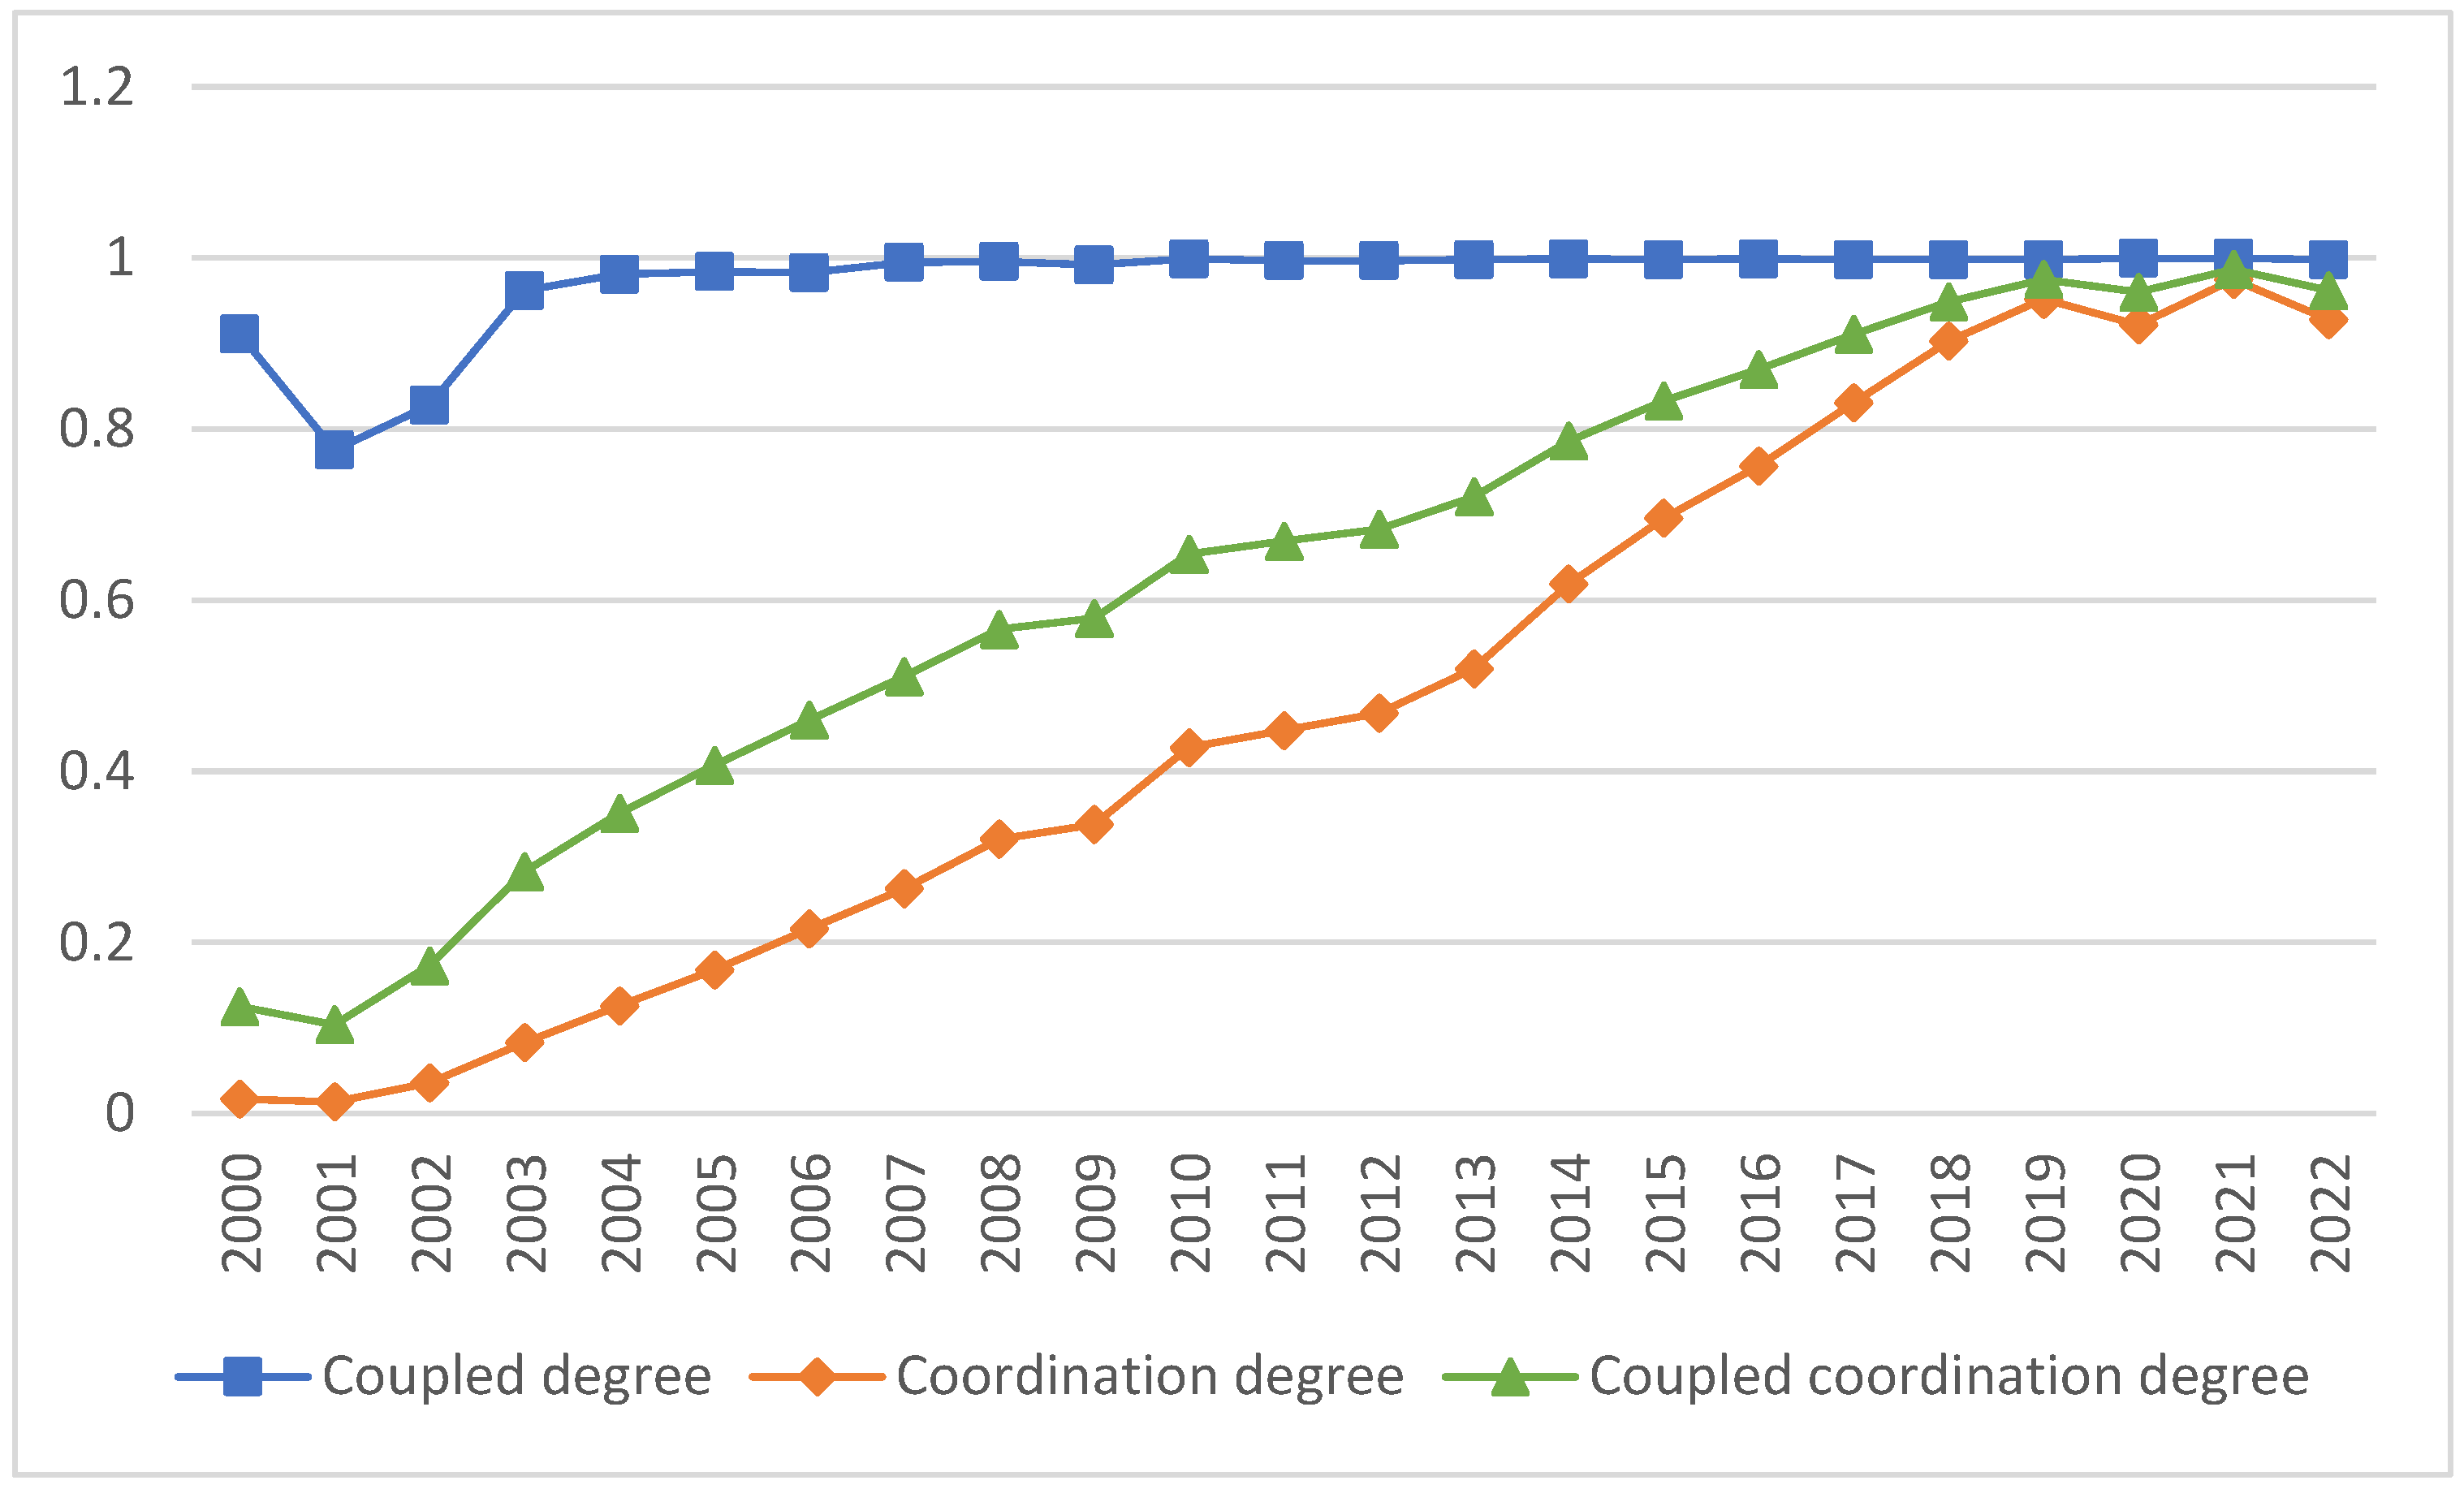
- (3)
- The coupling coordination degree of new urbanization and economic development in Wuhan experienced a development course from severe dissonance to quality coordination in 2000–2022. The degree steadily increased in 2000–2019 and had big ups and downs in 2020–2022. Its development process is influenced by policies and endogenous dynamics.
- (4)
- According to the analysis using Geodetector, the main driving factors include the share of the urban population (%), the consumer price index (%), the share of the employed population in secondary, and tertiary industries (%).
Author Contributions
Funding
Institutional Review Board Statement
Informed Consent Statement
Data Availability Statement
Acknowledgments
Conflicts of Interest
References
- Chen, M.; Ye, C.; Lu, D.; Sui, Y.; Guo, S. Cognition and construction of the theoretical connotation for new-type urbanization with Chinese characteristics. J. Geogr. Sci. 2019, 29, 1681–1698. [Google Scholar] [CrossRef]
- Zhao, J.B.; Shi, D.; Deng, Z. A Framework of China’s High-quality Economic Development. Res. Econ. Manag. 2019, 40, 15–31. [Google Scholar]
- Xinhua Net. Available online: https://www.news.cn/politics/cpc20/2022-10/25/c_1129079429.htm (accessed on 25 October 2022).
- Hong, Y.X.; Chen, W. Transformation from town-oriented urbanization to city-oriented urbanization: Exploration in the new era of Chinese path to modernization. Econ. Res. J. 2023, 58, 4–18. [Google Scholar]
- Lewis, W.A. Economic development with unlimited supplies of labor. Manch. Sch. 1954, 22, 139–191. [Google Scholar] [CrossRef]
- Paul, M.R. Increasing returns and long-run growth. J. Political Econ. 1986, 94, 1002–1037. [Google Scholar]
- Di Clemente, R.; Strano, E.; Batty, M. Urbanization and economic complexity. Sci. Rep. 2021, 11, 3952. [Google Scholar] [CrossRef]
- James, G.; Yu, O.Y. Types of urbanization and economic growth. Int. J. Urban Sci. 2020, 25, 1–15. [Google Scholar]
- Nour, E.; Balla, A.H. The relationship between urbanization and socio-economic development in the Sudan. GeoJournal 1989, 18, 369–377. [Google Scholar] [CrossRef]
- Michael, P. The internal structure of cities in the third world. Geography 2001, 86, 189–209. [Google Scholar]
- Gollin, D.; Jedwab, R.; Vollrath, D. Urbanization with and without industrialization. J. Econ. Growth 2016, 21, 35–70. [Google Scholar] [CrossRef]
- Henderson, J.V.; Kriticos, S. The development of the African system of cities. Annu. Rev. Econ. 2018, 10, 287–314. [Google Scholar] [CrossRef]
- Jedwab, R.; Vollrath, D. Urbanization without growth in historical perspective. Explor. Econ. Hist. 2015, 58, 1–21. [Google Scholar] [CrossRef]
- Fay, M.; Opal, C. Urbanization Without Growth: A Not-So-Uncommon Phenomenon; World Bank Publications: Washington, DC, USA, 2000. [Google Scholar]
- Gu, C.L. Relations between China’s urbanization and economic and social development since the reform and opening up. Hum. Geogr. 2004, 19, 1–5. [Google Scholar]
- Chen, M.X.; Lu, D.D.; Liu, H. The provincial pattern of the relationship between China’s urbanization and economic development. Acta Geogr. Sin. 2010, 65, 1443–1453. [Google Scholar]
- Zhang, W.Z.; Chen, Y.J. Urbanization, labor markets and economic growth. Soc. Sci. Int. 2024, 47, 144–166+245–246. [Google Scholar]
- Wang, W.; Liu, Y.F.; Shi, Q. Population Aging, Urbanization and China’s Economic Growth. Acad. Mon. 2022, 54, 68–82. [Google Scholar]
- Cai, X.J.; Du, S.Y.; Zhu, Q.H.; Wang, X. Government-driven urbanization and economic development: From the perspective of withdrawing counties and establishing districts. Sci. Decis. Mak. 2022, 29, 116–131. [Google Scholar]
- Zhang, M.D.; Xiao, H. The coupling coordination analysis of the urbanization quality and the urban economic development. J. Dalian Univ. Technol. 2020, 41, 37–46. [Google Scholar]
- Wang, S.X. Matching human capital, new urbanization and high-quality economic development. J. Tech. Econ. Manag. 2023, 44, 92–97. [Google Scholar]
- Su, X.F.; Ran, Q.Y. Analysis on the coupling and coordinated development of the urbanization system in northwest China: Based on the perspective of high-quality development. J. Tech. Econ. Manag. 2021, 42, 98–103. [Google Scholar]
- Ma, H.Q.; Lian, Q.W.; Han, Z.L.; Gong, Z.G.; Li, Z. Spatio-temporal evolution of coupling and coordinated development of basic public services-urbanization-regional economy. Econ. Geogr. 2020, 40, 19–28. [Google Scholar]
- Yang, Y. Evaluation and analysis of weighting method in multi-index comprehensive evaluation. Stat. Decis. 2006, 22, 17–19. [Google Scholar]
- Lu, T.C.; Kang, K. The application of entropy method and AHP in weight determining. Comput. Program. Ski. Maint. 2009, 16, 19–20,53. [Google Scholar]
- Wang, S.J.; Kong, W.; Ren, L.; Zhi, D.D.; Dai, B.T. Research on misuses and modification of coupling coordination degree model in China. J. Nat. Resour. 2021, 36, 793–810. [Google Scholar] [CrossRef]
- Liao, C.B. Quantitative judgement and classification system for coordinated development of environment and economy—A case study of the city group in the pearl river delta. Trop. Geogr. 1999, 19, 76–82. [Google Scholar]
- Wang, J.F.; Xu, C.D. Geodetector: Principle and prospective. Acta Geogr. Sin. 2017, 72, 116–134. [Google Scholar]
- Wang, J.L.; Zhang, P.; Zhou, Z.Z. The coupling and coordination relationship between urbanization and economic development—A case study of Anhui Province. J. Commer. Econ. 2019, 38, 148–151. [Google Scholar]
- Ge, S.S.; Zeng, G.; Yang, Y.; Hu, H. The coupling relationship and spatial characteristics analysis between ecological civilization construction and urbanization in the Yellow River Economic Belt. J. Nat. Resour. 2021, 36, 87–102. [Google Scholar] [CrossRef]
- Liang, C.; Zeng, J.; Ding, S.Y. Research on coupling coordination development between regional ecological civilization construction and urbanization: A case study on Fujian Province. J. Hum. Settl. West China 2022, 37, 112–118. [Google Scholar]
- Liu, L.; Zhang, H. Spatial-temporal coupling relationship between urbanization efficiency and economic development level in Shandong Province. Econ. Geogr. 2015, 35, 75–82. [Google Scholar]
- Wuhan Bureau of Statistics. Wuhan Statistical Yearbook; China Statistics Press: Beijing, China, 2001–2023.
- Ministry of Housing and Urban-Rural Development. China Urban Construction Statistical Yearbook; China Statistics Press: Beijing, China, 2002–2022. [Google Scholar]
- Xu, R.G.; Yu, X.H.; Zhao, X.X. Regional economic development trend prediction method based on digital twins and time series network. Comput. Mater. Contin. 2023, 76, 1781–1796. [Google Scholar] [CrossRef]

| Year | Related Policies |
|---|---|
| 2005 | Wuhan was included in the Rise of Central China |
| 2007 | Wuhan City Circle was designated as a pilot area for the “two-type society” |
| 2008 | Organized and compiled the Spatial Planning of Wuhan City Circle |
| 2010 | The State Council approved the Donghu Hi-tech Zone as the second national demonstration zone of independent innovation in China after Zhongguancun Science Park. |
| 2011 | National E-commerce Demonstration City |
| 2014 | The Wuhan City Circle Regional Development Plan (2013–2020) was approved |
| 2015 | Wuhan was positioned by the state as a pilot national innovative city and a pilot zone for comprehensive innovation reform In July of the same year, Wuhan City Circle became the first pilot area for science and technology financial reform and innovation in China |
| 2016 | National Center City |
| 2017 | The Wuhan Pilot Free-Trade Zone in the Donghu Hi-Tech Zone was opened |
| 2018 | The Wuhan Economic–Technological Development Zone (WEDZ) was approved to be established |
| 2022 | The Development Plan of Wuhan Metropolitan Area was approved |
| 2023 | The Three-Year Action Program for the Development of Wuhan Metropolitan Area (2023–2025) |
| Interval | Style | Interval | Style |
|---|---|---|---|
| 0.90~1.00 | Quality coordination | 0.40~0.49 | On the verge of dissonance |
| 0.80~0.89 | Good coordination | 0.30~0.39 | Mild dissonance |
| 0.70~0.79 | Intermediate coordination | 0.20~0.29 | Moderate dissonance |
| 0.60~0.69 | Elementary coordination | 0.10~0.19 | Severe dissonance |
| 0.50~0.59 | Bare coordination | 0.00~0.09 | Extreme dissonance |
| Objective Level | Primary Indicators | Secondary Indicators | Attributes | Weights |
|---|---|---|---|---|
| New urbanization | Population urbanization | X1 Share of urban population (%) | + | 8.08% |
| X2 Population density (persons/square kilometer) | + | 10.77% | ||
| X3 Share of employed population in secondary and tertiary industries (%) | + | 7.74% | ||
| Economic urbanization | X4 GDP per capita (yuan) | + | 11.21% | |
| X5 Ratio of output value of tertiary and secondary industries (%) | + | 10.11% | ||
| X6 Ratio of non-agricultural output value (%) | + | 3.36% | ||
| Social urbanization | X7 Annual per capita consumption expenditure of urban residents (yuan) | + | 12.25% | |
| X8 Number of sanitary beds per 1000 people (units) | + | 11.32% | ||
| X9 Number of students enrolled in general higher education institutions (persons) | + | 4.2% | ||
| Spatial urbanization | X10 Built-up area (square kilometers) | + | 12.48% | |
| X11 Road area per capita (m2) | + | 3.54% | ||
| X12 Green coverage rate of built-up area (%) | + | 4.96% | ||
| Economy | Economic Scale | X13 GDP per capita (yuan) | + | 9.9% |
| X14 Total social fixed investment per capita (yuan) | + | 9.75% | ||
| X15 Per capita total retail sales of social consumer goods (yuan) | + | 9.43% | ||
| X16 Per capita fiscal revenue (yuan) | + | 10.12% | ||
| Economic Structure | X17 Industrialization level (%) | + | 3.54% | |
| X18 Economic density (billion yuan/square kilometer) | + | 7.96% | ||
| X19 Share of output value of secondary industry (%) | + | 3.82% | ||
| X20 Share of output value of tertiary industry (%) | + | 6.21% | ||
| Economic Environment | X21 Import and export (%) | + | 7.06% | |
| X22 Marketization level (%) | + | 13.07% | ||
| X23 Per capita disposable income of urban permanent residents (yuan) | + | 10.6% | ||
| X24 Consumer price index (%) | + | 8.56% |
| Indicators | K = 4 | K = 6 | K = 8 | |||
|---|---|---|---|---|---|---|
| q-Value | p-Value | q-Value | p-Value | q-Value | p-Value | |
| X1 | 0.932 | 0.000 | 0.977 | 0.000 | 0.986 | 0.000 |
| X2 | 0.771 | 0.005 | 0.950 | 0.000 | 0.977 | 0.000 |
| X3 | 0.925 | 0.000 | 0.955 | 0.000 | 0.966 | 0.000 |
| X4 | 0.892 | 0.000 | 0.898 | 0.000 | 0.962 | 0.000 |
| X5 | 0.688 | 0.012 | 0.655 | 0.137 | 0.656 | 0.556 |
| X6 | 0.529 | 0.069 | 0.653 | 0.054 | 0.678 | 0.068 |
| X7 | 0.910 | 0.000 | 0.925 | 0.000 | 0.948 | 0.000 |
| X8 | 0.827 | 0.000 | 0.892 | 0.000 | 0.894 | 0.000 |
| X9 | 0.869 | 0.000 | 0.887 | 0.000 | 0.923 | 0.000 |
| X10 | 0.906 | 0.000 | 0.909 | 0.000 | 0.929 | 0.000 |
| X11 | 0.869 | 0.000 | 0.878 | 0.000 | 0.920 | 0.000 |
| X12 | 0.897 | 0.000 | 0.931 | 0.000 | 0.935 | 0.000 |
| X13 | 0.892 | 0.000 | 0.898 | 0.000 | 0.962 | 0.000 |
| X14 | 0.871 | 0.000 | 0.942 | 0.000 | 0.954 | 0.000 |
| X15 | 0.866 | 0.000 | 0.955 | 0.000 | 0.946 | 0.000 |
| X16 | 0.847 | 0.000 | 0.927 | 0.000 | 0.923 | 0.000 |
| X17 | 0.364 | 0.256 | 0.514 | 0.611 | 0.528 | 0.635 |
| X18 | 0.858 | 0.000 | 0.899 | 0.000 | 0.903 | 0.000 |
| X19 | 0.580 | 0.054 | 0.622 | 0.147 | 0.622 | 0.606 |
| X20 | 0.681 | 0.005 | 0.895 | 0.000 | 0.908 | 0.000 |
| X21 | 0.127 | 0.614 | 0.201 | 0.628 | 0.286 | 0.861 |
| X22 | 0.705 | 0.000 | 0.708 | 0.062 | 0.709 | 0.365 |
| X23 | 0.778 | 0.000 | 0.920 | 0.000 | 0.966 | 0.000 |
| X24 | 0.908 | 0.000 | 0.963 | 0.000 | 0.975 | 0.000 |
Disclaimer/Publisher’s Note: The statements, opinions and data contained in all publications are solely those of the individual author(s) and contributor(s) and not of MDPI and/or the editor(s). MDPI and/or the editor(s) disclaim responsibility for any injury to people or property resulting from any ideas, methods, instructions or products referred to in the content. |
© 2025 by the authors. Licensee MDPI, Basel, Switzerland. This article is an open access article distributed under the terms and conditions of the Creative Commons Attribution (CC BY) license (https://creativecommons.org/licenses/by/4.0/).
Share and Cite
Wang, J.; Tang, Q.; Guo, W. Coupling Coordination Between New Urbanization and Economic Development Level in Wuhan. Sustainability 2025, 17, 4481. https://doi.org/10.3390/su17104481
Wang J, Tang Q, Guo W. Coupling Coordination Between New Urbanization and Economic Development Level in Wuhan. Sustainability. 2025; 17(10):4481. https://doi.org/10.3390/su17104481
Chicago/Turabian StyleWang, Jing, Qingmiao Tang, and Weilong Guo. 2025. "Coupling Coordination Between New Urbanization and Economic Development Level in Wuhan" Sustainability 17, no. 10: 4481. https://doi.org/10.3390/su17104481
APA StyleWang, J., Tang, Q., & Guo, W. (2025). Coupling Coordination Between New Urbanization and Economic Development Level in Wuhan. Sustainability, 17(10), 4481. https://doi.org/10.3390/su17104481