Article

A Multi-Criteria Framework for Sustainable Marine Spatial Planning in Coastal Cities: Case Study in Shenzhen, China

1
Guangdong-Hong Kong-Macao Greater Bay Area Environmental Technology Research Center, Shenzhen Research Institute of Nankai University, Shenzhen 518063, China
2
Department of Water Resources Engineering, Lund University, 22100 Lund, Sweden
3
College of Environmental Science and Engineering, Nankai University, Tianjin 300350, China
*
Author to whom correspondence should be addressed.
Sustainability 2025, 17(10), 4480; https://doi.org/10.3390/su17104480
Submission received: 3 April 2025 / Revised: 1 May 2025 / Accepted: 12 May 2025 / Published: 14 May 2025
(This article belongs to the Section Environmental Sustainability and Applications)

Abstract

:
As rapid urbanization intensified pressure on coastal ecosystems, balancing economic development with ecological preservation remained a critical challenge. This study developed a multi-criteria framework for integrated marine spatial planning and applied it to Shenzhen, China—a rapidly expanding coastal metropolis overseeing 1145 km2 of marine territory with a 260.5 km coastline, 61.47% of which has been anthropogenically modified. The methodology combined ecological, environmental, and socioeconomic indicators through a hierarchical evaluation system, using entropy-weighted indices and GIS-based spatial analysis to assess marine space suitability across three functional categories: ecological protection, urban development, and biological resource utilization. The results revealed that 38.53% of Shenzhen’s coastline retains natural geomorphology, while 23.7% annual growth in maritime infrastructure projects since 2015 highlights urgent development pressures. Marine spatial zoning identified priority areas for ecological conservation, urban–industrial expansion, and biological resource utilization through a 1 km × 1 km grid-based analysis, integrating water quality monitoring data. The framework demonstrated how adaptive zoning of underutilized coastal areas could enhance resource efficiency while balancing economic and environmental goals. These findings provide empirical evidence for optimizing marine resource allocation in coastal megacities, emphasizing the importance of data-driven planning anchored in quantitative metrics (e.g., shoreline development intensity and fisheries resource carrying indices) to achieve long-term sustainability.

1. Introduction

Marine zoning in coastal areas is essential for achieving a balance between protecting marine ecosystems and fostering economic growth [1]. As urbanization and industrialization along coastlines continue to accelerate, the importance of establishing clear and effective marine zoning has become increasingly evident [2,3,4]. This type of zoning facilitates the efficient utilization of marine resources, safeguards biodiversity, and promotes sustainable development [5]. By defining specific areas for ecological protection, resource extraction, and industrial development, marine zoning aims to prevent overexploitation and environmental degradation, while also fostering the growth of marine industries in a way that is both responsible and beneficial to the local economy [6]. In addition, effective zoning can address challenges such as the fragmentation of land–sea planning and the need for integrated management of coastal and marine environments [7]. This comprehensive approach is essential for achieving long-term ecological, economic, and social sustainability in coastal regions [8,9].
From an international perspective, the rise of marine spatial planning marks a shift in marine governance from single-resource management to systemic spatial coordination [10,11,12]. For instance, in 2014, the European Union enacted the Marine Spatial Planning Directive, which mandated that member countries establish marine functional zones by 2021, aiming to address the competing interests of shipping, fishing, energy development, and environmental conservation [13]. This framework not only emphasizes spatial optimization of economic activities but also guides zoning decisions by quantifying ecosystem service values (such as carbon sequestration capacity and biodiversity maintenance). For instance, in the North Sea region, compatibility zones have been designated for wind farms and bird migration corridors [14,15]. Transboundary cooperation has become another important trend, with Baltic Sea countries establishing unified data-sharing platforms and joint management mechanisms to coordinate fisheries quotas and pollution control standards [16,17]. Mediterranean coastal countries, through regional marine agreements, have incorporated tourism development and coral reef protection into zoning plans, reflecting the collaborative nature of global marine governance [18,19].
The current research hotspots focus on adaptive zoning to address climate change, the application of multi-objective optimization models, and the improvement of stakeholder participation mechanisms [20,21]. With the ongoing rise in global sea levels and the increasing frequency of extreme weather events, conventional static zoning approaches are inadequate for addressing the dynamic needs of risk management [22,23]. For instance, in Shanghai, a coastal buffer zone has been designated in the eastern part of Chongming Island, restricting permanent building development and reserving flexible space for tidal flooding [24]; Guangzhou’s Nansha New Area has adjusted high-risk zones to ecological wetland parks based on simulated storm surge inundation ranges, enhancing the city’s resilience [25]. Technological innovations have further promoted the scientific advancement of zoning. Spatial analysis models based on GIS and remote sensing technologies can integrate multidimensional data, such as hydrological, biological, and economic data [26]. For example, in Zhejiang Province, machine learning algorithms are used to predict the relationship between farming density and red tide occurrence in the Xiangshan Port area, optimizing the spatial layout of fishing zones [27]. At the same time, community participation mechanisms are increasingly becoming an important part of zoning decisions. Hainan Province established an ecological compensation fund for enterprises in the development of Sanya Bay, directing a portion of tourism revenues to coral reef restoration, reflecting the co-governance logic of multiple stakeholders [28].
However, marine zoning in coastal cities still faces several challenges. First, the inadequacy of data support and assessment systems restricts the refinement of zoning plans. Many regions lack high-precision marine environmental data [29]. Secondly, land resource scarcity exacerbates the conflict between protection and development. For example, in the Beibu Gulf of Guangxi, the overdevelopment of the Yintan Scenic Area has resulted in beach erosion and water quality deterioration, forcing the government to invest hundreds of millions of yuan in ecological restoration [30]. Moreover, the rigid framework of traditional zoning planning is inadequate to adapt to sudden environmental changes [31]. Local governments’ GDP evaluation mechanisms still prioritize the layout of ports, industries, and other economic functions, while the regulatory enforcement of ecological protection areas remains insufficient [32].
This study addressed the central research question of how a multi-criteria framework could integrate ecological, environmental, and socioeconomic indicators to achieve sustainable marine spatial planning in rapidly urbanizing coastal cities, with a focus on balancing economic development and ecological preservation. The investigation was carried out through the development and application of a hierarchical evaluation system in Shenzhen, China, which centered on three primary objectives. First, it aimed to identify priority zones for the conservation of natural coastlines, which made up 38.53% of Shenzhen’s coastline, while mitigating the pressures exerted by human activities, as 61.47% of the coastline had been modified. Second, the study tackled the challenge of meeting urgent infrastructure needs, given the 23.7% annual growth in maritime projects since 2015, while minimizing negative impacts on the environment. Lastly, it sought to optimize the utilization of biological resources, such as fisheries and tourism, while adhering to environmental limits like water quality and sediment standards. The research tested the effectiveness of a data-driven framework, which combined entropy-weighted indices, GIS analysis, and adaptive zoning to address the conflicts between these priorities in coastal megacities like Shenzhen.
This paper emphasized the significance of adopting an integrated approach to marine planning to foster discussions around sustainable development. It examined the intricate interactions between coastal ecosystems, human populations, and environmental shifts, offering valuable insights into the necessity for collaborative management practices. The study provided practical recommendations to enhance the resilience of both marine ecosystems and coastal communities, highlighting the importance of sustainable resource utilization and advocating for increased cooperation among governments, local stakeholders, and researchers. In conclusion, it reinforced the critical role of integrated planning in ensuring the long-term sustainability of marine environments.

2. Methodology

The methodology employed a systematic approach to evaluate the suitability of marine spatial zoning. Initially, the marine zones were categorized into three primary functional spaces: ecological protection, urban construction, and biological resource utilization, each further subdivided into specific functional areas (e.g., ecological control, industrial use, fisheries) (in Section 2.1). The suitability evaluation integrated ecological, environmental, and socioeconomic factors through a hierarchical indicator system (in Section 2.2).
This study tested three hypotheses derived from the challenges outlined in the Shenzhen case. The first hypothesis (H1) posits that a multi-criteria framework integrating ecological, environmental, and socioeconomic indicators can systematically resolve conflicts between coastal development and conservation. The second hypothesis (H2) suggests that entropy-weighted indices and GIS-based spatial analysis can reduce subjective bias in zoning decisions compared to traditional expert-driven methods. The third hypothesis (H3) asserts that the framework is replicable in other coastal cities facing similar urbanization pressures, as long as local data and policy contexts are properly integrated.

2.1. Marine Zone Division System

The assessment of marine spatial zoning suitability was founded on the development feasibility evaluations of three key functions: ecological protection, agricultural production, and urban construction. Tailored to the unique characteristics of marine environments, the evaluation involved processes such as basic data processing, indicator selection and weighting, and the calculation and classification of evaluation units. Ultimately, this led to the determination of the suitability assessment results for marine ecological spaces, construction use spaces, and marine biological resource utilization spaces within the jurisdictional waters. Furthermore, by integrating zoning determination standards, a clear marine ecological zoning scheme was established.
Building on this foundation, and in conjunction with the original marine functional zoning, the “Land and Sea Classification Guidelines for Territorial Spatial Investigation, Planning, and Use Regulation (Trial)” and the current regional conditions and development needs, a small-scale marine spatial zoning system was defined [33,34] (Table 1). This study proposed a specific layout for the marine functional zoning of the coastal city, which primarily comprised marine ecological spaces, marine biological resource utilization spaces, and construction use spaces.
Marine ecological spaces were defined as marine areas characterized by natural attributes, primarily serving the functions of providing ecological services, protection, and ecosystem maintenance. Construction use spaces referred to marine areas designated for activities related to the development of ports, coastal industries, and major infrastructure projects. Marine biological resource utilization spaces were identified as marine zones with good environmental quality and high primary productivity, suitable for supplying marine products, marine biomedical raw materials, and marine tourism.

2.2. Marine Development Suitability Evaluation

This paper approached the topic from the perspective of marine spatial classification and regional conditions [5,35,36,37,38,39,40,41]. Based on the distinct attributes and characteristics of each space type, it developed a suitability evaluation indicator system, drawing upon a secondary indicator classification, as presented in Table 2.
The establishment of the zoning suitability evaluation indicator system is theoretically grounded in internationally recognized principles of marine spatial planning and China’s specific policy contexts. The system aligns with the EU Maritime Spatial Planning Directive’s three pillars through operationalized metrics: Ecological coherence is quantified via biodiversity indices like the Shannon–Wiener index and habitat quality assessments; ecosystem-based management is implemented through ecological carrying capacity indicators, while blue growth objectives are measured by development intensity and transportation accessibility parameters [42,43]. This hierarchical structure follows UNESCO’s pressure–state–response framework, where shoreline development intensity represents anthropogenic pressures, water quality compliance rates and sediment standards reflect environmental states, and ecological control zoning serves as the management response [44].
Indicator selection adhered to three validation criteria: spatial explicitness ensured 1 km2 mappability for coastal management applications, policy relevance guaranteed alignment with China’s Marine Functional Zoning GB/T 17108-2006 standards, and scientific validity incorporated peer-reviewed indices like the ecological health index (EHindx) [45].
Table 2. Zoning suitability evaluation indicator system.
Evaluation ObjectiveSecondary IndicatorTertiary IndicatorIndicator Definitions
Marine Ecological SpaceMarine EcosystemEcological ImportanceComprehensive assessment of the importance of protected marine areas, typical marine habitat protection, and marine topography protection.
Marine BiodiversityCalculated using Shannon–Wiener index H * = i = 1 s p i l o g 2 p i , where   p i is the proportion of individuals of species i, and s is the total number of species [46,47].
Ecological Health StatusCalculated using ecological health status E H i n d x = i p I N D X i , where I N D X i represents the health status of indicator i, and p is the number of indicator categories [48].
Marine Ecological Environment EvaluationMarine Environmental Carrying IndexRatio of the area of marine regions meeting water quality standards to the total area.
Marine Ecological Carrying IndexBased on the “Guidelines for Coastal Marine Ecological Health Evaluation” [49,50,51].
Marine Environmental QualitySeawater QualityAccording to “Seawater Quality Standards” [52].
Marine Sediment QualityAccording to “Marine Sediment Quality Standards” [53,54,55].
Marine Biological QualityAccording to “Marine Biological Quality Standards” [56,57].
Construction Marine SpaceMarine Space Resource EvaluationShoreline Development IntensityCalculated using shoreline development intensity P A = l m B × q B + l m T × q T + l m G × q G + l m H × q H l t o t a l , where   l t o t a l is the total shoreline length. l m B ,   l m T ,   l m G and l m H represent the lengths of the coastal lines of the enclosure dam, protective embankment, industrial and urban areas, and port and dock areas, respectively. q B , q T , q G , and q H represent the impact levels of the four types of artificial coastlines on the marine resource environment [58].
Marine Area Development IntensityCalculated using marine area development intensity P E = i = 1 n S i × l i S , where S i is the area of type i, S is the total area of marine functional zones, and l i is the resource consumption coefficient for type i [59].
Resource Environment ConstraintsMarine Development PotentialEvaluated through the minimum of shoreline D s and tidal flat resource utilization potential D t .
D s = 1 L r + L p L z , where L r is the length of developed coastline, L p is the length of coastline within marine protected areas, and L z is the total length of coastline.
D t = 1 S r + S p S z , where S r is the area of developed intertidal zone S p is the area of intertidal zone within marine protected areas, and S z is the total area of intertidal zone [60].
Land Reclamation Resource--Calculated as reclaimed land area minus area confirmed for reclamation projects.
Transportation AdvantageDistance to Residential Areas
Distance to Ports
Distance to Roads
Distance to Offshore Islands
The Delphi method is used to determine the importance of transportation factors. The assigned values are as follows: distance to residential areas is 0.1, to roads 0.25, to ports 0.35, and to offshore islands 0.3. To find the distance of transportation factors from the evaluation unit’s center, extreme value normalization is used to calculate the relative distances [61,62,63,64].
Marine Biological Resource Utilization SpaceMarine Fisheries Resource EvaluationFisheries Resource Carrying IndexFisheries resource carrying index F = F 1 × 0.6 + F 2 × 0.4 , where F 1 is the swimming animal index and F 2 is the fish egg and larval fish index.
F 1 = E S + T L 2 , where ES is the proportion of economically important species in the catch, and TL is the average trophic level index for the coastal area.
F 2 = F E × 0.2 + F L × 0.8 , where F E is the fish egg density, and F L is the larval fish density [65].
Marine Environmental QualitySeawater QualitySame as above.
Marine Sediment QualitySame as above.
Marine Biological QualitySame as above.
Marine EcosystemEcological ImportanceSame as above.
Marine BiodiversitySame as above.
Ecological Health StatusSame as above.
Transportation AdvantageDistance to Residential Areas
Distance to Ports
Distance to Roads
Distance to Offshore Islands
Same as above.
This paper employed the comprehensive index method based on entropy weights to determine the weight factors for each indicator. The entropy weight method was specifically adopted to resolve three critical challenges: addressing compensation effects between ecological preservation and development priorities, modeling non-linear marine carrying capacity relationships, and objectively prioritizing zoning conflicts through information entropy calculations. This approach maintains methodological rigor while preserving the original computational integrity of the weights and system architecture, ensuring the framework’s capacity to operationalize sustainable coastal management principles without data modification or theoretical compromises. The entropy weight method is intended to determine the weights of indicators according to the information contributed by the observed values of different indicators, enabling an impartial evaluation of their relative significance [66,67,68]. The specific calculation steps for the entropy weight method were as follows:
Construct an i × j matrix using the indicator data from each region as column vectors.
Calculate the characteristic weight P i j of the i-th measurement for the j-th indicator using Formula (1):
P i j = x i j i = 1 n x i j
Derive the entropy for each indicator e j based on the characteristic weights using Formula (2):
e j = 1 l n   n i = 1 n P i j l n   P i j
Finally, determine the weights for each indicator w j using Formula (3):
w j = ( 1 θ i j ) / j = 1 n ( 1 θ i j )
The evaluation unit acted as the primary spatial unit for analyzing the appropriateness of spatial development, leading to the establishment of an appropriate grid size that corresponded with the planning area. This study primarily utilized the dominant factor determination method, supplemented by the overlay and dynamic grid methods. Considering data availability, the marine area was divided into grid units of 1 km × 1 km. Data were collected for layer analysis and computation based on the suitability evaluation indicators for marine spatial zoning.
Subsequently, the graphical and attribute data for each indicator layer were normalized to generate raster data for every evaluation factor layer. The score for each evaluation unit was represented by the value at the grid’s central point. The extreme value method and other techniques were used for standardization, as described in the following Formula (4):
B i = A i m i n A i m a x A i m i n A i
where B i denotes the evaluation value of the i-th indicator; A i represents the actual value, while m a x A i and m i n A i indicate the upper and lower limits of the actual values.
The standardized scores of each evaluation unit’s indicators and the corresponding raster data were weighted and summed through overlay operations to obtain the comprehensive score and evaluation result layer for each evaluation unit.
Finally, the comprehensive evaluation index was calculated using a multi-factor synthesis determination method [69]. Formula (5) was used:
Y i = k = 1 n W k × Y i k
where Y i is the comprehensive score of the i-th evaluation unit; W k represents the weight of the k-th indicator; Y i k is the normalized value of the k-th indicator for the i-th evaluation unit; and n is the number of evaluation units.
By utilizing ArcGIS, the natural breaks classification technique was employed to categorize the scores according to their distribution patterns. The classification results were determined according to the scores of each evaluation unit, clustering them into three levels: “high”, “medium”, and “low”. This process divided the marine space with continuous attribute values into several regions with uniform attributes, thereby yielding the suitability evaluation results. The boundaries of the merged regions were smoothed and organized, and the areas classified as “high”, “medium”, and “low” suitability were extracted as vector data, resulting in various suitability evaluation maps.
Based on the analysis of the results from the marine spatial zoning suitability evaluation, a preliminary zoning scheme was developed according to specific criteria, as presented in Table 3.
In the evaluation results, only one area was identified with a high suitability level, which was designated as that specific type of space. For areas where two suitability indicators were rated as high, if one of them indicated a high suitability for marine ecological space, those areas were generally classified under marine ecological space based on the principle of prioritizing ecological protection. Otherwise, they could be prioritized for designation as marine biological resource utilization space.
In cases where all three suitability indicators were rated high, the areas were classified as marine ecological space, following the principle of ecological protection. For the areas not yet designated, if only one indicator of marine ecological suitability or marine biological resource utilization suitability was rated as moderate, those areas were classified according to that specific type of space.
For areas with two moderate suitability indicators, if the corresponding space type aligned with the main functional orientation was rated low, the designation typically followed a hierarchical order of marine ecological space, marine biological resource utilization space, and construction-related marine space. Alternatively, this could be determined based on the principle of spatial concentration. If not, the classification adhered to the principle of aligning with the main functional orientation.
When all three suitability indicators received a moderate rating, the areas were classified based on their primary functional orientation. Conversely, regions that exhibited low functional suitability overall were typically categorized as marine ecological spaces, adhering to the principle of prioritizing ecological conservation.
Given the small-scale approach of the marine spatial suitability evaluation, which centered on the integrity of spatial or ecosystem units, a localized assessment was performed, leading to certain spatial constraints. As a result, the marine spatial zoning outcomes necessitated further validation. Adjustments were made to these zoning results by referencing higher-level planning documents, such as provincial land spatial planning and coastal zone planning, to prevent conflicts.
This methodology presents three important innovations in marine spatial planning. The first is the use of an entropy-weighted multi-criteria decision framework, which contrasts with traditional subjective weighting methods. By using entropy to quantify ecological, environmental, and socioeconomic trade-offs, this approach reduces human bias and ensures a more objective balance between conservation and development priorities, with indicator weights derived from data variability. The second innovation involves a dynamic grid-based spatial analysis, which uses a high-resolution GIS model with a 1 km2 grid. This model incorporates real-time environmental data, such as water quality and sediment information, along with machine learning algorithms to predict habitat vulnerability. By offering a granular approach, it addresses the limitations of static zoning, allowing for adaptive adjustments in response to coastal changes like sea level rise and infrastructure growth. Finally, the study introduces stakeholder-driven adaptive governance by incorporating participatory mechanisms, such as the Delphi method for transportation factor weighting, and climate-resilient buffer zones. This approach effectively combines technical analysis with governance, ensuring that zoning plans remain flexible and responsive to both ecological changes and community needs.

3. Case Study

3.1. Overview of the Study Area and Data

As China’s leading coastal economic hub, with unparalleled access to deep-sea basins, Shenzhen oversees a marine territory of 1145 km2, boasting a 260.5 km coastline divided into distinct western and eastern segments (Figure 1 and Figure 2). The western coastline (22°32′ N–22°40′ N) stretches from the Dongbao River estuary in Bao’an District to the Shenzhen River estuary in Futian District, while the eastern coastline (22°33′ N–22°41′ N) spans from Shatoujiao in Yantian District to Bagang in Dapeng District. Notably, 61.47% (160.1 km) of this coastline has been altered by human activity, in contrast to 38.53% (100.4 km) that retains its natural geomorphological features. This spatial arrangement positions Shenzhen as a prime example of coastal megacities experiencing rapid urban growth, where escalating human-induced pressures—such as land reclamation, industrial development, and port expansion—intersect with critical marine biodiversity areas. The city’s coastal interface has thus become a critical battleground for reconciling the demands of the blue economy with the need for ecological preservation, especially considering the 23.7% annual growth rate in maritime infrastructure projects since 2015. Shenzhen’s marine environment faces numerous challenges, particularly the tension between economic activities and ecological protection amidst urban expansion and infrastructure development. As such, a comprehensive analysis of Shenzhen’s marine functional zoning offers valuable insights and lessons for other coastal cities, providing both theoretical support and empirical foundations for advancing marine management and fostering sustainable development at a higher level.
Coastline and marine data were sourced from the Shenzhen Municipal Bureau of Planning and Natural Resources, while environmental and ecological data on the marine environment were provided by the National Meteorological Center, the State Oceanic Administration, and Sentinel-2 satellite data. A set of sampling points was established to assess the current zoning of Shenzhen’s marine areas, at the following coordinates: Nan’ao (114°28′49″ E, 22°32′48″ N), Qixing Bay (114°33′6″ E, 22°33′22″ N), Shenzhen Bay (113°57′5″ E, 22°29′15″ N), and West Bay (113°50′0″ E, 22°35′36″ N). These sampling points, together with Shenzhen’s water quality monitoring stations, cover a range of nearshore marine areas, as depicted in Figure 1. The water quality parameters monitored include chlorophyll, algae, total organic carbon (TOC), chemical oxygen demand (COD), nitrogen, and phosphorus. The data collected at these sites consist of daily values, spanning from 1 January 2023 to 31 October 2024. The data used in the study are presented in Table 4.

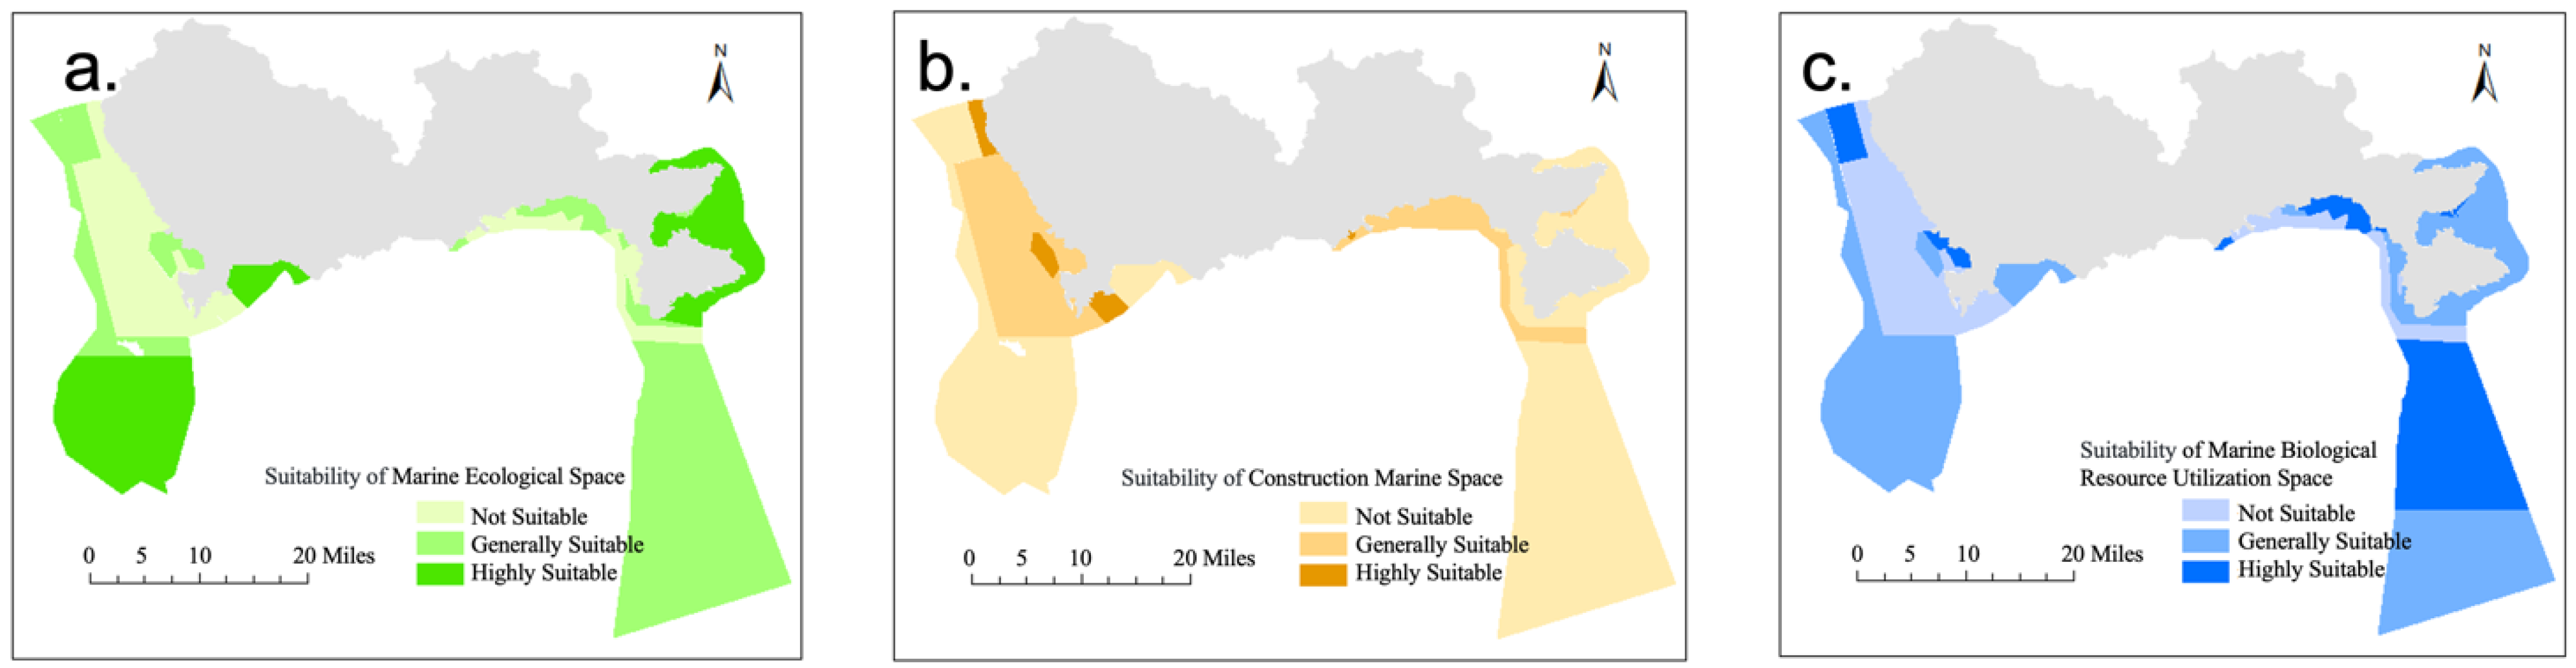
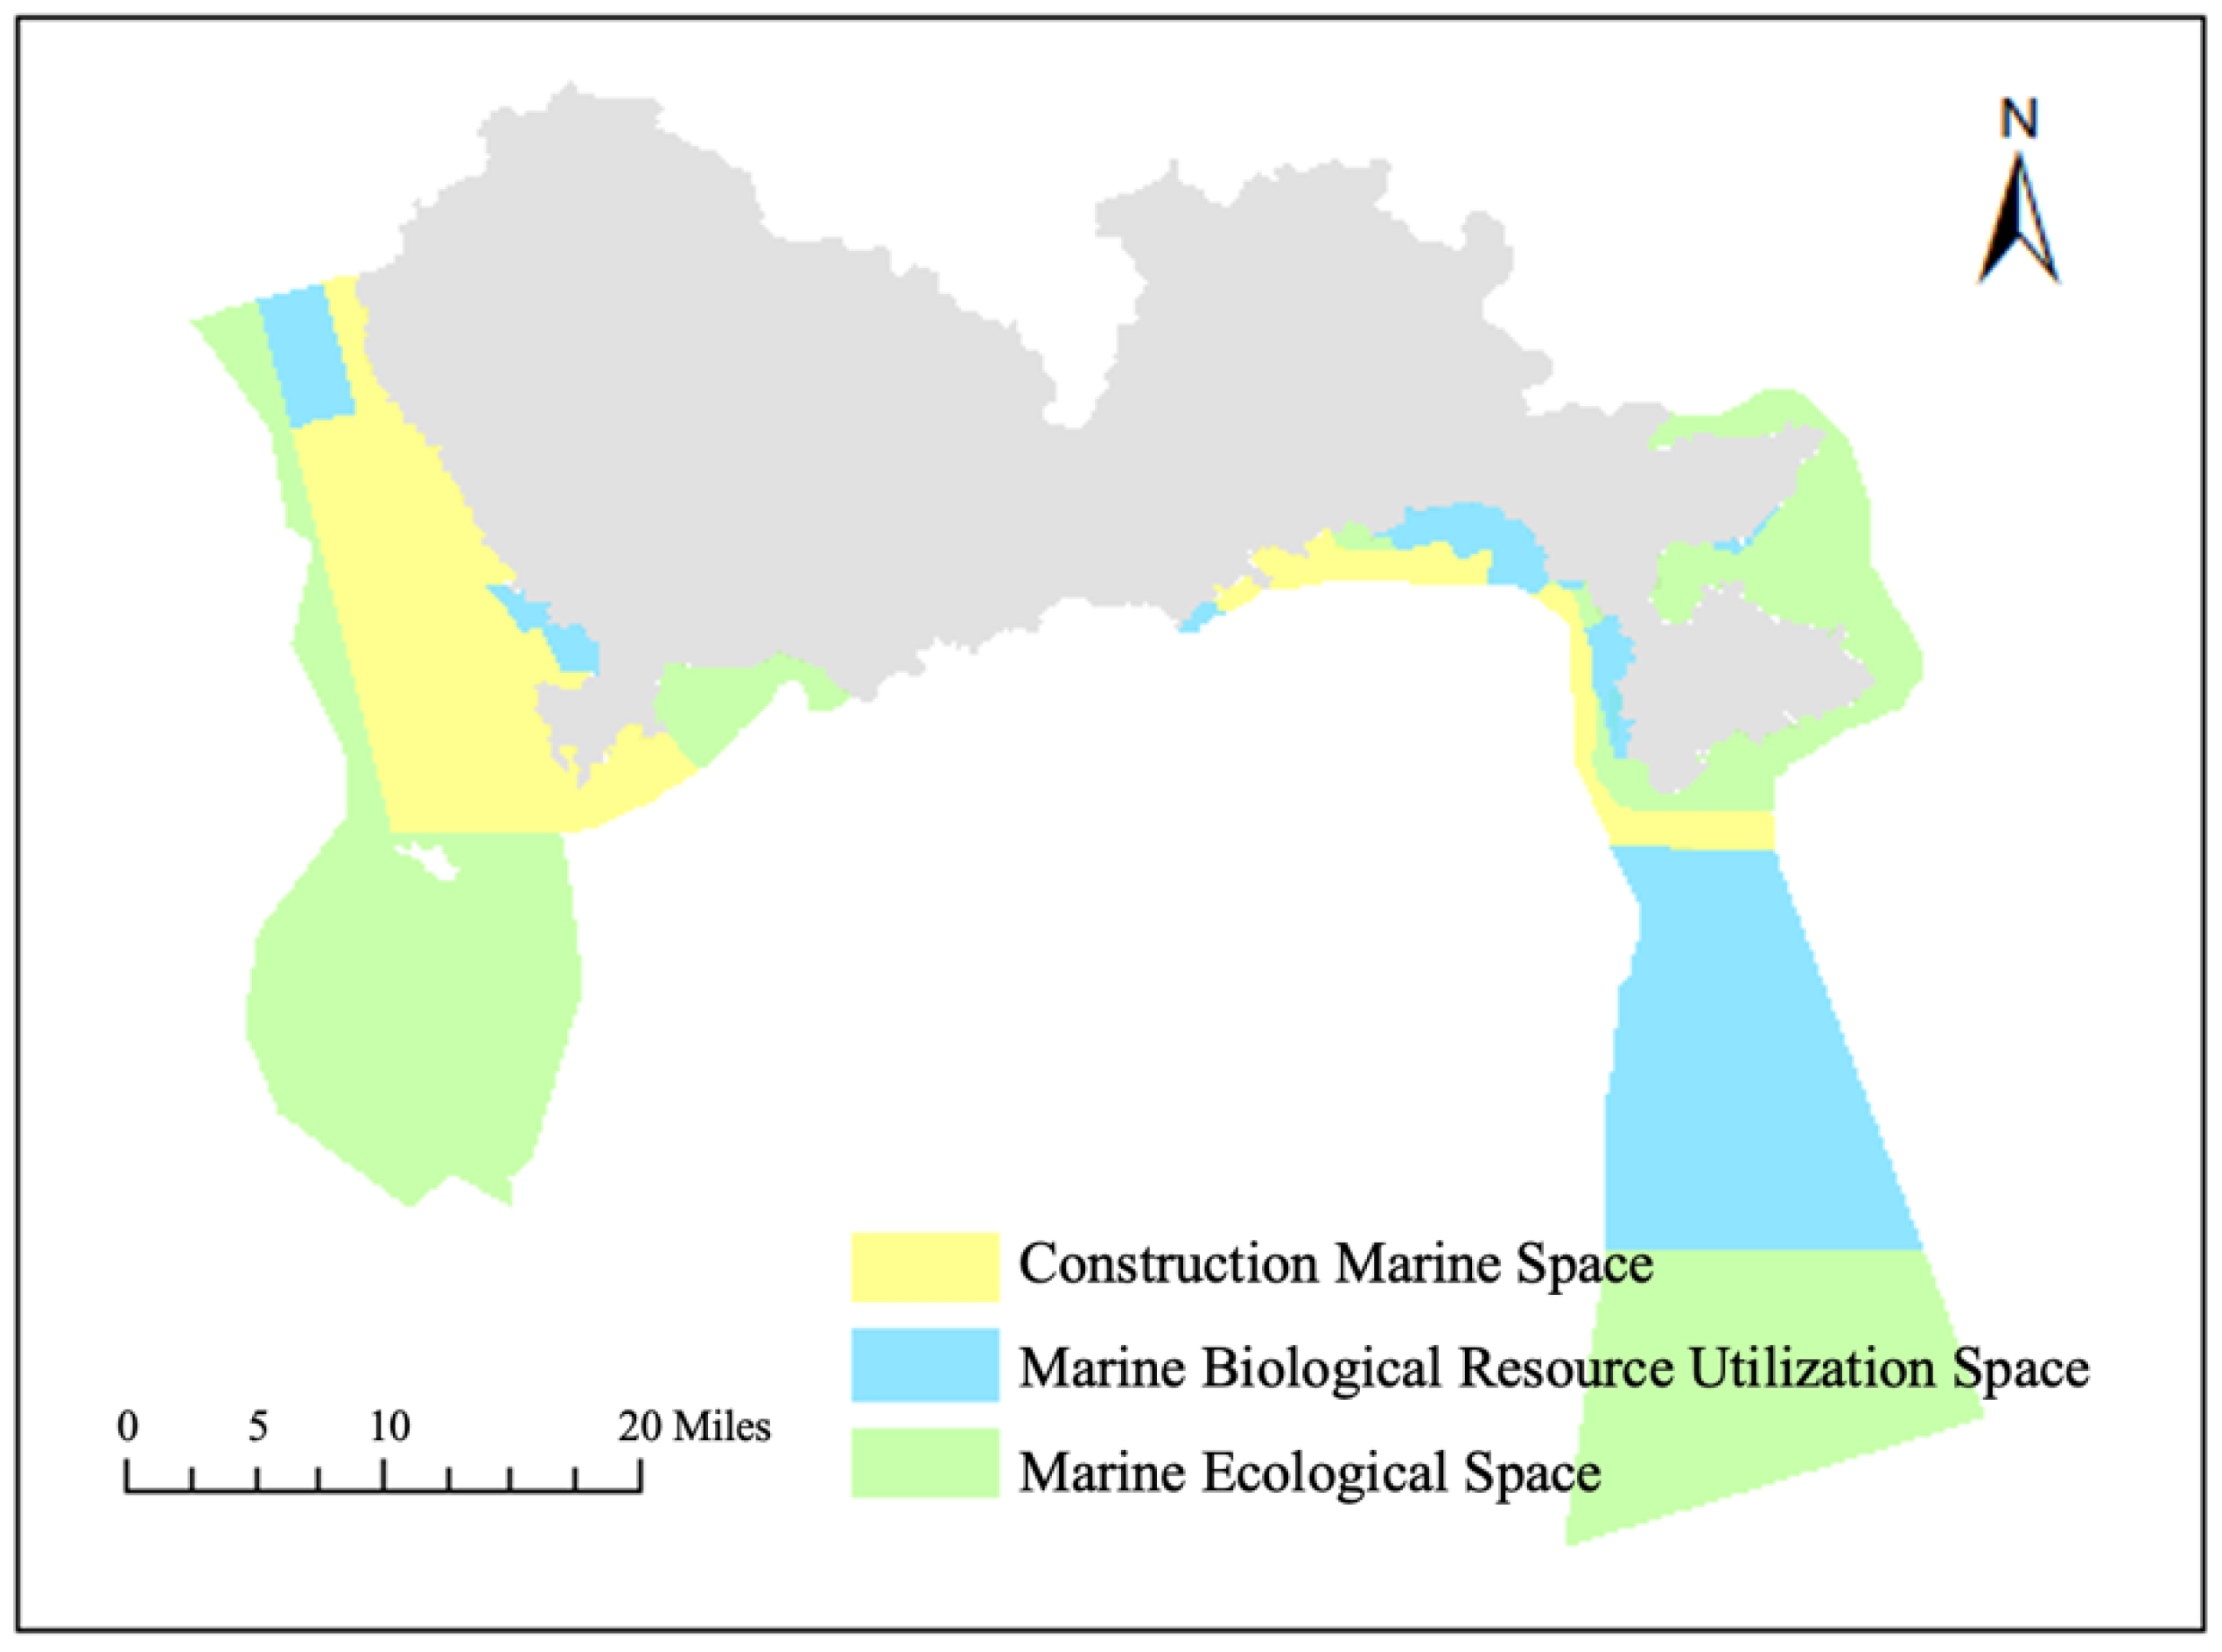
3.2. Results of Marine Zone Division and Development Suitability Evaluation

The evaluation of the marine ecological environment primarily assessed the carrying capacity of the evaluation units by integrating various indicators. The evaluation of marine ecosystems focused on assessing ecological significance, emphasizing the regulatory roles of natural ecosystems and taking into account factors such as marine biodiversity and the overall health of the ecological environment. This comprehensive evaluation aimed to capture the overall status of marine ecosystems.
The results of the selected indicator weights for the marine evaluation in Shenzhen are presented in Table 5.
The quality of the marine environment served as a direct reflection of the current conditions of the maritime area, with indicators such as water quality being utilized for a comprehensive assessment. The marine ecological spatial suitability evaluation results were derived by integrating assessments from these three aspects, as shown in Figure 3.
The suitability assessment of marine construction space combined evaluations of marine spatial resources, environmental constraints, and the extent of the demand for land reclamation. The analysis primarily focused on factors such as the spatial distance between evaluation units and existing reclamation areas, the spatial proximity of residential areas to marine industrial clusters, access to port facilities, and connections to major transportation routes. It also excluded high-slope coastal areas, which were identified as geomorphological restrictions that are unsuitable for reclamation or marine construction.
A comprehensive evaluation of marine construction space suitability was conducted across the entire maritime area, as depicted in Figure 3. Additionally, the evaluation process revealed that certain existing marine areas designated for construction were not particularly suitable for such purposes compared to other marine functional zoning. For regions within the current marine functional zoning that are small and possess limited potential for future expansion, it was suggested that these areas should gradually be phased out from marine construction use.
The evaluation of marine biological resource utilization space suitability was conducted by integrating various aspects, including marine fishery resources, marine environmental quality, marine ecosystems, and maritime traffic advantages. This comprehensive assessment aimed to determine the suitability of spaces for the utilization of marine biological resources, as illustrated in Figure 4. After delineating the three-zone scheme, a specific layout for marine functional zoning was proposed in accordance with the marine spatial zoning framework. Based on the evaluations of marine ecological space suitability, construction space suitability, and marine biological resource utilization space suitability, combined with established marine spatial determination standards, the marine spatial zoning plan for Shenzhen was developed. This plan formed the basis for the delineation of the marine functional zoning layout, as illustrated in Figure 4 and Figure 5.
The framework effectively balanced the competing demands in Shenzhen. Ecological preservation was given priority, with 38.53% of the coastline (100.4 km) maintaining its natural geomorphological features. These areas ranked highest in terms of ecological value and biodiversity. Urban development was strategically focused on areas with lower ecological sensitivity, such as industrial zones near existing ports like Shenzhen Bay, where indices for shoreline development intensity suggested they were suitable for expansion. Fisheries and tourism were designated for areas meeting water quality standards and possessing high transportation accessibility.
The entropy-weighted approach addressed the trade-offs between various indicators, giving precedence to ecological carrying capacity and seawater quality in the zoning process, consistent with Shenzhen’s commitment to ecosystem health. GIS analysis highlighted underutilized areas, particularly along the modified western coastline of Shenzhen, facilitating the reallocation of 34% of marine areas for urban development, while 26% was reserved for ecological preservation.
The replicability of the framework was evaluated based on its methodological transparency and adherence to international standards. The 1 km2 grid system is scalable and compatible with global satellite data such as Sentinel-2 imagery. Additionally, the framework aligns with China’s Territorial Spatial Planning and the EU Marine Spatial Planning Directive, enhancing its applicability in regions with similar governance systems. Shenzhen’s approach to cross-departmental data sharing also provides a model for collaborative stakeholder engagement.

4. Discussion

The findings of this study emphasize the effectiveness of integrating ecological, environmental, and socioeconomic factors into marine spatial zoning through a systematic suitability evaluation framework. By utilizing a hierarchical indicator system and an entropy-weighted comprehensive index method, this approach addresses key limitations in traditional zoning models, particularly their static nature and limited adaptability to dynamic environmental changes. The inclusion of high-resolution spatial data and machine learning algorithms, as demonstrated in cases like Zhejiang’s Xiangshan Port, showcases the potential of advanced technologies to enhance the precision of suitability assessments. For example, the use of Shannon–Wiener biodiversity indices and ecological health metrics facilitates a quantifiable evaluation of ecosystem resilience, aligning with global trends in marine spatial planning that prioritize ecosystem service valuation (e.g., carbon sequestration and habitat protection) [13,15].
A key strength of this study is its emphasis on adaptive zoning mechanisms, such as buffer zones in Shanghai’s Chongming Island and storm surge-resilient wetland parks in Guangzhou’s Nansha New Area, which reflect a proactive response to climate-induced risks. These examples validate the necessity of incorporating dynamic thresholds (e.g., coastline development intensity indices) into zoning frameworks to strike a balance between ecological preservation and economic development. Furthermore, the integration of stakeholder participation mechanisms, exemplified by Hainan’s ecological compensation fund for coral reef restoration, aligns with international best practices in transboundary governance [18,28]. Such collaborative models not only reduce conflicts between industries and conservation but also promote long-term compliance with zoning regulations.
The choice of a 1 km grid for Shenzhen’s marine area aligns with China’s national marine monitoring standards (e.g., GB/T 17108-2006) and the resolution of Sentinel-2 satellite data (10–60 m), ensuring compatibility with existing environmental datasets such as water and sediment quality. Coarser resolutions, such as 5 km, would obscure critical coastal gradients, while finer resolutions (e.g., 100 m) would exceed the precision of socioeconomic datasets, such as port accessibility metrics. For Shenzhen’s 1145 km2 marine area, a 1 km grid generates 1145 evaluation units, which is computationally manageable for entropy-weighted multi-criteria analysis. Using finer resolutions (e.g., 500 m) would quadruple computational demands without yielding proportional gains in planning granularity.
China’s territorial spatial planning guidelines recommend 1 km grids for provincial-scale zoning, ensuring consistency with higher-level planning frameworks. This allows vertical integration of local zoning into regional and national strategies. While the 1 km × 1 km grid adequately supported Shenzhen’s regional planning objectives, scale dependencies introduced measurable uncertainties in habitat-level assessments and coastal interface dynamics. Future work should focus on integrating adaptive grid systems and probabilistic uncertainty analysis to enhance the framework’s robustness across diverse coastal geomorphologies. This reflection strengthens the transparency of spatial decision making in marine zoning, aligning with global best practices in ecosystem-based management.
The proposed marine spatial zoning framework in Shenzhen aligns closely with China’s national “Territorial Spatial Planning (2020–2035)” through several key dimensions [70,71,72]. (1) It prioritizes ecological protection by emphasizing marine ecological spaces, with 38.53% of the coastline preserved in its natural state. This approach directly supports the national “ecological protection red line” strategy, aiming to protect 15% of territorial waters as ecological reserves by 2035. It also ensures that coastal cities maintain at least 35% natural shoreline retention, as stipulated by national policies. (2) The framework integrates multi-functional zoning, comprising ecological protection (26%), construction (34%), and biological resources (40%). This reflects the national “Three Zones and Three Lines” approach, where ecological control areas (22% of marine space) are designated as no-development zones, urban reserved areas offer flexible growth boundaries, and fisheries–tourism zones optimize agricultural production space. The framework uses an entropy-weighted index method to balance ecological (45% weight) and development (55%) factors, thereby meeting the national target of a 60:40 ecological–production–living space ratio. (3) The zoning incorporates climate resilience features such as storm surge buffer zones and dynamic shoreline development intensity indices. These adaptive measures support national requirements for coastal cities to establish 100–200 m climate adaptation buffers and ensure that artificial coastlines remain below 65% by 2035. With annual infrastructure growth constrained by carrying capacity limits (23.7%), the zoning strategy aligns with national climate resilience objectives. The zoning framework also emphasizes data-driven governance, employing 1 km2 grid-based GIS analysis and machine learning tools to meet national mandates for marine environmental monitoring. These technologies enable real-time tracking of water quality parameters and ensure 90% monitoring coverage. The study’s digitization of Shenzhen’s 260.5 km coastline exceeds the national 1:10,000 scale mapping standard, facilitating precise and informed zoning decisions.
The integrated sea level rise and coastal zone adaptation zoning strategy for Shenzhen addresses the challenges of sea level rise and coastal management [73,74]. The western coast of Shenzhen, stretching from 22°32′ N to 22°40′ N, is 61.47% artificial, with reclamation and port construction obstructing tidal flows and sediment transport. This has led to a 42% reduction in intertidal habitats, based on GIS historical land use analysis, and has accelerated erosion rates. In contrast, the eastern coast remains 38.53% natural, with relatively stable sediment processes, although it faces future threats from sea level rise. Future sea level rise scenarios are based on localized IPCC RCP projections. Under the RCP 4.5 (moderate emissions) scenario, the sea level is expected to rise by 0.3–0.6 m by 2100, representing a medium risk. Under the RCP 8.5 (high emissions) scenario, the rise is projected to be 0.6–1.1 m by 2100, indicating a high risk [75]. Additionally, Shenzhen faces vertical land motion due to groundwater extraction, with a subsidence rate of 2–4 mm per year, which must be factored into sea level rise projections to adjust for absolute elevation loss [76].
Adaptation zoning thresholds will be adjusted accordingly in the future work. In ecological protection zones, new indicators include habitat elevation thresholds (such as mangrove elevation greater than 1.2 m) and coral bleaching risks. The ecological health status now includes predictions for habitat loss due to intertidal zone inundation. In Dapeng Bay, a dynamic buffer zone of 500–800 m has been piloted, prohibiting construction and allowing real-time monitoring of erosion and sedimentation data. For urban development zones, the shoreline development intensity is assessed using GIS-based inundation models to downgrade development scores for areas below the projected high tide lines. Additionally, a flood risk index integrates storm surge recurrence intervals, taking into account the increased frequency of 100-year return events. In biological resource utilization zones, the fisheries resource carrying capacity index simulates the impact of salinity intrusion on fish spawning grounds. Water quality standards are strengthened, particularly in estuarine areas, to monitor salinity gradients.
Dynamic zoning and model applications are also incorporated. Morphodynamic models will update marine protected area boundaries every 5–10 years to ensure sediment transport connectivity. Reclamation in low-lying areas, such as Qianhai and Shekou, will be restricted, and priority will be given to the redevelopment of existing land. The governance mechanisms include vertical integration with national and regional climate adaptation frameworks, such as the “National Climate Adaptation 2035” and the “Guangdong Coastal Zone Resilience Guidelines”. Horizontal coordination involves the establishment of a land development rights trading mechanism to compensate for economic losses in restricted development zones. This integrated approach aims to adapt Shenzhen’s coastal zone management to the challenges posed by sea level rise, ensuring sustainable development and ecological preservation.
The entropy-weighted multi-criteria framework reduces subjective bias by objectively quantifying ecological and developmental factors. However, it has limitations. The analysis relies on 2023–2024 water quality data (TOC, COD, nutrients) from fixed monitoring stations (e.g., Shenzhen Bay, West Bay) and a 1 km grid resolution. This static approach may overlook micro-scale coastal dynamics, such as sediment transport in western Shenzhen’s 61.47% artificial coastline, and temporal variations like algal bloom frequency, which require higher-resolution hydrodynamic modeling. Additionally, spatial validation gaps exist. While the framework identifies underutilized coastal areas, it lacks ground-truthing of suitability classifications against actual land-use patterns. For example, Nan’ao (114°28′ E) is categorized as high ecological suitability, but it faces tourism development pressures not fully captured by shoreline development intensity metrics. Similarly, Qianhai’s reclaimed zones (113°53′ E) show medium construction suitability despite existing port congestion issues. To enhance the reliability of the framework, several research areas are proposed for the future work: (1) multi-temporal validation, where suitability maps are compared against 5-year shoreline change rates derived from Sentinel-2 (10 m resolution); (2) stakeholder calibration by incorporating local fisheries catch data (e.g., Dapeng Bay) to verify biological resource zoning; (3) dynamic modeling by integrating storm surge inundation models to establish climate-resilient suitability thresholds.
Future research should also focus on improving the adaptability of zoning models through real-time data assimilation and scenario-based simulations. Strengthening interdisciplinary collaboration—such as combining hydrodynamic models with socioeconomic projections—could enhance the responsiveness of zoning plans to emerging threats like sea level rise. Furthermore, expanding participatory mechanisms to include marginalized coastal communities would ensure equitable resource allocation and promote stewardship. By addressing these gaps, marine spatial zoning can evolve into a dynamic tool for achieving the dual objectives of ecological integrity and sustainable development in coastal cities.

5. Conclusions

This study established a systematic approach to marine spatial planning that harmonized ecological integrity with urban development imperatives in coastal cities. The Shenzhen case demonstrated that suitability-driven zoning, grounded in multi-dimensional indicator analysis, effectively identified underutilized marine spaces for sustainable redevelopment while safeguarding critical ecosystems. The key findings revealed that: (1) spatially explicit suitability mapping enabled the differentiation of priority zones for conservation, resource utilization, and infrastructure expansion; (2) entropy-weighted evaluation methods mitigated subjectivity in zoning decisions by objectively quantifying ecological and socioeconomic trade-offs; and (3) integrated GIS modeling facilitated dynamic spatial optimization aligned with regional development goals.
The framework’s implementation in Shenzhen underscored three critical lessons for global coastal governance: First, the prioritization of ecological protection zones through quantitative habitat assessments prevented irreversible marine degradation. Second, adaptive zoning of construction spaces near existing infrastructure clusters minimized environmental footprints while maximizing economic returns. Third, marine biological resource zones required strict water quality thresholds and transportation accessibility criteria to ensure sustainable productivity.
By resolving land–sea planning fragmentation through science-based decision tools, this research advanced marine spatial planning theory and practice. Future applications should incorporate climate resilience metrics and participatory stakeholder mechanisms to enhance zoning adaptability. The study conclusively demonstrated that integrated spatial planning—supported by robust data systems and ecological prioritization principles—provided a viable pathway for coastal cities to achieve UN Sustainable Development Goals (SDGs) while maintaining economic competitiveness.

Author Contributions

Conceptualization, Y.L. and H.Y. (Han Yu); methodology, H.Y. (Hongbing Yu); software, F.Z.; writing—original draft preparation, Y.L.; writing—review and editing, H.Y. (Hongbing Yu); funding acquisition, H.Y. (Han Yu). All authors have read and agreed to the published version of the manuscript.

Funding

This research was funded by Shenzhen Science and Technology Program, grant number No. KCXFZ20211020172542001.

Institutional Review Board Statement

Not applicable.

Informed Consent Statement

Not applicable.

Data Availability Statement

The data presented in this study are available on request from the corresponding author due to the data management regulations of the Shenzhen Research Institute of Nankai University.

Conflicts of Interest

The authors declare no conflicts of interest.

References

  1. Zhang, S.; Wu, Q.; Butt, M.J.; Lv, Y.M.; Wang, Y.E. Coastal cities governance in the context of integrated coastal zonal management: A sustainable development goal perspective under international environmental law for ‘coastal sustainability’. Front. Mar. Sci. 2024, 11, 1364554. [Google Scholar] [CrossRef]
  2. Sahavacharin, A.; Sompongchaiyakul, P.; Thaitakoo, D. The effects of land-based change on coastal ecosystems. Landsc. Ecol. Eng. 2022, 18, 351–366. [Google Scholar] [CrossRef]
  3. Maccarrone, V.; Scandura, P.; La Rosa, S.D. The Integrated Coastal Zone Management in the Anthropocene. In Coastal Sustainability: Insights from Southeast Asia and Beyond; Springer Nature: Cham, Switzerland, 2024; pp. 1–20. [Google Scholar]
  4. Thorne, K.M.; MacDonald, G.M.; Chavez, F.P.; Ambrose, R.F.; Barnard, P.L. Significant challenges to the sustainability of the California coast considering climate change. Proc. Natl. Acad. Sci. USA 2024, 121, e2310077121. [Google Scholar] [CrossRef] [PubMed]
  5. Teng, X.; Zhao, Q.; Zhang, P.; Liu, L.; Dong, Y.E.; Hu, H.; Yue, Q.; Ou, L.; Xu, W. Implementing marine functional zoning in China. Mar. Policy 2021, 132, 103484. [Google Scholar] [CrossRef]
  6. Bhattacharya, S.; Sachdev, B.K. Impact of Scientific Innovation in Coastal Resource Management: Fostering Blue Economic Development, Environmental Mitigation, and Pollution Control. In Scientific Innovations for Coastal Resource Management; IGI Global: Hershey, PA, USA, 2024; pp. 1–32. [Google Scholar]
  7. Tocco, C.L.; Frehen, L.; Forse, A.; Ferraro, G.; Failler, P. Land-sea interactions in European marine governance: State of the art, challenges and recommendations. Environ. Sci. Policy 2024, 158, 103763. [Google Scholar] [CrossRef]
  8. Stanković, J.J.; Marjanović, I.; Papathanasiou, J.; Drezgić, S. Social, economic and environmental sustainability of port regions: Mcdm approach in composite index creation. J. Mar. Sci. Eng. 2021, 9, 74. [Google Scholar] [CrossRef]
  9. Shampa, M.T.A.; Shimu, N.J.; Chowdhury, K.A.; Islam, M.M.; Ahmed, M.K. A comprehensive review on sustainable coastal zone management in Bangladesh: Present status and the way forward. Heliyon 2023, 9, e18190. [Google Scholar] [CrossRef]
  10. Albotoush, R.; Shau-Hwai, A.T. An authority for marine spatial planning (MSP): A systemic review. Ocean. Coast. Manag. 2021, 205, 105551. [Google Scholar] [CrossRef]
  11. Stelzenmüller, V.; Cormier, R.; Gee, K.; Shucksmith, R.; Gubbins, M.; Yates, K.L.; Morf, A.; Nic Aonghusa, C.; Mikkelsen, E.; Tweddle, J.; et al. Evaluation of marine spatial planning requires fit for purpose monitoring strategies. J. Environ. Manag. 2021, 278, 111545. [Google Scholar] [CrossRef]
  12. Santos, C.F.; Agardy, T.; Andrade, F.; Crowder, L.B.; Ehler, C.N.; Orbach, M.K. Major challenges in developing marine spatial planning. Mar. Policy 2021, 132, 103248. [Google Scholar] [CrossRef]
  13. Friess, B.; Grémaud-Colombier, M. Policy outlook: Recent evolutions of maritime spatial planning in the European Union. Mar. Policy 2021, 132, 103428. [Google Scholar] [CrossRef]
  14. Gușatu, L.F.; Menegon, S.; Depellegrin, D.; Zuidema, C.; Faaij, A.; Yamu, C. Spatial and temporal analysis of cumulative environmental effects of offshore wind farms in the North Sea basin. Sci. Rep. 2021, 11, 10125. [Google Scholar] [CrossRef] [PubMed]
  15. Kusters, J.E.; van Kann, F.M.; Zuidema, C. Spatial conflict resolution in marine spatial plans and permitting procedures for offshore wind energy: An analysis of measures adopted in Denmark, England and the Netherlands. Front. Mar. Sci. 2025, 12, 1468734. [Google Scholar] [CrossRef]
  16. Kropinova, E. Transnational and cross-border cooperation for sustainable tourism development in the Baltic Sea Region. Sustainability 2021, 13, 2111. [Google Scholar] [CrossRef]
  17. Kropinova, E.G. Transborder Cooperation for Sustainable Tourism in the Baltic Sea Region. In Partnerships for the Goals; Springer International Publishing: Cham, Switzerland, 2021; pp. 1273–1291. [Google Scholar]
  18. Gómez, S.; Carreño, A.; Lloret, J. Cultural heritage and environmental ethical values in governance models: Conflicts between recreational fisheries and other maritime activities in Mediterranean marine protected areas. Mar. Policy 2021, 129, 104529. [Google Scholar] [CrossRef]
  19. Ramieri, E.; Bocci, M.; Brigolin, D.; Campostrini, P.; Carella, F.; Fadini, A.; Farella, G.; Gissi, E.; Madeddu, F.; Menegon, S.; et al. Designing and implementing a multi-scalar approach to Maritime Spatial Planning: The case study of Italy. Mar. Policy 2024, 159, 105911. [Google Scholar] [CrossRef]
  20. Basirati, M. Zoning Management in Marine Spatial Planning: Multi-Objective Optimization and Agent-Based Conflict Resolution. Ph.D. Thesis, Ecole Nationale Supérieure Mines-Télécom, Lille, France, 2022. [Google Scholar]
  21. Yin, Z.; Wu, J.; Song, J.; Yang, Y.; Zhu, X.; Wu, J. Multi-objective optimization-based reactive nitrogen transport modeling for the water-environment-agriculture nexus in a basin-scale coastal aquifer. Water Res. 2022, 212, 118111. [Google Scholar] [CrossRef]
  22. Xu, L.; Cui, S.; Wang, X.; Tang, J.; Nitivattananon, V.; Ding, S.; Nguyen, M.N. Dynamic risk of coastal flood and driving factors: Integrating local sea level rise and spatially explicit urban growth. J. Clean. Prod. 2021, 321, 129039. [Google Scholar] [CrossRef]
  23. Anderson, D.L.; Ruggiero, P.; Mendez, F.J.; Barnard, P.L.; Erikson, L.H.; O’Neill, A.C.; Merrifield, M.; Rueda, A.; Cagigal, L.; Marra, J. Projecting climate dependent coastal flood risk with a hybrid statistical dynamical model. Earth’s Future 2021, 9, e2021EF002285. [Google Scholar] [CrossRef]
  24. Den Hartog, H. Engineering an ecological civilization along Shanghai’s main waterfront and coastline: Evaluating ongoing efforts to construct an urban eco-network. Front. Environ. Sci. 2021, 9, 639739. [Google Scholar] [CrossRef]
  25. Dai, W.; Tan, Y. Study on Multi-Scenario Rain-Flood Disturbance Simulation and Resilient Blue-Green Space Optimization in the Pearl River Delta. Buildings 2024, 14, 3797. [Google Scholar] [CrossRef]
  26. Bourbonnais, M. Applications of geographic information systems, spatial analysis, and remote sensing in environmental impact assessment. In Routledge Handbook of Environmental Impact Assessment; Routledge: London, UK, 2022; pp. 201–220. [Google Scholar]
  27. Wang, P.; Zhou, J.; Zheng, K.; Lin, X.; Tan, M.L.; Shi, J.; Lin, X.; Yue, X.; Ma, X.; Zhang, F. Status and Evolving Characteristics of Marine Spatial Resources in the Hangzhou Bay Area of Zhejiang Province, China. J. Mar. Sci. Eng. 2025, 13, 98. [Google Scholar] [CrossRef]
  28. Leou, E.C.; Li, J.X. Target Duo: The project of “international tourism island” in hainan special economic zone, China. In Handbook of Research on Special Economic Zones as Regional Development Enablers; IGI Global Scientific Publishing: Hershey, PA, USA, 2022; pp. 206–233. [Google Scholar]
  29. Zhou, Y.; Jiang, C.; Jiang, Y.; Zhu, Y.; Jin, Y.; Wang, X.; Feng, X.; Feng, W. A whole process resilience management practice in coastal engineering. Front. Mar. Sci. 2025, 11, 1518249. [Google Scholar] [CrossRef]
  30. Zhang, Y.; Li, H.; Hou, X.; Guo, P.; Guo, J. Coastline protection and restoration: A comprehensive review of China’s developmental trajectory. Ocean. Coast. Manag. 2024, 251, 107094. [Google Scholar] [CrossRef]
  31. Baskent, E.Z. A thorough assessment of various forest management planning initiatives and development of improvement strategies towards an ecosystem-based planning. Environ. Dev. 2024, 50, 101006. [Google Scholar] [CrossRef]
  32. Jattak, Z.U.; Wu, W.; Gao, J.; Zhang, K.; Murtaza, S.H.; Jan, M.; Ahmed, A. Advancing the initiatives of sustainable coastal and marine areas development in Pakistan through marine spatial planning. Sci. Prog. 2023, 106, 00368504231218601. [Google Scholar] [CrossRef]
  33. Liu, Y.; Zhou, Y. Territory spatial planning and national governance system in China. Land Use Policy 2021, 102, 105288. [Google Scholar] [CrossRef]
  34. Yue, W.; Hou, B.; Ye, G.; Wang, Z. China’s land-sea coordination practice in territorial spatial planning. Ocean. Coast. Manag. 2023, 237, 106545. [Google Scholar] [CrossRef]
  35. Montefalcone, M.; Tunesi, L.; Ouerghi, A. A review of the classification systems for marine benthic habitats and the new updated Barcelona Convention classification for the Mediterranean. Mar. Environ. Res. 2021, 169, 105387. [Google Scholar] [CrossRef]
  36. Guyot-Téphany, J.; Davret, J.; Tissière, L.; Trouillet, B. Public participation in marine spatial planning in France: From minimal requirements to minimal achievements. Ocean. Coast. Manag. 2024, 256, 107310. [Google Scholar] [CrossRef]
  37. Santos, C.F.; Ehler, C.N.; Agardy, T.; Andrade, F.; Orbach, M.K.; Crowder, L.B. Marine spatial planning. In World Seas: An Environmental Evaluation; Academic Press: Cambridge, MA, USA, 2019; pp. 571–592. [Google Scholar]
  38. Foley, M.M.; Halpern, B.S.; Micheli, F.; Armsby, M.H.; Caldwell, M.R.; Crain, C.M.; Prahler, E.; Rohr, N.; Sivas, D.; Beck, M.W.; et al. Guiding ecological principles for marine spatial planning. Mar. Policy 2010, 34, 955–966. [Google Scholar] [CrossRef]
  39. Collie, J.S.; Beck, M.W.; Craig, B.; Essington, T.E.; Fluharty, D.; Rice, J.; Sanchirico, J.N. Marine spatial planning in practice. Estuar. Coast. Shelf Sci. 2013, 117, 1–11. [Google Scholar] [CrossRef]
  40. Gissi, E.; Fraschetti, S.; Micheli, F. Incorporating change in marine spatial planning: A review. Environ. Sci. Policy 2019, 92, 191–200. [Google Scholar] [CrossRef]
  41. Stelzenmüller, V.; Lee, J.; South, A.; Foden, J.; Rogers, S.I. Practical tools to support marine spatial planning: A review and some prototype tools. Mar. Policy 2013, 38, 214–227. [Google Scholar] [CrossRef]
  42. Schaefer, N.; Barale, V. Maritime spatial planning: Opportunities & challenges in the framework of the EU integrated maritime policy. J. Coast. Conserv. 2011, 15, 237–245. [Google Scholar]
  43. Schéré, C.M. The role of ecosystem management in achieving the conservation objectives of Irish Sea marine protected areas. Sea 2024, 27, 596–610. [Google Scholar]
  44. Levrel, H.; Kerbiriou, C.; Couvet, D.; Weber, J. OECD pressure–state–response indicators for managing biodiversity: A realistic perspective for a French biosphere reserve. Biodivers. Conserv. 2009, 18, 1719–1732. [Google Scholar] [CrossRef]
  45. GB/T 17108-2006; Technical Directives for the Division of Marine Function Zonation. General Administration of Quality Supervision, Inspection and Quarantine of the People’s Republic of China, Standardization Administration of the People’s Republic of China. Standards Press of China: Beijing, China, 2006.
  46. Keylock, C. Simpson diversity and the Shannon–Wiener index as special cases of a generalized entropy. Oikos 2005, 109, 203–207. [Google Scholar] [CrossRef]
  47. Strong, W.L. Biased richness and evenness relationships within Shannon–Wiener index values. Ecol. Indic. 2016, 67, 703–713. [Google Scholar] [CrossRef]
  48. Das, M.; Das, A.; Mandal, A. Research note: Ecosystem Health (EH) assessment of a rapidly urbanizing metropolitan city region of eastern India–A study on Kolkata Metropolitan Area. Landsc. Urban Plan. 2020, 204, 103938. [Google Scholar] [CrossRef]
  49. Qian, L.; Wang, F.; Cao, W.; Ding, S.; Cao, W. Ecological health assessment and sustainability prediction in coastal area: A case study in Xiamen Bay, China. Ecol. Indic. 2023, 148, 110047. [Google Scholar] [CrossRef]
  50. Zhang, F.; Sun, X.; Zhou, Y.; Zhao, C.; Du, Z.; Liu, R. Ecosystem health assessment in coastal waters by considering spatio-temporal variations with intense anthropogenic disturbance. Environ. Model. Softw. 2017, 96, 128–139. [Google Scholar] [CrossRef]
  51. Jayachandran, P.R.; Nandan, S.B.; Jima, M.; Philomina, J.; Vishnudattan, N.K. Benthic organisms as an ecological tool for monitoring coastal and marine ecosystem health. In Ecology and Biodiversity of Benthos; Elsevier: Amsterdam, The Netherlands, 2022; pp. 337–362. [Google Scholar]
  52. Spanton, P.I.; Saputra, A.A. Analysis of sea water pollution in coastal marine district tuban to the quality standards of sea water with using storet method. J. Kelaut. Indones. J. Mar. Sci. Technol. 2017, 10, 103–112. [Google Scholar] [CrossRef]
  53. Hübner, R.; Astin, K.B.; Herbert, R.J. Comparison of sediment quality guidelines (SQGs) for the assessment of metal contamination in marine and estuarine environments. J. Environ. Monit. 2009, 11, 713–722. [Google Scholar] [CrossRef]
  54. Kwok, K.W.; Batley, G.E.; Wenning, R.J.; Zhu, L.; Vangheluwe, M.; Lee, S. Sediment quality guidelines: Challenges and opportunities for improving sediment management. Environ. Sci. Pollut. Res. 2014, 21, 17–27. [Google Scholar] [CrossRef]
  55. Burton, G.A., Jr. Sediment quality criteria in use around the world. Limnology 2002, 3, 65–76. [Google Scholar] [CrossRef]
  56. Karydis, M.; Kitsiou, D. Marine water quality monitoring: A review. Mar. Pollut. Bull. 2013, 77, 23–36. [Google Scholar] [CrossRef]
  57. Russo, R.C. Development of marine water quality criteria for the USA. Mar. Pollut. Bull. 2002, 45, 84–91. [Google Scholar] [CrossRef]
  58. Boak, E.H.; Turner, I.L. Shoreline definition and detection: A review. J. Coast. Res. 2005, 21, 688–703. [Google Scholar] [CrossRef]
  59. Brown, M.T.; Vivas, M.B. Landscape development intensity index. Environ. Monit. Assess. 2005, 101, 289–309. [Google Scholar] [CrossRef]
  60. Zhang, T.; Niu, X. Analysis on the utilization and carrying capacity of coastal tidal flat in bays around the Bohai Sea. Ocean. Coast. Manag. 2021, 203, 105449. [Google Scholar] [CrossRef]
  61. Núñez, S.A.; Cancelas, N.G.; Orive, A.C. Setting of weighting factors influencing the determination of the location of Dry Ports using a DELPHI methodology. In Proceedings of the Scientific Conference, Zilina, Slovakia, 10–14 June 2023. [Google Scholar]
  62. Karakikes, I.; Nathanail, E. Using the Delphi method to evaluate the appropriateness of urban freight transport solutions. Smart Cities 2020, 3, 1428–1447. [Google Scholar] [CrossRef]
  63. Núñez, S.A.; Cancelas, N.G.; Orive, A.C. DELPHI methodology used for determining weighting factors influencing the location of Dry Ports. News Eng. 2014, 2, 1339–4886. [Google Scholar]
  64. Hirschhorn, F. Reflections on the application of the Delphi method: Lessons from a case in public transport research. Int. J. Soc. Res. Methodol. 2019, 22, 309–322. [Google Scholar] [CrossRef]
  65. Kelso, W.E.; Kaller, M.D.; Rutherford, D.A. Collecting, processing, and identification of fish eggs and larvae and zooplankton. In Fisheries Techniques; American Fisheries Society: Bethesda, MD, USA, 2012; pp. 363–452. [Google Scholar]
  66. Li, Y.; Zhao, L.; Suo, J. Comprehensive assessment of marine ecological environment based on entropy weight model. Pol. J. Environ. Stud. 2015, 24, 151–155. [Google Scholar]
  67. Zhu, Y.; Tian, D.; Yan, F. Effectiveness of entropy weight method in decision making. Math. Probl. Eng. 2020, 2020, 3564835. [Google Scholar] [CrossRef]
  68. Yang, S.; Ren, L.; Gou, L. An empirical study on the environmental carrying capacity of marine resources based on the entropy-weight TOPSIS model. J. Coast. Res. 2022, 38, 1037–1049. [Google Scholar] [CrossRef]
  69. Sun, B.; Yang, X.; Zhang, Y.; Chen, X. Evaluation of water use efficiency of 31 provinces and municipalities in China using multi-level entropy weight method synthesized indexes and data envelopment analysis. Sustainability 2019, 11, 4556. [Google Scholar] [CrossRef]
  70. Xiong, J.; Yue, W.; Xia, H.; Wang, T.; Liu, Y.; Pijanowski, B.C. Will China’s territorial spatial planning policies enhance land use sustainability? An integrated assessment under global environmental change. Resour. Environ. Sustain. 2025, 21, 100228. [Google Scholar] [CrossRef]
  71. Li, Y.; Zhang, F.; Li, R.; Yu, H.; Chen, Y.; Yu, H. Comprehensive Ecological Functional Zoning: A Data-Driven Approach for Sustainable Land Use and Environmental Management—A Case Study in Shenzhen, China. Land 2024, 13, 1413. [Google Scholar] [CrossRef]
  72. Yu, H.; Zhang, F.; Yu, H.; Li, Y. From Shoreline to Sea: Evaluating Development Suitability Through Coastal Zoning and a Case Study from Shenzhen, China. Sustainability 2025, 17, 1204. [Google Scholar] [CrossRef]
  73. Wang, X.; Li, Y.; Zhang, Q. Prioritising local sea level rise adaptation pathways in Shenzhen and Hong Kong using cost-benefit analysis. Ocean. Coast. Manag. 2024, 253, 107158. [Google Scholar] [CrossRef]
  74. Cai, R.; Liu, K.; Tan, H.; Yan, X. Climate change and China’s coastal zones and seas: Impacts, risks, and adaptation. Chin. J. Popul. Resour. Environ. 2021, 19, 304–310. [Google Scholar] [CrossRef]
  75. Horton, B.P.; Khan, N.S.; Cahill, N.; Lee, J.S.; Shaw, T.A.; Garner, A.J.; Kemp, A.C.; Engelhart, S.E.; Rahmstorf, S. Estimating global mean sea-level rise and its uncertainties by 2100 and 2300 from an expert survey. NPJ Clim. Atmos. Sci. 2020, 3, 18. [Google Scholar] [CrossRef]
  76. Wang, S.; Wang, G.; Huang, M.; Song, J.; Yang, X.; Zhang, T.; Ji, W.; Zhang, S.; Wu, W.; Wei, C.; et al. Spatio-Temporal Characteristics of Land Subsidence and Driving Factors Analysis in Shenzhen. Water 2024, 16, 1200. [Google Scholar] [CrossRef]
Figure 1. Shenzhen City and its location in Guangdong Province, China.
Sustainability 17 04480 g001
Figure 2. The boundary of marine area of Shenzhen.
Sustainability 17 04480 g002
Figure 3. Marine spatial suitability evaluation results including (a) marine ecological space, (b) construction marine space, and (c) marine biological resource utilization space.
Sustainability 17 04480 g003
Figure 4. Marine spatial zoning plan of Shenzhen.
Sustainability 17 04480 g004
Figure 5. Marine functional zoning layout plan of Shenzhen.
Sustainability 17 04480 g005
Table 1. Small-scale marine spatial zoning system.
Types of Marine SpaceFunction Areas
Marine Ecological SpaceEcological Protection Areas
Ecological Control Areas
Construction Marine SpaceUrban Reserved Areas
Industrial Communication Use Areas
Transportation Use Areas
Marine Biological Resource Utilization SpaceFisheries Use Areas
Tourism and Recreation Use Areas
Table 3. Marine spatial zoning plan based on suitability evaluation.
Suitability of Marine Ecological SpaceConstruction Marine SpaceMarine Biological Resource Utilization SpaceType of Suggestions
HighHigh/Medium/LowHigh/Medium/LowMarine Ecological Space
MediumHigh/Medium/LowHighMarine Biological Resource Utilization Space
MediumHighMediumConstruction Marine Space
MediumMediumMediumMarine Ecological Space
MediumLowMediumMarine Ecological Space
MediumHighLowConstruction Marine Space
MediumMediumLowMarine Ecological Space
MediumLowLowMarine Ecological Space
LowHigh/Medium/LowHighMarine Biological Resource Utilization Space
LowHighMediumConstruction Marine Space
LowMediumMediumMarine Biological Resource Utilization Space
LowLowMediumMarine Biological Resource Utilization Space
LowHighLowConstruction Marine Space
LowMediumLowConstruction Marine Space
LowLowLowMarine Ecological Space
Table 4. Summary of data sources.
Data TypeYearFormatResolutionSource
Coastline and Marine Boundaries2023Shapefile1:10,000Shenzhen Municipal Bureau of Planning and Natural Resources
Water Quality Parameters2023–2024CSVDaily, 1 km gridNational Marine Environmental Monitoring Centers (Shenzhen Bay, West Bay)
Sentinel-2 Satellite Imagery2023GeoTIFF10 m (multispectral)European Space Agency (ESA)
Marine Biodiversity Indices2023Raster/CSV1 km gridState Oceanic Administration
Socioeconomic Data (Ports, Roads)2023Shapefile1:50,000Shenzhen Urban Planning Database
Sediment Quality Metrics2023CSV1 km gridNational Marine Environmental Monitoring Centers
Land Reclamation Records2015–2023ExcelProject-levelShenzhen Coastal Zone Management Authority
Table 5. Weighting results of indicators used for marine evaluation in Shenzhen.
Evaluation ObjectiveSecondary IndicatorTertiary IndicatorIndicator Weights
Marine Ecological SpaceMarine EcosystemEcological Importance0.1958
Marine Biodiversity0.1005
Ecological Health Status0.1060
Marine Ecological Environment EvaluationMarine Environmental Carrying Index0.1680
Marine Ecological Carrying Index0.1539
Marine Environmental QualitySeawater Quality0.1075
Marine Sediment Quality0.0843
Marine Biological Quality0.0840
Construction Marine SpaceMarine Space Resource EvaluationShoreline Development Intensity0.1784
Marine Area Development Intensity0.1702
Resource Environment ConstraintsMarine Development Potential0.1632
Land Reclamation Resource--0.1521
Transportation AdvantageDistance to Residential Areas 0.0603
Distance to Ports 0.0906
Distance to Roads0.0976
Distance to Offshore Islands0.0876
Marine Biological Resource Utilization SpaceMarine Fisheries Resource EvaluationFisheries Resource Carrying Index0.1557
Marine Environmental QualitySeawater Quality0.1395
Marine Sediment Quality0.0943
Marine Biological Quality0.0990
Marine EcosystemEcological Importance0.1384
Marine Biodiversity0.0661
Ecological Health Status0.0851
Transportation AdvantageDistance to Residential Areas 0.0554
Distance to Ports 0.0501
Distance to Roads0.0721
Distance to Offshore Islands0.0443
Disclaimer/Publisher’s Note: The statements, opinions and data contained in all publications are solely those of the individual author(s) and contributor(s) and not of MDPI and/or the editor(s). MDPI and/or the editor(s) disclaim responsibility for any injury to people or property resulting from any ideas, methods, instructions or products referred to in the content.

