Water Resource Tax and Green Industrial Development: Reform from the Largest Emerging Economy

Abstract
1. Introduction

| Groups in the World Economic Outlook Classification | Country Name | Instrument Name | Effective First Year | Intervention |
|---|---|---|---|---|
| Advanced Economies | Belgium | Groundwater tax | 1997 | Use |
| Cyprus | Water use tax | 2017 | Use | |
| Denmark | Duty on piped water | 1994 | Use | |
| France | Charge on water abstraction | 1964 | Use | |
| Israel | Extra-use water levy | 2009 | Use | |
| Japan | Water and land utilization tax | 1989 | Use | |
| Latvia | Tax on the use of water resources for production of electricity | 2014 | Production | |
| Spain | Tax on the use of continental waters for the production of electric energy | 2013 | Production | |
| United States | Public community water system tax | 1984 | Use | |
| Emerging Market and Developing Economies | China | Water resources tax | 2016 | Production |
| Costa Rica | Water use Levy | 1999 | Use | |
| Mongolia | Tax on water use | Use | ||
| Morocco | Tax on mineral and drinking water | Production |
2. Policy Background and Theoretical Analysis
2.1. Policy Background
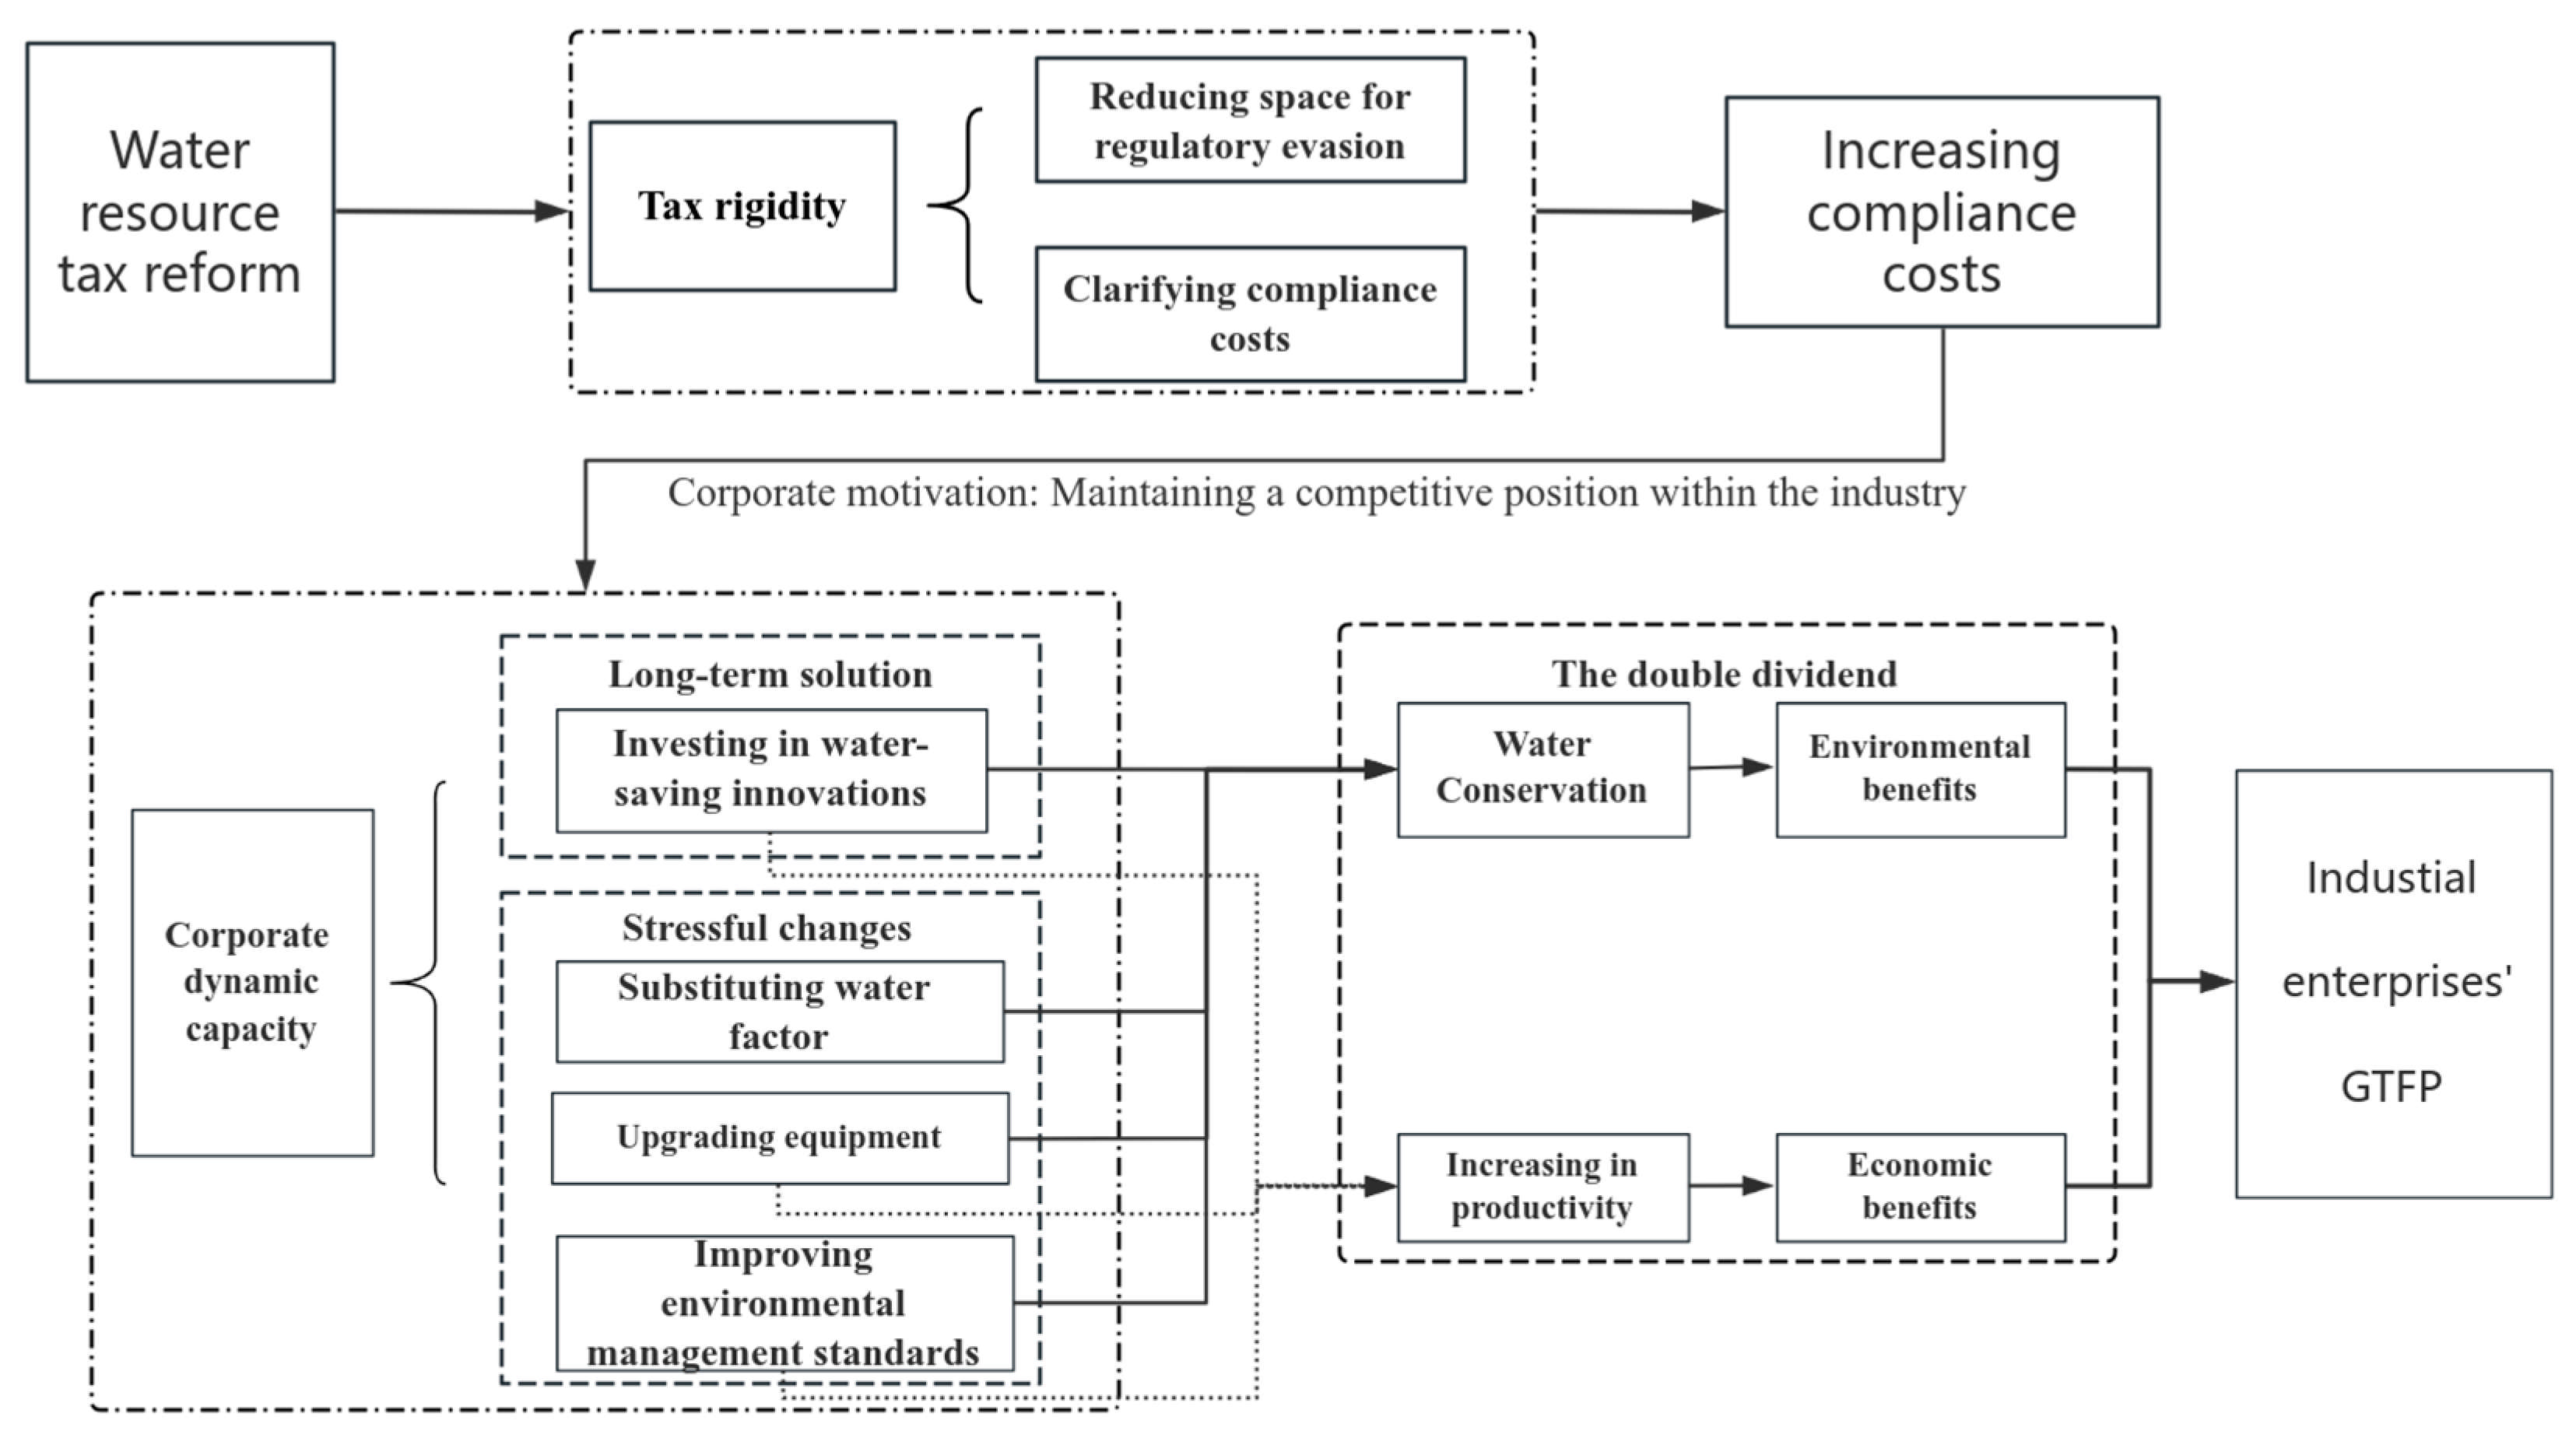
2.2. Theoretical Analysis
3. Research Design
3.1. Sample Selection and Description of Data
3.2. Variables Measurement
3.2.1. Explained Variable
3.2.2. Explanatory Variable
3.2.3. Control Variables
3.3. Empirical Strategy and Model Set
4. Empirical Results
4.1. DID Estimation
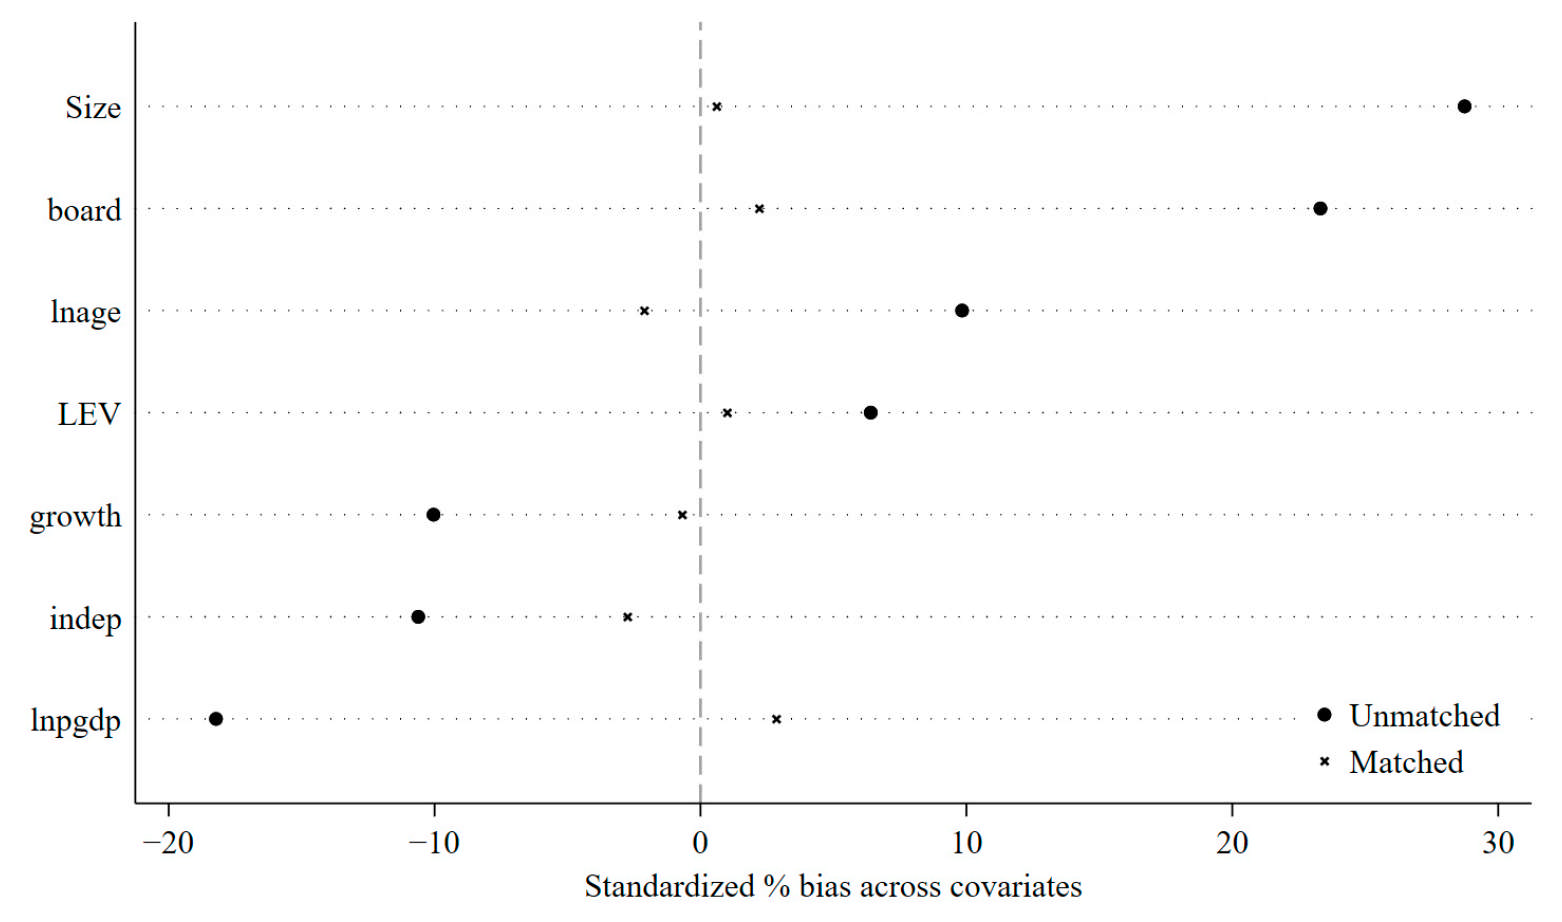
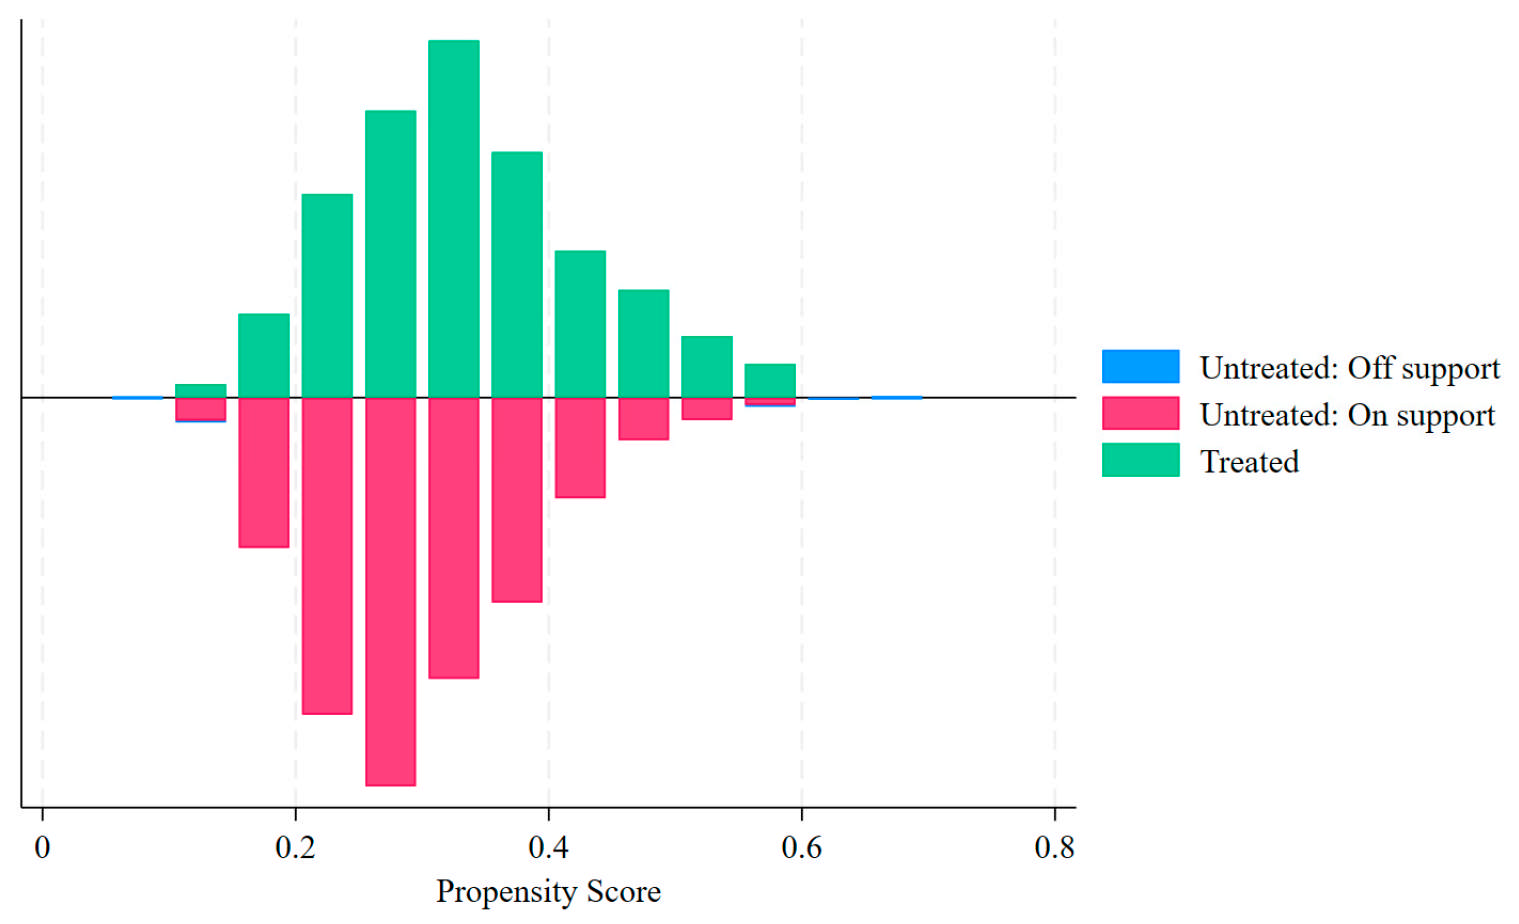
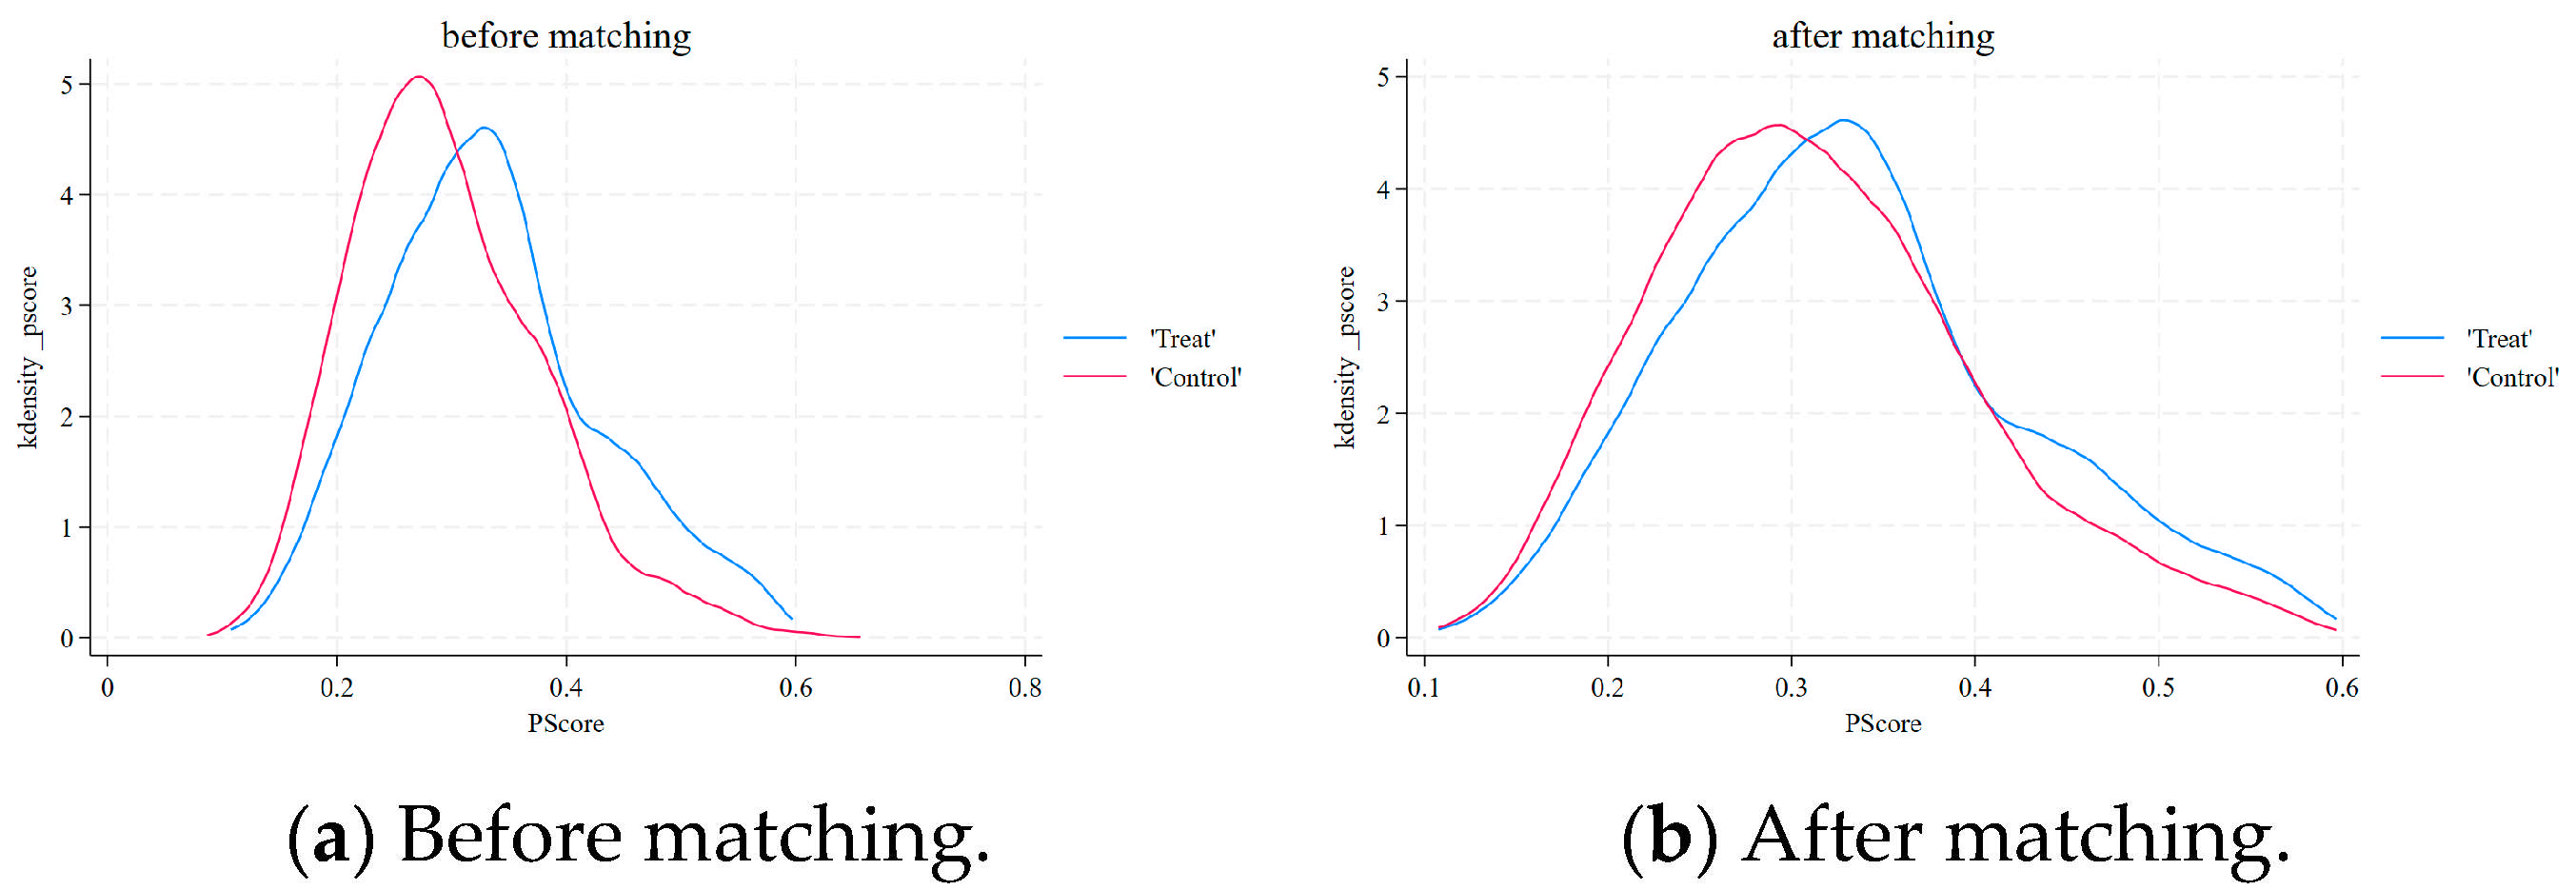
4.2. PSM Analysis
4.3. PSM-DID Estimation
4.4. Heterogeneity Analysis
4.4.1. Industrial Water Consumption Intensity
4.4.2. Degree of Industrial Competition
4.4.3. Voluntary Environment Management
4.5. Robustness Checks
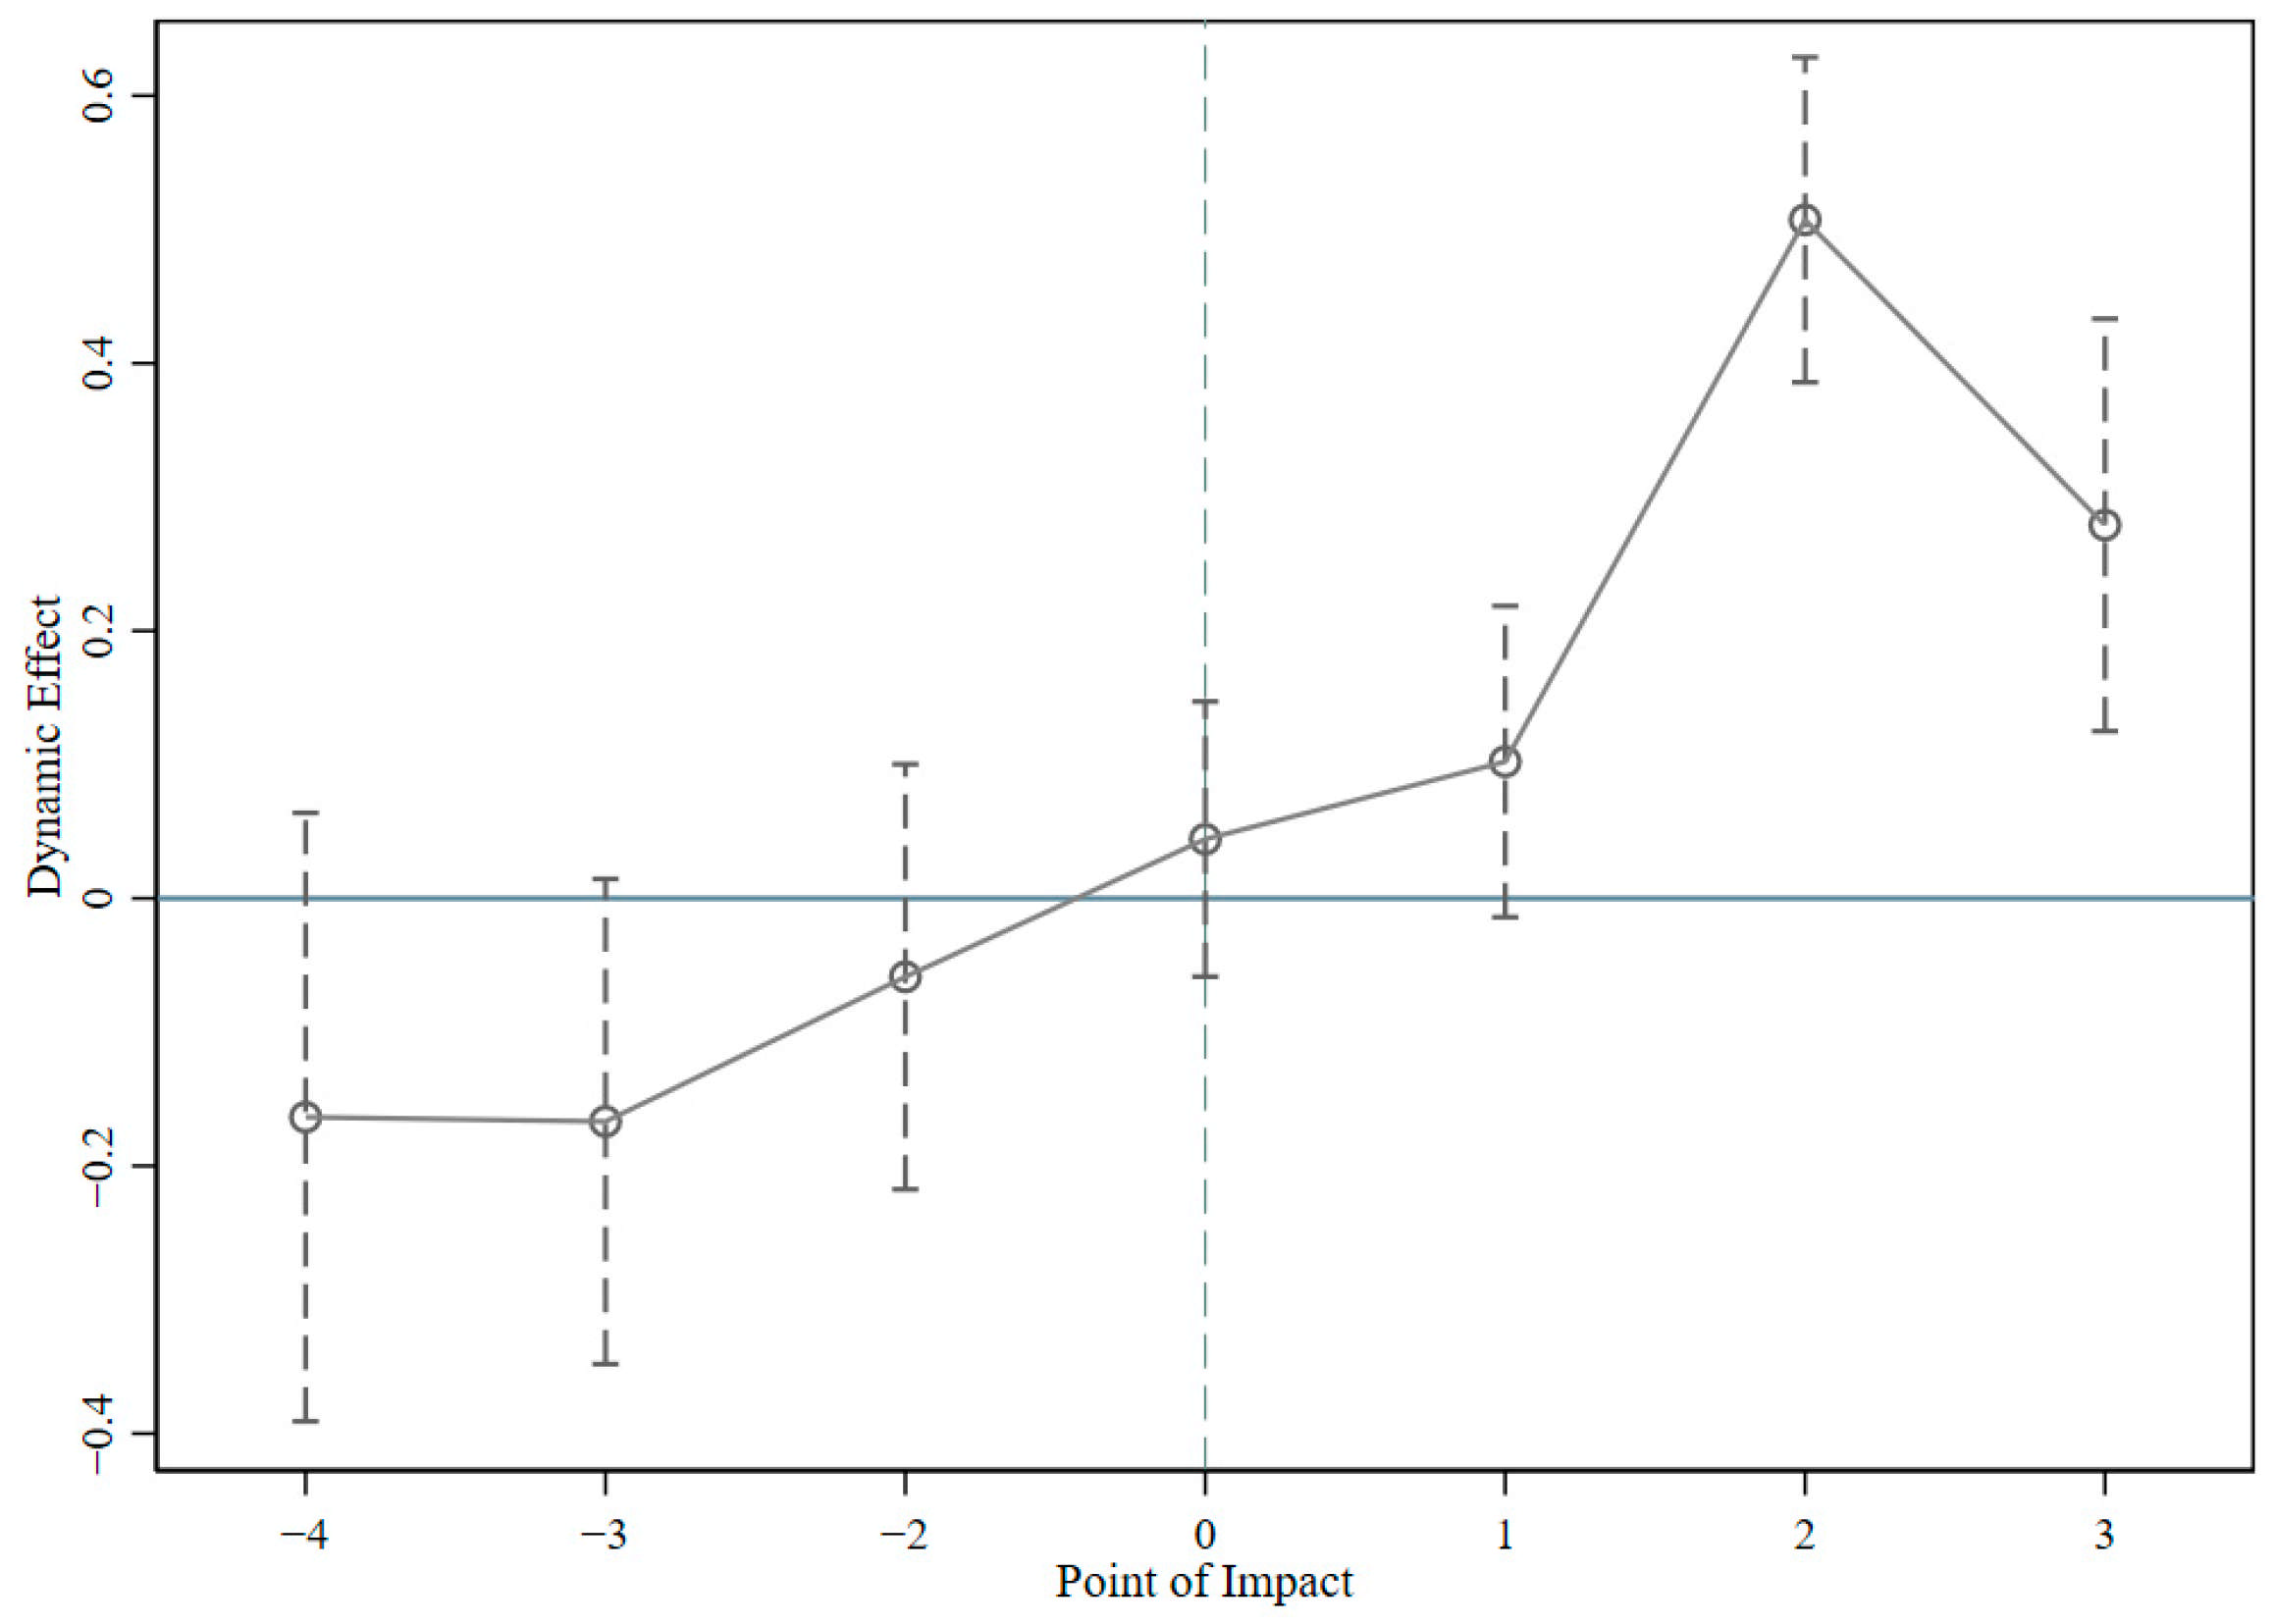
4.5.1. Parallel Test
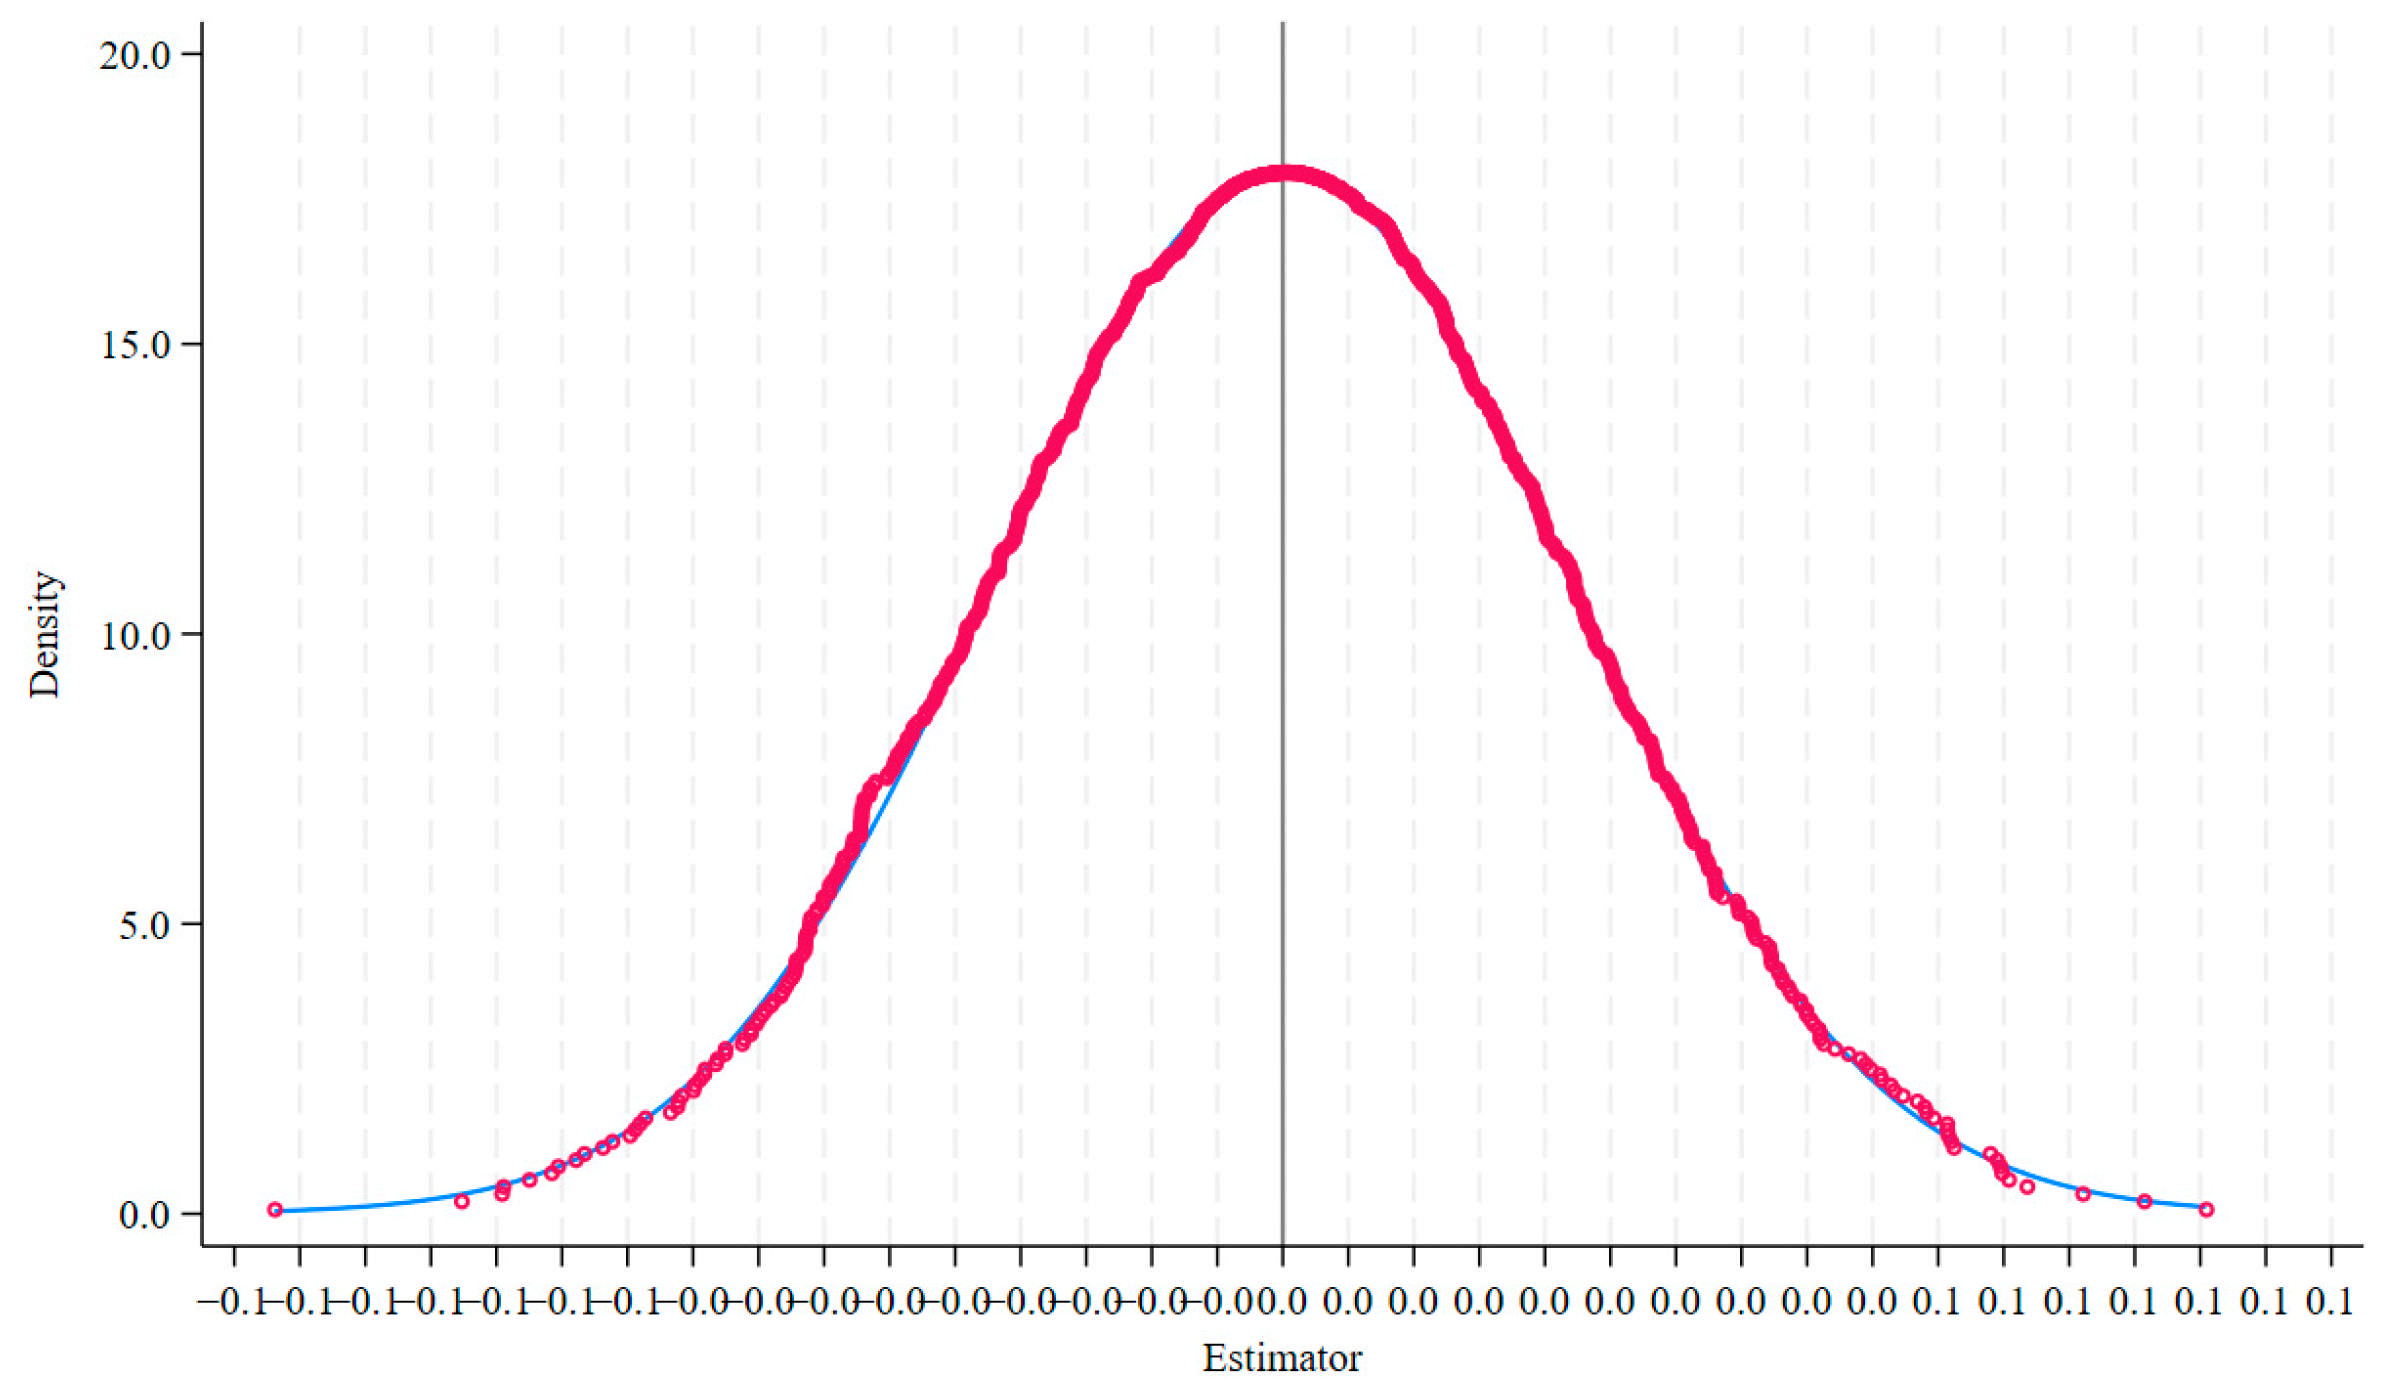
4.5.2. Placebo Test
5. Discussion
6. Conclusions and Policy Recommendations
6.1. Conclusions
6.2. Policy Recommendations
Author Contributions
Funding
Institutional Review Board Statement
Informed Consent Statement
Data Availability Statement
Conflicts of Interest
References
- Molle, F.; López-Gunn, E.; Van Steenbergen, F. The local and national politics of groundwater overexploitation. Water Altern. 2018, 11, 3. [Google Scholar]
- Biancardi, M.; Maddalena, L.; Villani, G. Water Taxes and Fines Imposed on Legal and Illegal Firms Exploiting Groundwater. Discret. Contin. Dyn. Syst.-Ser. B 2021, 26, 5787–5806. [Google Scholar] [CrossRef]
- Marriott, L.; Whait, R. Water taxes: A systematic literature review with application to Australia and New Zealand. Aust. Tax Forum 2020, 35, 566. [Google Scholar]
- Shan, S.; Ni, H.; Lin, X.; Chen, G. Evaluation of Water Saving and Economy Impact for Tax Reform Policy Using CGE Model with Integrated Multiple Types of Water. Water 2023, 15, 2118. [Google Scholar] [CrossRef]
- Shen, Y.; Zhang, X. Study on the Impact of Environmental Tax on Industrial Green Transformation. Int. J. Environ. Res. Public Health 2022, 19, 16749. [Google Scholar] [CrossRef]
- The United Nations World Water Development Report 2022: Groundwater: Making the Invisible Visible—UNESCO Digital Library. Available online: https://unesdoc.unesco.org/ark:/48223/pf0000380721 (accessed on 21 November 2024).
- Berbel, J.; Expósito, A. The theory and practice of water pricing and cost recovery in the Water Framework Directive. Water Altern. 2020, 13, 659–673. [Google Scholar]
- Porcher, S. Water Taxes and Consumer Behavior in France. SSRN. 2017. Available online: https://papers.ssrn.com/sol3/papers.cfm?abstract_id=3086778 (accessed on 16 February 2025).
- Oh, C.; Svendsen, G.T. Command-and-control or taxation? The cases of water regulation in California and Denmark. Environ. Manag. Sustain. Dev. 2015, 4, 141–151. [Google Scholar]
- Berbel, J.; Borrego-Marin, M.M.; Exposito, A.; Giannoccaro, G.; Montilla-Lopez, N.M.; Roseta-Palma, C. Analysis of irrigation water tariffs and taxes in Europe. Water Policy 2019, 21, 806–825. [Google Scholar] [CrossRef]
- Su, Y.; Cheng, Z. The impact of water resource taxes on total factor water efficiency. Water Policy 2023, 25, 200–217. [Google Scholar] [CrossRef]
- Mu, L.; Mou, M.; Tang, H. Does the water resource ‘fee to tax’ policy alleviate water poverty? Evidence from a quasi-natural experiment. Water Supply 2022, 22, 8465–8482. [Google Scholar] [CrossRef]
- World Economic Outlook. A Rocky Recovery. April 2023. Available online: https://www.imf.org/en/Publications/WEO/Issues/2023/04/11/world-economic-outlook-april-2023 (accessed on 21 November 2024).
- Meng, K. Promotion tournament, labor market tightening and pension generosity: A comparative public policy analysis of pension system for urban workers in China (1997–2013). J. Comp. Policy Anal. Res. Pract. 2020, 22, 383–404. [Google Scholar] [CrossRef]
- Tackling Water Pollution and Promoting Efficient Water Use in Industries: Regional Perspectives. Available online: https://www.unescap.org/kp/2019/tackling-water-pollution-and-promoting-efficient-water-use-industries-regional-perspectives (accessed on 21 November 2024).
- Ouyang, R.; Mu, E.; Yu, Y.; Chen, Y.; Hu, J.; Tong, H.; Cheng, Z. Assessing the effectiveness and function of the water resources tax policy pilot in China. Environ. Dev. Sustain. 2024, 26, 2637–2653. [Google Scholar] [CrossRef]
- Wang, L.; Muniba; Lakner, Z.; Popp, J. The impact of water resources tax policy on water saving behavior. Water 2023, 15, 916. [Google Scholar] [CrossRef]
- Liu, C. Can Water Resource Tax Reform Improve the Environmental Performance of Enterprises? Evidence from China’s High Water-Consuming Enterprises. Front. Environ. Sci. 2023, 11, 1155237. [Google Scholar] [CrossRef]
- Zhu, H.; Zhang, A. The Impact of Water Resource Tax Reform on Green Technology Innovation: Evidence from Chinese A-Share Listed Enterprises. J. Knowl. Econ. 2024, 15, 17630–17648. [Google Scholar] [CrossRef]
- Xu, L.; Li, Z.; Fang, J.; He, Z.; Zhang, X. Can the Water Resources Tax Promote the Water-Saving Innovation Performance of High Water Consumption Companies? -Empirical Analysis from the Pilot Provinces in China. J. Clean. Prod. 2024, 451, 141888. [Google Scholar] [CrossRef]
- Xu, C.; Gao, Y.; Hua, W.; Feng, B. Does the Water Resource Tax Reform Bring Positive Effects to Green Innovation and Productivity in High Water-Consuming Enterprises? Water 2024, 16, 725. [Google Scholar] [CrossRef]
- Wu, S.; Fan, M.; Wu, L.; Liu, Z.; Xiang, Y. Path to green development: How do ESG ratings affect green total factor productivity? Sustainability 2024, 16, 10653. [Google Scholar] [CrossRef]
- Zhao, Z.; Yan, J. The impact of investor sentiment on firms’ green total factor productivity—Facilitator or inhibitor. Environ. Sci. Pollut. Res. 2023, 30, 70303–70314. [Google Scholar] [CrossRef]
- Hao, X.; Wang, X.; Wu, H.; Hao, Y. Path to sustainable development: Does digital economy matter in manufacturing green total factor productivity? Sustain. Dev. 2022, 31, 360–378. [Google Scholar] [CrossRef]
- Mu, L.; Zhang, X.; Cheng, S.; Song, P. The Effectiveness of a Water Resource Tax Policy in Improving Water-Use Efficiency: A Quasi-Natural Experiment-Based Approach. Water Policy 2022, 24, 899–922. [Google Scholar] [CrossRef]
- Qian, S. Ripples of Change: Assessing the Impact of Water Resource Tax Reform Pilot on the Green Growth of China’s Coastal Cities. J. Sea Res. 2024, 198, 102479. [Google Scholar] [CrossRef]
- Meyer, B.D. Natural and quasi-experiments in economics. J. Bus. Econ. Stat. 1995, 13, 151–161. [Google Scholar] [CrossRef]
- Liu, J.; Yang, W. Water Sustainability for China and Beyond. Science 2012, 337, 649–650. [Google Scholar] [CrossRef]
- World Bank China—Air, Land, and Water: Environmental Priorities for a New Millennium. Available online: https://documents.worldbank.org/en/publication/documents-reports/documentdetail/166121468743733519/China-Air-land-and-water-environmental-priorities-for-a-new-millennium (accessed on 21 November 2024).
- Chen, Y.; Yin, G.; Liu, K. Regional Differences in the Industrial Water Use Efficiency of China: The Spatial Spillover Effect and Relevant Factors. Resour. Conserv. Recycl. 2021, 167, 105239. [Google Scholar] [CrossRef]
- Yan, L.; Ma, J.; He, L.; Wang, F.; Chen, T. International Comparison of Water Resources Utilization Efficiency in China. In Sustainable Development of Water Resources and Hydraulic Engineering in China; Dong, W., Lian, Y., Zhang, Y., Eds.; Environmental Earth Sciences; Springer International Publishing: Cham, Switzerland, 2019; pp. 41–55. ISBN 978-3-319-61629-2. [Google Scholar]
- Ministry of Agriculture and Rural Affairs. The Water Law of the People’s Republic of China Is Passed and Implemented. Available online: https://www.moa.gov.cn/ztzl/xzgnylsn/gd/200909/t20090922_1355578.htm (accessed on 21 November 2024).
- Ministry of Water Resources. Measures for the Administration of Permits to Take Water. (Order No. 34 of the Ministry of Water Resources). Available online: https://www.gov.cn/flfg/2008-04/17/content_947055.htm (accessed on 21 November 2024).
- People’s Daily. Starting December 1, the Water Resource Tax Reform Will Be Expanded to 9 More Provinces. Available online: https://www.gov.cn/zhengce/2017-11/29/content_5243077.htm (accessed on 21 November 2024).
- Micelotta, E.; Lounsbury, M.; Greenwood, R. Pathways of Institutional Change: An Integrative Review and Research Agenda. J. Manag. 2017, 43, 1885–1910. [Google Scholar] [CrossRef]
- Rutherford, A.C.; McDonnell, D.; Hogg, E. Incentivizing Regulatory Participation: Effectiveness of a Fundraising Levy. Public Adm. Rev. 2021, 81, 532–542. [Google Scholar] [CrossRef]
- Budzinski, O. Ecological Tax Reform and Unemployment: Competition and Innovation Issues in the Double Dividend Debate (July 2002). Universitat Hannover Fachbereich Wirtschaftswissenschaften Working Paper No. 251. Available online: https://ssrn.com/abstract=509362 (accessed on 22 November 2024).
- Teece, D.J.; Pisano, G.; Shuen, A. Dynamic capabilities and strategic management. Strateg. Manag. J. 1997, 18, 509–533. [Google Scholar] [CrossRef]
- Teece, D.J. Explicating Dynamic Capabilities: The Nature and Microfoundations of (Sustainable) Enterprise Performance. Strateg. Manag. J. 2007, 28, 1319–1350. [Google Scholar] [CrossRef]
- Eggers, J.P.; Park, K.F. Incumbent Adaptation to Technological Change: The Past, Present, and Future of Research on Heterogeneous Incumbent Response. Acad. Manag. Ann. 2018, 12, 357–389. [Google Scholar] [CrossRef]
- Lavie, D. Capability Reconfiguration: An Analysis of Incumbent Responses to Technological Change. Acad. Manag. Rev. 2006, 31, 153–174. [Google Scholar] [CrossRef]
- Wilden, R.; Gudergan, S.P.; Nielsen, B.B.; Lings, I. Dynamic capabilities and performance: Strategy, structure and environment. Long Range Plan. 2013, 46, 72–96. [Google Scholar] [CrossRef]
- Horváthová, E. Why do firms voluntarily adopt environmental management systems? The case of the Czech Republic. Acta Univ. Agric. Silvic. Mendel. Brun. 2020, 68, 1. [Google Scholar] [CrossRef]
- Jin, W.; Zhang, H.; Liu, S.; Zhang, H. Technological Innovation, Environmental Regulation, and Green Total Factor Efficiency of Industrial Water Resources. J. Clean. Prod. 2019, 211, 61–69. [Google Scholar] [CrossRef]
- Wang, W.; Wang, J.; Wu, H. The impact of energy-consuming rights trading on green total factor productivity in the context of digital economy: Evidence from listed firms in China. Energy Econ. 2024, 131, 107342. [Google Scholar] [CrossRef]
- Tone, K.; Tsutsui, M. An epsilon-based measure of efficiency in DEA–a third pole of technical efficiency. Eur. J. Oper. Res. 2010, 207, 1554–1563. [Google Scholar] [CrossRef]
- Ma, X.; Xu, X.; Wang, Z.; Zhao, X.; Lee, H.; Truskolaski, T. Technological innovation, industrial structure upgrading and mining energy efficiency: An analysis based on the super-efficient EBM model. Resour. Policy 2024, 98, 105339. [Google Scholar] [CrossRef]
- Zhong, J.; Li, T. Impact of financial development and its spatial spillover effect on green total factor productivity: Evidence from 30 provinces in China. Math. Probl. Eng. 2020, 2020, 5741387. [Google Scholar] [CrossRef]
- Zheng, Q.; Wan, L.; Wang, S.; Wang, C.; Fang, W. Does ecological compensation have a spillover effect on industrial structure upgrading? Evidence from China based on a multi-stage dynamic DID approach. J. Environ. Manag. 2021, 294, 112934. [Google Scholar] [CrossRef]
- Fu, Y.; He, C.; Luo, L. Does the Low-Carbon City Policy Make a Difference? Empirical Evidence of the Pilot Scheme in China with DEA and PSM-DID. Ecol. Indic. 2021, 122, 107238. [Google Scholar] [CrossRef]
- Huang, H.-H.; Lee, H.-H. Product Market Competition and Credit Risk. J. Bank. Financ. 2013, 37, 324–340. [Google Scholar] [CrossRef]
- Peng, Y.A.O.; Wenhao, Y.O.U.; Jiuwen, S.U.N. How Does the Water Resource ‘Fee to Tax’ Policy Affect the Over-Investment of High Water-Consuming Enterprises? J. China Popul. Resour. Environ. 2023, 33, 6. [Google Scholar]
- Jeng, D.J.-F.; Pak, A. The Variable Effects of Dynamic Capability by Firm Size: The Interaction of Innovation and Marketing Capabilities in Competitive Industries. Int. Entrep. Manag. J. 2016, 12, 115–130. [Google Scholar] [CrossRef]
- ISO 14001:2015; Environmental Management Systems—Requirements with Guidance for Use. ISO: Geneva, Switzerland, 2015.
- Jacobson, L.S.; LaLonde, R.J.; Sullivan, D.G. Earnings Losses of Displaced Workers. Am. Econ. Rev. 1993, 83, 685–709. [Google Scholar]
- Eisenhardt, K.M.; Martin, J.A. Dynamic Capabilities: What Are They? Strateg. Manag. J. 2000, 21, 1105–1121. [Google Scholar] [CrossRef]
- Fang, Z.; Kong, X.; Sensoy, A.; Cui, X.; Cheng, F. Government’s Awareness of Environmental Protection and Corporate Green Innovation: A Natural Experiment from the New Environmental Protection Law in China. Econ. Anal. Policy 2021, 70, 294–312. [Google Scholar] [CrossRef]
| Indicator Type | Primary Indicator | Secondary Indicator | Unit |
|---|---|---|---|
| Input | Capital investment | Capital stock | RMB |
| Labor input | Employee | person | |
| Energy input | Standard coal consumption | 10,000 tons | |
| Output | Expected output | Operating revenue | RMB |
| Undesired output | SO2 emissions | ton | |
| COD emissions | ton | ||
| Solid waste | 10,000 tons |
| Statistic | N | Mean | SD | Min | Max |
|---|---|---|---|---|---|
| GTFP | 9204 | 1.467 | 1.062 | 0.333 | 7.447 |
| size | 9204 | 22.34 | 1.245 | 19.98 | 26.08 |
| lev | 9204 | 0.432 | 0.199 | 0.0560 | 0.897 |
| growth | 9204 | 0.114 | 0.212 | −0.276 | 1.168 |
| lnage | 9204 | 2.231 | 0.723 | 0 | 3.219 |
| board | 9204 | 2.149 | 0.193 | 1.609 | 2.708 |
| indep | 9204 | 0.372 | 0.0520 | 0.333 | 0.571 |
| lnpgdp | 9204 | 11.05 | 0.417 | 10.14 | 11.97 |
| Variables | (1) | (2) |
|---|---|---|
| GTFP | GTFP | |
| Treat_time | 0.207 ** | 0.194 ** |
| (2.620) | (2.526) | |
| control variable | NO | YES |
| fixed effect | YES | YES |
| N | 9198 | 9198 |
| R2 | 0.753 | 0.761 |
| Variables | Unmatched/Matched | Mean | T | |
|---|---|---|---|---|
| Treated | Control | |||
| size | U | 22.597 | 22.229 | 1.49 * |
| M | 22.597 | 22.59 | 1.20 * | |
| lev | U | 0.441 | 0.428 | 1.09 * |
| M | 0.441 | 0.439 | 1.06 | |
| growth | U | 0.100 | 0.120 | 0.79 * |
| M | 0.100 | 0.101 | 1.10 * | |
| lnage | U | 2.279 | 2.209 | 0.92 * |
| M | 2.279 | 2.295 | 0.98 | |
| board | U | 2.181 | 2.136 | 1.09 * |
| M | 2.181 | 2.176 | 1.04 | |
| indep | U | 0.368 | 0.374 | 0.89 * |
| M | 0.368 | 0.370 | 0.95 | |
| lnpgdp | U | 10.998 | 11.074 | 1.09 * |
| M | 10.998 | 10.986 | 1.03 | |
| Neighbor Matching | Caliper Matching | Nuclear Matching | |
|---|---|---|---|
| (1) | (2) | (3) | |
| Variables | GTFP | GTFP | GTFP |
| Treat_time | 0.200 ** | 0.201 ** | 0.195 ** |
| (2.131) | (2.055) | (2.531) | |
| control variable | Yes | Yes | Yes |
| fixed effect | Yes | Yes | Yes |
| N | 6874 | 3886 | 9180 |
| R2 | 0.759 | 0.785 | 0.761 |
| Sector | Industry Name |
|---|---|
| Mining and quarrying (B) | Mining and washing of coal, extraction of petroleum and natural gas, mining and processing of ferrous metal ores, mining and processing of non-ferrous metal ores, ancillary mining activities |
| Manufacturing (C) | Processing of food from agricultural products, manufacture of foods, manufacture of wines, beverage and refined tea, manufacture of cigarettes and tobacco, manufacture of textiles, manufacture of textile wearing apparel and ornament, manufacture of leather, fur, feather products, and footwear, manufacture of paper and paper products, printing, reproduction of recording media, manufacture of cultural, educational, arts and crafts, sports, and entertainment products, processing of petroleum, coking, processing of nucleus fuel, manufacture of chemical raw material and chemical products, manufacture and processing of ferrous metals, manufacture and processing of non-ferrous metals, manufacture of fabricated metal products |
| Production and supply of electricity, heat, gas, and tap water (D) | Production and supply of electric power and heat power, production and distribution of gas |
| (1) | (2) | (3) | (4) | (5) | (6) | |
|---|---|---|---|---|---|---|
| Non-High-Water Consumption | High-Water Consumption | High Competition | Low Competition | Non-Certified | Certified | |
| Variables | GTFP | GTFP | GTFP | GTFP | GTFP | GTFP |
| Treat_time | 0.208 *** | 0.126 | 0.201 ** | 0.118 | 0.224 ** | 0.079 |
| (2.995) | (1.313) | (2.242) | (1.102) | (2.316) | (0.921) | |
| control variable | Yes | Yes | Yes | Yes | Yes | Yes |
| fixed effect | Yes | Yes | Yes | Yes | Yes | Yes |
| N | 5316 | 3880 | 5750 | 3325 | 6581 | 2346 |
| R2 | 0.839 | 0.755 | 0.797 | 0.813 | 0.778 | 0.819 |
Disclaimer/Publisher’s Note: The statements, opinions and data contained in all publications are solely those of the individual author(s) and contributor(s) and not of MDPI and/or the editor(s). MDPI and/or the editor(s) disclaim responsibility for any injury to people or property resulting from any ideas, methods, instructions or products referred to in the content. |
© 2025 by the authors. Licensee MDPI, Basel, Switzerland. This article is an open access article distributed under the terms and conditions of the Creative Commons Attribution (CC BY) license (https://creativecommons.org/licenses/by/4.0/).
Share and Cite
Lu, H.; Zhu, Y.; Kang, Y. Water Resource Tax and Green Industrial Development: Reform from the Largest Emerging Economy. Sustainability 2025, 17, 4478. https://doi.org/10.3390/su17104478
Lu H, Zhu Y, Kang Y. Water Resource Tax and Green Industrial Development: Reform from the Largest Emerging Economy. Sustainability. 2025; 17(10):4478. https://doi.org/10.3390/su17104478
Chicago/Turabian StyleLu, Haiyan, Yongxin Zhu, and Yongqing Kang. 2025. "Water Resource Tax and Green Industrial Development: Reform from the Largest Emerging Economy" Sustainability 17, no. 10: 4478. https://doi.org/10.3390/su17104478
APA StyleLu, H., Zhu, Y., & Kang, Y. (2025). Water Resource Tax and Green Industrial Development: Reform from the Largest Emerging Economy. Sustainability, 17(10), 4478. https://doi.org/10.3390/su17104478