1. Introduction
The Sixth Assessment Report released by the Intergovernmental Panel on Climate Change (IPCC) indicates that the global surface temperature during the period 2011–2020 was 1.1 °C higher than the 1850–1900 baseline average [
1]. According to the latest analysis by NASA scientists, 2024 is projected to be the hottest year on record regarding global average surface temperature, with each of the past ten years also ranking among the ten hottest years ever recorded, breaking temperature records once again [
2]. In particular, the urban heat island (UHI) effect is especially pronounced in some major cities, where urban areas can be more than 10 °C warmer than their surrounding rural counterparts [
3,
4]. This phenomenon primarily stems from drastic morphological transformations during urbanization: extensive use of impermeable construction materials intensifies heat absorption, while the reduction of green spaces and the combined influences of marine and river environments collectively create city-based “heat islands” characterized by unusually high temperature concentrations. Meanwhile, the types and spatial configurations of different urban pattern elements have a significant impact on heat accumulation, thereby intensifying the spatial heterogeneity of land surface temperature. Consequently, optimizing urban spatial patterns to effectively mitigate the adverse impacts of urban physical morphology on the thermal environment has become a central issue in urban planning and climate adaptation research.
The term urban pattern refers to “the macroscopic expression of the physical spatial structure of cities, reflecting the overall configuration of urban elements and characteristic urban landscapes” [
5]. Researchers typically classify urban patterns based on factors such as functional zoning [
6] and building density [
7]. Additionally, some studies categorize urban patterns according to geographical characteristics, distinguishing between mountain cities, coastal cities, and plains cities, thereby emphasizing the influence of natural geographical conditions on urban spatial organization. However, existing research predominantly examines urban patterns in singular geographical settings, with limited exploration of composite patterns shaped by complex geophysical interactions [
8,
9]. To this end, this study introduces the concept of the “Mountain–City–Sea” composite pattern as a representational framework, aiming to integrate three core elements—topography and landforms, the urban built environment, and coastal features—into a classification system of urban spatial patterns characterized by structural clarity, physical logic, and real-world correspondence. This pattern is widely found in southeastern coastal regions of China and other mountainous coastal cities worldwide, such as Xiamen, Hong Kong, and Rio de Janeiro. These cities typically exhibit a spatial configuration in which natural landforms and urban morphology are intricately interwoven, demonstrating both high representativeness and strong transferability. Notably, cities with such composite spatial patterns tend to contain more diverse urban elements and layout structures. Compared to cities with homogeneous landforms and simplified structures, they are more susceptible to the compounded influence of multiform landscapes and morphological factors, posing greater systemic challenges for urban thermal environment regulation. Therefore, a systematic investigation of the relationship between the Mountain–City–Sea pattern and the urban thermal environment not only extends existing paradigms of urban heat studies but also provides theoretical support for heat risk regulation under complex geomorphological conditions.
Numerous studies have demonstrated significant correlations between various urban pattern indices—including the Normalized Difference Water Index (NDWI) [
10], Normalized Difference Vegetation Index (NDVI) [
11], impervious surface [
12], Digital Elevation Model (DEM) [
13], precipitation [
14], and population density [
15]—and urban thermal environments. For example, Zhang et al. [
16], using Landsat imagery from Fuzhou, China, in 1989 and 2001, quantitatively assessed urban land use intensity and urban surface thermal patterns. Their findings indicated a weak correlation between NDVI and surface temperature but revealed a strong positive correlation between impervious surfaces and surface temperature. Similarly, Zhang et al. [
17], based on daily temperature observations from Beijing spanning 1981–2020, found that population density, built-up land, and atmospheric pressure intensified the urban heat island effect, whereas wind speed and cultivated land were significant mitigating factors. Although previous studies have revealed the impacts of various factors on the urban thermal environment, most have focused on the independent analysis of raw variables, lacking structural categorization and typological treatment of the variables involved. In particular, current research has yet to establish a classification framework that captures the physical logic and spatial zoning implications necessary to account for the potential synergies among multiple variables. Therefore, constructing a pathway of “classification–integration–feature extraction”—in which thermally relevant factors are systematically categorized and their key characteristics identified, and then reorganized into composite factor layers based on urban spatial patterns—can facilitate a more holistic and structured analysis of the spatial mechanisms underlying urban thermal environments from the perspective of overall urban morphology.
Due to the complex interactions between the urban built environment and natural conditions, coupled with methodological diversity in terms of quantitative techniques, variable selection, and meteorological considerations, existing research has reported significantly inconsistent results regarding the impact of urban patterns on the thermal environment. A substantial body of literature has explored the spatial heterogeneity of such impacts using global and local regression models. For instance, Gao et al. [
18] employed the Geographically Weighted Regression (GWR) model integrated with multi-source data—including remote sensing imagery, building footprints, and land use data—to reveal the spatial non-stationarity of the relationship between urban heat island effects and parcel morphology, highlighting marked spatial variations in the influence of different factors. Similarly, Zhang et al. [
19] applied the Multiscale Geographically Weighted Regression (MGWR) model to demonstrate that the effects of land cover changes on land surface temperature vary significantly across space. These studies underscore the superior capability of local regression models in capturing spatial heterogeneity and suggest that such model results can inform targeted mitigation strategies. However, as most existing studies still rely on the assumption of global stationarity, the proposed mitigation strategies often remain at a conceptual level, lacking implementable, spatially differentiated foundations. Therefore, following the identification of spatial heterogeneity patterns, the integration of clustering analysis to classify and delineate the study area emerges as a critical approach to enhance the adaptability and precision of mitigation strategies. This method helps address the management complexities arising from multidimensional spatial heterogeneity and provides both theoretical and technical support for implementing typology-based thermal environment regulation.
Therefore, taking Xiamen City as a case study, this research employs land surface temperature (LST) as the primary indicator to evaluate variations in the urban thermal environment. Multiple factors strongly correlated with the thermal environment are classified into three categories—Mountain, City, and Sea—based on the urban pattern. Moran’s I and GWR are used to reveal the spatial autocorrelation and heterogeneity in the impacts of these urban pattern elements on the thermal environment. Subsequently, K-means clustering analysis based on GWR results identifies spatial zoning patterns reflecting the differentiated effects on the thermal environment. Finally, targeted regulatory strategies tailored to local conditions are proposed. This research provides a scientific basis for optimizing urban patterns and effectively mitigating urban thermal environmental issues.
2. Materials and Methods
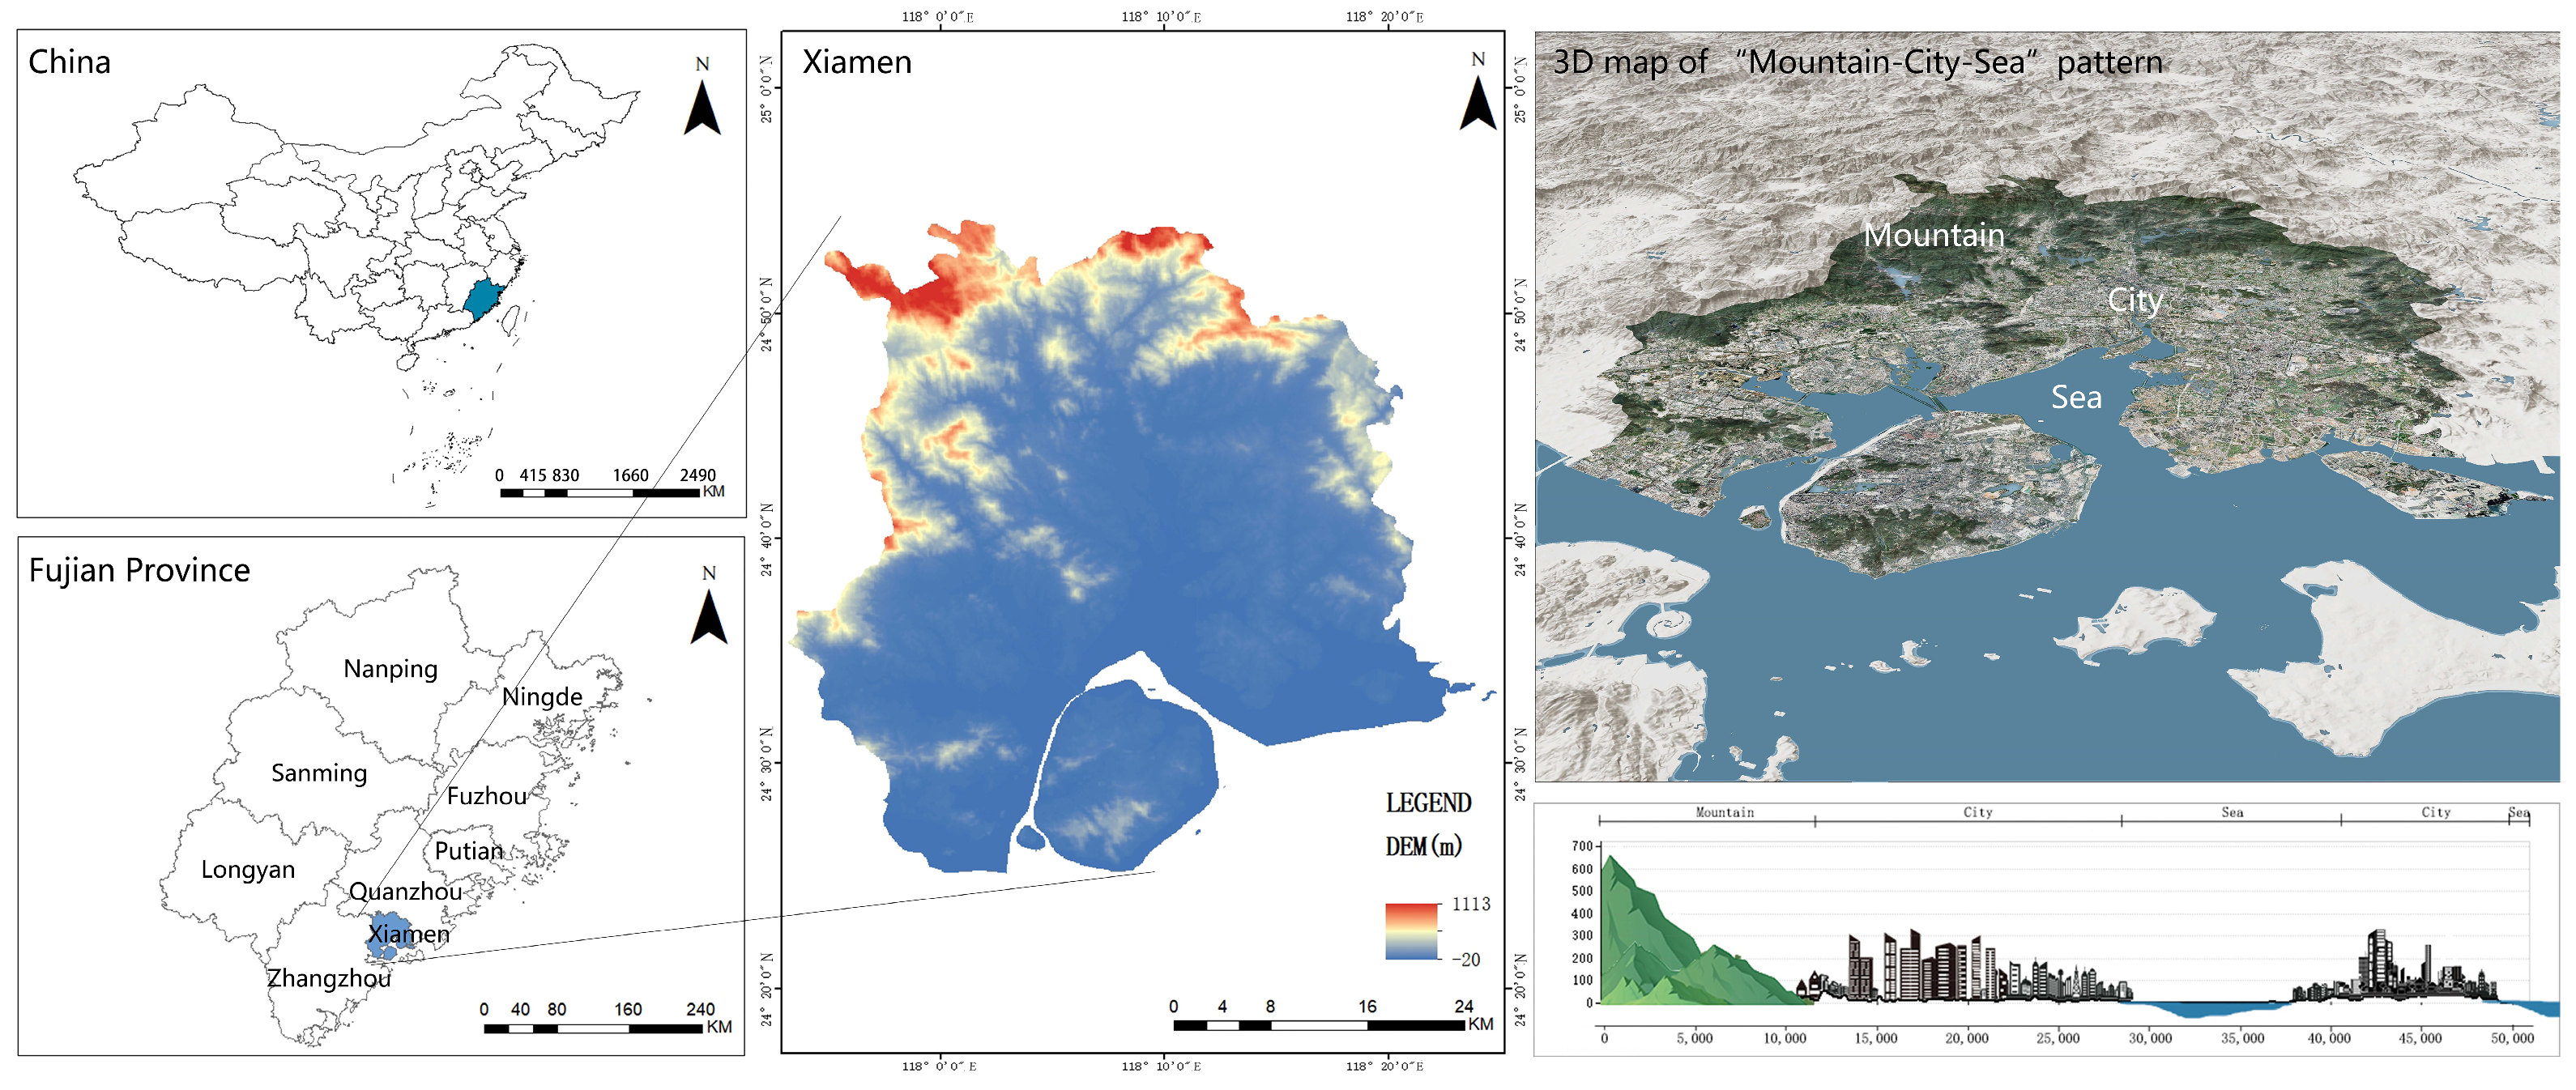
2.1. Study Area
This study focuses on Xiamen City, located between 118°03′–118°13′ E and 24°26′–24°28′ N. It features a subtropical maritime monsoon climate characterized by abundant precipitation (
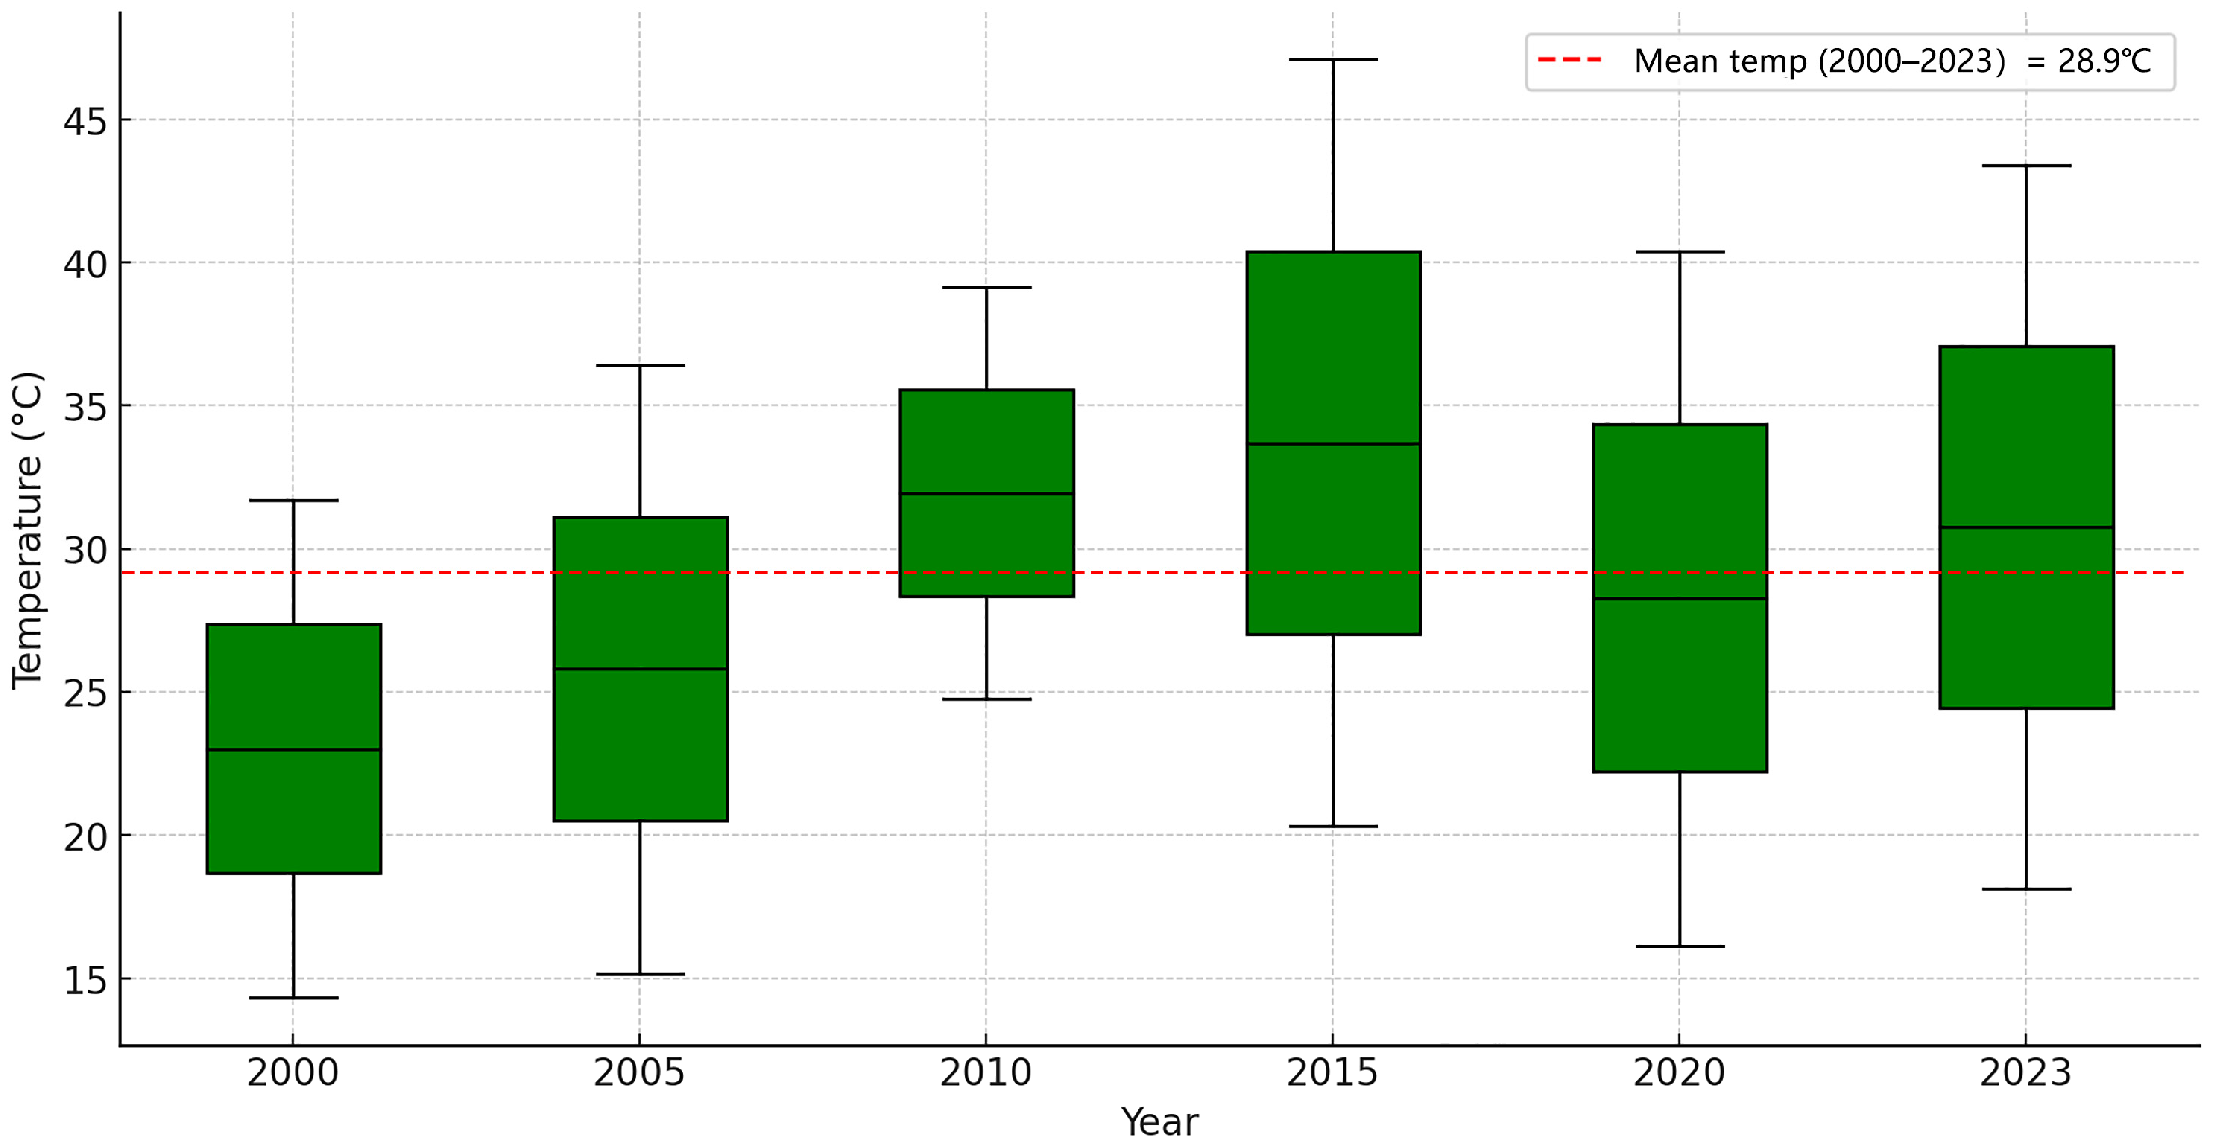
Figure 1). Influenced by the western Pacific subtropical high-pressure system, Xiamen frequently experiences intense heatwave conditions during summer [
20], with an average monthly temperature around 25 °C (
Figure 2). In recent years, Xiamen has undergone significant changes in its land use patterns, with the built-up area expanding from 94.03 km
2 in 2002 to 464.77 km
2 in 2024 [
21]. This trend has been primarily driven by rapid population growth, the agglomeration of economic industries, and the demand for coastal development under relevant policy directives. Accompanying the continuous expansion of built-up areas, the spatial extent of the UHI effect has increased more than tenfold [
22].
Xiamen, renowned as the ‘Garden City on the Sea’, features a unique mountainous coastal landscape [
23]. The overall topography descends gradually from northwest to southeast, with mountainous areas covering approximately 60% of the city’s total area, predominantly situated in the northwest, while urban development occupies around 35%, concentrated mainly along the coastal lowlands and central low-elevation regions. As a typical bay city, Xiamen boasts over 234 km of coastline [
24]. The intertwined relationship between mountains and sea shapes Xiamen’s distinctive Mountain–City–Sea pattern, enhancing spatial complexity and diversity in climate, ecology, and urban functions. The successful development of Xiamen under this unique pattern, particularly regarding effective strategies for mitigating urban heat island effects, provides valuable insights and exemplary practices for climate adaptation, ecological preservation, and sustainable urban development.
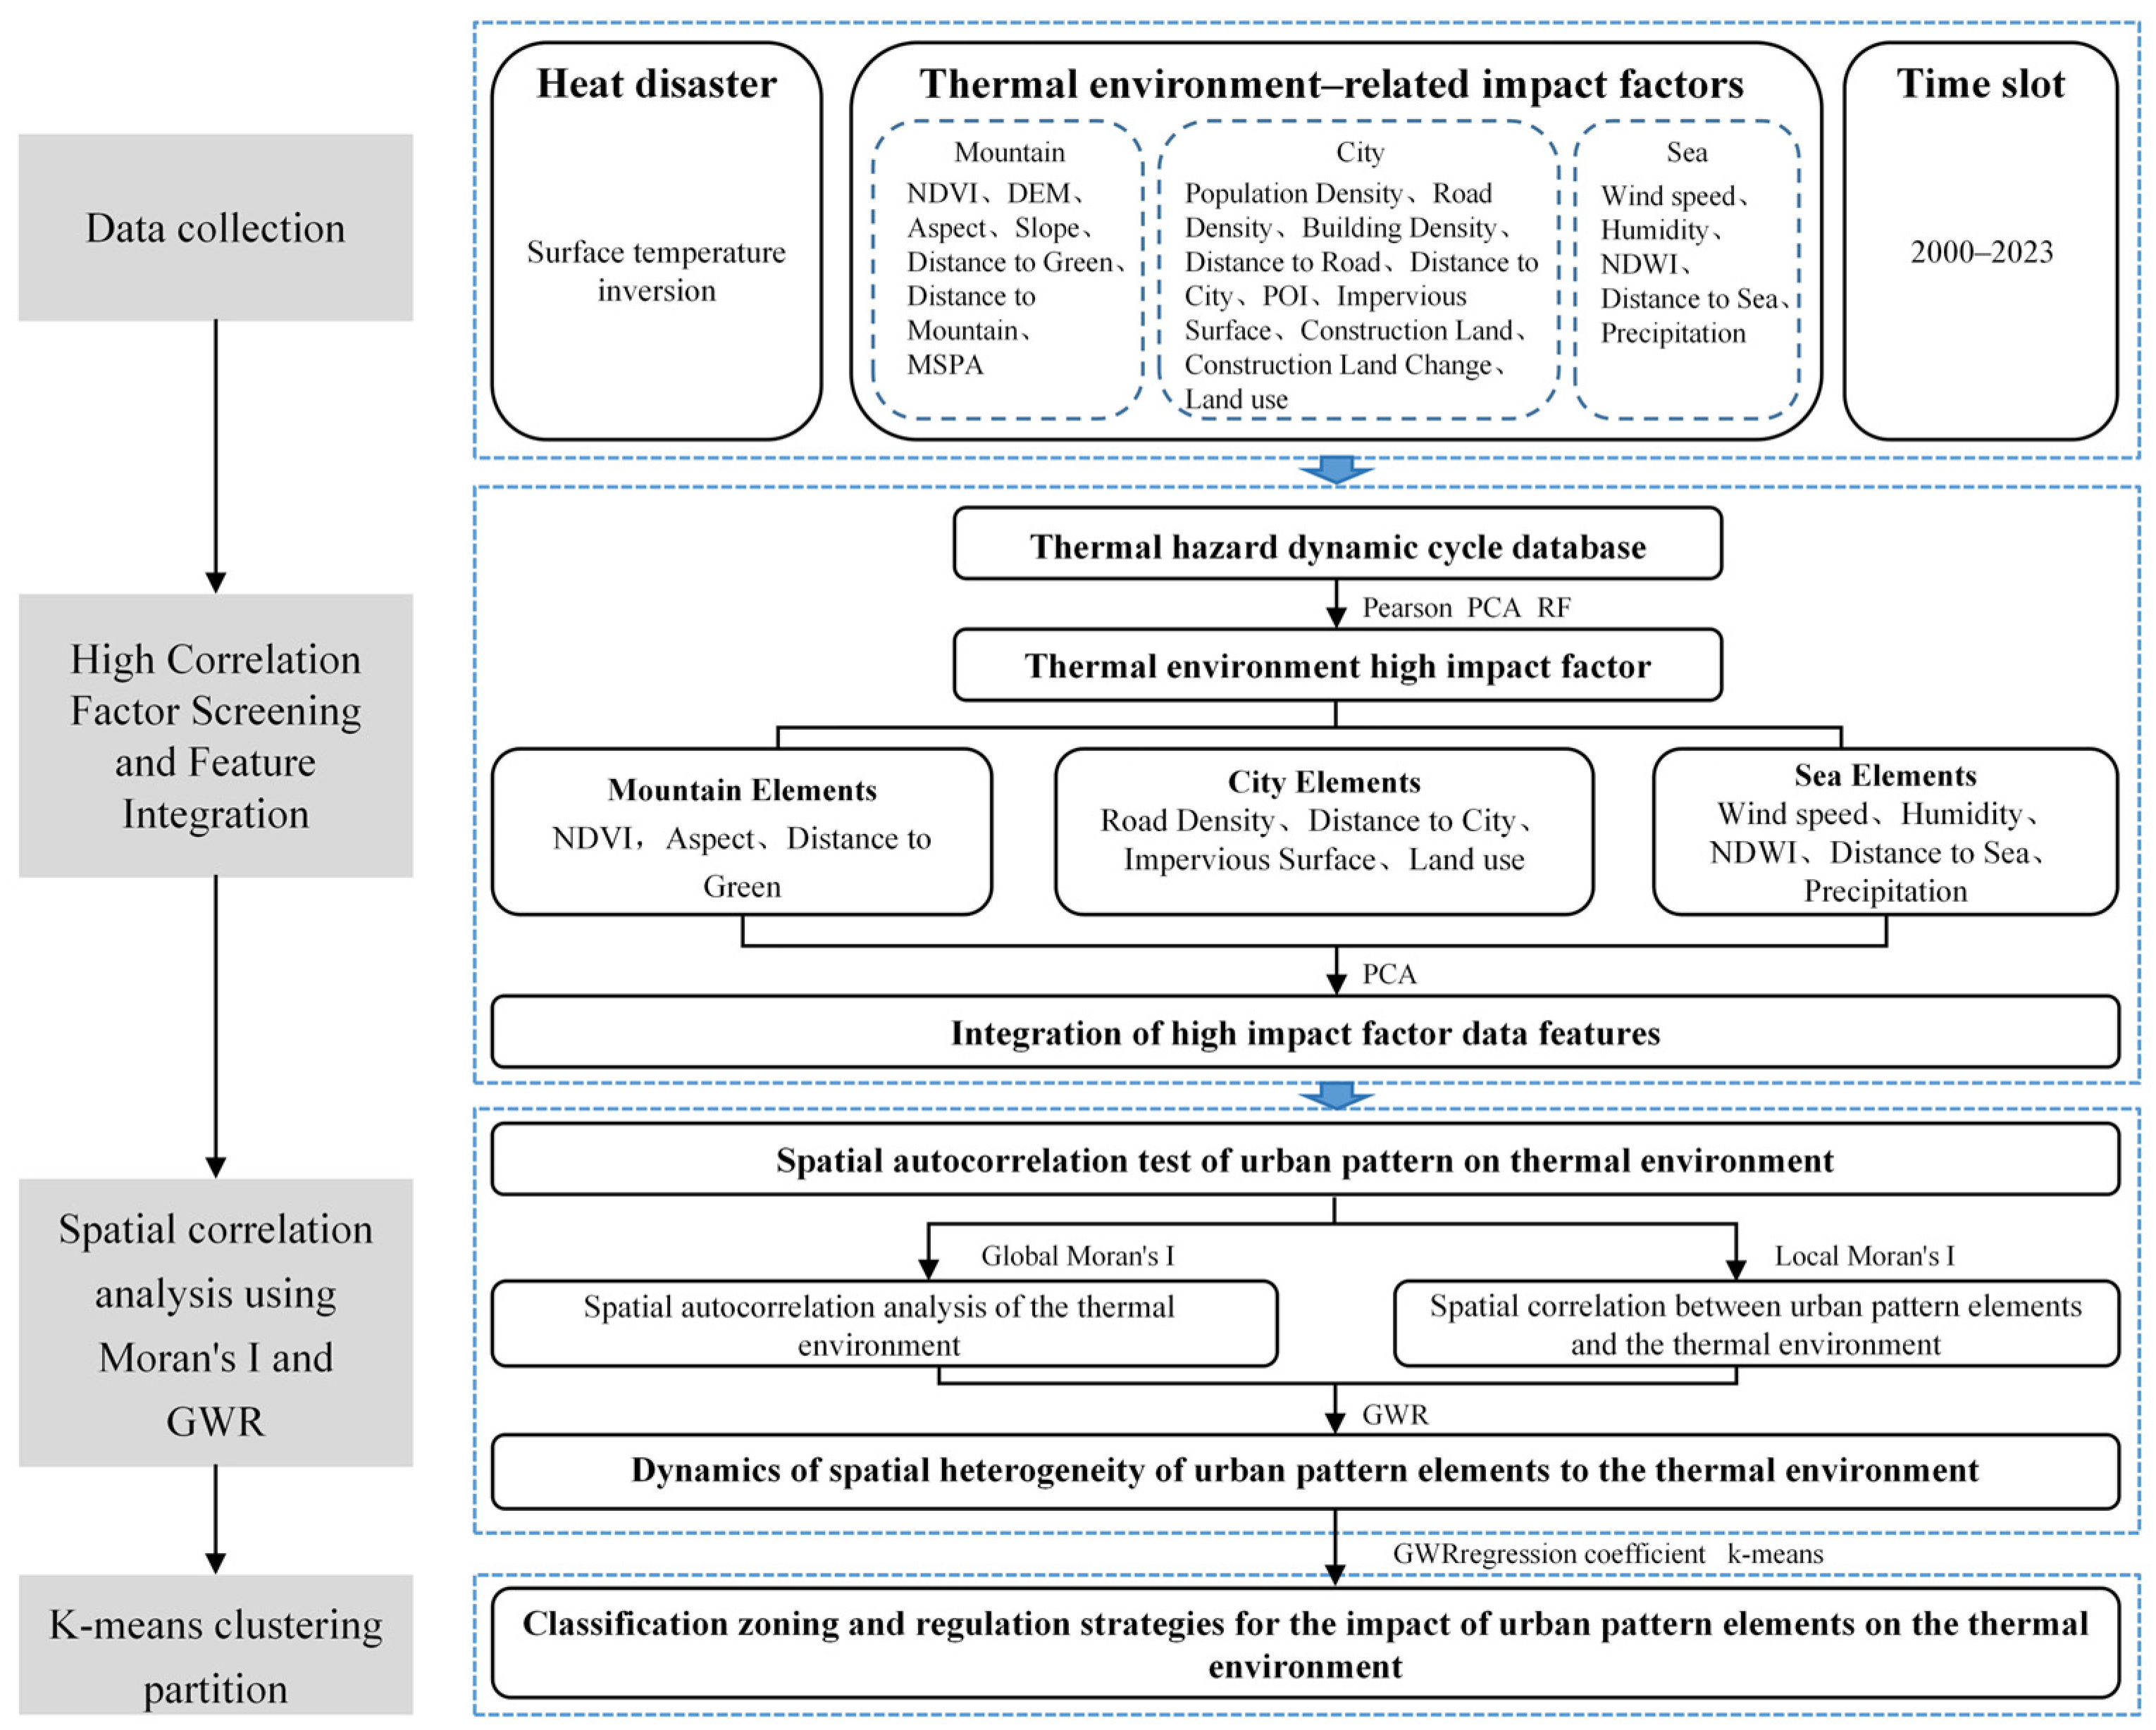
2.2. Research Framework and Methodological Steps
To comprehensively examine the impact of the Mountain–City–Sea pattern on urban thermal environment variations, this study adopts a multi-dimensional and multi-level approach, comprising five key steps: data collection and processing, factor importance ranking, feature integration, spatial correlation analysis, and clustering-based zoning (
Figure 3).
First, initial factors influencing the urban thermal environment were identified, followed by spatial data preprocessing steps including unified projection, clipping, resampling, and outlier correction to ensure data quality.
Second, variables significantly correlated with the thermal environment were preliminarily screened using Pearson correlation analysis. Principal Component Analysis (PCA) was then employed to extract dominant features, reveal potential synergistic structures among variables, and reduce multicollinearity. In parallel, a Random Forest (RF) model was used to evaluate variable importance scores, thereby identifying key factors with significant influence on the thermal environment.
Third, highly correlated variables were integrated based on the Mountain–City–Sea classification framework, and PCA was again applied to construct composite layers that capture overall spatial trends.
Next, Global Moran’s I was used to test the spatial autocorrelation between each factor and LST, verifying the underlying spatial heterogeneity. Based on this, the GWR model was applied to further explore the spatial associations and local heterogeneity of the three pattern elements—Mountain, City, and Sea—concerning the urban thermal environment.
Finally, using the regression coefficients derived from the GWR model, a K-means clustering approach was adopted to classify and partition the study area, providing a scientific basis for the development of spatially differentiated strategies for urban thermal environment optimization.
2.3. Factor Selection and Classification
In this study, LST is adopted as the primary quantitative indicator of the urban thermal environment. LST directly reflects the thermal responses of different surface features, such as impervious surfaces, vegetation, and water bodies, during solar radiation and energy exchange processes. It demonstrates strong spatial continuity and regional comparability, making it particularly suitable for urban-scale thermal environment analysis and pattern identification. Compared with other measurement methods, LST can be efficiently obtained via remote sensing technologies and has been widely applied in studies of the UHI effect and urban thermal risks [
25,
26].
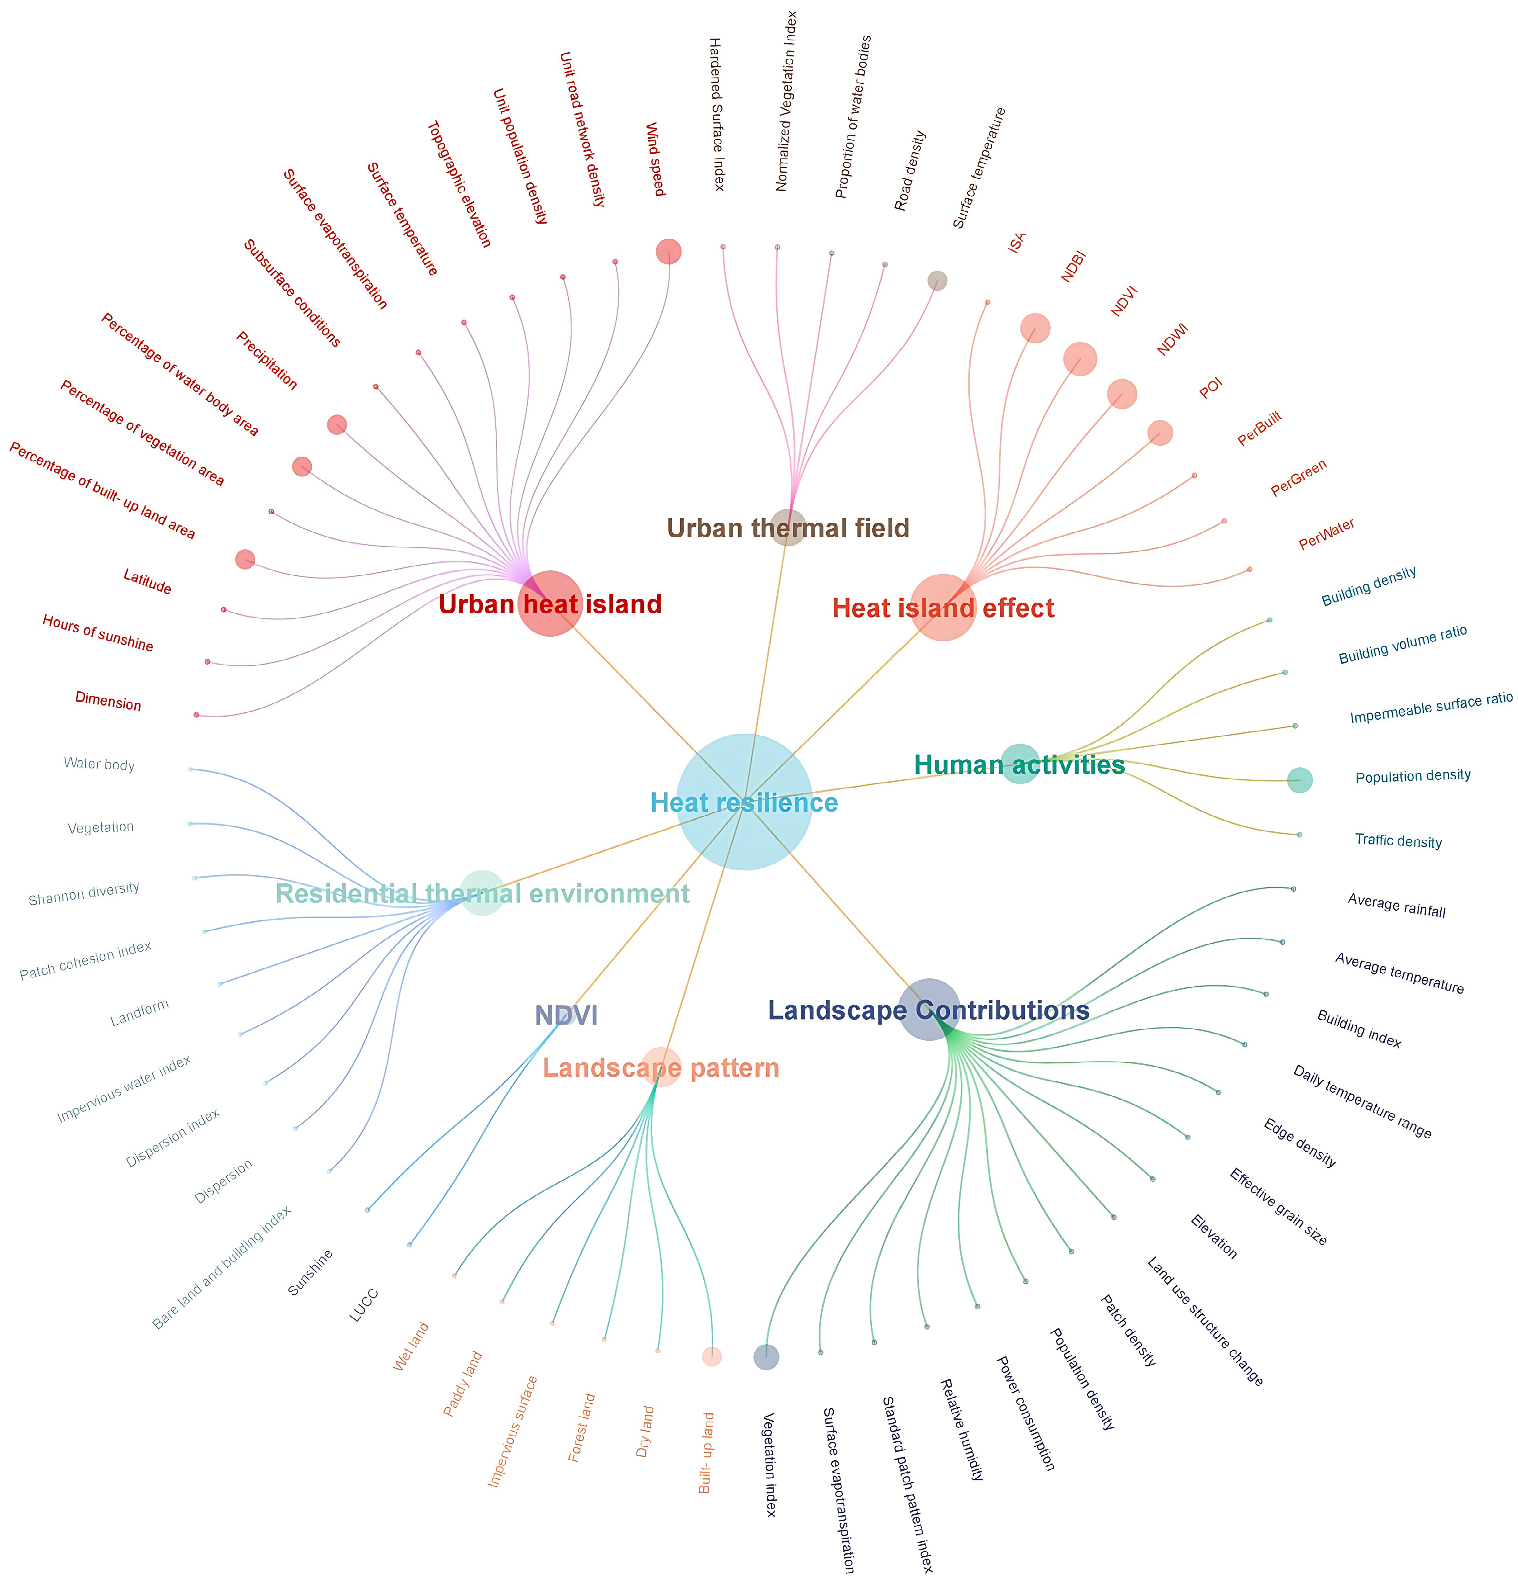
For the selection of thermal environment influencing factors, this study conducted a systematic review of the relevant literature on urban thermal environments from the past two decades, both domestically and internationally. Combined with keyword frequency heatmap analysis from the CNKI and Web of Science databases (
Figure 4), we identified representative factors frequently mentioned in studies on urban heat islands, surface temperature, and urban patterns, which exhibit strong thermal responsiveness and have accessible spatial data. Ultimately, 22 influencing factors were selected, including NDVI, DEM, aspect, slope, distance to green, road density, population density, building density, impervious surface, land use, distance to road, distance to city, Points of Interest (POI), construction land, construction land change, wind speed, humidity, NDWI, distance to sea, precipitation, Morphological Spatial Pattern Analysis (MSPA), and distance to mountain. These factors comprehensively capture the combined effects of natural topography, ecological structure, anthropogenic activities, and meteorological conditions on the thermal environment, providing a robust data foundation for subsequent analysis.
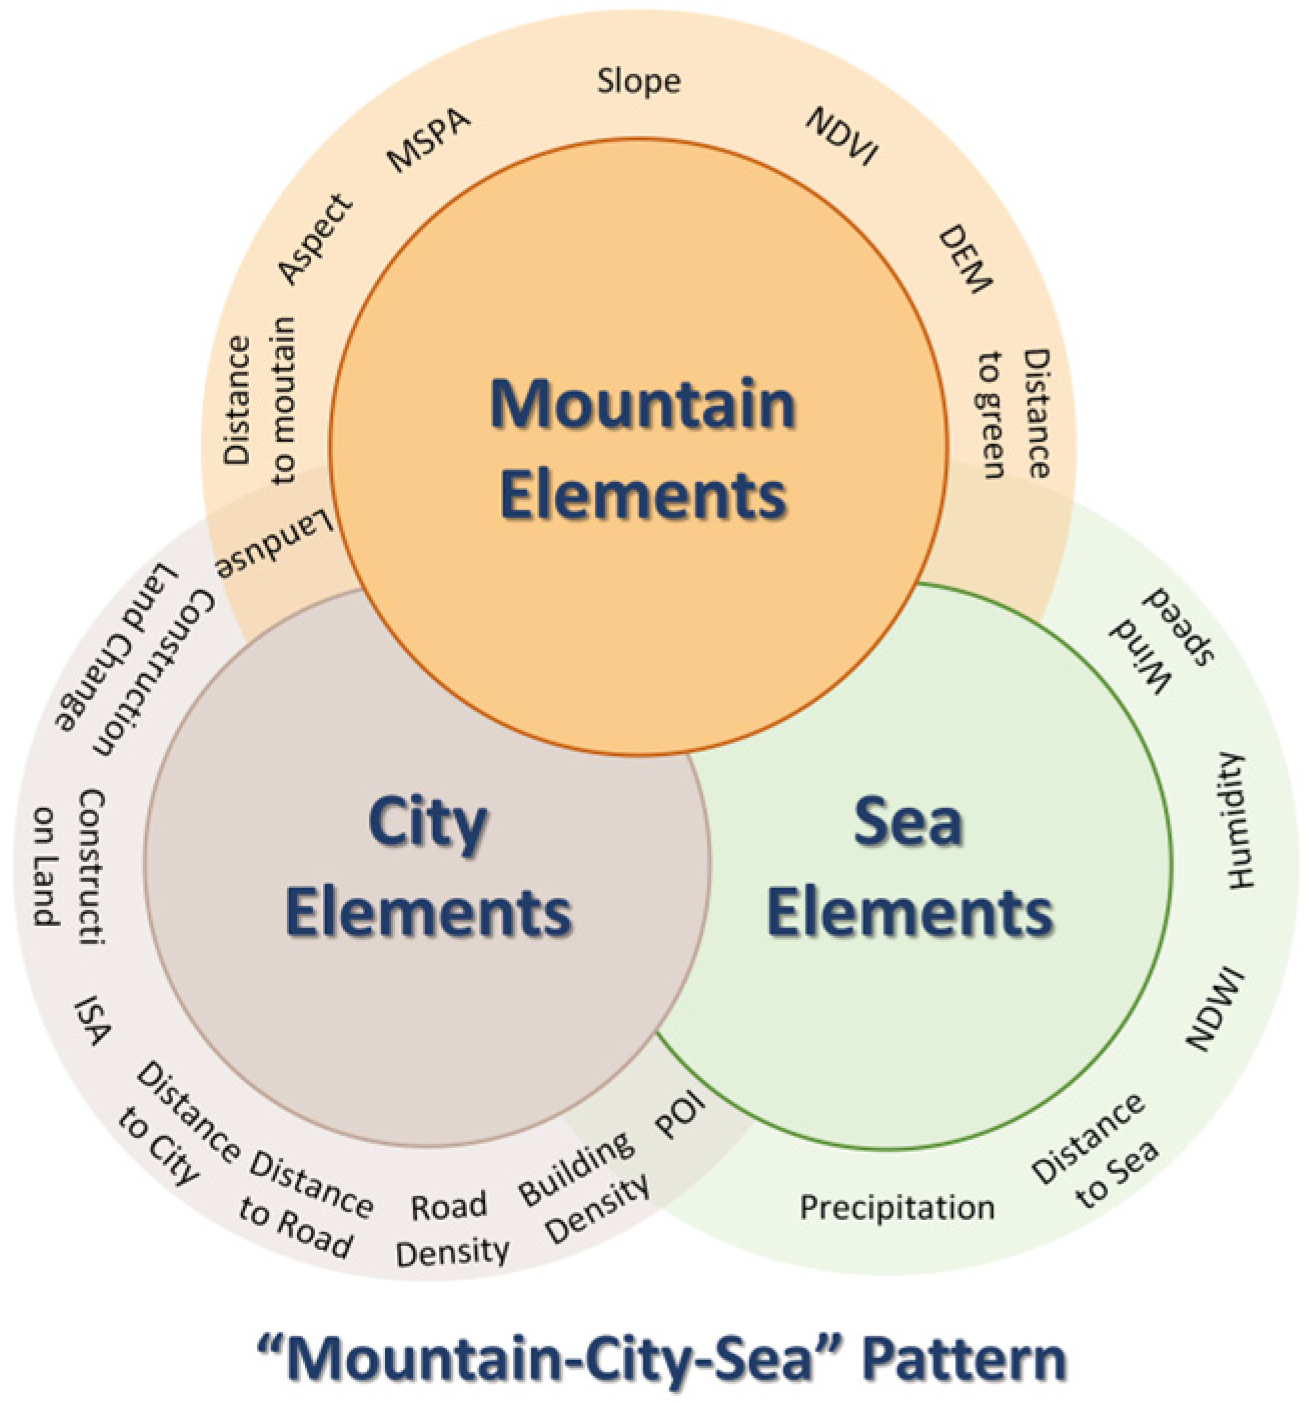
Based on this, the 22 factors were classified into three categories—Mountain, City, and Sea—according to their spatial distribution characteristics and ecological functions (
Figure 5), to enable a more systematic investigation of their integrated influence on the urban thermal environment. Specifically, Mountain-related elements represent urban green spaces and vegetation-related factors, including NDVI, DEM, aspect, slope, distance to green, MSPA, and distance to mountain. These factors can alleviate surface temperature through mechanisms such as topographic barriers, ventilation corridors, and the presence of cooling sources, thereby demonstrating the thermal regulatory functions of natural ecological infrastructures.
City-related elements reflect urbanization intensity and anthropogenic influences, and include road density, population density, building density, impervious surface, land use, distance to road, distance to city, POI, construction land, and construction land change. These elements mainly contribute to urban heat accumulation and anthropogenic heat emissions.
Lastly, Sea-related elements denote hydrological and coastal factors, including wind speed, humidity, NDWI, distance to sea, and precipitation. These elements influence the urban thermal environment through evaporation, humidity regulation, and sea–land breeze circulation mechanisms, providing important cooling effects in coastal urban systems.
2.4. Data Sources
The multispectral remote sensing data used in this study were obtained from the Geospatial Data Cloud platform and the United States Geological Survey (USGS) database. Landsat multispectral imagery of Xiamen during the summer seasons of 2000, 2005, 2010, 2015, 2018, and 2023 was used, with a spatial resolution of 30 m and referenced to the WGS84 coordinate system.
The selected influencing factors—including NDVI, slope, population density, impervious surface, DEM, wind speed, humidity, land use, and precipitation—were all derived from existing datasets. Additional factors such as distance to green, distance to mountain, distance to sea, MSPA, road density, building density, distance to road, distance to city, POI, construction land, and NDWI were calculated using ArcGIS Pro 3.0. The sources and calculation methods for all 22 specific influencing factors are detailed in
Table 1.
2.5. Methods
2.5.1. LST Retrieval
There are currently three primary methods for inverting LST: the split window algorithm, the single channel approach, and the atmospheric correction method. In this study, the surface temperature for the B10 band of Landsat 8 data is inverted using the atmospheric correction approach. The following is the formula:
where
LB is the intensity of thermal radiation received by the satellite sensor,
DN represents the pixel gray value of the B10 band of Landsat 8,
ML and
AL are the gain and bias corresponding to the thermal infrared band, respectively;
TS is the value of the blackbody radiance brightness,
Lλ is the value of the thermal infrared radiance brightness,
ε is the atmospheric transmittance,
L↑ is the atmospheric upward radiant brightness,
L↓ is the atmospheric downward radiant brightness;
LST represents the surface temperature value,
K1 = 774.89 (W·m
−2·sr
−1·μm
−1),
K2 = 1321.08 K for Landsat 8.
2.5.2. PCC
In this study, the Pearson correlation coefficient is employed to analyze the linear correlations between the 22 influencing factors and land surface temperature (LST), allowing the selection of factors with significant impacts on the urban thermal environment.
The Pearson Correlation Coefficient is a statistical measure used to quantify the linear relationship between two variables, defined as the ratio of their covariance to the product of their standard deviations. It ranges from −1 to 1, with 1 representing a perfect positive correlation, −1 indicating a perfect negative correlation, and 0 signifying no linear correlation. The formula to calculate the Pearson Correlation Coefficient is the following:
where
Coν(
X,
Y) denotes the covariance between variables
X and
Y, while
σX and
σY refer to the standard deviations of
X and
Y, respectively. This coefficient can simply and intuitively reflect the correlation between variables.
2.5.3. PCA
PCA is a technique for reducing dimensionality that applies a linear transformation to map the original data onto a new coordinate system, ensuring that the transformed data preserves the most variance [
34]. The core of PCA involves extracting eigenvectors from the covariance matrix of the data through eigenvalue decomposition or singular value decomposition. These eigenvectors, known as principal components, each correspond to an eigenvalue that indicates the amount of variance they explain in the data [
35]. PCA is widely used in data preprocessing, pattern recognition, and image processing.
2.5.4. RF
RF is an ensemble learning algorithm consisting of multiple decision trees, widely used for feature importance analysis due to its robust predictive capabilities. RF quantifies feature importance by assessing each variable’s contribution to predicting the target variable. The core principle of feature importance evaluation in RF is based on changes in Gini. Specifically, the importance of each feature is quantified by calculating the aggregated reduction in Gini resulting from splits at decision-tree nodes involving that feature. The formula is as follows:
where
k denotes the number of classes, and
pmk represents the proportion of class
k in node
m.
indicates the change in the
Gini when node m is split using feature
Xj, while
GIl and
GIr denote the
Gini of the two resulting child nodes after the split.
2.5.5. Bivariate Spatial Autocorrelation Model
Spatial autocorrelation analysis can reveal whether the distribution of spatial variables is related to the neighboring variables, which is divided into global spatial autocorrelation and local spatial autocorrelation. Bivariate spatial autocorrelation analysis (Bivariate Moran’s I) proposed by Anselin [
36] can effectively reflect the association and dependence characteristics of the spatial distribution of the two types of variables. In this paper, OpenGeoDa 1.20 software is used for bivariate spatial autocorrelation analysis. First, the bivariate Global Moran’s I is applied to measure the correlation of the overall spatial distribution, which is calculated as follows:
where
I is the bivariate global spatial autocorrelation index, the correlation between the spatial distribution of spatial variables
x and
y on the whole;
n is the total number of spatial units;
Wij is the spatial weight matrix established by the K-neighborhood method;
xi and
yj are the observed values of the independent variable and the dependent variable in spatial units
i and
j, respectively; and
S2 is the variance of all samples.
The bivariate Local Moran’s I further reveals the local spatial correlation characteristics of the cells with the following formula:
where
Ii is the local spatial relationship between the independent variable and the dependent variable of spatial unit
i;
Zi and
Zi are the standardized values of the variance of the observations of spatial units
i and
j. Based on
Ii, four kinds of clustering patterns can be formed, and the LISA (Local Indications of Spatial Association) distribution maps can visualize the clustering and differentiation characteristics of the independent variables and dependent variables in the local area.
2.5.6. GWR Model
To further explore the spatial heterogeneity of the Mountain–City–Sea elements in the thermal environment, this paper introduces the GWR model, which is a local regression technique that simulates spatial variations in the relationship between the dependent variable and the independent variable and estimates their effects, and is superior to traditional linear regression methods in modeling the local parameters of a large number of variables [
37]. The GWR model introduces a spatial weighting function based on the classical multiple regression model so that the regression parameters can be adjusted in response to changes in geographic location. Its formula is as follows:
where
yi is the estimated value of the
ith point; (
ui,
νi) is the coordinate of the
ith point;
β0 (
ui,
νi) is the constant term of the
ith point;
xik is the
kth independent variable of the
ith point;
βk(
ui,
νi) is the regression coefficient of the
kth independent variable of the ith point;
εi is the residual term of the model for the ith point;
i = 1, 2, 3, …,
n (
n is the number of sample points);
k = 1, 2, 3, …,
p (
p is the number of independent variables).
2.5.7. K-Means Cluster Analysis
The K-means clustering analysis method has the advantages of high computational efficiency and easy implementation, and is often used in research related to ecological function zoning. In this study, to realize the comprehensive urban pattern of the thermal environment impact zone identification and zoning regulation strategy, based on the regression coefficients of the GWR model, the K-means clustering algorithm is used to identify the areas with similar impact factors on the surface temperature, to characterize the local impact mechanisms of different zoning districts, and formulate differentiated optimization and regulation strategies for each zoning district. The K-means clustering algorithm can be used to classify sample sets, based on the attribute similarity of the objects, into K different clusters to minimize the variation of samples within the same cluster while maximizing the differences between clusters [
38]. The sum of squared intra-cluster errors, denoted by
E, is usually used as a standardized metric function and is calculated as follows:
where
x is the value of the example object and
µi is the mean
Ci of the classification, calculated as follows:
3. Results
3.1. Correlation Analysis of Urban Thermal Environment Influencing Factors
3.1.1. Selection of High-Impact Factors in the Urban Thermal Environment
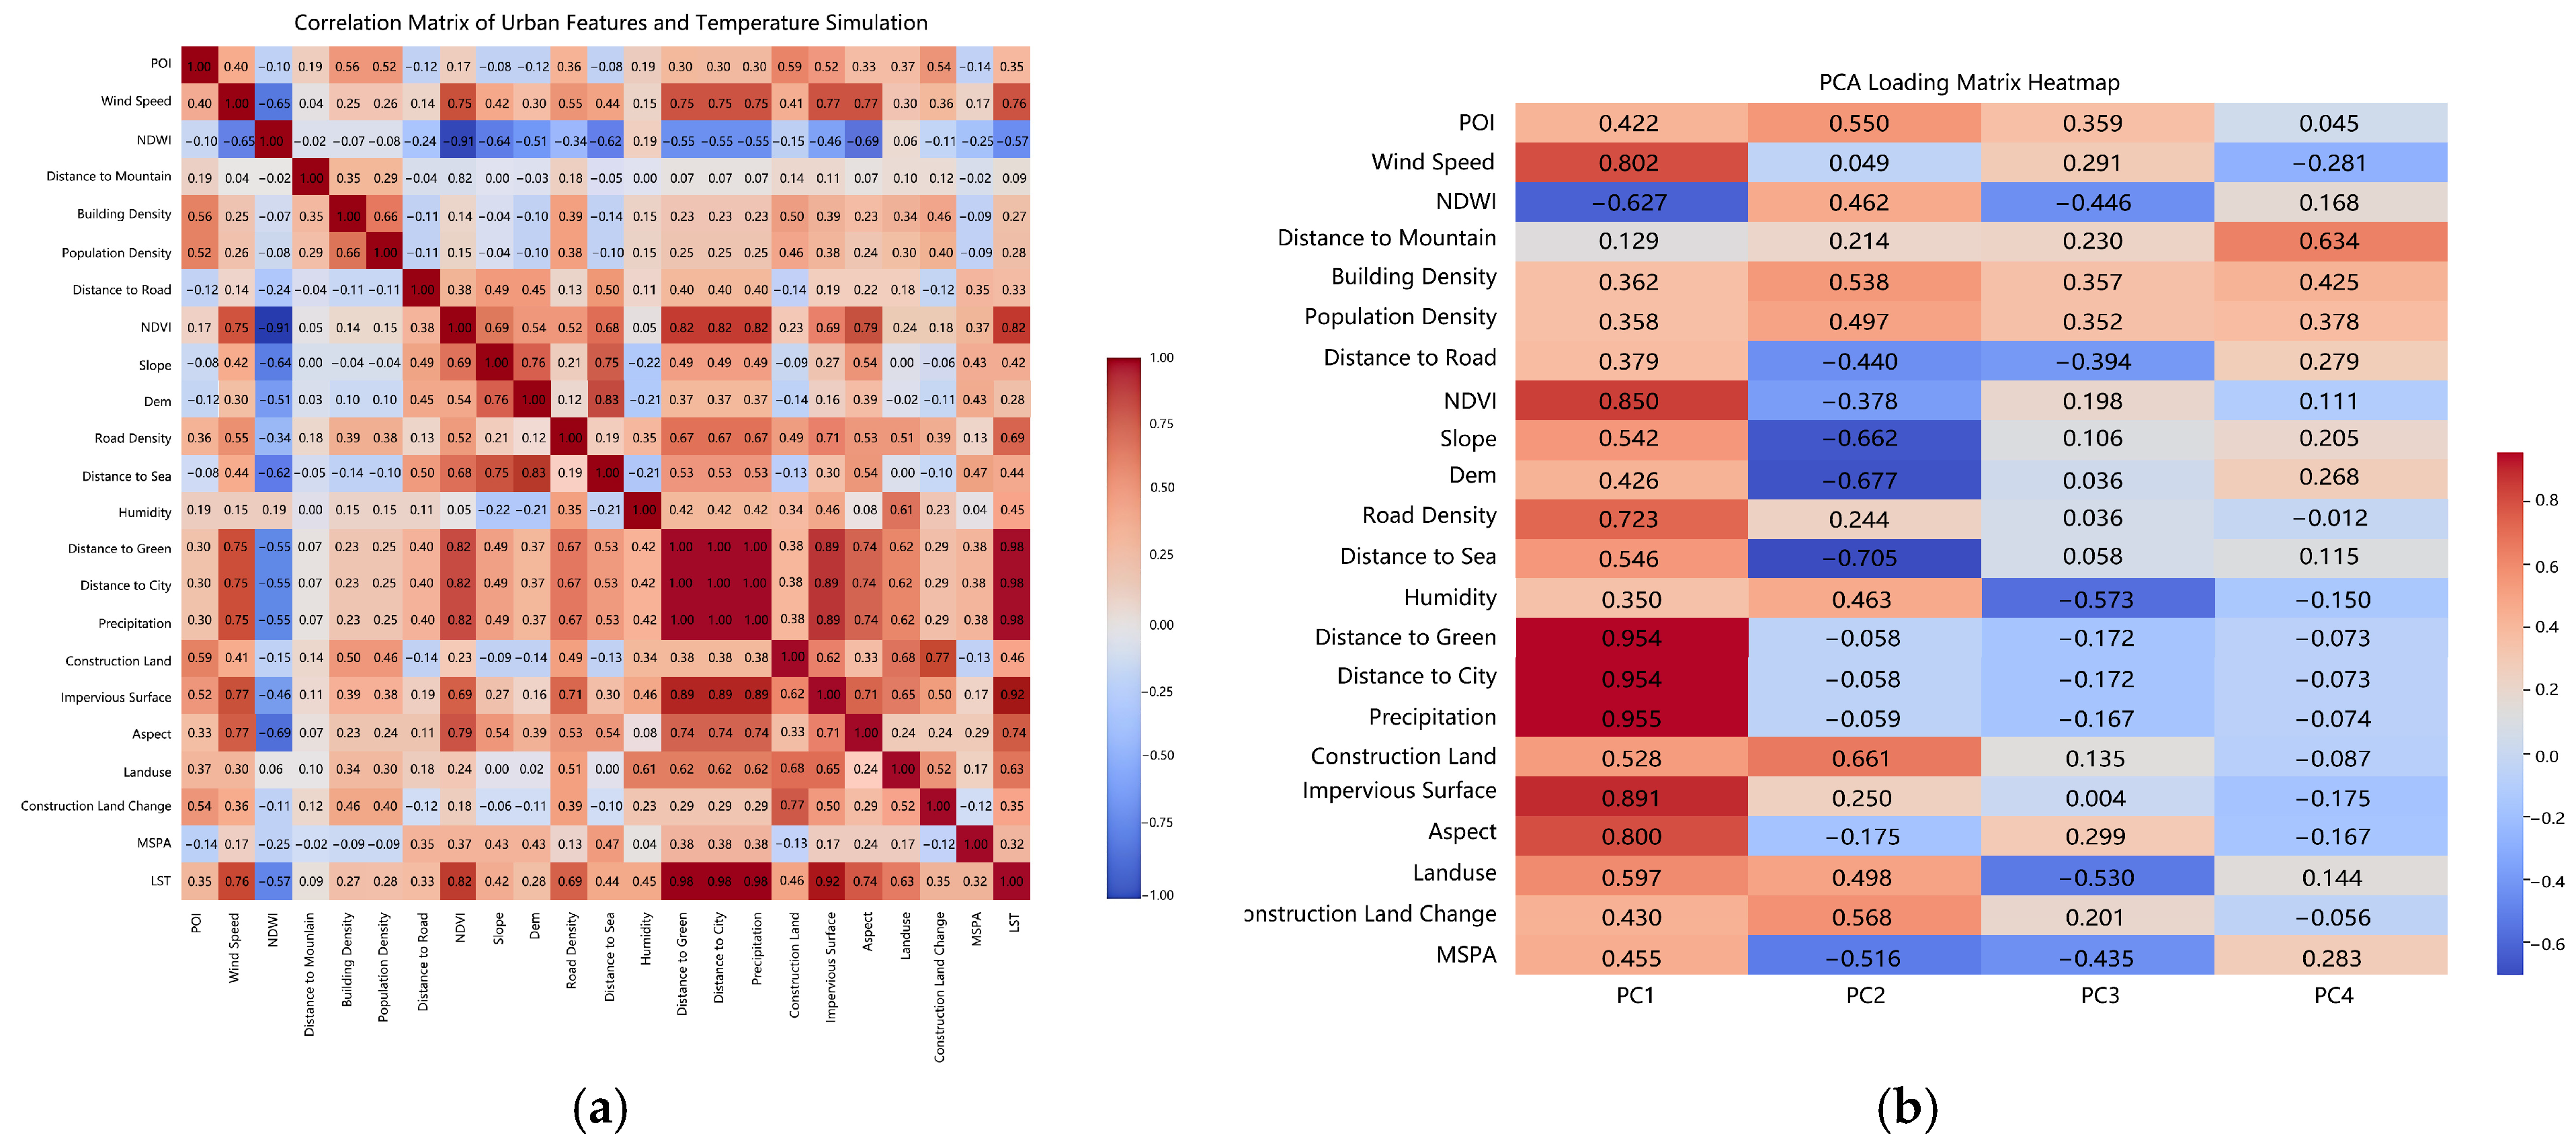
In the Pearson correlation analysis, eight urban features were found to exhibit strong positive correlations with LST, including precipitation (r = 0.97), distance to green space (r = 0.97), impervious surface (r = 0.90), NDVI (r = 0.82), wind speed (r = 0.76), aspect (r = 0.73), road density (r = 0.69), and land use (r = 0.60). In contrast, NDWI showed a moderate negative correlation with LST (r = −0.57).
Figure 6a presents the Pearson correlation heatmap between LST and each variable, serving as an initial screening tool to identify variables with strong linear correlations.
PCA further refined the key influencing factors of the urban thermal environment. The first principal component (PC1), which explains the largest proportion of variance in the dataset, is predominantly associated with precipitation (r = 0.95), distance to green (r = 0.95), distance to city (r = 0.95), NDVI (r = 0.85), impervious surface (r = 0.89), wind speed (r = 0.80), and aspect (r = 0.80). This suggests that environmental and land-related factors have a substantial integrated influence on LST modeling. The second principal component (PC2), accounting for the second-largest variance, is mainly influenced by distance to sea (r = −0.71), dem (r = −0.68), and slope (r = −0.66). The third principal component (PC3) is primarily correlated with humidity (r = −0.57), land use (r = −0.53), NDWI (r = −0.45), and MSPA (r = −0.44). The fourth principal component (PC4) reflects the influence of distance to mountain (r = 0.63), building density (r = 0.43), and population density (r = 0.38). The detailed correlation coefficients are illustrated in
Figure 6b.
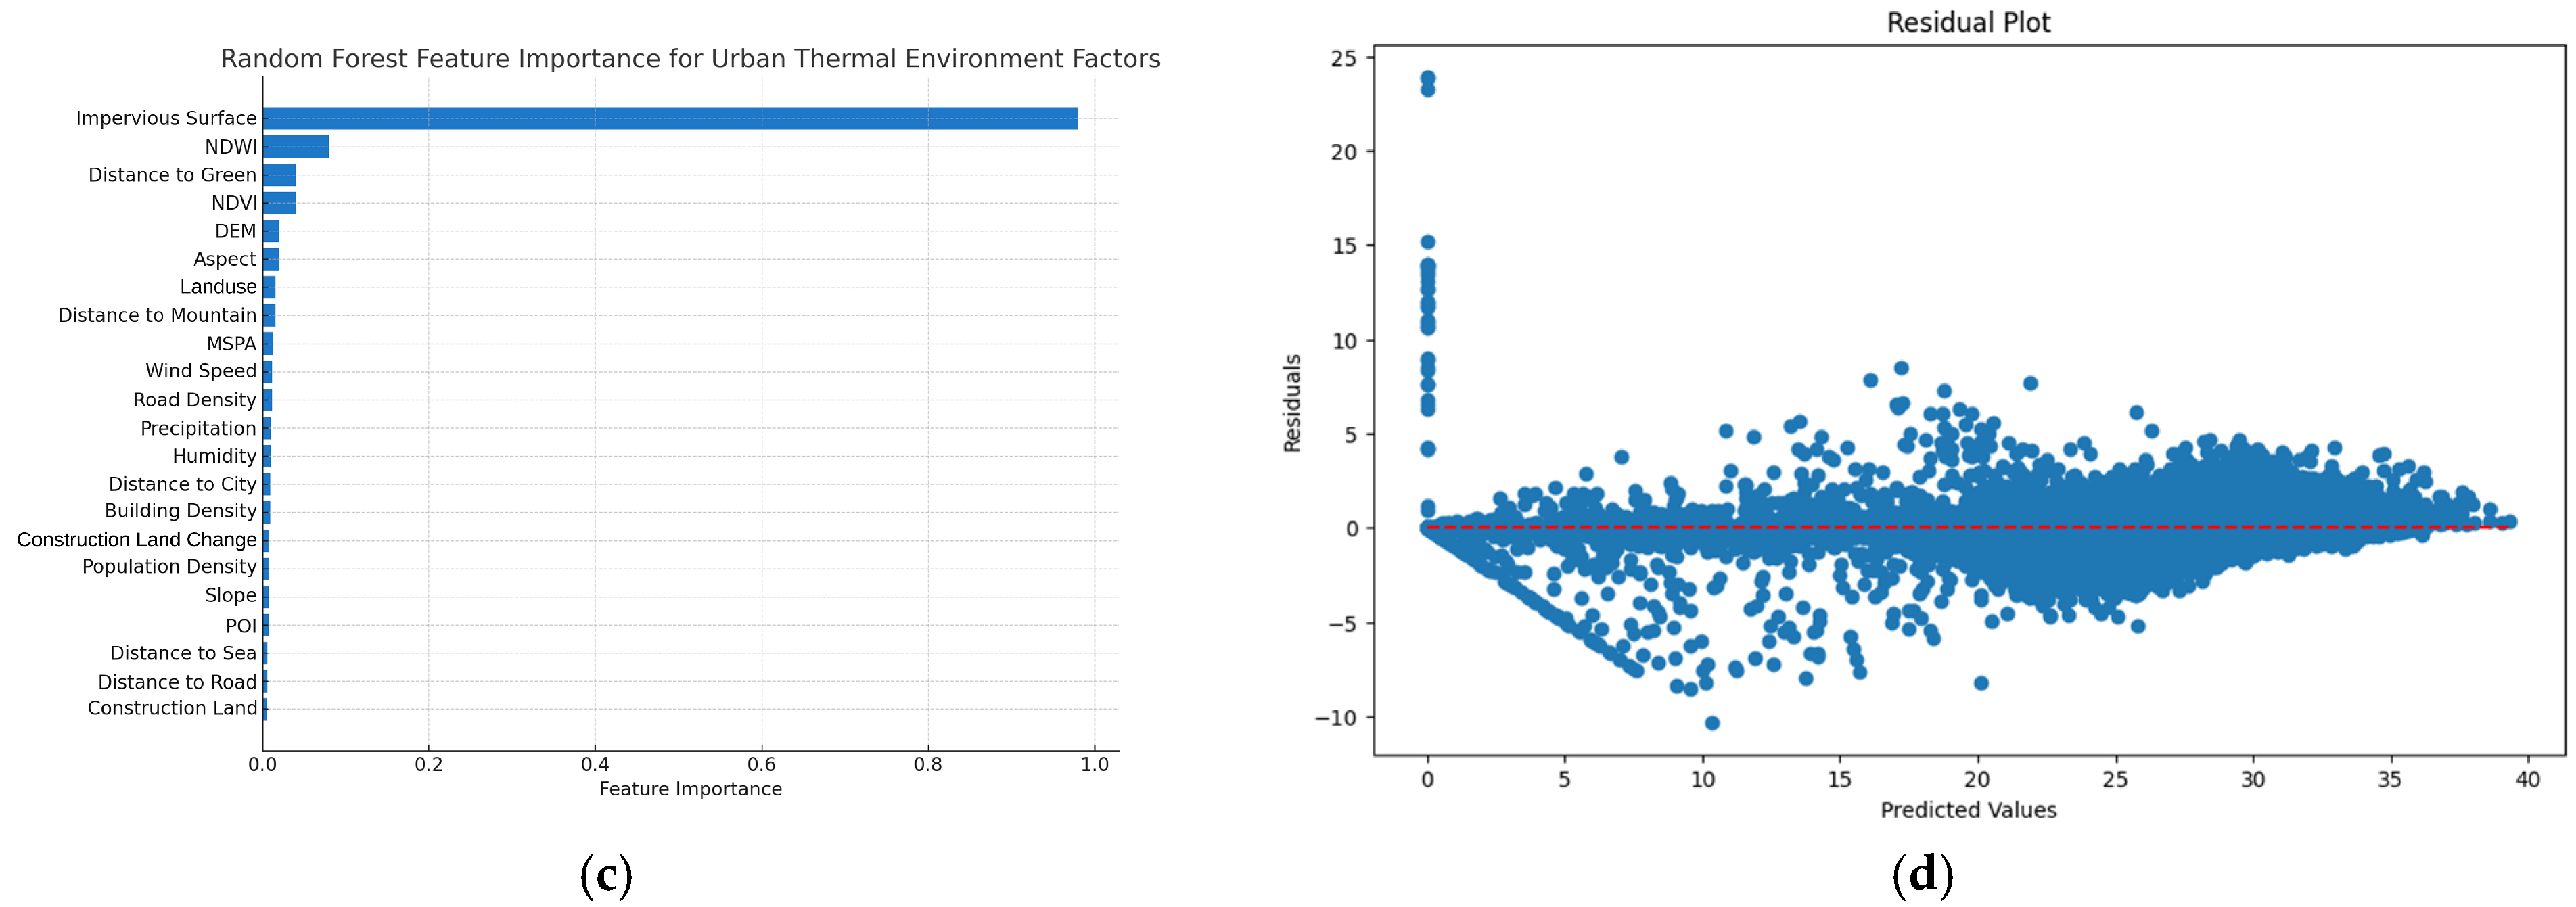
Feature importance results derived from the RF model, shown in
Figure 6c, indicate that impervious surface is the most critical predictor in the model, with a feature importance score of 0.98, significantly higher than all other variables. Secondary factors, such as NDWI (0.08), distance to green (0.04), and NDVI (0.04), also contribute to the model, though to a lesser extent. Other variables exhibited negligible importance scores, indicating minimal influence on the model’s predictive performance.
Moreover, the parameter tuning and error analysis of the RF model demonstrate its strong predictive capability in simulating LST. The final model achieved an R
2 value of 0.9992, suggesting that it explains nearly all the variance in the data. The Mean Absolute Error (MAE) was 0.1596, and the Mean Squared Error (MSE) was 0.1529, indicating a very low prediction error. As shown in the residual plot (
Figure 6d), the residuals are mostly centered around zero with no obvious systematic bias, further confirming the model’s stability and accuracy. These results collectively indicate that the optimized RF model provides high predictive accuracy and reliability for LST simulation.
In summary, the combined use of Pearson correlation analysis, PCA, and RF modeling enables a multidimensional evaluation of each variable’s influence on the thermal environment, corresponding to linear correlation, co-variation structure, and nonlinear importance, respectively. These methods are complementary and mutually reinforcing, thereby enhancing the stability and interpretability of the factor selection process. A total of 12 key variables were ultimately identified as critical drivers of the urban thermal environment: NDVI, distance to green, aspect, impervious surface, land use, distance to city, road density, distance to sea, precipitation, wind speed, humidity, and NDWI.
3.1.2. Integration of Characteristics of Highly Influential Factors in the Urban Thermal Environment
Twelve key factors with strong correlations to the urban thermal environment were identified, while low-relevance and redundant factors were eliminated. These high-impact factors were then integrated and analyzed based on the Mountain–City–Sea classification framework established in the previous section, forming three core groups: Mountain elements (including NDVI, distance to green, slope), City elements (including impervious surface, land use, distance to city, and road density), and Sea elements (including distance to sea, precipitation, wind speed, humidity, and NDWI).
Subsequently, the main features of each category of factors were further refined by PCA to generate a comprehensive layer that can effectively reflect the spatial characteristics of different categories and their impacts on the urban thermal environment (
Figure 7a). Detailed explanations of the variance proportions and contributions of the principal components are provided in
Figure 7b,c.
Figure 7b illustrates the proportion of total variance explained by each principal component, which aids in determining the appropriate number of components to retain.
Figure 7c presents the positive and negative contribution values of each variable within the principal components, helping to identify the dominant directions and functional tendencies of various spatial factors in shaping urban thermal environment characteristics.
3.2. Spatial Autocorrelation Test of the Mountain–City–Sea Pattern on the Urban Thermal Environment
Spatial autocorrelation tests were performed on the dependent variables before building the GWR model. The results of the global Moran’s I test (
Table 2) indicate that, in most years, the Moran’s I index for the urban thermal environment exhibited a strong positive correlation (Moran’s I > 0.7,
p < 0.001). This suggests that the spatial distribution of the urban thermal environment is non-random and exhibits significant spatial clustering, providing a solid foundation for subsequent analyses of the relationships between the three factor groups and the urban thermal environment.
The bivariate spatial autocorrelation analysis of the Mountain, City, and Sea elements with the urban thermal environment (
Table 3) indicates that between 2000 and 2020, both Mountain and City elements exhibited a positive correlation with the thermal environment. Notably, the City elements more strongly correlated with the thermal environment than the Mountain elements. In contrast, the Sea elements consistently demonstrated a significant negative correlation with the urban thermal environment. Between 2000 and 2023, the positive correlation between Mountain elements and the thermal environment gradually weakened, eventually becoming negative by 2023. Meanwhile, both the positive correlation between City elements and the thermal environment and the negative correlation between Sea elements and the thermal environment exhibited a continuous strengthening trend over time.
The results of the spatial autocorrelation analysis indicate that most variables exhibit significant spatial clustering, demonstrating a clear basis of spatial heterogeneity. Therefore, it is appropriate to apply the GWR method to further explore the spatial variation in the strength and direction of each factor’s response to the urban thermal environment.
3.3. Spatial Heterogeneity of the Impact of the Mountain–City–Sea Pattern on the Urban Thermal Environment
As shown in
Table 4, the GWR model demonstrates a high goodness-of-fit (R
2) for the relationships between the Mountain, City, and Sea elements and the urban thermal environment in Xiamen. Additionally, the model yields low AICc and low residual sum of squares, indicating its high accuracy in explaining the spatial distribution and intensity of the effects of different urban pattern elements on the thermal environment.
The results reveal significant spatial heterogeneity in thermal environment changes across different years and regions, reflecting variations in the distribution of warming and cooling effects.
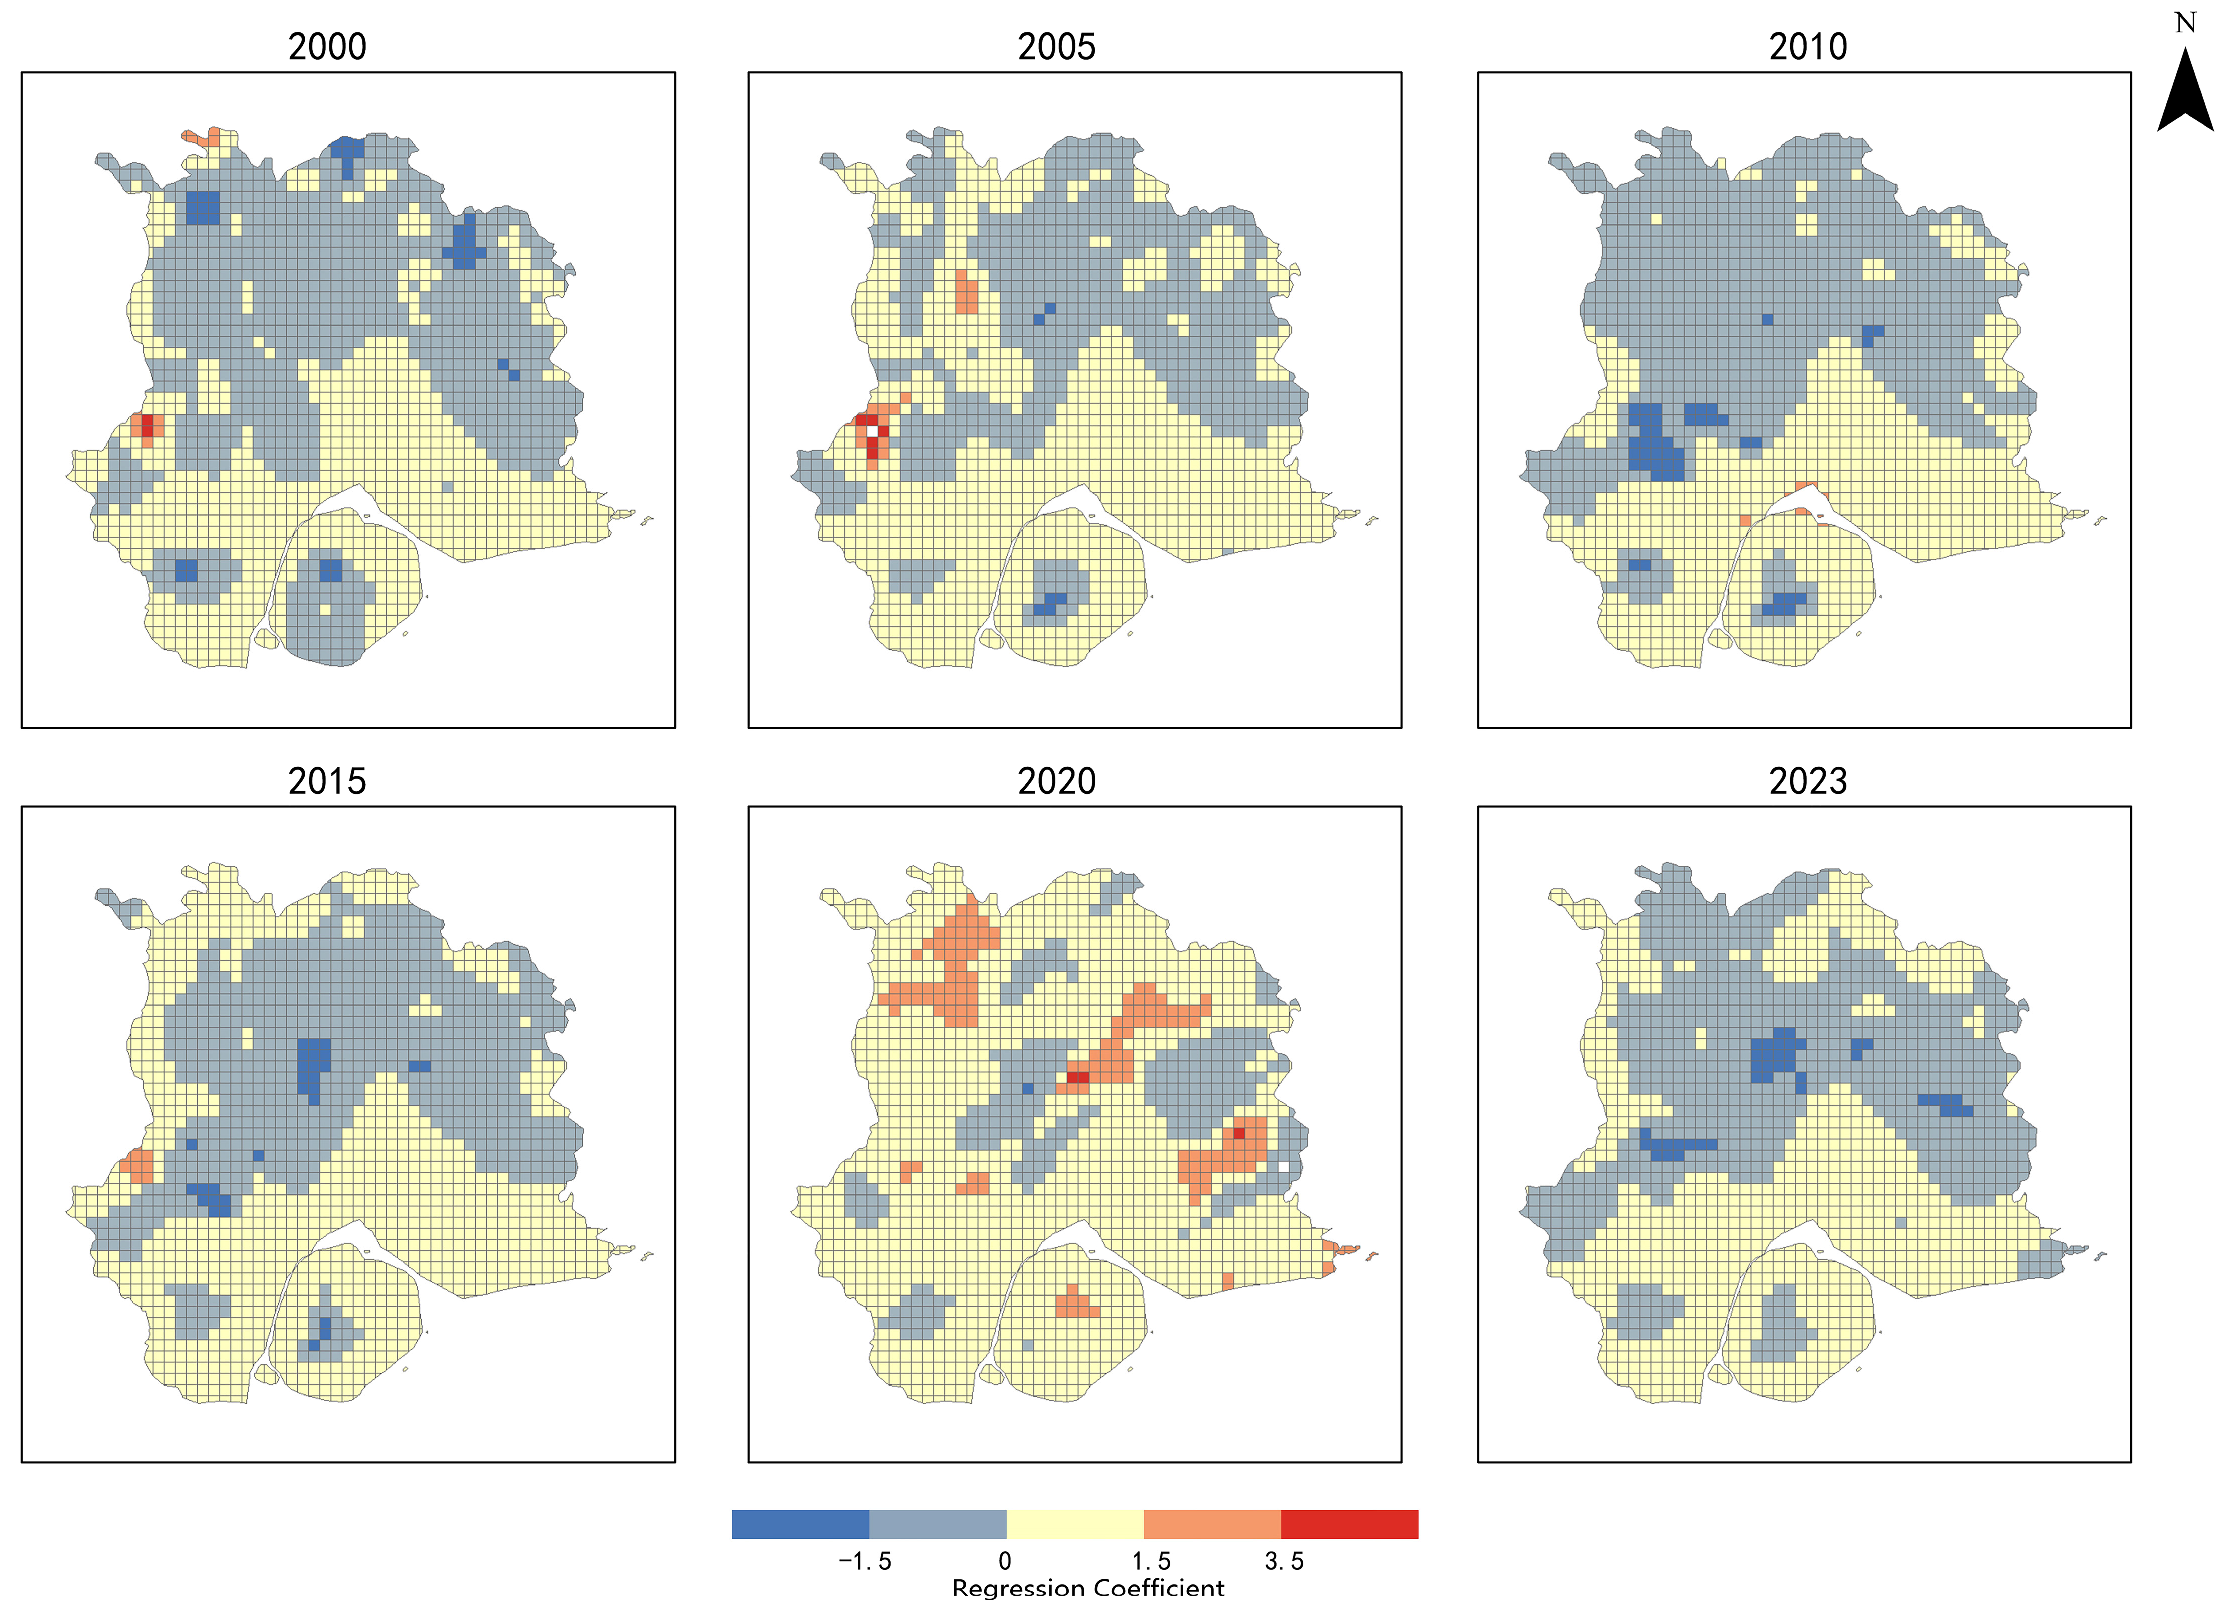
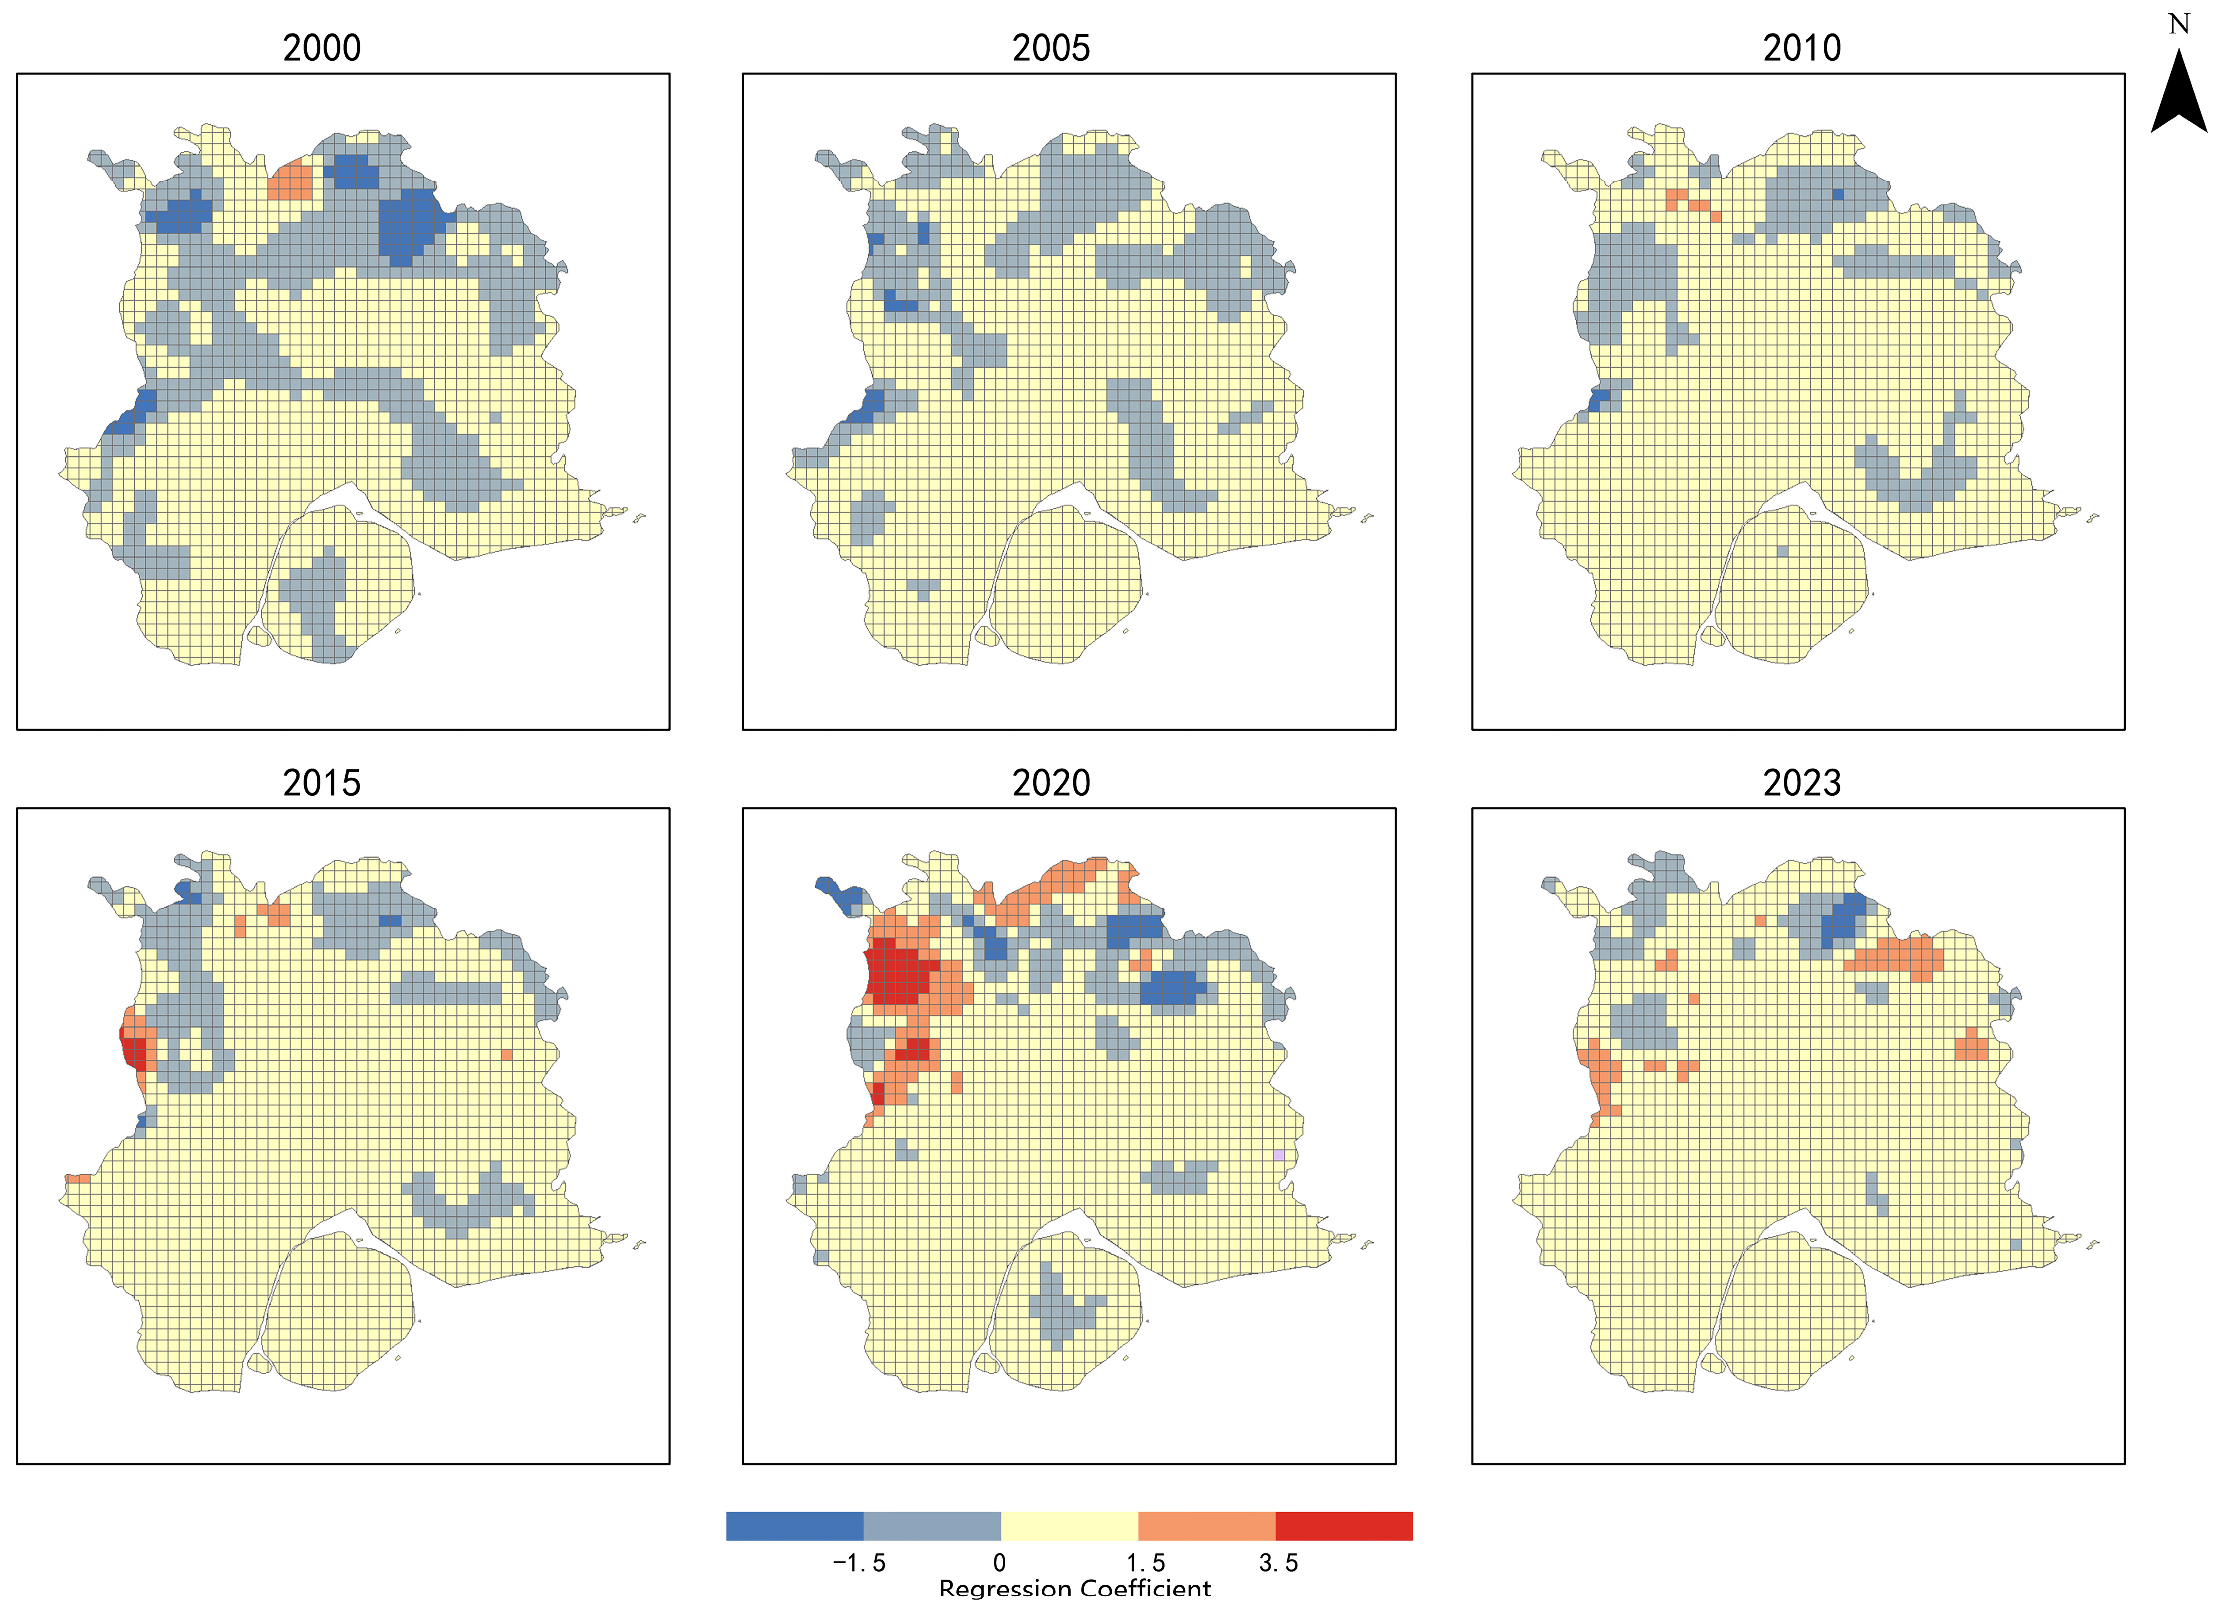
Figure 8 presents the spatial distribution of local regression coefficients for Mountain elements to temperature changes. The findings indicate that the positive correlation between Mountain elements and the thermal environment is primarily concentrated in the core built-up area of Xiamen Island, as well as the southern, western, and northeastern parts of the outer island regions. Among these, the western region exhibits the most pronounced warming effect, with an intensity exceeding that observed in the southern and northeastern areas. Between 2000 and 2010, the warming variation in parts of the western and northeastern regions showed signs of moderation, suggesting that during this period, urban expansion had a relatively tempered impact on Mountain elements. However, from 2015 to 2023, as urban development continued to accelerate, the environmental carrying capacity of these areas declined, leading to a renewed intensification of the warming variation. Simultaneously, the UHI effect within the core built-up area of Xiamen Island expanded, resulting in a broader warming range, though regulatory measures in 2023 contributed to a partial mitigation of this effect.
In contrast, the negative correlation between Mountain elements and the thermal environment is predominantly observed in the high-altitude areas located in the northern-central part of the city. These areas have undergone a “dispersion–concentration–dispersion” transition over time. Regions such as Wanshi Mountain and Dongping Mountain, which previously exhibited strong cooling effects, have seen their regulatory capacity diminish due to urban development, leading to a gradual reduction in their cooling influence, particularly in 2020 and 2023 when the cooling effect weakened further. This trend suggests that while mountainous areas possess inherent thermal buffering capabilities, their cooling potential is being progressively eroded by ongoing urbanization.
The influence of City elements on the urban thermal environment (
Figure 9) has progressively expanded from Xiamen Island to the outer new towns, with particularly pronounced effects in areas such as Haicang and Xiang’an. Between 2015 and 2020, the northern urban areas exhibited the strongest positive correlation between City elements and the thermal environment, highlighting the significant impact of new town development on urban heat patterns. Meanwhile, the core urban area of Xiamen Island has consistently maintained a high level of positive correlation, underscoring the persistent role of high-density buildings and impervious surfaces in intensifying the urban thermal environment. However, from 2020 to 2023, urban greening initiatives, ecological restoration projects, and other regulatory measures contributed to a localized reduction in the positive correlation, suggesting that some areas experienced a partial alleviation of the UHI effect. Furthermore, as northern mountainous areas underwent development, their natural cooling and regulatory functions were progressively diminished. This led to a notable reduction in the cooling effect of City elements in these regions, further emphasizing the profound impact of urbanization on the spatial dynamics of the thermal environment.
The influence of Sea elements on the urban thermal environment (
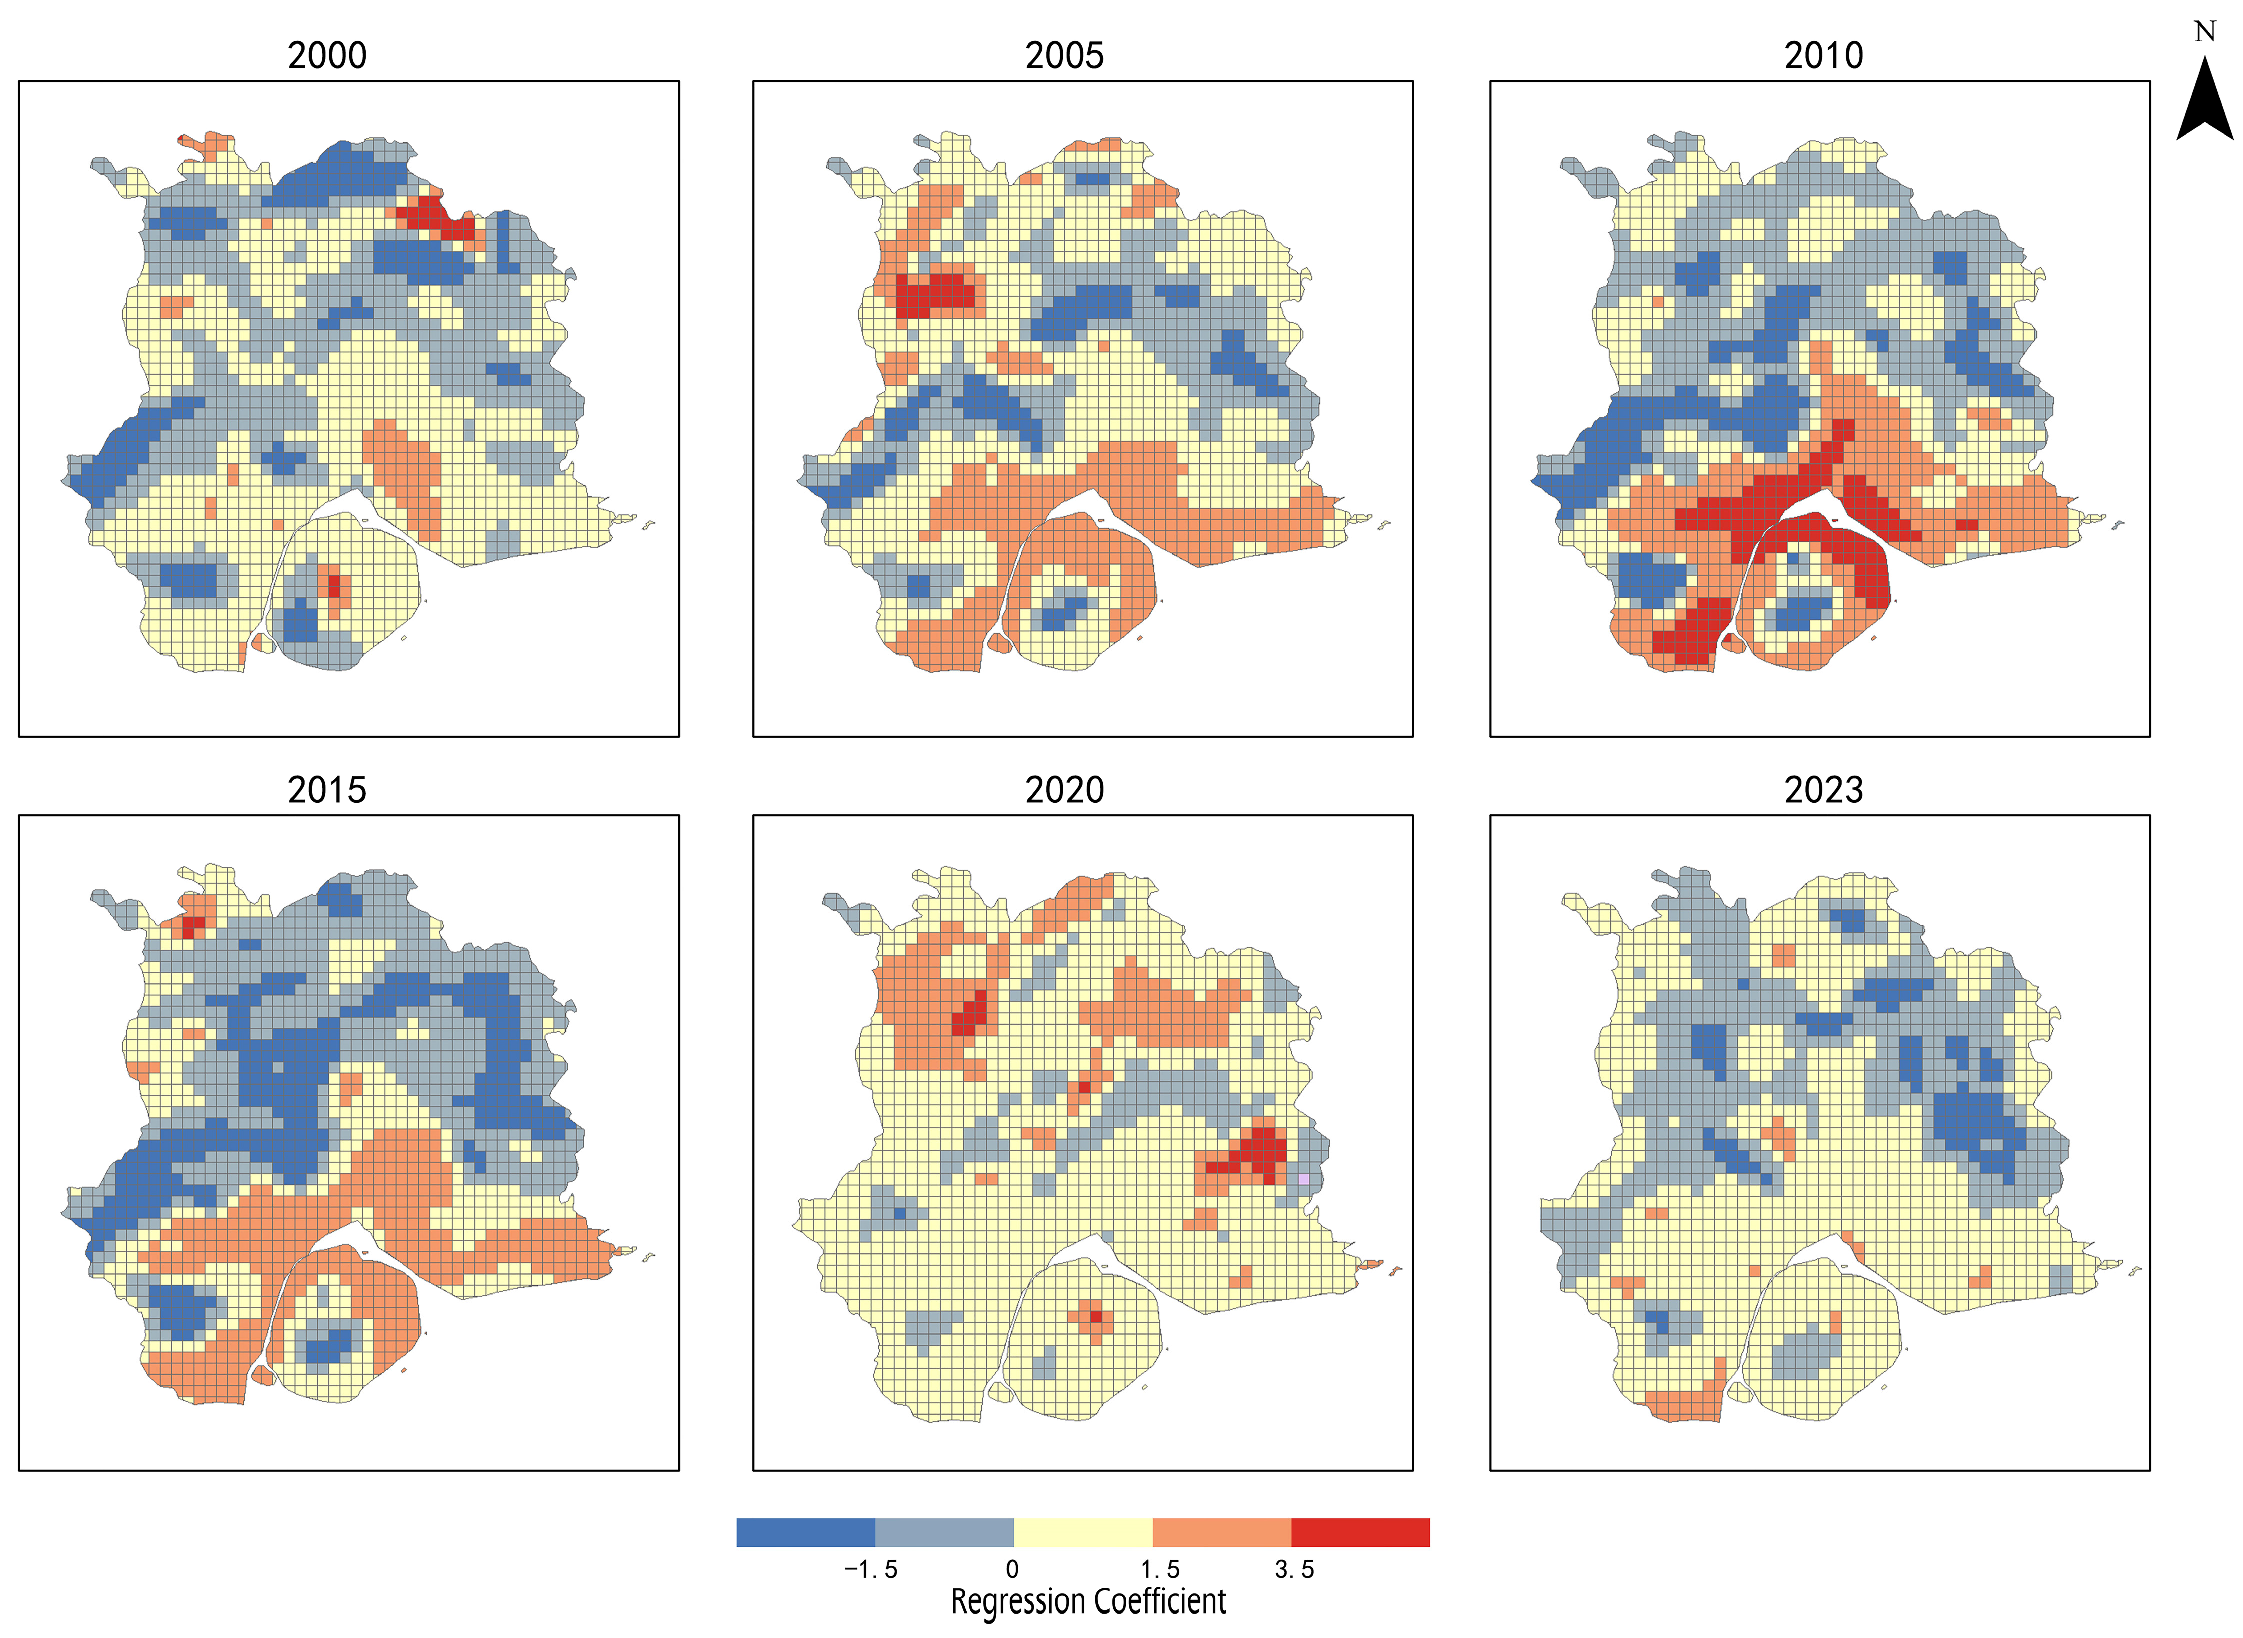
Figure 10) is primarily concentrated in the central urban areas (cooling effect) and the southern coastal areas (warming effect). Positive correlations are predominantly observed in land reclamation zones, newly developed coastal districts, and high-density urban areas, such as the northwestern part of Xiamen Island, southern Jimei, and the Haicang coastal zone. In these areas, the expansion of impervious surfaces, the reduction of coastal green spaces, and the obstruction of sea breeze corridors have significantly weakened the ocean’s regulatory capacity, leading to higher urban temperatures. Between 2000 and 2015, the warming influence of coastal areas in southern and eastern Xiamen expanded continuously, indicating a gradual decline in the ocean’s buffering capacity against thermal fluctuations. From 2015 to 2023, certain regions experienced a moderation in the warming variation due to coastal greening efforts, wetland restoration, and the optimization of sea breeze corridors. However, these measures did not fully restore the ocean’s original cooling effect. Notably, between 2020 and 2023, intensified urbanization significantly weakened the cooling effect in central areas, with some zones even transitioning from cooling to warming. This shift underscores the deterioration of marine ecological functions and the exacerbation of the urban heat island effect, further illustrating the intricate interplay between urban expansion and climate regulation.
3.4. Identification and Zoning Strategies for the Comprehensive Impact of the Mountain–City–Sea Pattern on the Urban Thermal Environment
To identify urban thermal environment impact zones and develop targeted zoning regulation strategies, this study employs the K-means clustering algorithm to classify local regression coefficients of key influencing factors.
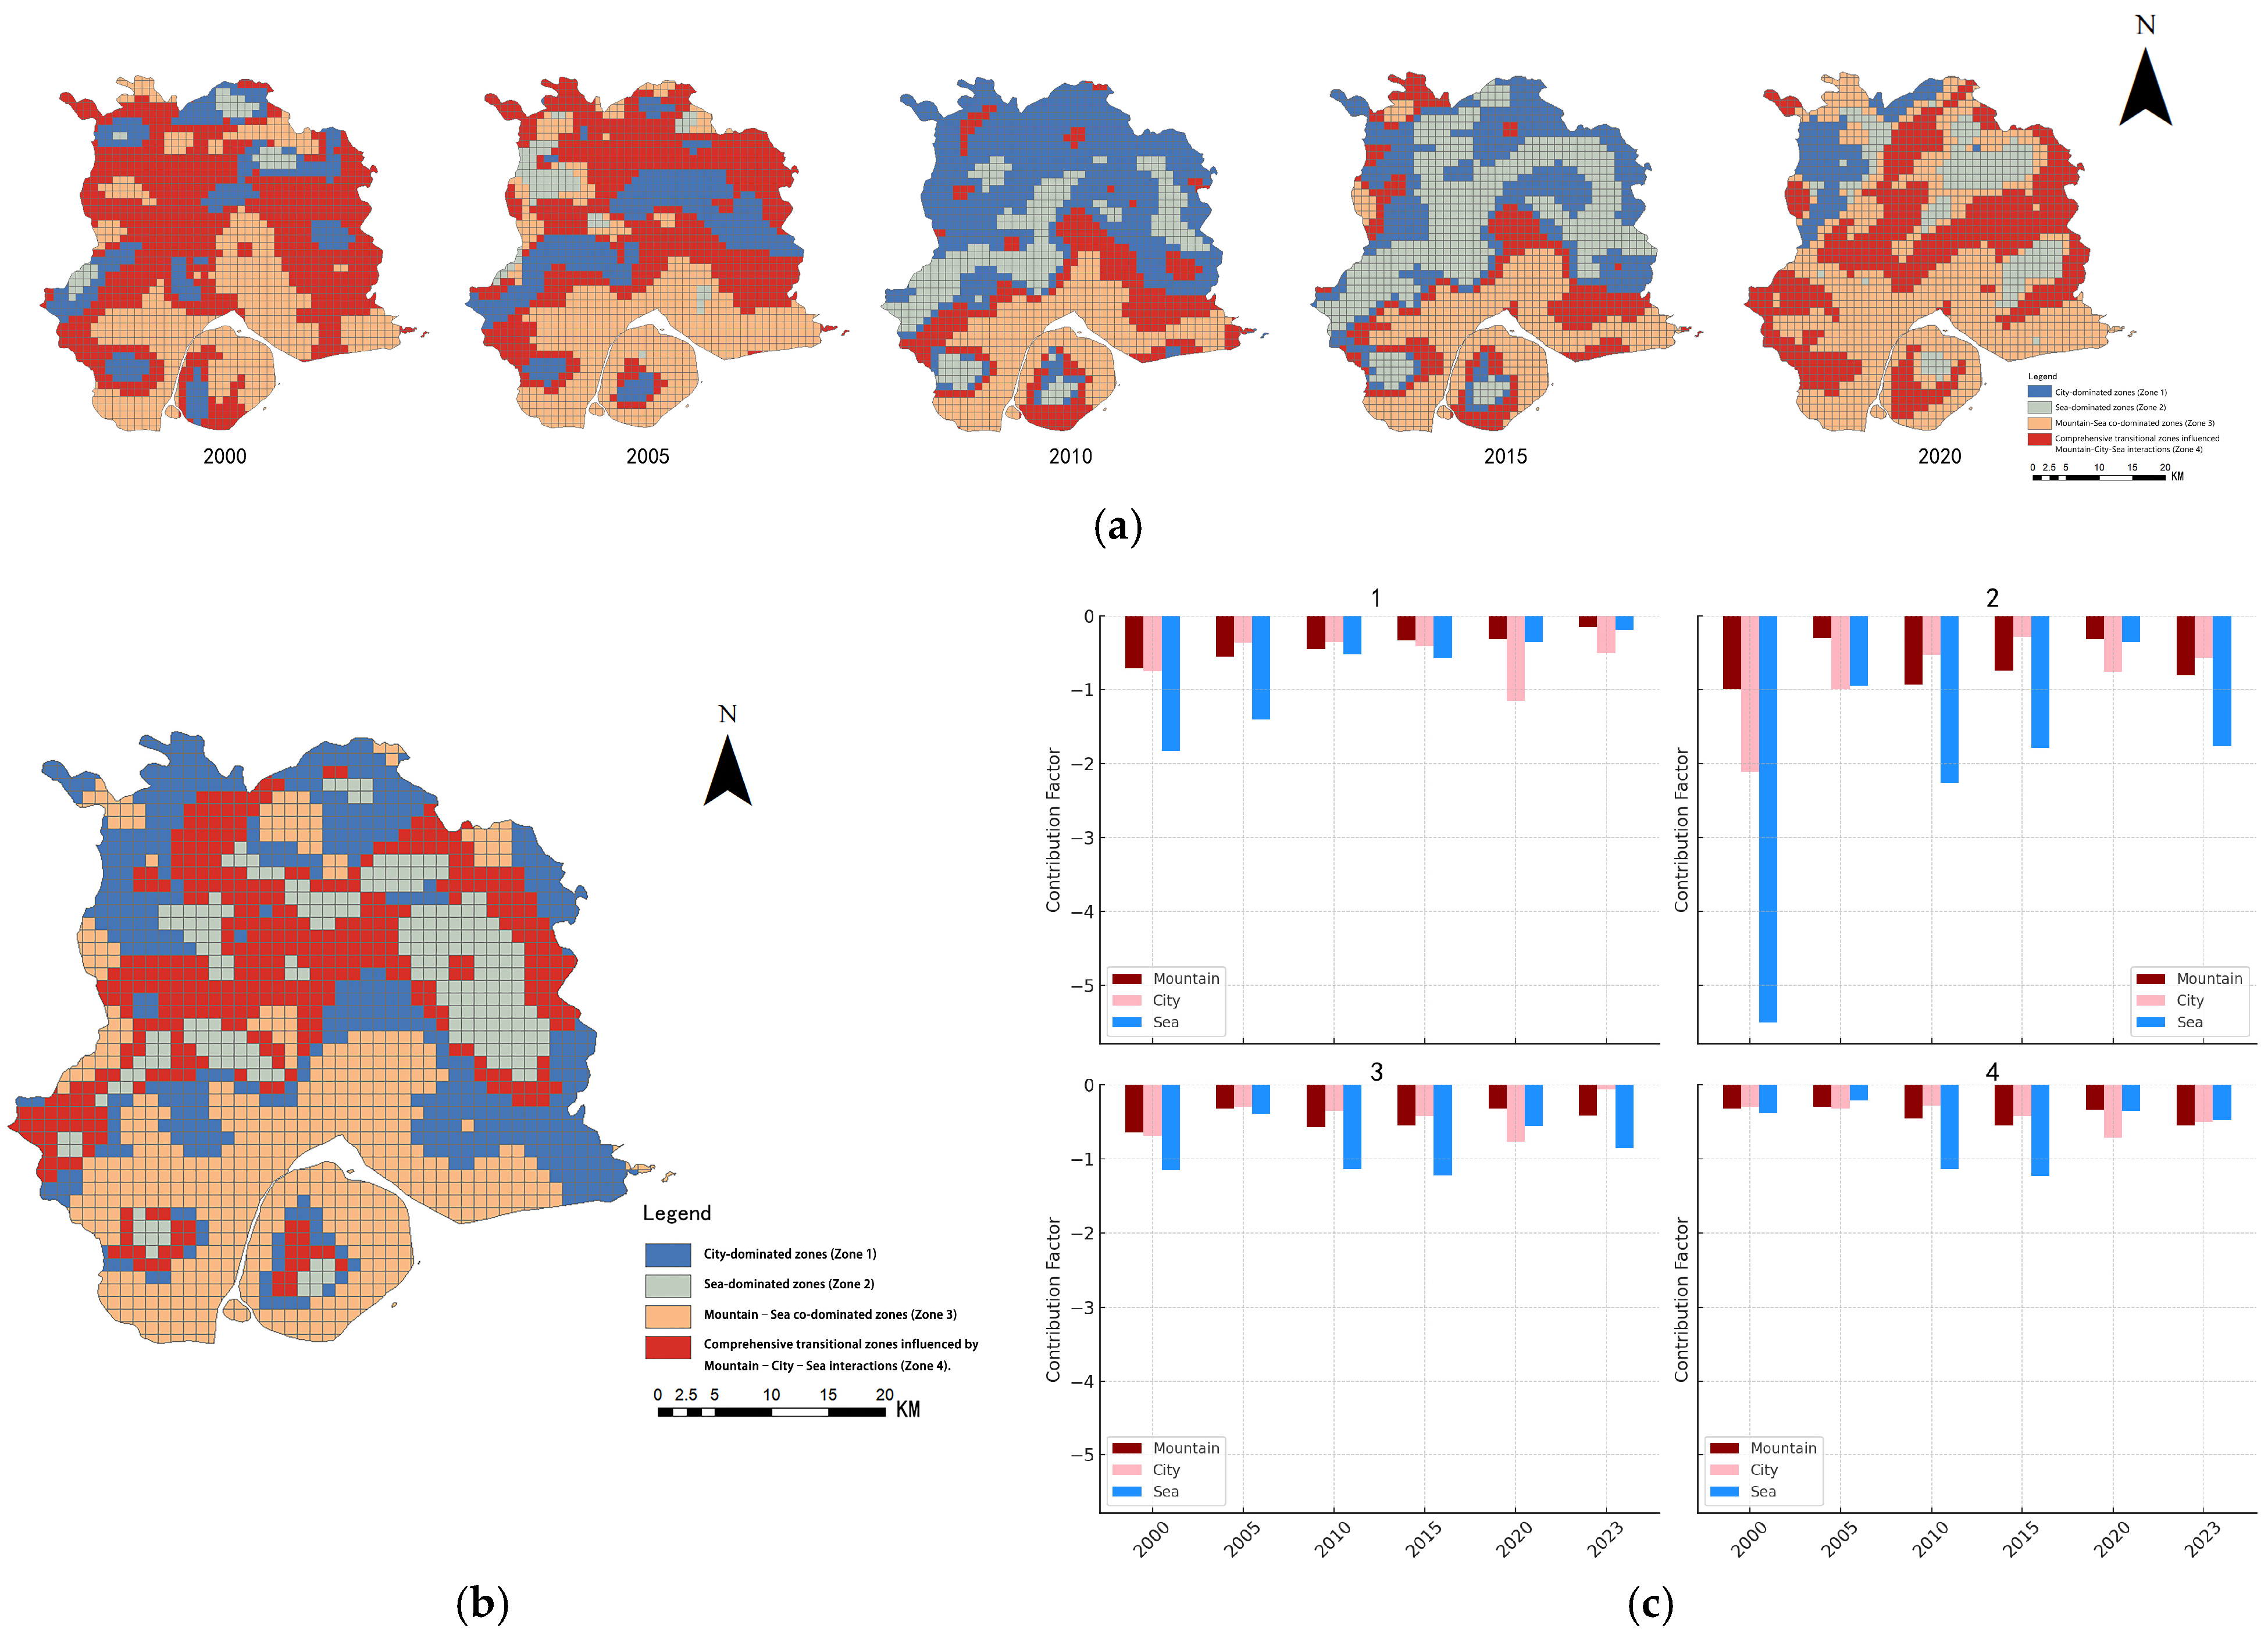
Figure 11 illustrates the spatial distribution characteristics of the identified zones and the mean regression coefficients of internal influencing factors. The results reveal significant variations in the average GWR regression coefficients of different factors across the identified zones. Between 2000 and 2023, the Sea-dominated zones consistently accounted for a larger proportion of thermal environmental influence compared to the City-dominated zones, whereas the impact of the Mountain-dominated zones remained the smallest. However, in recent years, the influence of Sea-dominated zones has gradually weakened, indicating a declining capacity of marine elements to regulate the thermal environment compared to previous periods.
To refine the zoning-based thermal environment regulation strategies, this study analyzed the 2023 K-means clustering results, identifying the relative influence of different indicators on LST within each zone. Based on the differences in the mean regression coefficients of the same indicators across different zones, the study area was classified into four distinct types: City-dominated zones (Zone 1), Sea-dominated zones (Zone 2), Mountain–Sea co-dominated zones (Zone 3), and Comprehensive transitional zones influenced by Mountain–City–Sea interactions (Zone 4). To address the distinct impacts of urban spatial form factors on the thermal environment across different subregions, targeted regulation strategies have been proposed for each zone (
Table 5).
3.4.1. City-Dominated Zones (28%)
The City-dominated zones are primarily concentrated in Xiamen’s central urban core and the newly developed peripheral districts. These areas are characterized by the dominant influence of City elements on the thermal environment, followed by Sea elements, with Mountain elements exerting the least impact. From a mechanistic perspective, the thermal environmental effects in City-dominated zones are primarily driven by urban elements such as building density and road coverage. On the one hand, high-density buildings and extensive road networks significantly suppress latent heat exchange processes, causing surface energy to be more readily converted into sensible heat, thereby leading to elevated land surface temperatures. On the other hand, limited surface ventilation corridors hinder the dissipation of accumulated heat, further intensifying localized heat retention effects. Although Mountain elements provide some cooling benefits, their influence within this zone remains relatively limited, making it challenging to establish an effective thermal regulation mechanism. Therefore, it is recommended to optimize urban heat source control, enhance building energy efficiency management, and promote cool roof technology and permeable pavements to reduce heat accumulation. Additionally, efforts should be made to strengthen the development of sea breeze corridors, align with coastal wind field characteristics, and optimize urban ventilation pathways to leverage natural airflow for reducing urban heat loads, thereby improving the overall urban thermal environment.
3.4.2. Sea-Dominated Zone (13%)
The Sea-dominated zone is primarily located in the central urban region, where Sea elements play a significantly more dominant role in shaping the thermal environment than Mountain or City elements. Consequently, conventional approaches such as adjusting building density or expanding vegetation coverage alone prove insufficient in effectively mitigating urban heat in this area. To further enhance the thermal regulatory function of marine elements, it is recommended to leverage the integrated mechanism of “evaporative cooling–wind field ventilation–humidity regulation”. This can be achieved by strengthening the spatial synergistic effects between water bodies and green spaces, thereby constructing coastal ecological buffer zones and optimizing the regional microclimate.
3.4.3. Mountain–Sea Co-Dominated Zone (34%)
The Mountain–Sea co-dominated zone represents the largest proportion of all identified zones. Unlike other regions, this area is distinguished by the greater influence of Mountain elements on LST relative to City elements, with Mountain and Sea elements jointly exerting a dominant regulatory role. This phenomenon is likely attributable to the high vegetation coverage and the topographical characteristics of mountainous areas, which enhance their capacity for thermal environment regulation. Therefore, to further enhance the synergistic regulatory role of mountainous and marine elements in the thermal environment, it is recommended to integrate the Mountain-based mechanism of “ecological buffering and ventilation guidance”. This can be achieved by strengthening ecological protection of mountainous areas, strictly limiting development activities, and increasing vegetation coverage, thereby reinforcing the buffering capacity of mountainous regions in regulating the urban thermal environment. Additionally, the development intensity and spatial configuration of water bodies and coastal areas should be strategically adjusted by topographical features to ensure the synergistic regulatory effect of Mountain and Sea elements is fully leveraged.
3.4.4. Comprehensive Transitional Zone Influenced by Mountain–City–Sea Interactions (24%)
The Comprehensive transitional zone exhibits moderate regression coefficients across all indicators, suggesting a balanced impact of Mountain, City, and Sea elements on LST. Compared to other zones, the regression coefficients in this area remain relatively stable, reflecting its distinct transitional characteristics. Given these conditions, this zone offers an opportunity for integrated spatial optimization strategies to mitigate the UHI effect. Enhancing ecological infrastructure development by expanding urban green spaces and waterfront landscapes within this zone can effectively improve overall cooling capacity. Additionally, promoting coordinated development among Mountain, Sea, and City elements through integrated planning and management will help balance urban expansion with natural ecosystem conservation, ensuring more equitable and effective thermal environment regulation.
Figure 11.
K-means clustering analysis results. (a) Zoning of the impact of urban pattern elements on the thermal environment, 2000–2020; (b) subdivision of the impact of urban pattern elements on the thermal environment, 2023; (c) mean MGWR regression coefficients within each impact subzone.
Figure 11.
K-means clustering analysis results. (a) Zoning of the impact of urban pattern elements on the thermal environment, 2000–2020; (b) subdivision of the impact of urban pattern elements on the thermal environment, 2023; (c) mean MGWR regression coefficients within each impact subzone.
Table 5.
Mechanisms of the thermal environment of each type of urban pattern and the corresponding regulation strategy proposals.
Table 5.
Mechanisms of the thermal environment of each type of urban pattern and the corresponding regulation strategy proposals.
| Zone Type | Adaptive Regulation Strategies |
|---|
City-Dominated Zone
(Zone 1) | (1) Promote building density control and energy efficiency improvements (e.g., implementation of green building standards);
(2) Construct “cool roofs” and high-albedo pavements;
(3) Increase urban green space coverage and establish small-scale urban cool island nodes;
(4) Optimize ventilation corridors to ensure the continuity of sea breeze pathways. |
Sea-Dominated Zone
(Zone 2) | (1) Enhance the connectivity between waterfront green spaces and aquatic systems;
(2) Avoid land reclamation and high-intensity hard-surface development along the coast;
(3) Establish wetland parks and ecological flood retention zones;
(4) Maintain unobstructed sea breeze corridors and optimize urban layout in alignment with prevailing wind directions during high-temperature seasons;
(5) Control urban development density in high-humidity areas. |
| Mountain–Sea Co-Dominated Zone (Zone 3) | (1) Strengthen the protection and restoration of mountainous ecosystems;
(2) Utilize topographic features to establish natural ventilation corridors;
(3) Control development intensity at mountain foothills and in valleys to prevent heat accumulation;
(4) Integrate spatial management of coastal and mountainous areas to ensure the continuity of the “mountain–sea wind corridor”;
(5) Develop ecological green corridors to connect mountainous and marine elements. |
| Comprehensive Transitional Zone Influenced by Mountain–City–Sea Interactions (Zone 4) | (1) Implement zoning- and classification-based regulatory strategies tailored to local conditions;
(2) Strengthen the construction of integrated ecological infrastructure;
(3) Coordinate urban development with ecological conservation;
(4) Establish a composite landscape-based thermal regulation system;
(5) Develop fine-grained heat regulation plans adapted to different microclimatic zones. |
4. Discussion
With intensifying UHI effects against the backdrop of global climate change, optimizing spatial environments based on urban morphological patterns to mitigate thermal stress has become a critical issue in contemporary urban planning and research. As a representative city characterized by a compound Mountain–City–Sea composite pattern, Xiamen experiences pronounced heat-related hazards, making it an ideal case for exploring the coupling mechanisms between urban form and thermal environments. This study takes Xiamen as the research subject and establishes a structural classification system for the Mountain–City–Sea pattern. By identifying key influencing factors of the thermal environment and applying GWR and K-means clustering methods, the study reveals the spatial heterogeneity of various morphological elements’ impacts on LST, along with their corresponding regional characteristics. The findings provide theoretical support for the development of typology-based thermal regulation strategies under compound urban configurations, offering significant practical implications for heat risk management and spatial optimization in similarly structured cities.
Based on the GWR model, this study reveals the spatial heterogeneity in the impacts of different types of elements within Xiamen’s Mountain–City–Sea spatial structure on the urban thermal environment. The results show that the intensity of influence of various morphological components on the thermal environment differs significantly across regions, which is consistent with findings from related studies conducted in cities with similar spatial patterns [
39]. Notably, the thermal effects induced by urban elements in Xiamen exhibit a distinct trend of expansion from the core towards the periphery. This pattern is closely associated with the rapid development of new urban areas outside the island, increased road density, and rising building density over the past two decades. Urban expansion has led to a rapid increase in impervious surfaces, which has disrupted the original green space systems and ventilation corridors provided by water bodies, thereby exacerbating heat accumulation. These findings align with research by Wang [
20], which identified the rapid growth of impervious surfaces and the encroachment on green systems during urban expansion as key driving forces behind the intensification of the urban heat island effect, particularly pronounced in coastal cities.
By contrast, the impact of Mountain elements on the thermal environment exhibits more complex spatiotemporal evolution characteristics. The study found that areas with high vegetation coverage in the northern and southwestern parts of Xiamen Island originally played a significant role in temperature regulation. However, this cooling effect has markedly weakened since 2015, particularly after urban expansion encroached upon the edges of mountainous regions. This led to obstructed ventilation corridors and the degradation of ecological cooling sources, resulting in a continued contraction of the cooling influence. A similar trend was observed in Estoque’s study on the mountainous city of Manila [
8], which highlighted that as montane green spaces are increasingly compressed by urbanization, their cooling capacity undergoes a degradation process characterized by “edge deterioration–core failure”.
In addition, the regulatory capacity of marine elements also exhibits significant spatial variation across Xiamen. The study found that certain areas near the southern and eastern coastal zones initially benefited from a strong oceanic buffering effect. However, with the advancement of coastal development and land reclamation projects, the continuity of coastal green spaces and water bodies has been disrupted. This interruption has broken the natural sea breeze corridors, leading to the emergence of localized warming centers instead. This phenomenon, referred to as the “reversal of marine elements,” poses new challenges for urban thermal environment management. Similar mechanisms have been observed in other coastal compound cities, such as Tokyo Bay, where the cooling potential of the ocean is rapidly diminished under the impact of shoreline development, even resulting in zones of heat accumulation [
40].
As a highly spatially heterogeneous and multi-factor coupled complex system, the city poses significant challenges for thermal environment regulation. To systematically delineate the multidimensional characteristics within urban areas, this study refers to previous research, notably the Local Climate Zones (LCZ) classification proposed by Stewart [
41], which attempts to categorize urban spatial morphology into 17 distinct climate zones, each with specific thermal environmental characteristics. While the LCZ method has demonstrated broad applicability in standardizing the representation of urban thermal environments, it falls short in explaining the underlying mechanisms of thermal effects across different types of urban areas, thereby limiting its utility in informing targeted zoning-based regulatory strategies. In contrast, the results of this study suggest that a zoning framework constructed through spatial response analysis of GWR regression coefficients combined with K-means clustering can effectively identify the variations in the coupling mechanisms between urban morphology and thermal environments across different regions. This approach enables the development of a mechanism-oriented classification framework for urban thermal environments. Therefore, the methodology proposed in this study provides a viable path toward context-sensitive and fine-grained regulation of the urban thermal environment, helping to overcome the limitations of traditional “one-size-fits-all” strategies under global-scale approaches.
5. Conclusions
This study systematically extracted and quantified key influencing factors of the urban thermal environment using multi-source data, including NDVI, DEM, impervious surfaces, and land use. A comprehensive urban pattern dataset incorporating Mountain, City, and Sea elements was constructed. Following rigorous data preprocessing and filtering, various models were employed to analyze spatial correlation variations between urban patterns and the thermal environment while also formulating zoning-based regulation strategies. The main conclusions are as follows:
(1) The spatial correlation between urban pattern elements and the thermal environment in Xiamen exhibits significant spatial autocorrelation. The analysis revealed that Mountain and City elements exhibited a positive correlation with the thermal environment in most years (2000–2020), whereas Sea elements consistently demonstrated a significant negative correlation. These results indicate that thermal environment variations exhibit strong spatial clustering characteristics, providing a solid foundation for applying the GWR model to further explore the dynamic patterns of thermal environment changes within these regions.
(2) The GWR model revealed spatial heterogeneity in the warming and cooling effects of different urban pattern elements. The warming effect of Mountain elements gradually weakened in parts of southern and western Xiamen, while intensifying in the core urban areas and inland regions. Meanwhile, the original cooling function of mountainous areas has been progressively diminished due to urbanization and development. City elements contribute to warming across 91% of the total urban area, with particularly pronounced effects in western Xiamen, whereas in high-altitude regions, the warming effect is relatively moderated by mountainous regulation. The influence of Sea elements is concentrated in coastal and central Xiamen, where accelerated urbanization has significantly weakened the natural cooling capacity of marine elements, resulting in the transformation of some cooling zones into warming areas. This finding highlights the declining capacity of marine elements to regulate the thermal environment under intensified urban development.
(3) The zoning results of the Mountain–City–Sea pattern’s impact on the thermal environment classified the study area into four distinct regulation zones, each with tailored strategies aligned with specific regulatory priorities. In City-dominated zones, emphasis should be placed on enhancing building energy efficiency management, promoting cool roof technologies, and implementing permeable pavements to mitigate heat accumulation and reduce urban heat stress. In Sea-dominated zones, it is crucial to strengthen the synergistic interaction between water bodies and green spaces to enhance coastal microclimatic regulation and mitigate thermal anomalies. For Mountain–Sea co-dominated zones, priority should be given to reinforcing montane ecological conservation, while strategically adjusting the development intensity and spatial configuration of coastal and marine areas by topographical characteristics to ensure that the synergistic regulatory effects of Mountain and Sea elements are fully leveraged. Lastly, in Comprehensive transitional zones, a holistic and integrated planning approach should be adopted to optimize the spatial interplay among Mountain, City, and Sea elements, fostering a balanced and adaptive thermal environment regulation strategy that enhances urban resilience and climate responsiveness.
Although this study quantitatively assessed the thermal impacts of Mountain, City, and Sea elements on Xiamen’s environment at the city scale and proposed corresponding optimization strategies, several limitations remain. First, the data sources primarily rely on remote sensing imagery and publicly available statistical datasets. These are constrained by limitations in spatial resolution and temporal sampling frequency, particularly under highly dynamic conditions such as extreme heat events or short-term meteorological disturbances, where response delays and insufficient representational accuracy may occur. Second, in terms of spatial unit selection, although the use of regulatory planning units aligns with urban planning and management needs, it may overlook certain spatial heterogeneities compared to finer-grained grid-based scales, thereby limiting the capacity to fully capture the multiscale mechanisms underlying thermal environmental responses.
To address these issues, future research may be advanced in the following directions: (1) integrating high-frequency remote sensing imagery with ground-based meteorological observations to enhance the temporal precision and dynamic responsiveness of urban thermal environment modeling; (2) adopting a multiscale research framework that synthesizes differentiated information across various spatial scales to compensate for regulatory limitations and explore the potential for multi-scalar urban heat governance; and (3) expanding the case study scope to include comparative empirical analyses across different geomorphological types and climatic zones, thereby improving the adaptability and generalizability of the proposed model framework.
In summary, future research should focus on enhancing data accuracy, expanding mechanism-based modeling approaches, refining scale systems, and strengthening regional applicability. Such efforts will contribute to a more comprehensive, systematic, and precise technical foundation for urban heat risk management and climate-adaptive spatial governance.
Author Contributions
Conceptualization, L.O. and H.G.; methodology, L.O.; software, X.S. and H.G.; validation, X.S.; formal analysis, H.G.; investigation, T.H.; resources, T.H.; data curation, L.O.; writing—original draft preparation, L.O.; writing—review and editing, H.G.; visualization, H.G.; funding acquisition, T.H. All authors have read and agreed to the published version of the manuscript.
Funding
This research was funded by National Natural Science Foundation of China Youth Science Fund Project (Grant No. 52408010), and Fujian Provincial Social Science Fund Project Youth Project (Grant No. FJ2023C067).
Institutional Review Board Statement
Not applicable.
Informed Consent Statement
Not applicable.
Data Availability Statement
Data are contained within the article.
Conflicts of Interest
The authors declare no conflicts of interest.
References
- IPCC-Special-Report. 2024. Available online: https://www.ipcc.ch/site/assets/uploads/sites/2/2019/09/IPCC-Special-Report-1.5-SPM_zh.pdf (accessed on 29 May 2024).
- Temperatures Rising: NASA Confirms 2024 Warmest Year on Record. Available online: https://www.nasa.gov/news-release/temperatures-rising-nasa-confirms-2024-warmest-year-on-record/ (accessed on 10 January 2025).
- Shen, Z.; Zeng, J.; Ren, L. The spatiotemporal coupling relationship of landscape pattern and thermal environment in XIAMEN, 2002–2017. Chin. Landsc. Archit. 2021, 37, 100–105. [Google Scholar]
- Zhao, L.; Lee, X.; Smith, R.B.; Oleson, K. Strong contributions of local background climate to urban heat islands. Nature 2014, 511, 216–219. [Google Scholar] [CrossRef] [PubMed]
- Ding, W.; Hu, Y.; Dou, P. Study on interrelationship between urban pattern and urban microclimate. Archit. J. 2012, 7, 16–21. [Google Scholar]
- Yan, J.; Zhu, W.; Wang, B.; Tang, L. Social equity of park green space in transitional industrial cities: A case study of Dongcheng Street in Dongguan City. Acta Ecol. Sin. 2021, 41, 8921–8930. [Google Scholar]
- Chen, Y.; Hu, Y. The urban morphology classification under local climate zone scheme based on the improved method—A case study of Changsha, China. Urban Clim. 2022, 45, 101271. [Google Scholar] [CrossRef]
- Estoque, R.C.; Murayama, Y. Monitoring surface urban heat island formation in a tropical mountain city using landsat data (1987–2015). ISPRS J. Photogramm. Remote Sens. 2017, 133, 18–29. [Google Scholar] [CrossRef]
- Cui, Y.; Xiao, X.; Doughty, R.B.; Qin, Y.; Liu, S.; Li, N.; Zhao, G.; Dong, J. The relationships between urban-rural temperature difference and vegetation in eight cities of the great plains. Front. Earth Sci. 2019, 13, 290–302. [Google Scholar] [CrossRef]
- Li, Y.; Wang, S.; Zhang, S.; Wei, M.; Chen, Y.; Huang, X.; Zhou, R. The creation of multi-level urban ecological cooling network to alleviate the urban heat island effect. Sustain. Cities Soc. 2024, 114, 105786. [Google Scholar] [CrossRef]
- He, J.; Shi, Y.; Xu, L.; Lu, Z.; Feng, M. An investigation on the impact of blue and green spatial pattern alterations on the urban thermal environment: A case study of Shanghai. Ecol. Indic. 2024, 158, 111244. [Google Scholar] [CrossRef]
- Wang, Y.; Li, X.; Zhang, C.; He, W. Influence of spatiotemporal changes of impervious surface on the urban thermal environment: A case of Huai’an central urban area. Sustain. Cities Soc. 2022, 79, 103710. [Google Scholar] [CrossRef]
- Zhang, A.; Li, W.; Xia, C.; Guo, H. The impact of urban landscape patterns on land surface temperature at the street block level: Evidence from 38 big Chinese cities. Environ. Impact Asses. 2025, 110, 107673. [Google Scholar] [CrossRef]
- Zhang, K.; Cao, C.; Chu, H.; Zhao, L.; Zhao, J.; Lee, X. Increased heat risk in wet climate induced by urban humid heat. Nature 2023, 617, 738–742. [Google Scholar] [CrossRef] [PubMed]
- Wang, M.; Xu, H. Analyzing the influence of urban forms on surface urban heat islands intensity in Chinese mega cities. J. Geo-Inf. Sci. 2018, 12, 1787–1798. [Google Scholar]
- Zhang, Y.S.; Odeh, I.O.A.; Han, C.F. Bi-temporal characterization of land surface temperature in relation to impervious surface area, NDVI and NDBI, using a sub-pixel image analysis. Int. J. Appl. Earth. Obs. 2009, 11, 256–264. [Google Scholar] [CrossRef]
- Zhang, J.; Liang, Y.; Wang, J.; Zhang, J. Temporal and spatial characteristics of urban heat island effect and its influencing factors in Beijing from 1981 to 2020. Trans. Atmos. Sci. 2024, 47, 581–591. [Google Scholar]
- Gao, Y.; Zhao, J.; Yu, K. Effects of block morphology on the surface thermal environment and the corresponding planning strategy using the geographically weighted regression model. Build. Environ. 2022, 216, 109037. [Google Scholar] [CrossRef]
- Zhang, Q.; Guan, Y.; Wu, X.; Zhang, J.; Li, R.; Lin, K.; Wang, Y. Revealing the dynamic effects of land cover change on land surface temperature in global major bay areas. Build. Environ. 2025, 267, 112266. [Google Scholar] [CrossRef]
- Wang, F.; Wang, Y. Potential role of local contributions to record-breaking high-temperature event in Xiamen, China. Weather Clim. Extrem. 2021, 33, 100338. [Google Scholar] [CrossRef]
- Zhang, T.; Foliente, G.; Xiao, J.; Tang, L. Exploring the driving factors of land use change and spatial distribution in coastal cities: A case study of Xiamen city. Sustainability 2025, 17, 941. [Google Scholar] [CrossRef]
- Jia, W.; Ren, G.; Jin, F.; He, J.; Zhang, P. Spatial-temporal characteristics of the urban heat island effect in Xiamen, China. Urban Clim. 2023, 52, 101725. [Google Scholar]
- Lan, W.; Rong, Q.; Qi, Z.; Jiang, Y.; Yang, B. Analysis and reconstruction of “Mountain, sea, city” Landscape visual network in Xiamen. Planners 2023, 39, 153–158. [Google Scholar]
- Notice of the Fujian Provincial Government on the Issuance of the “Fujian Provincial Spatial Planning (2021–2035)”. Available online: https://www.fujian.gov.cn/zwgk/ghjh/gtkjgh/202407/P020240718595845603662.pdf (accessed on 3 July 2024).
- Weng, Q.; Lu, D.; Schubring, J. Estimation of land surface temperature–vegetation abundance relationship for urban heat island studies. Remote Sens. Environ. 2004, 89, 467–483. [Google Scholar] [CrossRef]
- Zhou, D.; Zhang, L.; Hao, L.; Sun, G.; Liu, Y.; Zhu, C. spatiotemporal trends of urban heat island effect along the urban development intensity gradient in China. Sci. Total Environ. 2016, 544, 617–626. [Google Scholar] [CrossRef] [PubMed]
- Yang, J.; Dong, J.; Xiao, X.; Dai, J.; Wu, C.; Xia, J.; Zhao, G.; Zhao, M.; Li, Z.; Zhang, Y.; et al. Divergent shifts in peak photosynthesis timing of temperate and alpine grasslands in China. Remote Sens. Environ. 2019, 233, 111395. [Google Scholar] [CrossRef]
- Geospatial Data Cloud. Available online: http://www.gscloud.cn (accessed on 12 March 2025).
- World Pop Hub. Available online: https://hub.worldpop.org/?_refluxos=a10 (accessed on 12 March 2025).
- Zhang, X.; Liu, L.; Zhao, T.; Gao, Y.; Chen, X.; Mi, J. GISD30: Global 30-m Impervious Surface Dynamic Dataset from 1985 to 2020 Using Time-Series Landsat Imagery on the Google Earth Engine Platform. Earth Syst. Sci. Data Discuss. 2021, 2021, 1–29. [Google Scholar] [CrossRef]
- Xu, X.; Liu, J.; Zhang, S.; Li, R.; Yan, C.; Wu, S. China multi-period land use land cover remote sensing monitoring data set (CNLUCC). Ecosyst. Health Sustain. 2022, 8, 2040385. [Google Scholar]
- Xu, X. Annual Spatially Interpolated Dataset of Meteorological Elements in China. Resource and Environmental Science and Data Platform. 2022. Available online: http://www.resdc.cn/10.12078/2022082501 (accessed on 12 March 2025).
- Peng, S. High-Spatial-Resolution Monthly Temperatures Dataset over China During 1901–2017. 2020. Available online: https://doi.org/10.5281/zenodo.3185722 (accessed on 3 July 2024).
- Wold, S.; Esbensen, K.; Geladi, P. Principal component analysis. Chemometr. Intell. Lab. 1987, 2, 37–52. [Google Scholar] [CrossRef]
- Johnstone, I.M. On the distribution of the largest eigenvalue in principal components analysis. Ann. Stat. 2001, 29, 295–327. [Google Scholar] [CrossRef]
- Anselin, L. Local indicators of spatial association: LISA. Geogr. Anal. 1995, 27, 93–115. [Google Scholar] [CrossRef]
- Brunsdon, C.; Fotheringham, A.S.; Charlton, M.E. Geographically weighted regression: A method for exploring spatial nonstationarity. Geogr. Anal. 1996, 28, 281–298. [Google Scholar] [CrossRef]
- Hartigan, J.A.; Wong, M.A. Algorithm AS 136: A K-Means clustering algorithm. Appl. Stat. 1979, 28, 100. [Google Scholar] [CrossRef]
- Fan, P.Y.; Chun, K.P.; Mijic, A.; Mah, D.N.-Y.; He, Q.; Choi, B.; Lam, C.K.C.; Yetemen, O. Spatially-heterogeneous impacts of surface characteristics on urban thermal environment, a case of the Guangdong-Hong Kong-Macau Greater Bay Area. Urban Clim. 2022, 41, 101034. [Google Scholar] [CrossRef]
- Ichinose, T.; Shimodozono, K.; Hanaki, K. Impact of anthropogenic heat on urban climate in Tokyo. Atmos. Environ. 1999, 33, 3897–3909. [Google Scholar] [CrossRef]
- Stewart, I.D.; Oke, T.R. Local Climate Zonesb for Urban Temperature Studies. Bull. Am. Meteorol. Soc. 2012, 93, 1879–1900. [Google Scholar] [CrossRef]
| Disclaimer/Publisher’s Note: The statements, opinions and data contained in all publications are solely those of the individual author(s) and contributor(s) and not of MDPI and/or the editor(s). MDPI and/or the editor(s) disclaim responsibility for any injury to people or property resulting from any ideas, methods, instructions or products referred to in the content. |
© 2025 by the authors. Licensee MDPI, Basel, Switzerland. This article is an open access article distributed under the terms and conditions of the Creative Commons Attribution (CC BY) license (https://creativecommons.org/licenses/by/4.0/).


