Article

Research on the Impact of Marine New Quality Productive Forces on Marine Economic Resilience: A Case Study of 11 Coastal Provinces and Cities in China

College of Management, Ocean University of China, Qingdao 266100, China
*
Author to whom correspondence should be addressed.
Sustainability 2025, 17(10), 4457; https://doi.org/10.3390/su17104457
Submission received: 3 April 2025 / Revised: 6 May 2025 / Accepted: 11 May 2025 / Published: 14 May 2025

Abstract

:
The development of marine new quality productive forces and the enhancement of marine economic resilience are critical strategies for cultivating new drivers and advantages for high-quality and sustainable development in the marine sector. In order to deeply explore the relationship between these two constructs, this study selected panel data from 11 coastal provinces from 2007 to 2021 to construct an indicator system for MNQPFs and marine economic resilience, conducted scientific calculations and analysis, and, finally, used a two-way fixed effect model for empirical analysis and the instrumental variable method for robustness testing. The key findings are as follows: (1) The level of marine new quality productive forces (MNQPFs) in coastal areas demonstrates considerable spatial variability. The spatial distribution of MNQPF levels in the Bohai Sea and South China Sea regions is similar, whereas the levels in the Yellow Sea and East China Sea region demonstrate better balance. (2) A regional analysis of marine economic resilience indicates that the Bohai Sea region demonstrates a weak development trend and the South China Sea region demonstrates an unbalanced development trend, while the Yellow Sea and East China Sea region demonstrates a favorable development trend. (3) MNQPFs significantly improve marine economic resilience, including both its resistance and evolution abilities; the positive impact of marine new quality productive forces on the marine economic resilience’s recovery ability exhibits a time lag effect. (4) Heterogeneous results demonstrate that the positive impact of MNQPFs on marine economic resilience varies according to the level of marine economic development in different coastal areas, with a more significant promoting effect in less developed areas. Therefore, adaptively accelerating the development of marine new quality productive forces according to local conditions by effectively utilizing the unique resource endowments of each coastal area is essential for continuously strengthening marine economic resilience. This study can enrich research in the field of marine economics and provide references for marine economic development in coastal areas.

1. Introduction

At present, China’s economy has shifted from a stage of rapid growth to one of high-quality development. The development of the land economy has attained significant magnitude and achieved notable progress. There are still some difficulties in breaking through the bottleneck of economic development in the short term. Thus, the expansion of the maritime sector has become an essential strategy for China’s economy to attain high-quality growth in the future. The ocean provides biological, mining, and energy resources for human survival and development, boosting associated businesses and improving human well-being. The ocean is a major technological battleground and a vital international cooperation channel. The marine economy has become a pillar of China’s national economic development and a new driver of high-quality economic development.
In contrast to the land economy, the marine economy is represented by significant openness, sensitivity to external forces, and relative complexity, presenting both environmental and market-based risks. It is more particularly vulnerable to internal and external risk shocks, such as extreme weather events, ocean-related natural disasters, and market volatility [1]. The key to the stable development of marine economies is their resilience in the face of a variety of risks and shocks. This is also a necessary capability for the attainment of high-quality development of marine economies and the goal of becoming a strong maritime nation. However, unexpected natural disasters, public health emergencies, geopolitical conflicts, and other factors have weighed down the global and Chinese macroeconomies in recent years. China’s marine economy has also suffered, slowing growth. This has caused ecological damage, inefficient resource use, and poor marine product quality [2]. Such issues consistently hinder the effectiveness and quality of marine economic development, indicating underlying vulnerabilities, namely, inadequate resilience. China has explicitly expressed the overarching assessment of “good national economic resilience” and the grand strategy to “build China into a strong maritime nation.” Therefore, strengthening marine economic resilience in China’s coastal areas against both internal and external risks and disturbances has become essential for its developing marine economy, becoming both an unavoidable path forward and a critical safeguard. The question of how to strengthen marine economic resilience has increasingly received attention from both academia researchers and industry professionals [3,4,5].
At this critical phase of China’s economic transformation, the unsustainable extensive growth model applied by traditional productive forces, which depends on substantial inputs of production factors such as land, labor, and energy resources for economic gains, has resulted in drawbacks such as resource depletion and environmental degradation. Furthermore, it has proven insufficient to address intricate international challenges, thereby hindering the enhancement of economic resilience [6]. Against this background, in September 2023, General Secretary Xi Jinping said “in order to integrate scientific and technological innovation resources, to take the lead in the development of strategic emerging industries and future industries, and to speed up the construction of new quality productive forces” during his visit to Heilongjiang, China [7]. At the second session of the 14th National People’s Congress held in Beijing, the proposal of “striving to modernize the industrial system and developing new quality productive forces at a faster pace” was put forward, marking the first time that “new quality productive forces” was formally included in the government’s work report in March 2024 [8]. New quality productive forces prioritize the function of new types of productive factors in economic progress, emphasizing the enhancement of both the quantity and quality of production factors through scientific and technological innovation as a means to attain the high-quality development of the economy [9]. Since the concept of new quality productive forces was first proposed, it has been widely discussed in academia. New quality productive forces is a political and economic term with Chinese characteristics. It represents China’s revised comprehension of productive forces, informed by the technological revolution and significant transformations in production methods in the 21st century. It is an innovative benchmark for the development of productive forces in the context of Chinese-style modernization [10,11].
According to Marxist philosophy and methodology, General Secretary Xi Jinping pointed out that “it is crucial to firmly grasp the primary task of high-quality development and adaptively promote new quality productive forces according to local conditions” [9,12]. China is a major maritime nation that has about 3 million square kilometers of claimed waters and more than 18,000 km of continental coastline. Under the current background of building China into a strong maritime nation, accelerating the development of MNQPFs according to local conditions is expected to create a new engine for the development of the marine economy, and is of great significance for improving the sustainable development capacity of the marine economy and achieving the high-quality development of the Chinese economy [13,14]. Marine new quality productive forces (MNQPFs) represent an essential aspect in the adaptive development of new productive forces according to local conditions, facilitating the transformation and enhancement of industrial structures and production methodologies within the marine economy, while simultaneously presenting new opportunities and challenges for bolstering marine economic resilience in coastal areas [15].
Previous research into new quality productive forces within the marine sector has mostly focused on how to assess and measure, promote the high-quality development of the marine economy or fishing economy, and encourage environmentally sustainable practices in the marine economy [16,17,18,19]. Certain researchers have evaluated the effects of new quality productive forces on urban and agricultural economic resilience through the perspective of economic resilience [15,20,21,22,23,24]. Current studies on new quality productive forces of economic resilience mostly focus on the theoretical level, yet their conceptual foundations are primarily anchored in the land economy, seldom addressing the complexity and special constraints of the marine economy. As a result, the only empirical research has a significant gap in applicability to the marine sector. So, what impact do MNQPFs have on marine economic resilience? To explore these questions, this study first constructed an evaluation index system for MNQPFs and marine economic resilience and measured and analyzed the levels of MNQPFs and marine economic resilience in 11 provinces and cities in China’s coastal areas. Second, the impact of MNQPFs on marine economic resilience was explored from multiple dimensions, with a view to providing theoretical reference and practical reference for continuously promoting the development of MNQPFs and further enhancing marine economic resilience. While providing strong support for the high-quality development of China’s marine economy, MNQPFs will also inject new momentum and opportunities into the global marine economy and, thus, have significant global significance and contemporary value. First, at a time when the global economy is facing unprecedented challenges ranging from geopolitical tensions to environmental crises, the proposal of MNQPFs provides new ideas for the sustainable development of the world economy, from which other countries can seek inspiration for their own development. Second, exploring the impact of MNQPFs on marine economic resilience will also provide a reference for countries located in coastal areas to explore marine economic issues, thereby bringing momentum to global economic recovery and contributing Chinese wisdom and strength to sustainable development [25].
The main contributions are as follows: (1) This study introduces two novel index systems: one evaluating MNQPFs from the perspectives of new quality workers, new quality labor objects, and new quality labor resources, and the other evaluating marine economic resilience from the perspectives of resistance ability, recovery ability, and evolution ability. These systems offer a basis for measurement and analysis. (2) An empirical analysis is employed to determine the effects of MNQPFs on marine economic resilience, including the impacts on resistance ability, recovery ability, and evolution ability. Instrumental variable methods are utilized to account for potential endogeneity problems. (3) This study further discusses the heterogeneous impact of MNQPFs on marine economic resilience across varying levels of marine economic development level in coastal areas.

2. Concept Definition and Theoretical Analysis

2.1. Marine New Quality Productive Forces

Productive forces prove to be the most potent and transformative driver of societal advancement. It constitutes a dynamic, continuously evolving process, continuously reshaped by significant technological advancements and the shifting phases of human interaction with the natural world, including utilization, transformation, and harmonious coexistence. This evolution is concretely observed in the leap of productivity from old to new quality, and from low to high quality [26,27]. At present, the Chinese economy finds itself at a critical juncture in its structural transformation and upgrading from extensive resource-intensive development to sustainable and high-quality development, and the new quality productive forces arise as an unavoidable consequence of the ongoing optimization and adaptation of traditional productive forces alongside China’s economic progress. In January 2024, during the 11th collective study of the Political Bureau of the CPC Central Committee, General Secretary Xi Jinping offered a comprehensive interpretation of the connotation of the new quality productive forces: the new quality productive forces represent an advanced productivity state in which innovation plays a leading role and discards the traditional mode of economic growth and the productivity development path. It is reflected by the characteristics of high technological advancement, high efficiency, and high quality, and aligns with the new development concept. According to General Secretary Xi Jinping’s interpretation of new quality productive forces, the Political Bureau of the Communist Party of China Central Committee has authoritatively and completely defined new quality productive forces as the advanced state of productive forces brought about by revolutionary technological breakthroughs, the innovative allocation of production factors, and in-depth industrial transformation and upgrading. The basic connotation is the leap forward in the optimization of the combination of workers, means of production, and objects of production [28].
The marine economy represents a critical pillar of China’s economy as well as an important opportunity to achieve the high-quality development of China’s economy [29]. Accordingly, as a vital part of the new quality productive forces system, MNQPFs can offer new momentum and new advantages for developing marine economy, protecting the marine environment, and stepping up efforts to build China into a strong maritime nation.
In accordance with General Secretary Xi Jinping’s exposition on new quality productive forces and the definition of new quality productive forces by the Political Bureau of the Communist Party of China Central Committee, this study defines MNQPFs as an advanced and sustainable productive force that is born out of the goal of harmonious coexistence between humans and the ocean and a coordinated win–win between the economy and ecology, with technological innovation in the marine industry leading to improved production efficiency, the innovative allocation of marine production factors to reduce resource waste, and the in-depth transformation and upgrading of the marine industry to reduce damage to the marine ecological environment.
Marx proposed, in “Capital”, that human material production activities are based on the formation and development of productive forces, which must have three basic elements: laborers, labor objects, and labor resources [30]. The labor of laborers is the main factor of the productive forces; labor resources serve as the material basis of the productive forces and include production tools, equipment, raw materials, etc.; labor objects are the unprocessed and processed objects of the productive forces, including various raw materials, semi-finished products, and natural material resources [31]. This study is based on a Marxist political economy perspective, in addition to reference to the research of relevant scholars; this study establishes an index system of MNQPFs from three dimensions of new quality laborers, new quality labor objects, and new quality labor resources [32,33,34], as presented in Table 1.
New quality laborers are the most active and decisive force in the new quality productive forces in the MNQPFs. The new quality laborers are characterized by a higher level of professionalism, which is in line with the evolutionary trend of the development needs of the marine industry. Professionalism includes work ethics, professional skills, the ability to continue learning, and a spirit of innovation [35]. Traditional laborers are often engaged in repetitive and simple manual labor, and although they have accumulated enough work experience, their ability to learn and accept new knowledge and skills is relatively weak, making it difficult for them to perform more difficult tasks. Unlike traditional laborers, new quality laborers are a group of laborers, mainly high-quality talents, entrepreneurs, and scientists, who usually have richer professional knowledge, a stronger ability to understand and transform nature, and who can skillfully master and apply modern marine science and technology and play a supporting role in the development of marine science and technology innovation [36]. This study measures new quality laborers in two dimensions: laborer skills and labor productivity. First, laborer skills are measured by ocean-related employees and number of students majoring in marine specialty. Ocean-related employees have rich practical experience and high professional level, and often can quickly learn and skillfully use all kinds of marine science and technology products to assist their production activities; the number of students majoring in marine specialty reflects the reserve of senior talents in the marine field, because marine majors in colleges and universities usually grasp the cutting-edge hot spots of the marine disciplines and the direction of professional development, and have advanced experimental equipment, which can better train the marine majors in the marine field. These resources can better cultivate the practical ability and innovation ability of students majoring in a marine specialty. Secondly, labor productivity is measured by per capita marine capital stock and the per capita GOP of ocean-related employees; per capita marine capital stock reflects the per capita ownership of new products, technologies, and services in the ocean; the per capita GOP of ocean-related employees reflects the per capita ownership of new products, technologies, and services in the ocean. Per capita marine capital stock can reflect the per capita ownership of new marine products, technologies, and services; the per capita GOP of ocean-related employees refers to the sum of the value of marine products produced by ocean-related employees within a certain period.
New quality labor objects are fundamental and prerequisite to workers’ productive activities. The resources available for such activities in MNQPFs will progressively broaden alongside the deeper exploration and utilization of marine resources. Unlike the traditional concept of labor objects, which is simply based on “processed or not”, the new quality labor objects emphasize the development of strategic emerging industries and the pursuit of the sustainable development concept of the “harmonious coexistence of human and nature” [37]. This study adopts two dimensions of new quality industry and ecological environment for measurement. First, according to the theory of industrial structure evolution, the continuous innovation of production factors, the new round of scientific and technological revolution, and the transformation and upgrading of the marine industrial structure have given rise to the marine tertiary industry, such as coastal tourism, marine transportation, marine science and technology, and education and management services. These new forms of marine industries have broken the traditional vertical integration structure of coastal areas and, while promoting the diversification, personalization, and convenience of service supply, they provide more jobs and opportunities for self-employment for residents in coastal areas, and the marine tertiary industry is the main growth point of the marine economy in the future [38]. Secondly, the ecological environment also constitutes a key area for new quality labor objects in MNQPFs because the ecological environment ensures the sustainability of new labor objects in their application, and because the quality of the marine ecological environment and the carrying capacity of the resource environment, in turn, determines the structure, scale, and mode of the development of the marine economy. In this study, total investment in marine environmental pollution control and the direct discharge of industrial wastewater per unit coastline are used to measure the quality of the marine ecological environment.
New quality labor resources refer to the tools used by laborers in the labor process, which are important embodiments and carriers of the new quality productive forces in the MNQPFs, and can significantly change the mode of marine production and improve the efficiency of marine production activities and the quality of marine products and related products [39]. New quality labor resources are new production tools and technical equipment represented by smart terminals, wearable devices, mobile Internet, big data, cloud computing, etc., which mainly include tangible labor resources and intangible labor resources. Tangible labor resources are digitalized production tools as well as traditional machines, plants, equipment, and other kinds of material conditions. This paper adopts the proportion of information technology service income in GDP in coastal areas and long-distance optical cable length per intangible labor resources including information, data, knowledge, and other intangible resources, as well as innovation potential and enthusiasm, digitalization level, and other permeable elements, which can help to achieve the optimal combination of new quality productive forces in the MNQPFs, so as to create more economic benefits. The number of patents per capita for personnel engaged in marine scientifical activities and R&D investment of marine scientific research institutions are used in this study.

2.2. Marine Economic Resilience

Resilience is a concept in physics that refers to the ability of an object to return to its original shape after being affected by an external force. It is considered to be an inherent property of a system. With the progression of research, resilience has been applied to fields such as ecology, psychology, economics, education, etc. Comfort, the first scholar to introduce the concept of resilience to the field of economics, argued that urban economic resilience describes the recovery ability of a city’s economy following external shocks [40]. Holling’s novel incorporation of social system variables into the theoretical framework of ecological resilience indicates that economic systems have adaptive characteristics that facilitate homeostatic migration via self-organizing mechanisms [41]. Martin explains economic resilience, which Martin defines as one of the prevailing views widely used in current academic circles. According to him, economic resilience includes the ability to resist, recover, renew, and reposition itself [42]. From an economic standpoint, every economic system exhibits some degree of resilience, which is not solely contingent upon external forces; rather, an economic system is inherently resilient regardless of the presence of external influences. Thus, marine economic resilience is an intrinsic characteristic of the marine economic system, and its development mechanism is grounded in the dynamic processes of marine economic operations rather than being solely dependent on external shocks. Marine economic resilience is a capacity that is perpetually developed through marine economic activities, yet it is frequently only effective when confronted with external disturbances.
According to the research of Comfort, Briguglio, Chand, and other scholars [40,42,43,44], when economic systems encounter shocks of varying types and magnitudes, they exhibit dynamic evolutionary characteristics, including absorption and resistance, recovery and adjustment, and renewal and transformation through the combined forces of their internal and external environments. Therefore, this study defines marine economic resilience as an innate capacity of a marine economic system to withstand disasters and reduce their impact when experiencing shocks or disturbances through its endowments, attributes, and characteristics; to maintain the typical operation of its core functions by leveraging its organizational capacity and recovering from these shocks; and to utilize its learning and innovation capacities to attain a superior development path.
In existing research, the main methods for measuring marine economic resilience are the single indicator method and the comprehensive indicator method. The single indicator method focuses on measuring marine economic resilience through a core variable. This method is simple and intuitive, but when faced with complex marine economic systems, it may not be able to comprehensively capture the multidimensional characteristics of resilience. Therefore, based on the definition of marine economic resilience, this study uses a comprehensive indicator method to evaluate the level of marine economic resilience in coastal areas, which can more comprehensively reflect the complexity of marine economic resilience. This study divides marine economic resilience into three subsystems: resistance ability, recovery ability, and evolution ability [2,45,46,47,48,49]. Resistance ability refers to the ability of marine economic systems to absorb or resist adverse factors and maintain their basic functions when responding to risk shocks. It is the foundation of marine economic resilience. Recovery ability refers to the ability of marine economic systems to recover or adapt to the current situation as quickly as possible through various means when the economic system undergoes changes due to risk shocks or certain sudden events, thereby ensuring the normal operation of the economic system. It is a specific manifestation of marine economic resilience. Evolution ability refers to the ability of the marine economic system to open up new development paths under the impact of shocks, even surpassing the original economic operation model to achieve high-quality transformation. It is the long-term driving force for maintaining marine economic resilience. Based on the principles of scientificity, comprehensiveness, representativeness, measurability, and relevance, this study selected indicators such as international tourism foreign exchange income, direct economic losses from marine disasters, and the degree of sea area development from the above three dimensions to construct an indicator system for assessing the marine economic resilience of coastal areas. The specific selection and description of the indicators are shown in Table 2.
The resistance ability of a marine economic system is defined by its ability to resist both internal and external risks while preserving its structure and function. This ability is primarily reflected through the system’s economic foundation, its natural resource endowment, and the robustness of its infrastructure [50,51]. Specifically, the per capita GOP and the contribution rate of GOP reflect the economic strength of the marine economic system. Moreover, international tourism and foreign exchange earnings, along with port cargo throughput, reflect the system’s economic vitality. A marine economic system exhibiting greater economic strength and vitality will have a higher degree of redundancy, strengthening its ability to absorb and resist shocks. Moreover, the comprehensive development index of marine natural resources offers insight into the abundance of natural resources available in the marine economic system, while the comprehensive index of marine infrastructure reflects the comprehensive nature and effectiveness of the system’s infrastructure.
The recovery ability of a marine economic system is represented by its ability to adjust and maintain its structure, function, and development level after the shocks. The stability of the marine economic system, its ability to respond effectively to the shocks, and the extent of losses sustained are all crucial factors of its recovery ability [50,51]. The registered unemployment rate of residents, degree of exploitation of ocean areas, and the environmental pollution index all reflect the economic stability of the marine economic system. Enhanced stability in the marine economic system directly correlates with a reduction in severity of shocks experienced. In addition, the disposable income of urban residents, coupled with the financial development index, reflects the ability of the marine economic system to respond to shocks and adjust itself. The self-adjusting capacity of the marine economy, therefore, signifies the marine economic system’s ability to respond effectively to shocks. A more robust self-adjusting ability leads to a shorter duration of disturbance following a shock and contributes to a faster recovery speed. Finally, the direct economic losses from marine disasters reflect the extent of economic losses suffered by the marine economic system.
The evolution ability refers to the ability of the marine economic system to reorganize its internal structure and adjust its developmental paths, thereby reducing the disturbance level of subsequent shocks. This ability emphasizes the flexibility and growth potential of the economic system [50]. More freedom in the marine economic system, coupled with fewer constraints, results in a more flexible system, facilitating the upgrading of its development path. This flexibility is reflected in the marketization index. The number of employees in marine scientific research institutions and the added value of marine scientific research, education, and management services reflect the economic development potential of the marine economic system. The number of marine nature reserves indicates the emphasis placed by the marine economic system on marine natural resources and reflects its ability for sustainable development. Finally, the economic density of the coastline reflects an indicator of the marine economic system’s developmental momentum.

2.3. Theoretical Analysis

In the context of China’s new normal economic development, the marine economy has emerged as a crucial pillar and a novel engine of growth for the national economy, with sustainability as an important goal. For the achievement of this goal, the development of marine economic resilience must be considered [52]. MNQPFs, represented by high quality and efficiency, are driven by innovations in marine science and technology, the optimized allocation of marine production factors, and the transformation and upgrading of the marine industry. These productive forces, comprising new quality laborers, new quality labor objects, and new quality labor resources, represent a necessary condition for promoting the sustainable development of the marine economy. Therefore, the positive effect of the MNQPFs on enhancing marine economic resilience—specifically its resistance, recovery, and evolution abilities—has become increasingly evident.
MNQPFs can enhance the resistance ability of marine economic resilience. The cultivation of MNQPFs will attract a large number of high-quality and efficient new types of labor to gather in coastal areas [53]. First, Capello’s research findings indicate that cities or densely populated areas demonstrate significant resilience [54]. The development of MNQPFs increased the number of ocean-related employees and expanded the scale of the urban population in coastal areas, which promoted the revitalization of population structure and generated demographic dividends for marine economic development in coastal areas. This offers coastal areas a robust foundation for economic development and a faster rate of economic growth, thereby enhancing marine economic resilience against risks. Second, the development of MNQPFs will promote the development of the marine tertiary industry in coastal areas and will also promote the integration of marine emerging industries represented by the marine tertiary industry with traditional marine industries, accelerate the transformation and upgrading of the marine industry, optimize the marine industrial structure, and extend the marine industrial chain [55]. Emerging marine industries are key drivers of employment, stimulating job growth and entrepreneurship in coastal areas, improving the income and living standards of coastal residents, and enhancing the economic strength of these areas, thereby enhancing marine economic resilience. Finally, the impact of MNQPFs on the resistance ability of marine economic resilience is also reflected in the qualitative and quantitative aspects of tangible labor resources. Concerning the tangible labor resources, the new marine productivity can promote the upgrading of technological equipment. A new generation of production equipment and technologies are constantly emerging, and the application of digital, automated and intelligent technologies is gradually becoming popular in all aspects of marine production activities. The efficiency of marine production activities and the quality of products have been improved, which, in turn, enhances the economic strength of coastal areas and, thus, improves the resistance ability of marine economic resilience.
MNQPFs can enhance the recovery ability of marine economic resilience. First, the MNQPFs can achieve the goal of “low input and high output” and exhibit high labor productivity. This signifies that the new quality laborers have introduced more advanced production methods and management strategies to marine economic development. When the marine economy is impacted by shocks, these workers can quickly adjust their operational modes, minimize losses effectively, and improve the recovery ability of marine economic resilience [56]. Second, compared with traditional productive forces, MNQPFs pay more attention to the sustainable use of marine resources, focusing on scientific and technological innovation and green development, which can reduce damage to the ecological environment, reduce the vulnerability of the marine ecological environment, maintain the stability of the marine ecosystem, and improve the carrying capacity of the environment, thereby enhancing the recovery ability of marine economic resilience [57]. Finally, MNQPFs introduce cutting-edge science and technology as new types of labor materials, such as emergency science and technology, to coastal areas. Such science and technology not only improve the stability of the marine economy, but also promote the rapid recovery of the marine economy in coastal areas after being hit by risks, thereby improving the recovery ability of marine economic resilience [58].
MNQPFs can enhance the marine economic resilience evolution ability. First, the MNQPFs have cultivated a group of new quality laborers who frequently have a keen sense of innovation and strong learning abilities. When marine economic resilience is challenged through shocks, these workers can rapidly adapt to the new environment, learn from experiences, and effectively utilize their innovative capabilities to create new development paths for the marine economy, thereby improving the evolution ability of marine economic resilience. Second, the structural optimization of the marine industry facilitates a specialized division of labor and encourages diversified business models, achieving a more rational distribution of the marine industrial structure. This enables the marine economy to respond proactively to shocks and rapidly develop new paths for adapting to evolving economic conditions. Therefore, when facing risks, the enhancement of economic strength and upgrading of marine industrial structure effectively distribute risks and aid the marine economy in adapting to the new environment, thus improving the resistance and evolution abilities of the marine economy [59]. Concerning the environment, compared with traditional productive forces, MNQPFs prioritize the sustainable use of marine resources, focusing on scientific and technological innovation and green development, which reduces damage to and the vulnerability of the ecological environment. The implementation of emerging technologies can also promote the rapid recovery of the coastal marine economy following risk shocks, thus improving the recovery ability of marine economic resilience. Finally, the impact of MNQPFs on the evolution ability of marine economic resilience is also reflected in the qualitative and quantitative aspects of intangible labor resources. Concerning the intangible labor resources, the competitiveness and development potential of the marine economy have been enhanced through increased investment in scientific research and technological innovation. Accordingly, the recovery and evolution abilities of marine economic resilience will be enhanced. Therefore, this study proposes Hypothesis 1.
H1: 
The improvement of MNQPFs will significantly enhance marine economic resilience.
In the process of cultivating and developing MNQPFs in coastal areas, the impact of MNQPFs on marine economic resilience is likely to differ across provinces. This variation arises from interprovincial differences in resource endowments, an economic basis, development strategies, and the factors that drive innovation [2,23]. First, less developed marine economic areas have greater development space and potential than developed marine economic areas. MNQPFs cultivate new quality laborers who can efficiently integrate the untapped resources of less developed marine economic areas, optimize production processes, and maximize innovative value [60]. Moreover, new quality labor resources with high technological standards, such as the length of fiber-optic cable and number of Internet broadband ports per 100 population, can match the abundant potential advantageous resources of less developed marine economic areas with market demand, reducing labor costs and the burden on the environment [61]. Therefore, the development of MNQPFs can facilitate the transformation of resource advantages into tangible economic benefits in these less developed areas. Second, the marine industrial structure in the areas with less developed marine economies often exhibits homogeneity. This characteristic typically results in a more rapid pace of adjustment in the marine industrial structure, coupled with lower costs associated with transformation and upgrading. Therefore, as these less developed areas engage in the cultivation of MNQPFs, they can more readily concentrate and redistribute resources for unified deployment. For example, some areas where marine fisheries are the main industry can introduce more marine professionals by developing MNQPFs. It is relatively easy to develop new industries such as the aquatic product processing industry and modern fisheries, which can broaden the marine industrial chain in a short period of time, enhance the strength of the marine economy, and consolidate marine economic resilience [23]. Accordingly, this can lead to a rapid improvement in their economic strength, which has a demonstrable and positive effect on enhancing the overall resilience of their marine economies. Finally, the necessity for innovation is often more urgent in the areas with less developed marine economies, leading to more considerable marginal benefits derived from investments in innovation, whereas innovation efforts in areas with developed marine economies frequently concentrate in specialized high-end fields, which is an approach that may not yield significant enhancements to overall marine economic resilience [23,59,62]. Therefore, based on this, this study proposes Hypothesis 2.
H2: 
The level of MNQPFs plays a stronger role in improving marine economic resilience in areas with a less developed marine economy.

3. Methods and Data

3.1. Variable Definition

In this study, the explained variable is marine economic resilience, while MNQPFs are the explanatory variable. Drawing upon existing research and considering both the methodological soundness of variable selection and data accessibility, four control variables were selected [8,63,64,65]. Refer to Table 3 for detailed variable descriptions.
(1)
Government management: The degree of government management is a crucial support for social governance and, to some extent, dictates the future developmental direction of the economy in the area. The government can strategize and modify the pattern of marine economic development from a macroeconomic viewpoint. Efficient government management can facilitate the enhancement and reconfiguration of the marine economic framework in coastal areas, thereby influencing marine economic resilience.
(2)
Degree of openness: A higher degree of openness in coastal areas to the outside world facilitates the development of a more diversified marine economic structure. This diversification reduces dependence accordingly on any single industry and strengthens both the overall economic power and vitality of the marine economic system. However, increased openness can also result in a greater degree of economic reliance on external forces, potentially amplifying the system’s vulnerability to external shocks.
(3)
Level of informatization: Information technology has the capacity to partially overcome the constraints of time and space. This influence on marine productive forces and production efficiency has a cascading impact on marine economic resilience.
(4)
Market scale: The scale of coastal markets can contribute to improvements in the productive efficiency of the marine economy. Nevertheless, expanding market size can also lead to increased coordination costs in the marine economic system, which may negatively affect overall marine economic development.

3.2. Model Setting

3.2.1. Variable Measurement

This study applies an entropy weight-Topsis method to quantify MNQPFs and marine economic resilience [66,67]. The entropy method, an objective weighting method, enhances the contrast and resolution among index data, effectively circumventing analytical and evaluative challenges arising from minimal data differences. This method comprehensively and systematically captures the utility value of index information. The Topsis model is a ranking method for a finite number of evaluation objects based on their proximity to idealized targets [68,69]. The following aspects show how this method improves calculation accuracy and reliability by combining the entropy weight and Topsis methods: First, the entropy weight method calculates weights based on indicator variation, avoiding subjective bias from artificial weighting. In the complex marine economy, it is hard to subjectively value indicators. However, the entropy weight method can objectively reflect each indicator’s role in the evaluation system based on data characteristics, ensuring weight rationality. Second, the Topsis method calculates the distance between each plan and the ideal solution to assess its pros and cons. In panel data, the Topsis method can use observations at multiple time points to build a more complete evaluation model. We can accurately reflect each coastal province and city’s performance at different times and proximity to the optimal state by calculating the distance between their MNQPFs value at each time point and the positive and negative ideal solutions. Panel data can also better capture dynamic relationships between variables and their trends over time because it contains observations of multiple units at multiple times. This gives the entropy weight-Topsis method a rich database, making evaluation results more reliable.
The entropy weight-Topsis model has been widely used in various evaluation model studies. The entropy weight-Topsis method is suitable for various multi-attribute decision-making problems in fields such as engineering, management, and economics, and has high versatility and applicability. Its construction proceeds as follows:
(1)
Assuming the research objects are m areas, each with   n evaluation indices, construct a judgment matrix X and use Equation (2) to standardize the indices.
X = ( x i j ) m n ( i = 1,2 , , m ; j = 1,2 , n )
x i j + = x i j min ( x i j ) max ( x i j ) min ( x i j ) , x i j = max ( x i j ) x i j max ( x i j ) min ( x i j )
x i j + denotes the value of the i -th evaluation criterion ( i = 1, 2, …, m ) for the j -th evaluation year ( j = 1, 2, …, n ), forming an m × n decision matrix X , with x i j +   as the positive ideal solution and x i j as the negative ideal solution, where max ( x i j ) and min ( x i j )   represent the maximum and minimum values of the X -th evaluation criterion across all years, respectively.
(2)
Calculate information entropy:
H j = k i = 1 m p i j ln p i j
where p i j = x i j i = 1 m x i j , k = 1 ln m .
p i j = x i j i = 1 m x i j is the proportion of the j -th evaluation year’s value for the i -th indicator relative to the total value of that indicator across all years. k = 1 ln m is the Boltzmann constant, normalized here to ensure entropy values lie within [0, 1].
(3)
Determine the weight of index j :
w j = 1 H j j = 1 n ( 1 H j )
where the range of values is [0, 1] and i = 1 m W i = 1
(4)
Calculate the weighted matrix.
R = ( r i j ) m n , r i j = w j × x i j
(5)
Determine the positive and negative ideal solutions.
R + = m a x 1 i m r i j i = 1,2 , , m = r 1 + , r 2 + , , r m +
R = m i n 1 i m r i j i = 1,2 , , m = r 1 , r 2 , , r m
The normalized indicator values are weighted to construct a weighted normalized matrix R with the same trend, where R + represents the positive ideal solution and R represents the negative ideal solution.
(6)
Compute the Euclidean distance between each research object in the best solution and the suboptimal solution.
s e p i + = j = 1 n ( s j + r i j ) 2 , s e p i = j = 1 n ( s j r i j ) 2
s e p i +   and s e p i   denote the Euclidean distances from the j -th alternative to the positive ideal solution and negative ideal solution, respectively.
(7)
Calculate the comprehensive evaluation index.
C i = s e p i s e p i + s e p i +
The closeness C i indicates the distance between the evaluation object and the ideal solution, that is, the closeness of the evaluation target to the optimal solution. The value of C i ranges from 0 to 1. When the closeness C i is closer to 1, it means that the measured result of the evaluation object is closer to the optimal level; on the contrary, when the closeness C i is closer to 0, it means that the measured result of the evaluation object is farther away from the optimal level.

3.2.2. Kernel Density Estimation

This study utilized kernel density estimation to analyze the dynamic progression of resilience levels, applying a Gaussian kernel to illustrate the distribution characteristics of marine economic resilience over time and across areas. The formula for this is as follows.
f ( x ) = 1 N h i = 1 N K ( X i x h )
K ( x ) = 1 2 π exp ( x 2 2 )
N   denotes the number of observations; X i denotes independent and identically distributed observations; x denotes the mean; h denotes the bandwidth; and K is the kernel function.

3.2.3. Benchmark Model

A two-way fixed effects model is developed to appraise the effect of MNQPFs on marine economic resilience, considering both an aggregate level and its three dimensions: resistance ability, recovery ability, and evolution ability.
M E R i t = α 0 + α 1 M N Q P F s i t + α 2 M i t + μ i + δ t + ε i t
M E R 1 i t = β 0 + β 1 M N Q P F s i t + β 2 M i t + μ i + δ t + ε i t
M E R 2 i t = λ 0 + λ 1 M N Q P F s i t + λ 2 M i t + μ i + δ t + ε i t
M E R 3 i t = φ 0 + φ 1 M N Q P F s i t + φ 2 M i t + μ i + δ t + ε i t
i denotes the area, t denotes the year, M E R denotes marine economic resilience, M E R 1 denotes the resistance ability of marine economic resilience, M E R 2 denotes the recovery ability of marine economic resilience, M E R 3 denotes to the evolution ability of marine economic resilience, M N Q P F s denotes the marine new quality productive forces, M i t denotes a series of control variables, μ i denotes the fixed effect of the area, δ t denotes the fixed effect of time, and ε i t denotes error term.

3.3. Data Source

According to the administrative divisions defined in the China Marine Statistical Yearbook, China’s 11 coastal provinces and municipalities have clearly defined coastal zones, which account for more than 95% of the country’s total marine economic output. In contrast, although non-coastal provinces also have marine economic activities, the added value of marine industries generally accounts for less than 0.5% of GDP, making it difficult to form a complete marine economic system. Therefore, this study selected 11 coastal provinces and municipalities in China as the research subjects to ensure the representativeness of the research sample.
Due to the lag in China’s marine economic statistics, the data in this study are sourced from the 2008–2022 China Statistical Yearbook, China Marine Statistical Yearbook, China Urban Statistical Yearbook, China Fisheries Statistical Yearbook, the 2008–2022 statistical yearbooks of the 11 coastal provinces and municipalities, and the statistical bulletins of each province and municipality for the corresponding years. Linear interpolation addresses missing data points.

4. Result and Analysis

4.1. Analysis of the Measurement Results of Marine Economic Resilience

4.1.1. Analysis of Time Variation of Marine Economic Resilience

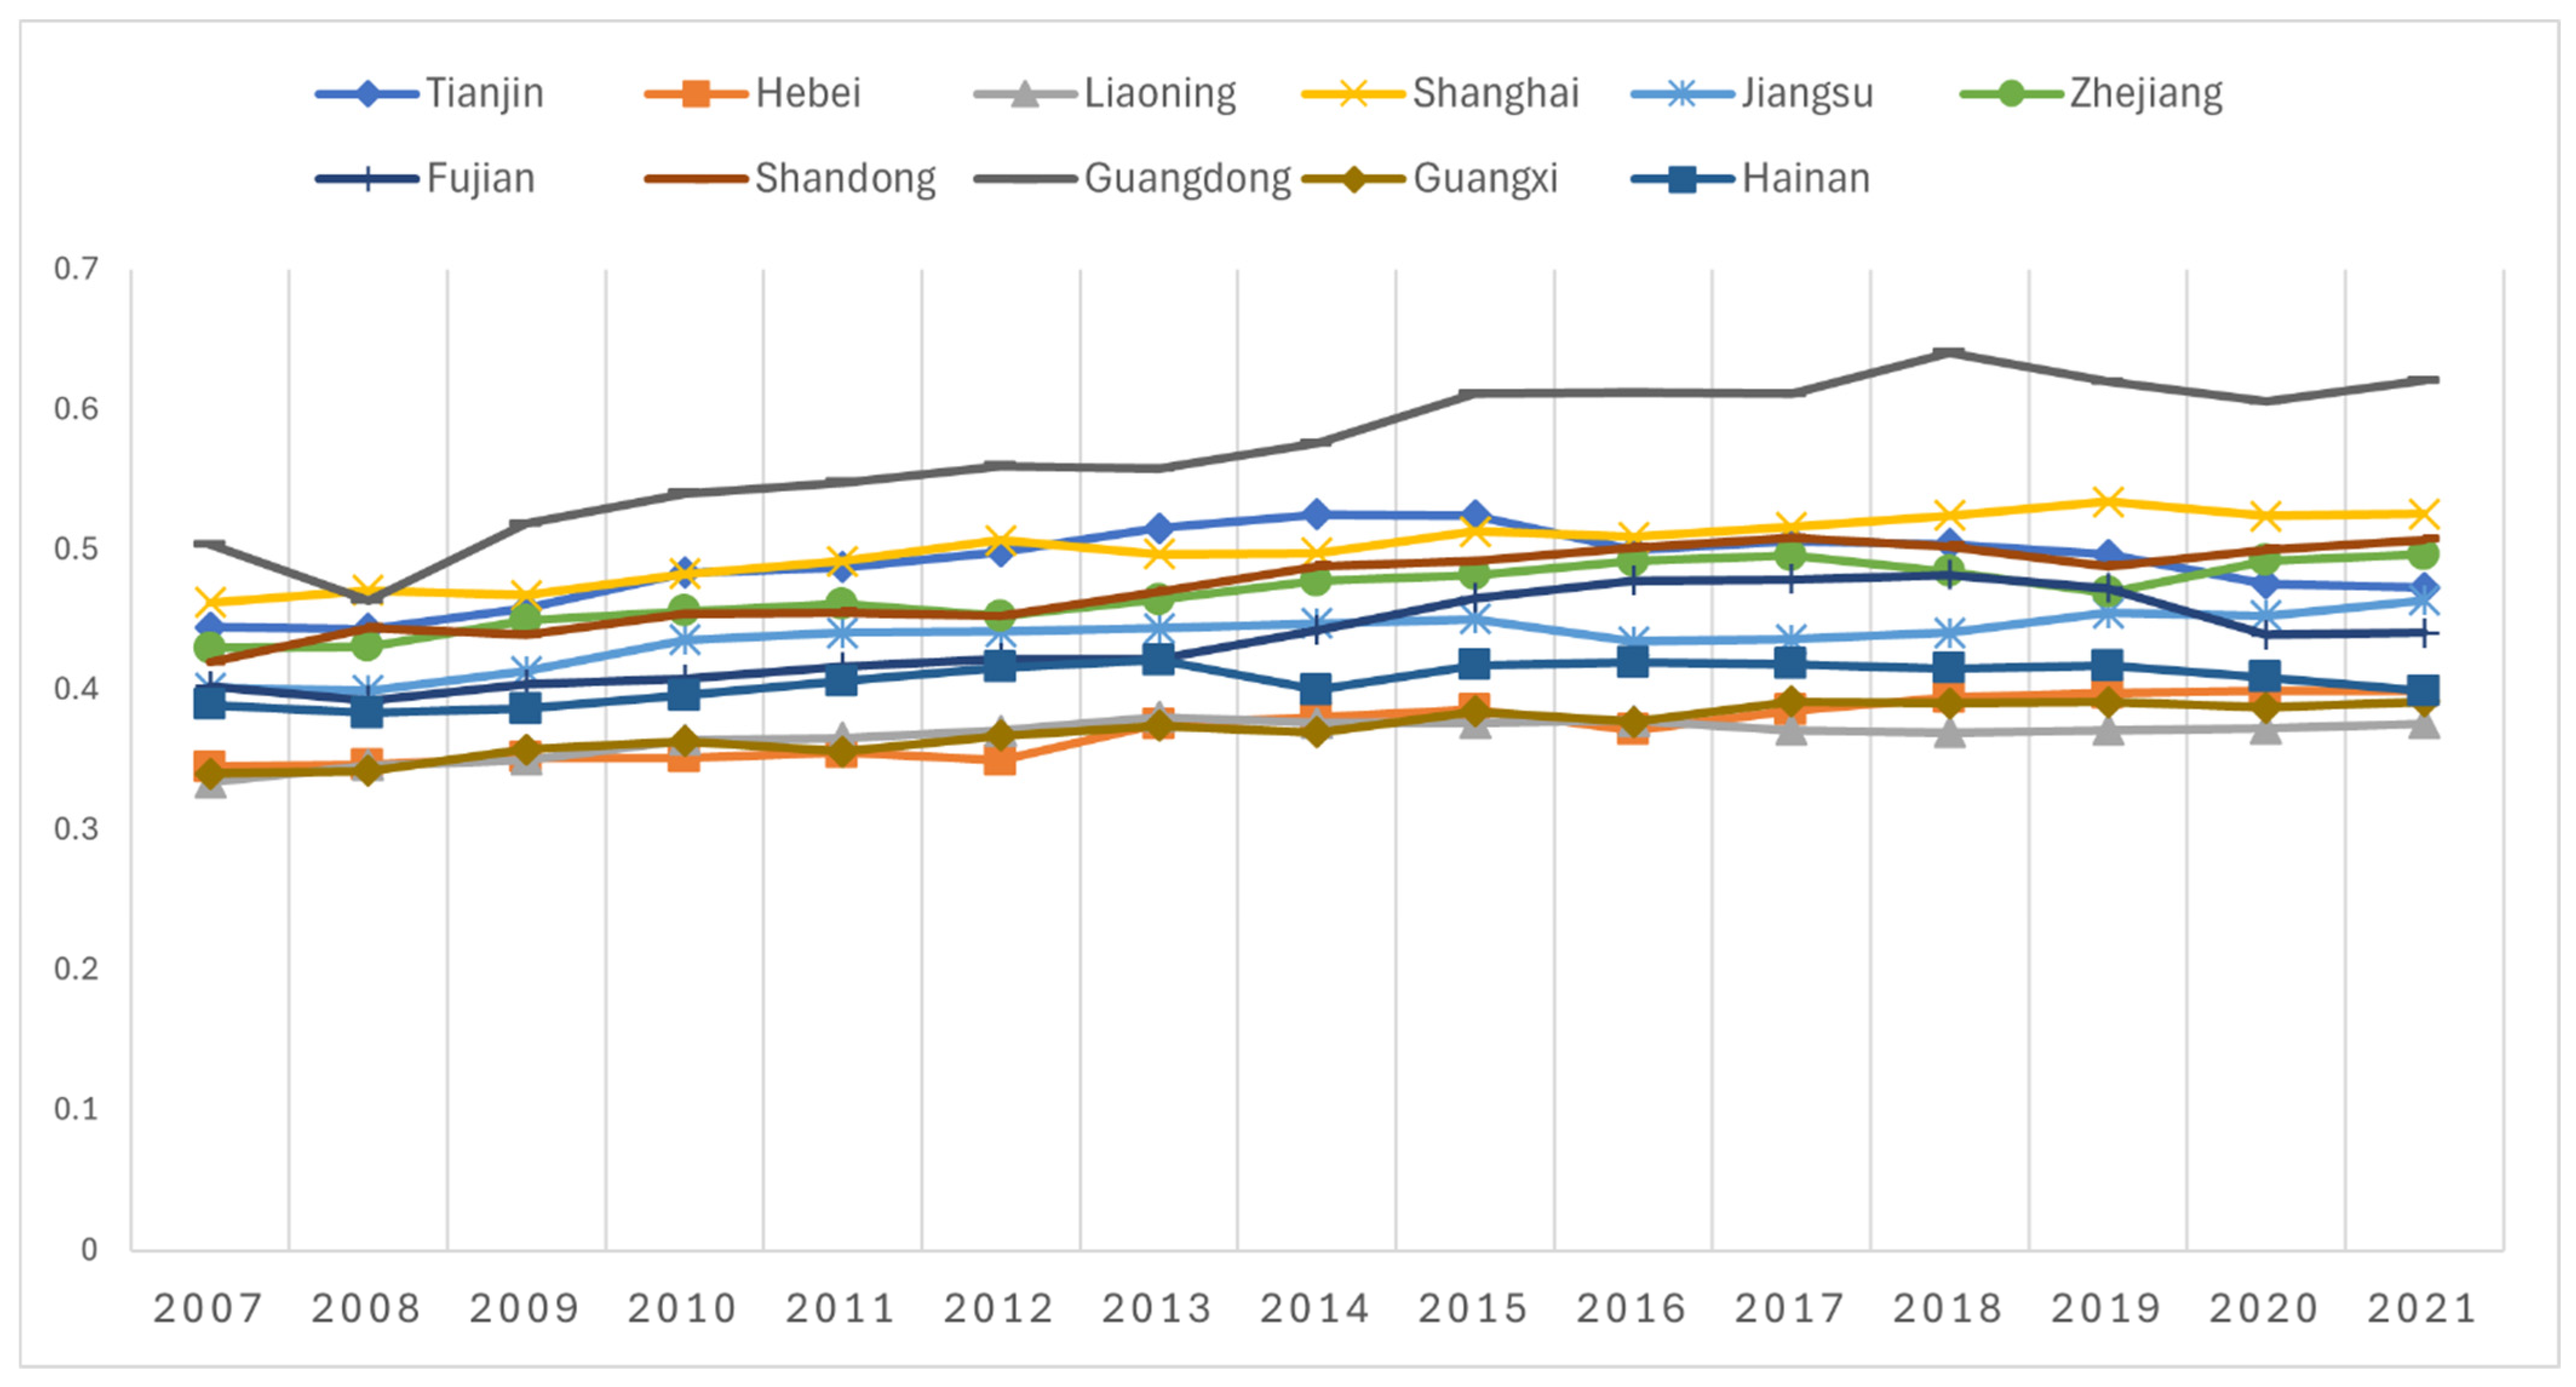
This study measured the marine economic resilience levels of 11 coastal provinces and municipalities in China from 2007 to 2021 using the entropy weight-Topsis method. Spatial classification was performed through the Jenks Natural Breaks Classification in ArcGIS 10.8.1, with results visualized in Table 4 and Table 5 and Figure 1.
It can be observed from the figure that the level of marine economic resilience in Guangdong is significantly higher than that observed in other coastal areas, exhibiting an upward trend reflected by periodic fluctuations. The marine economic resilience of both Shanghai and Shandong demonstrated a steady upward trend, achieving the classification of a highly developed area in 2015 and 2016, respectively. However, Shandong experienced a decline in its level of marine economic resilience during the epidemic period. While levels of marine economic resilience in both Jiangsu and Zhejiang have reached the standard of a moderately developed area, both provinces continue to display a steady upward trend. The levels of marine economic resilience in Tianjin and Fujian have established them as moderately developed areas for an extended period, demonstrating a pattern of first rising and then declining. Hainan’s marine economic resilience has fluctuated near the critical point, separating middle and low development levels. Meanwhile, the levels of marine economic resilience in Hebei, Liaoning, and Guangxi have remained consistently low, while they too exhibit a steady upward trend.
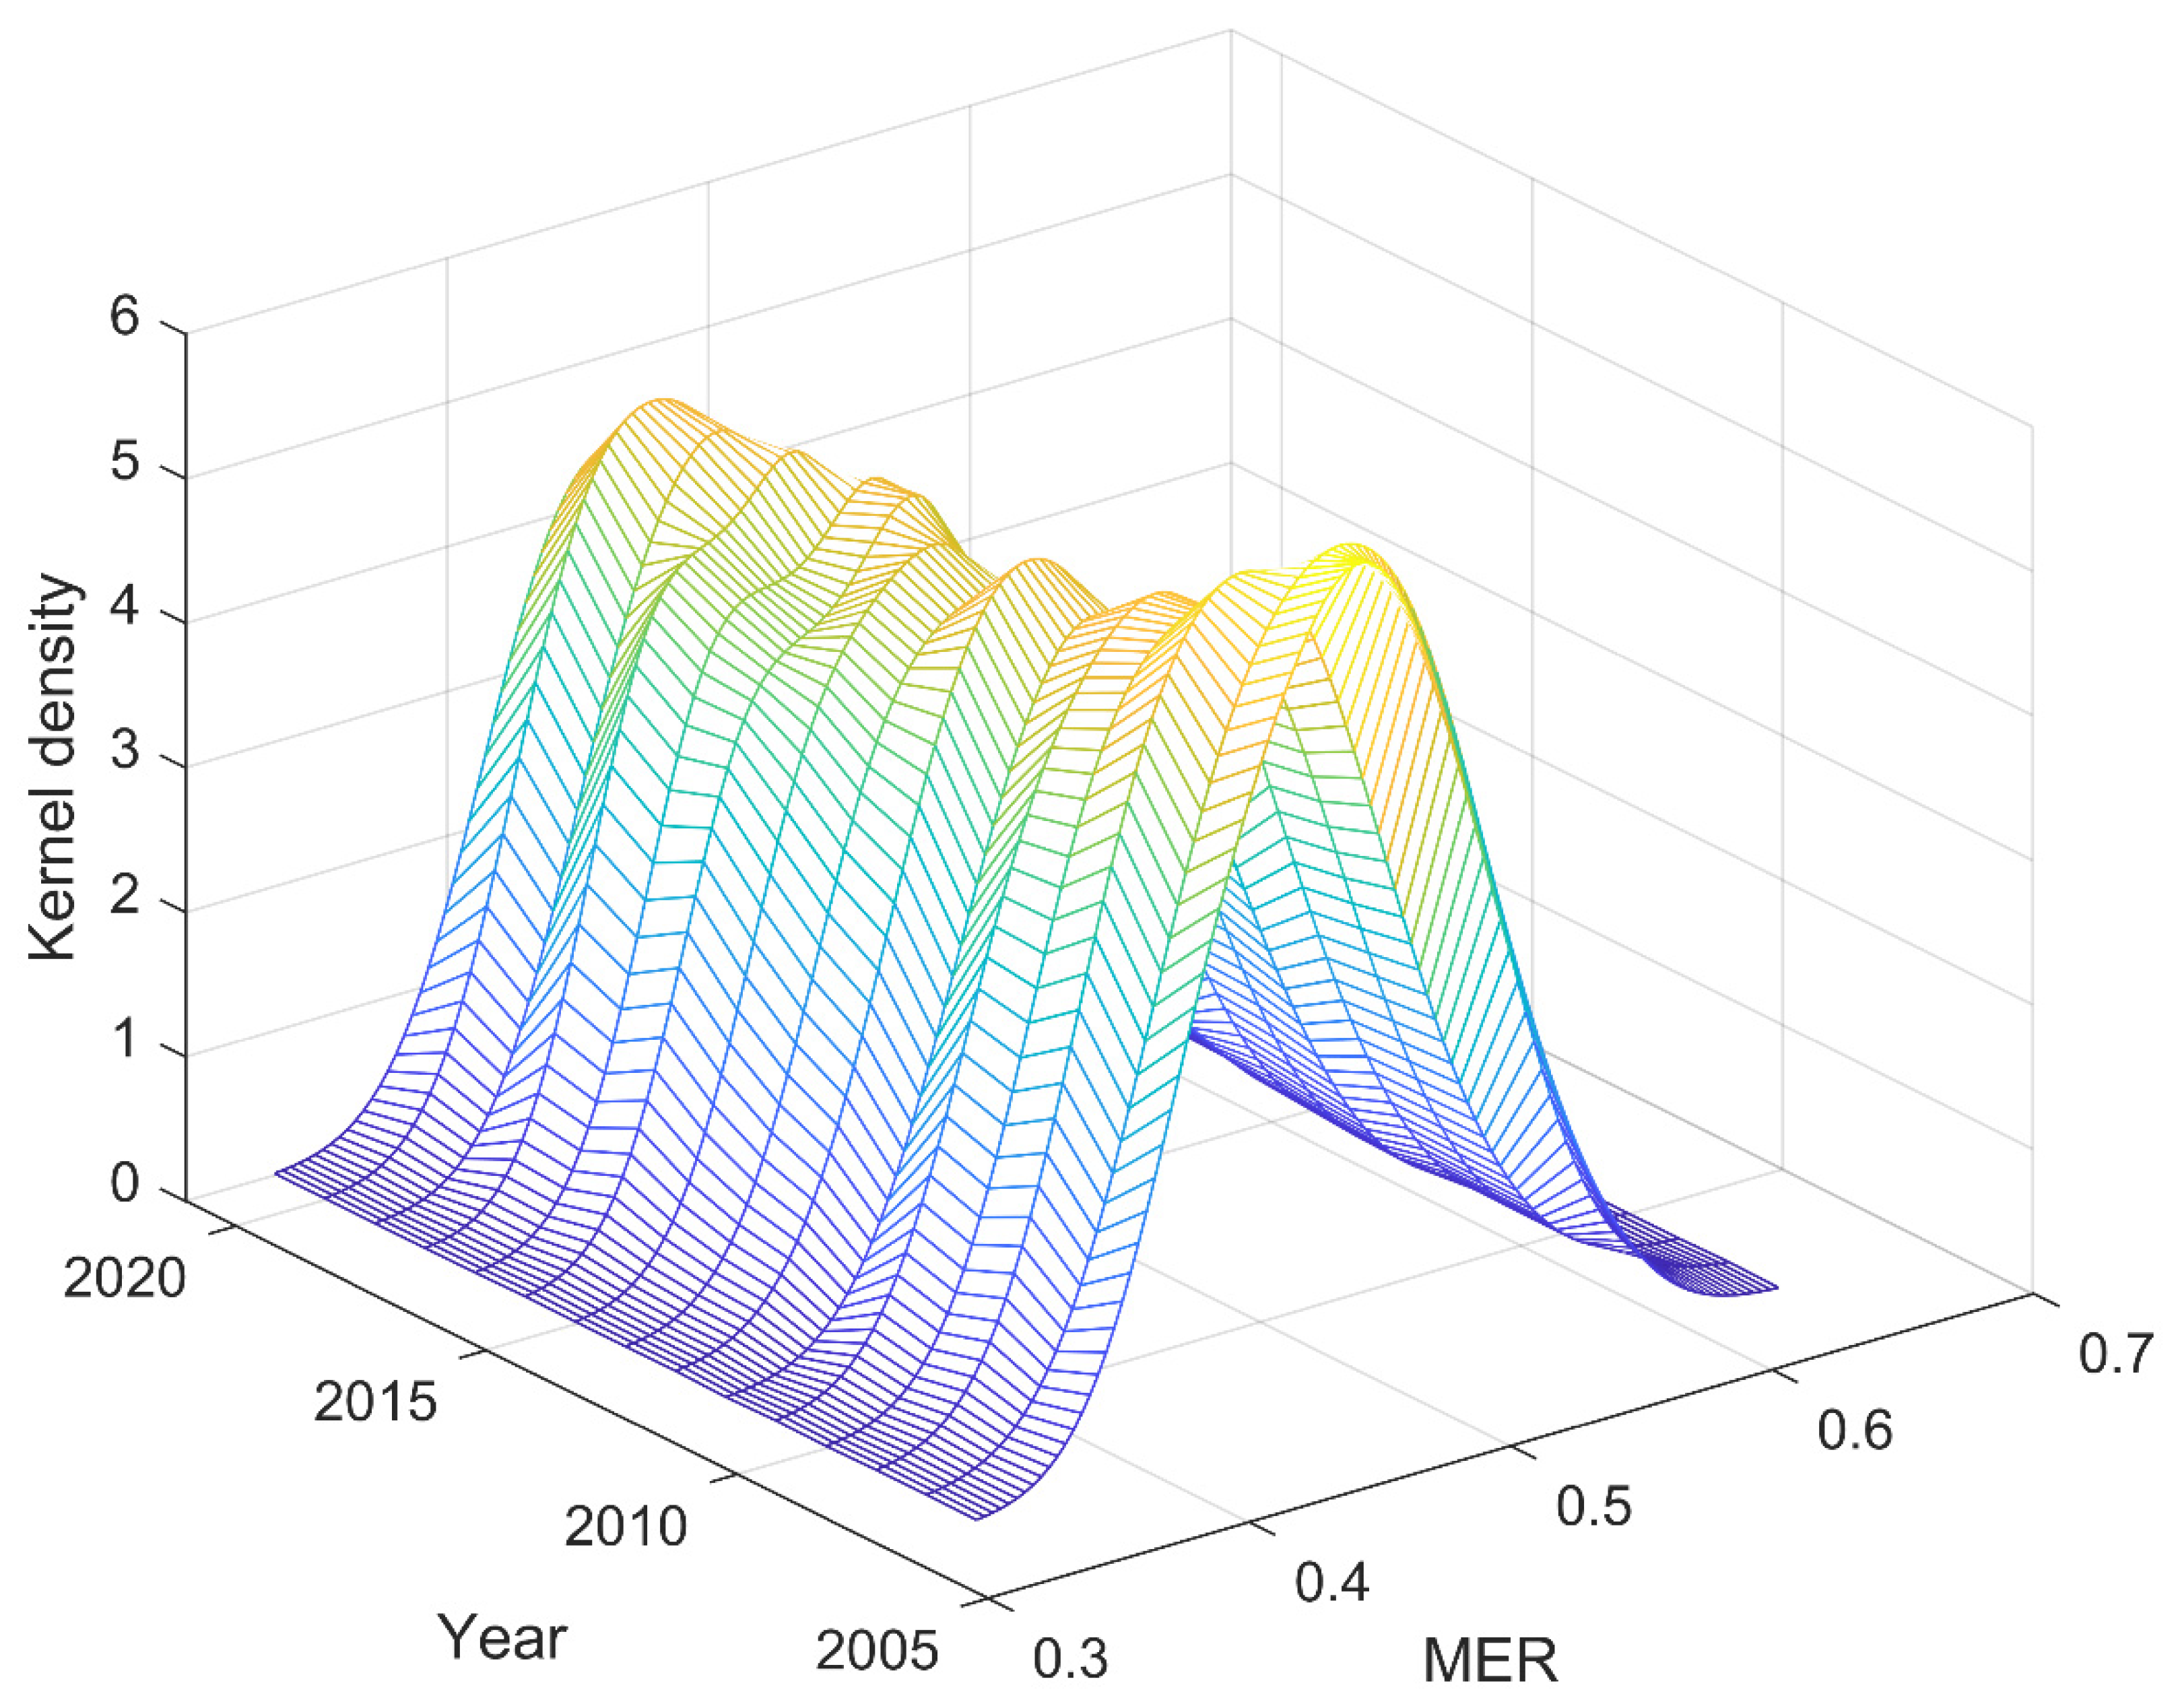
This study also uses kernel density estimation to analyze the dynamic evolutionary characteristics of marine economic resilience levels in coastal areas over time and utilizes Matlab2022a to construct a three-dimensional kernel density estimation visualization, Figure 2, depicting the overall level of marine economic resilience from 2007 to 2021. The examination of the results, from a locational standpoint, indicates a slight rightward shift in the kernel density distribution curve representing the overall resilience level. This displacement signifies a consistent pattern of positive growth in marine economic resilience throughout the coastal areas under study. From a morphological perspective, the primary peak’s height follows a “rise—fall—rise” trend while exhibiting increasing crest height and reducing width. This observation points toward a gradual convergence, or narrowing, of differences in marine economic resilience levels among these areas. Finally, considering both polarization trends and distribution ductility, the consistent maintenance of a single-peak configuration in the kernel density curve suggests that the overall developmental progress of marine economic resilience in these coastal areas does not exhibit any significant tendencies toward polarization.
Guangdong’s marine economic resilience has shown a fluctuating upward trend. Since 2008, the gap between Guangdong’s marine economic resilience and that of other coastal provinces and cities has gradually widened. The marine economic resilience levels of Fujian and Tianjin showed relatively large fluctuations after 2012 and 2013, respectively. The possible reasons are that Fujian and Tianjin became national marine economic development pilot areas in 2012 and 2013, respectively. With the vigorous development of the marine economy, the implementation of policies inevitably led to certain adjustments and changes in the marine economies of the two regions, resulting in large fluctuations in the marine economic resilience levels of Fujian and Tianjin in the following years. The marine economic resilience levels of the remaining coastal provinces and cities showed a slight upward trend during the study period.

4.1.2. Analysis of the Spatial Distribution of Marine Economic Resilience

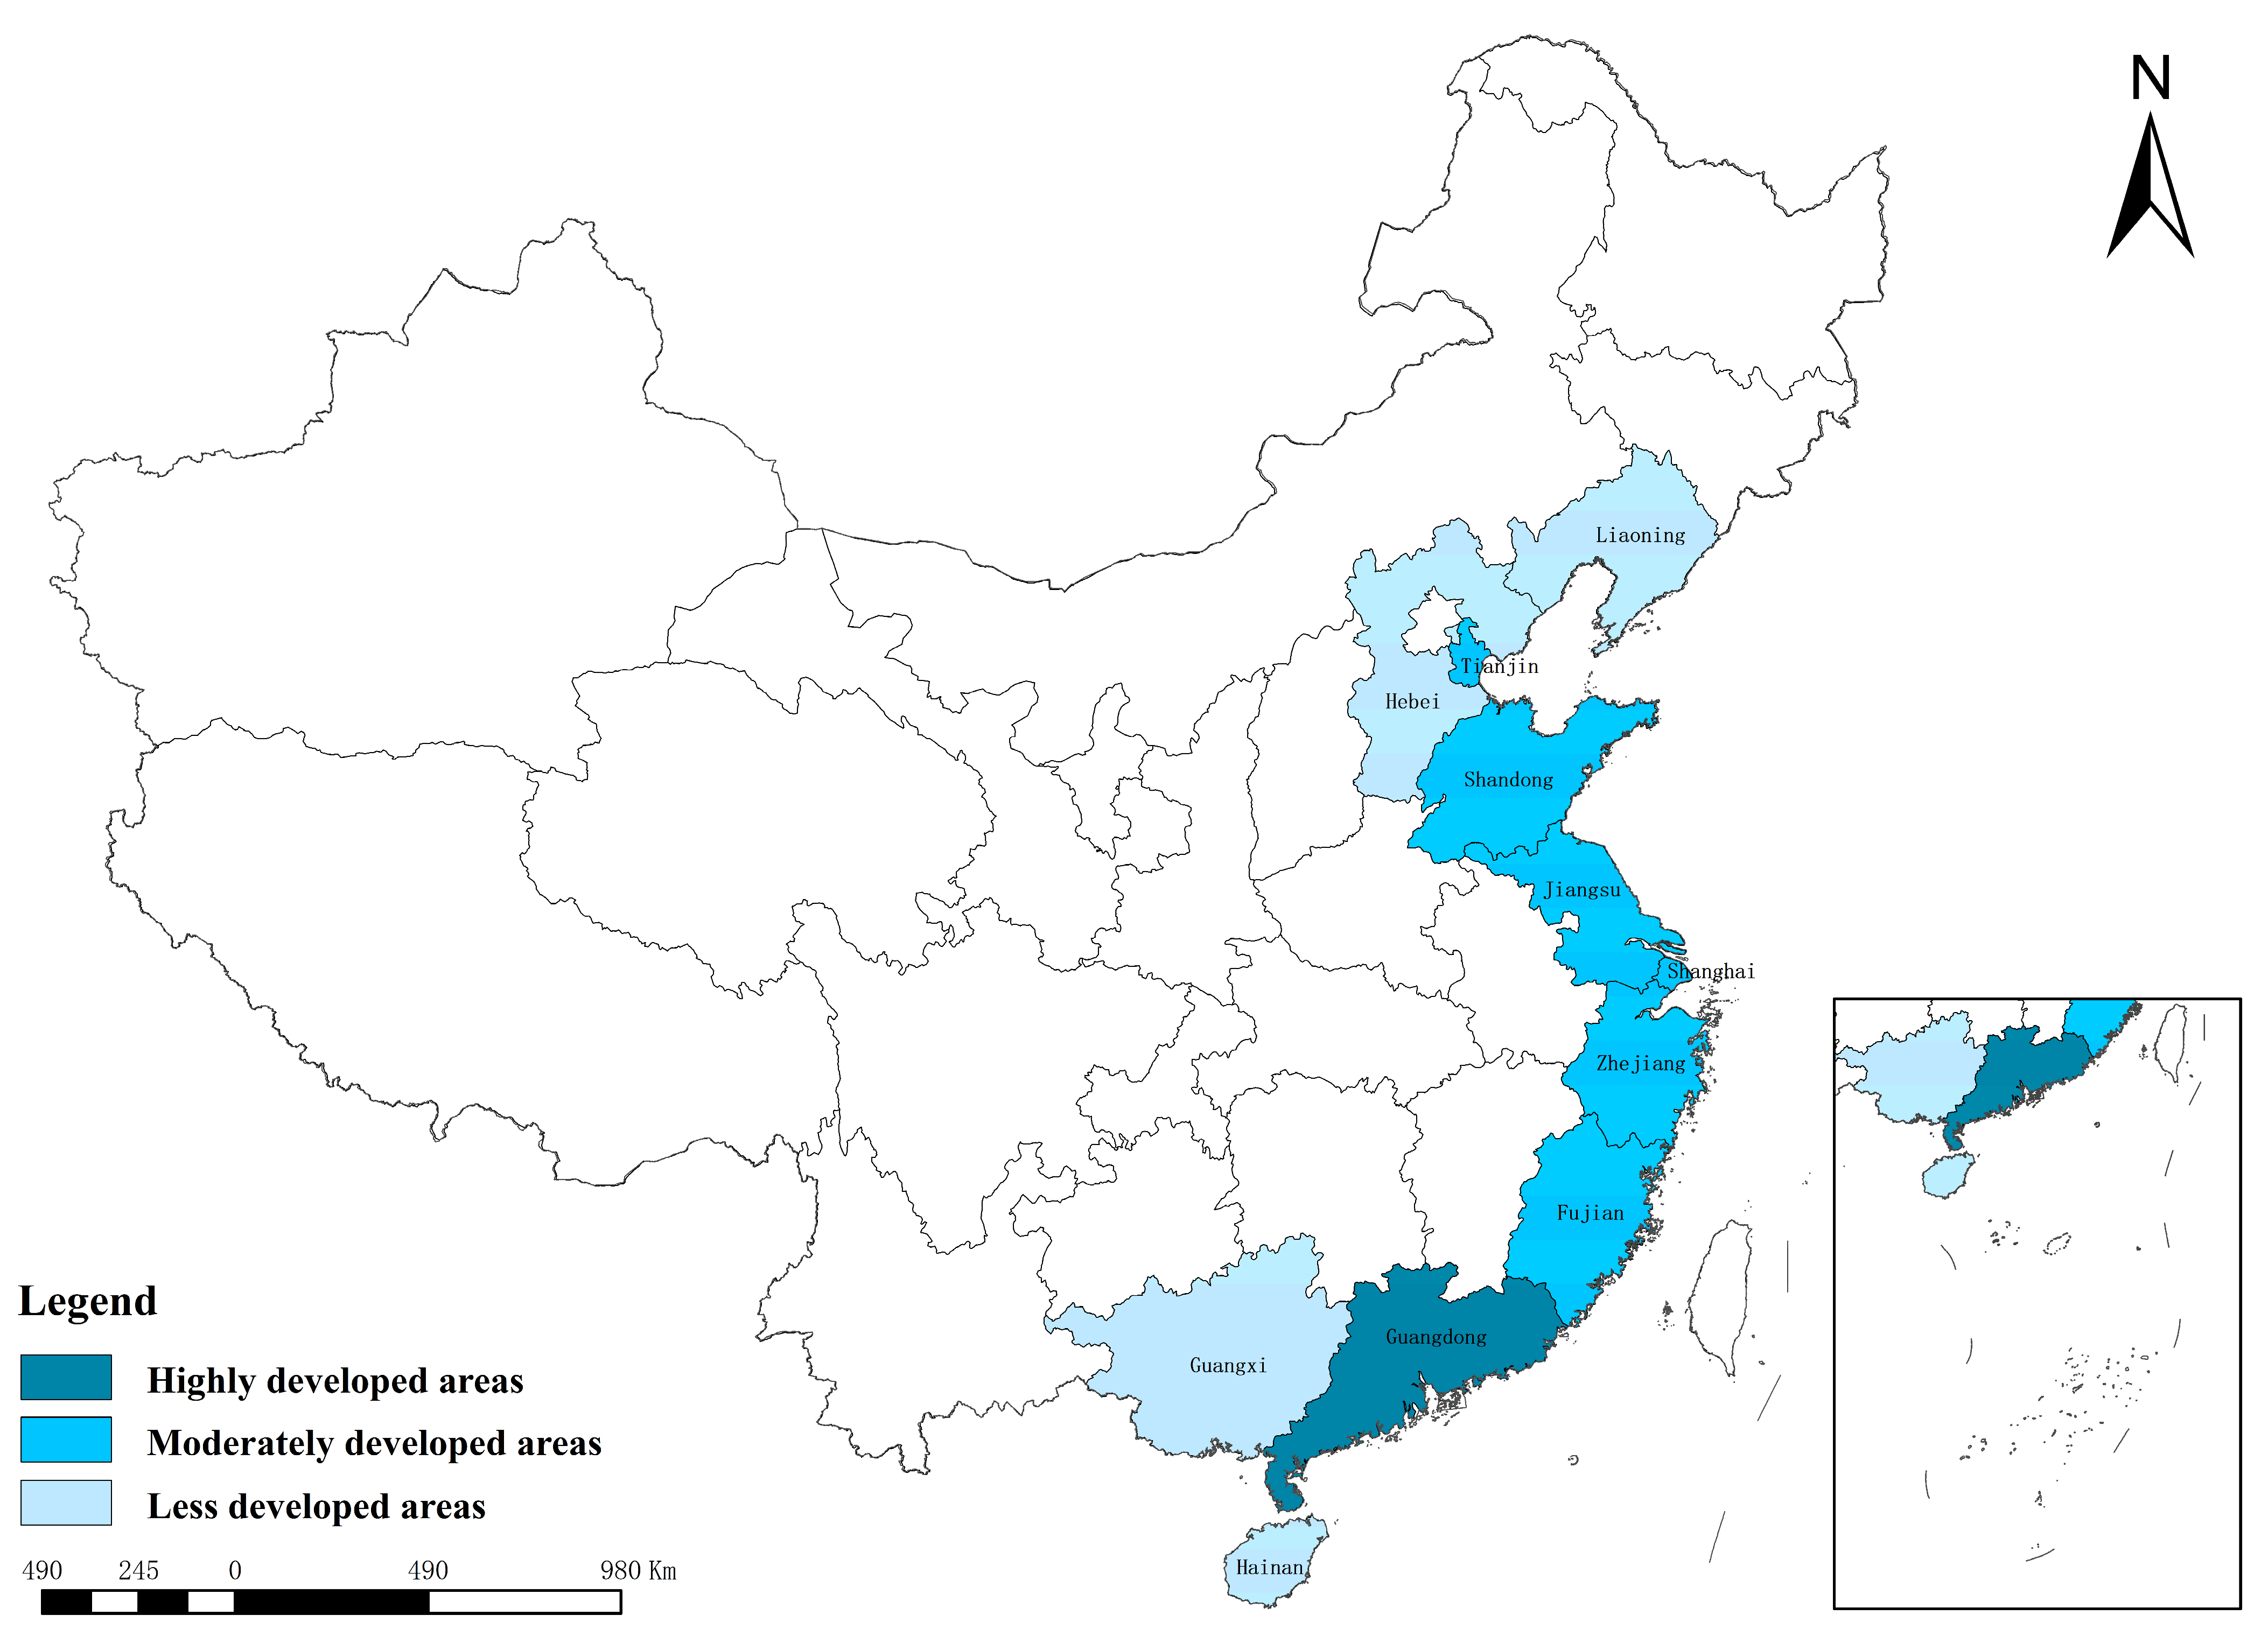
This study calculates the mean value of marine economic resilience for 11 coastal provinces and cities from 2007 to 2021 and employs the Jenks Natural Breaks Classification in ArcGIS 10.8. The results are demonstrated in Figure 3. Following established regional planning designations, these 11 coastal areas are categorized into three regions: the Bohai Sea region, including Liaoning, Hebei, Tianjin, and Shandong; the Yellow Sea and the East China Sea region, including Shanghai, Zhejiang, and Jiangsu; and the South China Sea region, including Fujian, Guangdong, Guangxi, and Hainan. The analysis of the spatial distribution indicates relatively low levels of marine economic resilience in the Bohai Sea region. Specifically, Liaoning and Hebei demonstrate lower levels of resilience, characterizing them as less developed regions, whereas Tianjin and Shandong exhibit moderate levels, suggesting moderate regional development. The Yellow Sea and the East China Sea region present a more positive picture, demonstrating generally robust marine economic resilience across all included provinces and cities, placing them in the moderately developed category. The South China Sea region presents a less uniform distribution of marine economic resilience. Guangdong stands out as the only province attaining the criteria for a highly developed area due to its high levels of marine economic resilience. Fujian demonstrates moderate resilience, placing it in the moderately developed category, while both Hainan and Guangxi exhibit lower levels of resilience, classifying them as less developed areas. In summary, marine economic resilience along the Chinese coast exhibits a pattern of lower resilience in both the northern and southern extremities, with comparatively higher resilience in the central coastal area. Guangdong’s exceptional performance, despite its location in the generally less resilient South China Sea region, is likely attributable to the combined advantages of abundant natural resources, unique policies, and geographical advantages. These factors contribute to a level of development in Guangdong that is significantly stronger than that observed in other coastal provinces and cities included in this study.
Overall, the marine economic resilience of China’s coastal regions exhibits a central high, northern–southern low spatial pattern. The Bohai Sea region initially developed its marine economy with a heavy reliance on secondary industries, particularly marine shipbuilding, chemical processing, and biomedicine, which are concentrated in its provinces and cities. This early industrial focus led to structural imbalances in industrial allocation and severe marine pollution. Despite ongoing efforts since the early 21st century to adjust the region’s marine economic development pathways, achieving some progress, the deep-rooted issues inherited from its early-stage growth remain unresolved and will require a long-term process of remediation. Consequently, the marine economic resilience of provinces and cities within the Bohai Sea region has persistently remained at low-to-medium levels. For the South China Sea region, the area has vast seas and abundant marine resources, including fishery resources, marine energy, marine tourism, etc. Therefore, the leading marine industries in the region are mainly the primary marine industries represented by marine fisheries, and the tertiary marine industries are represented by coastal tourism and marine transportation. The entire region has not yet achieved a balanced industrial structure. Among them, Guangdong’s marine economy started early, has a high level of technology, a complete range of marine industries, and a solid foundation and strong strength in the marine economy. The level of development of its marine economy is much higher than that of other provinces in the South China Sea region, resulting in the greatest degree of internal difference in the level of marine economic resilience in the South China Sea region [70]. In contrast, the Yellow Sea and East China Sea regions—Jiangsu, Zhejiang, and Shanghai—benefit from superior geographical positioning, strong economic foundations, and well-developed shipping systems. These provinces exhibit uniformly high levels of marine economic development with relatively smaller internal disparities; therefore, the overall marine economic resilience of these regions demonstrates a positive trajectory.

4.2. Analysis of the Measurement Results of Marine New Quality Productive Forces

4.2.1. Analysis of Time Variation of Marine New Quality Productive Forces

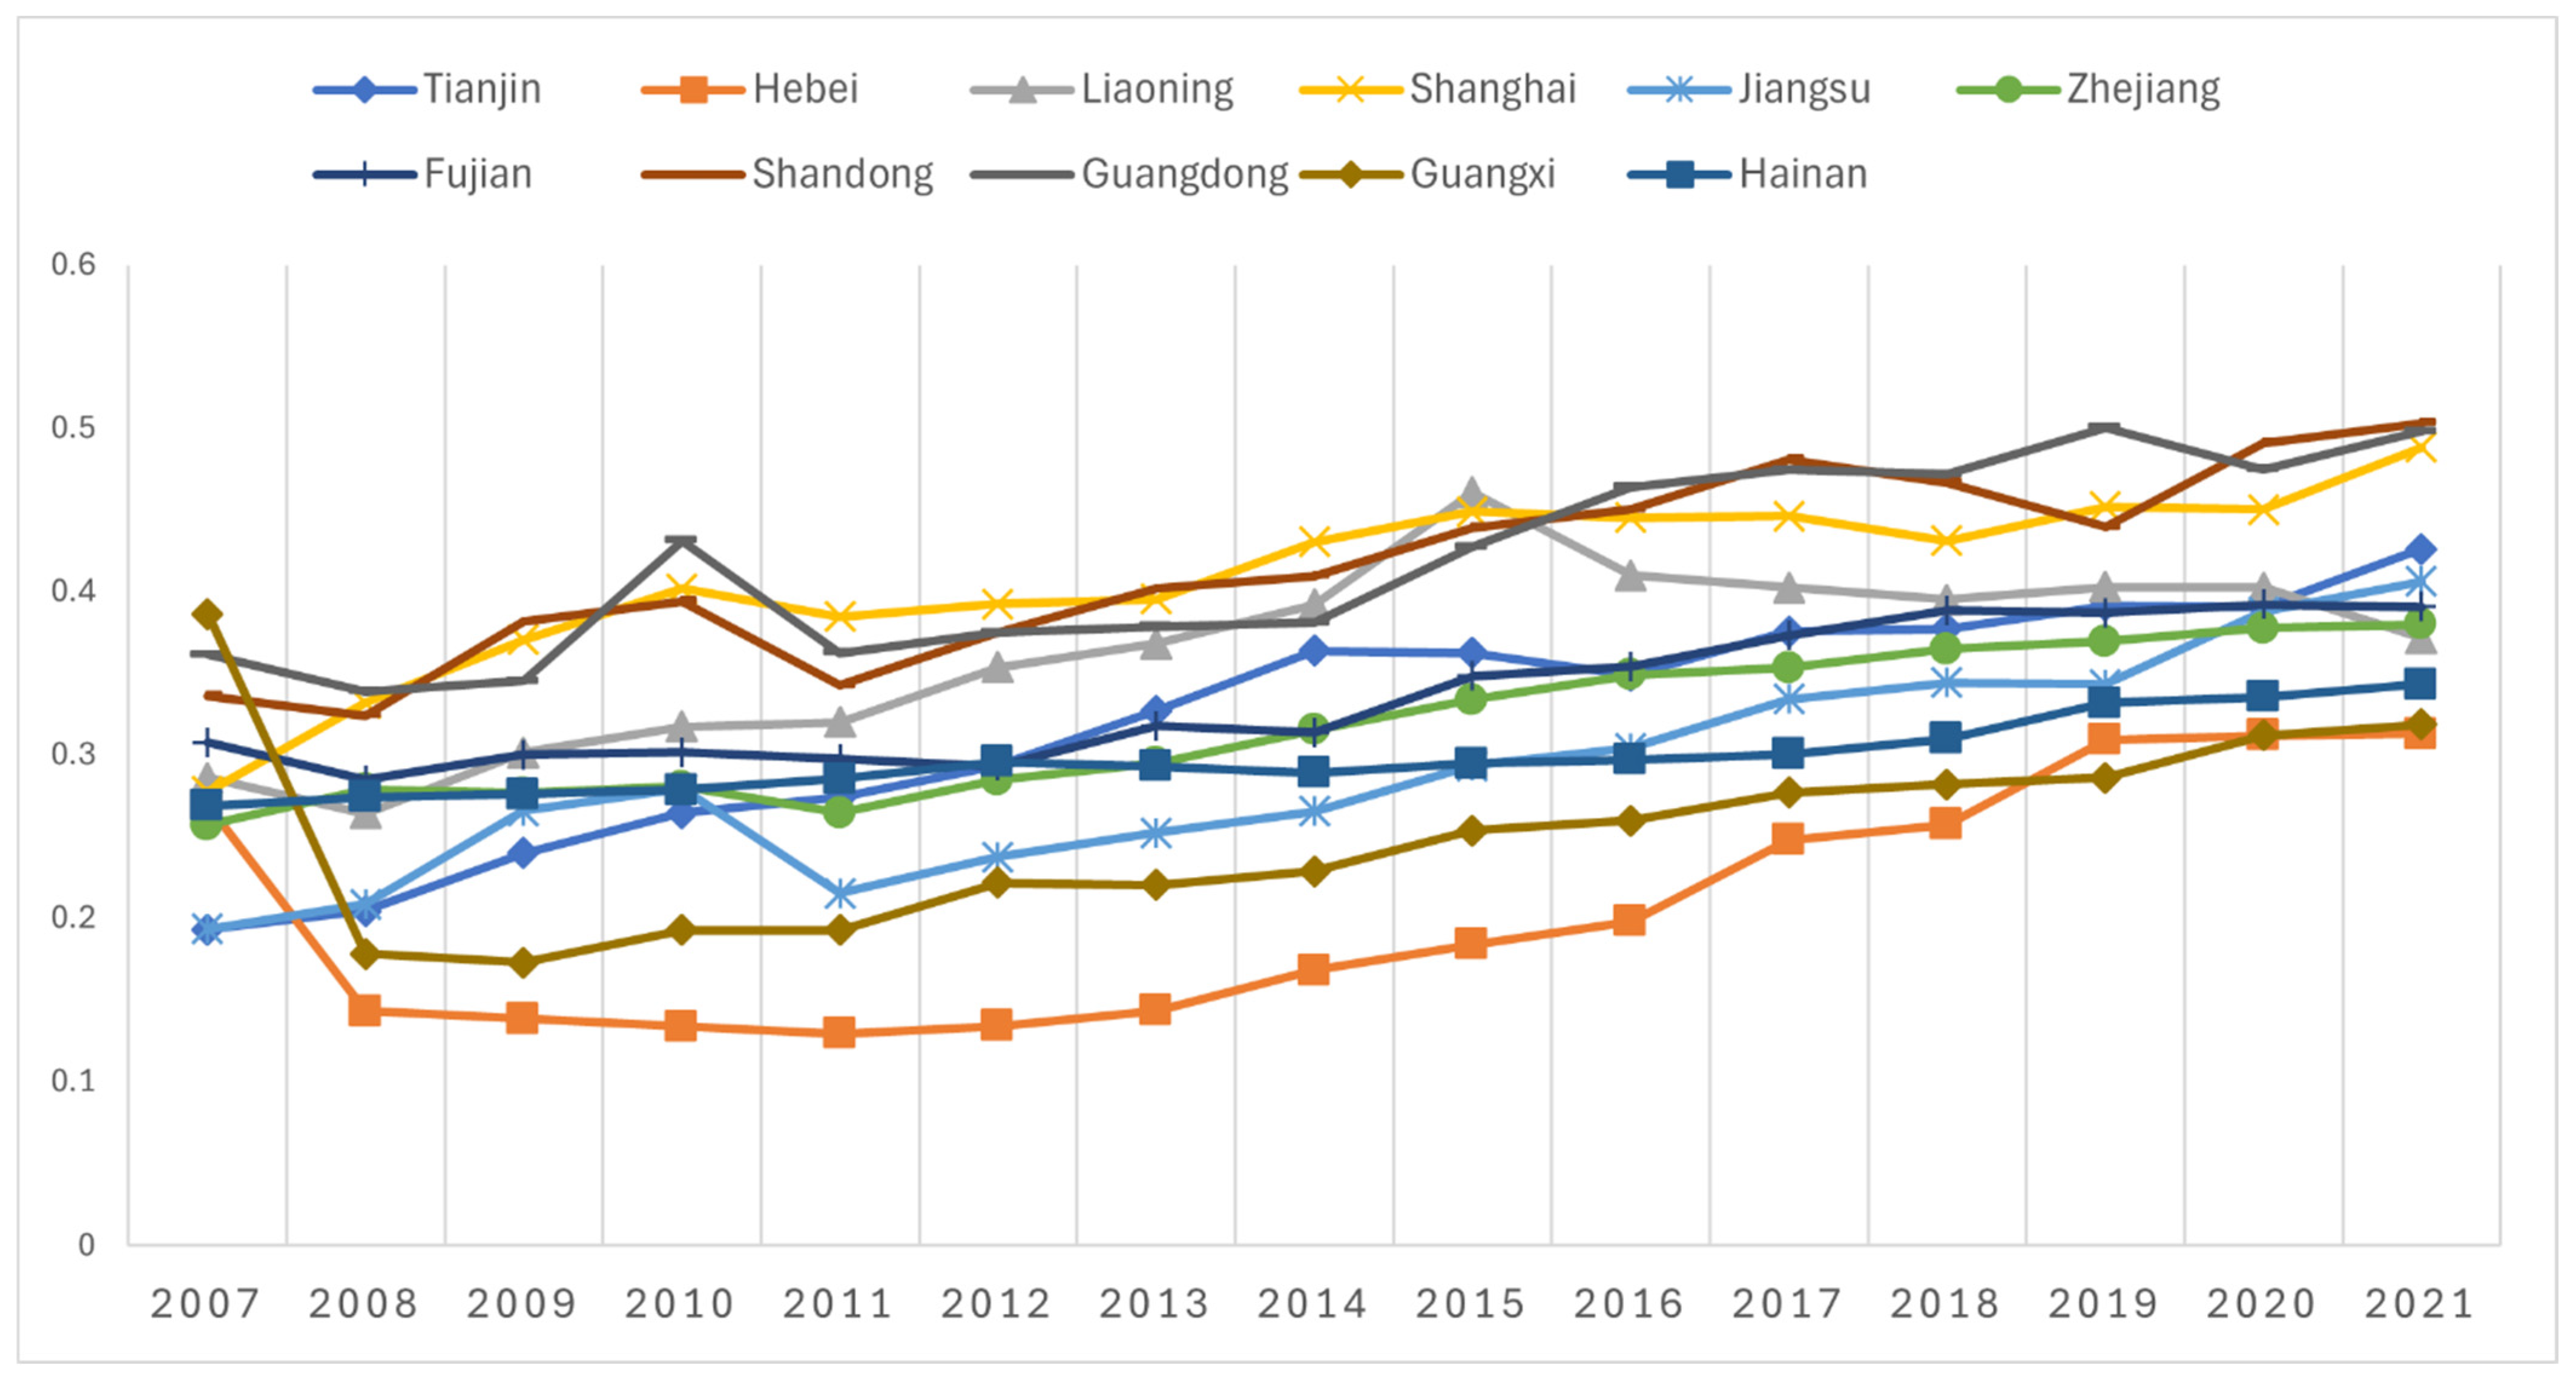
This study employs a panel data entropy weight-Topsis method to calculate the levels of MNQPFs in 11 coastal provinces and cities from 2007 to 2021. The results are presented in Table 6 and Figure 4. Calculations indicate an average annual growth rate of 2.34% for coastal MNQPFs. Guangdong exhibits the highest level, at 2.04 times that of Hebei, which demonstrates the lowest level. Figure 4 illustrates that China’s coastal MNQPFs followed a generally upward trend, albeit with fluctuations, from 2007 to 2021, including a period of significant growth. The difference in MNQPF levels between provinces appears to be decreasing over time. Shandong, Shanghai, and Guangdong maintain relatively high levels of MNQPFs, while Tianjin, Fujian, and Jiangsu exhibit intermediate levels, all demonstrating a fluctuating upward trend. Guangxi and Hebei consistently register the lowest levels of MNQPFs; however, both exhibit a pattern of large fluctuation and growth. Hainan occupies a mid-range level, represented by steady growth. Liaoning’s MNQPFs initially rose to a relatively high level before then declining.

4.2.2. Analysis of Spatial Distribution of Marine New Quality Productive Forces

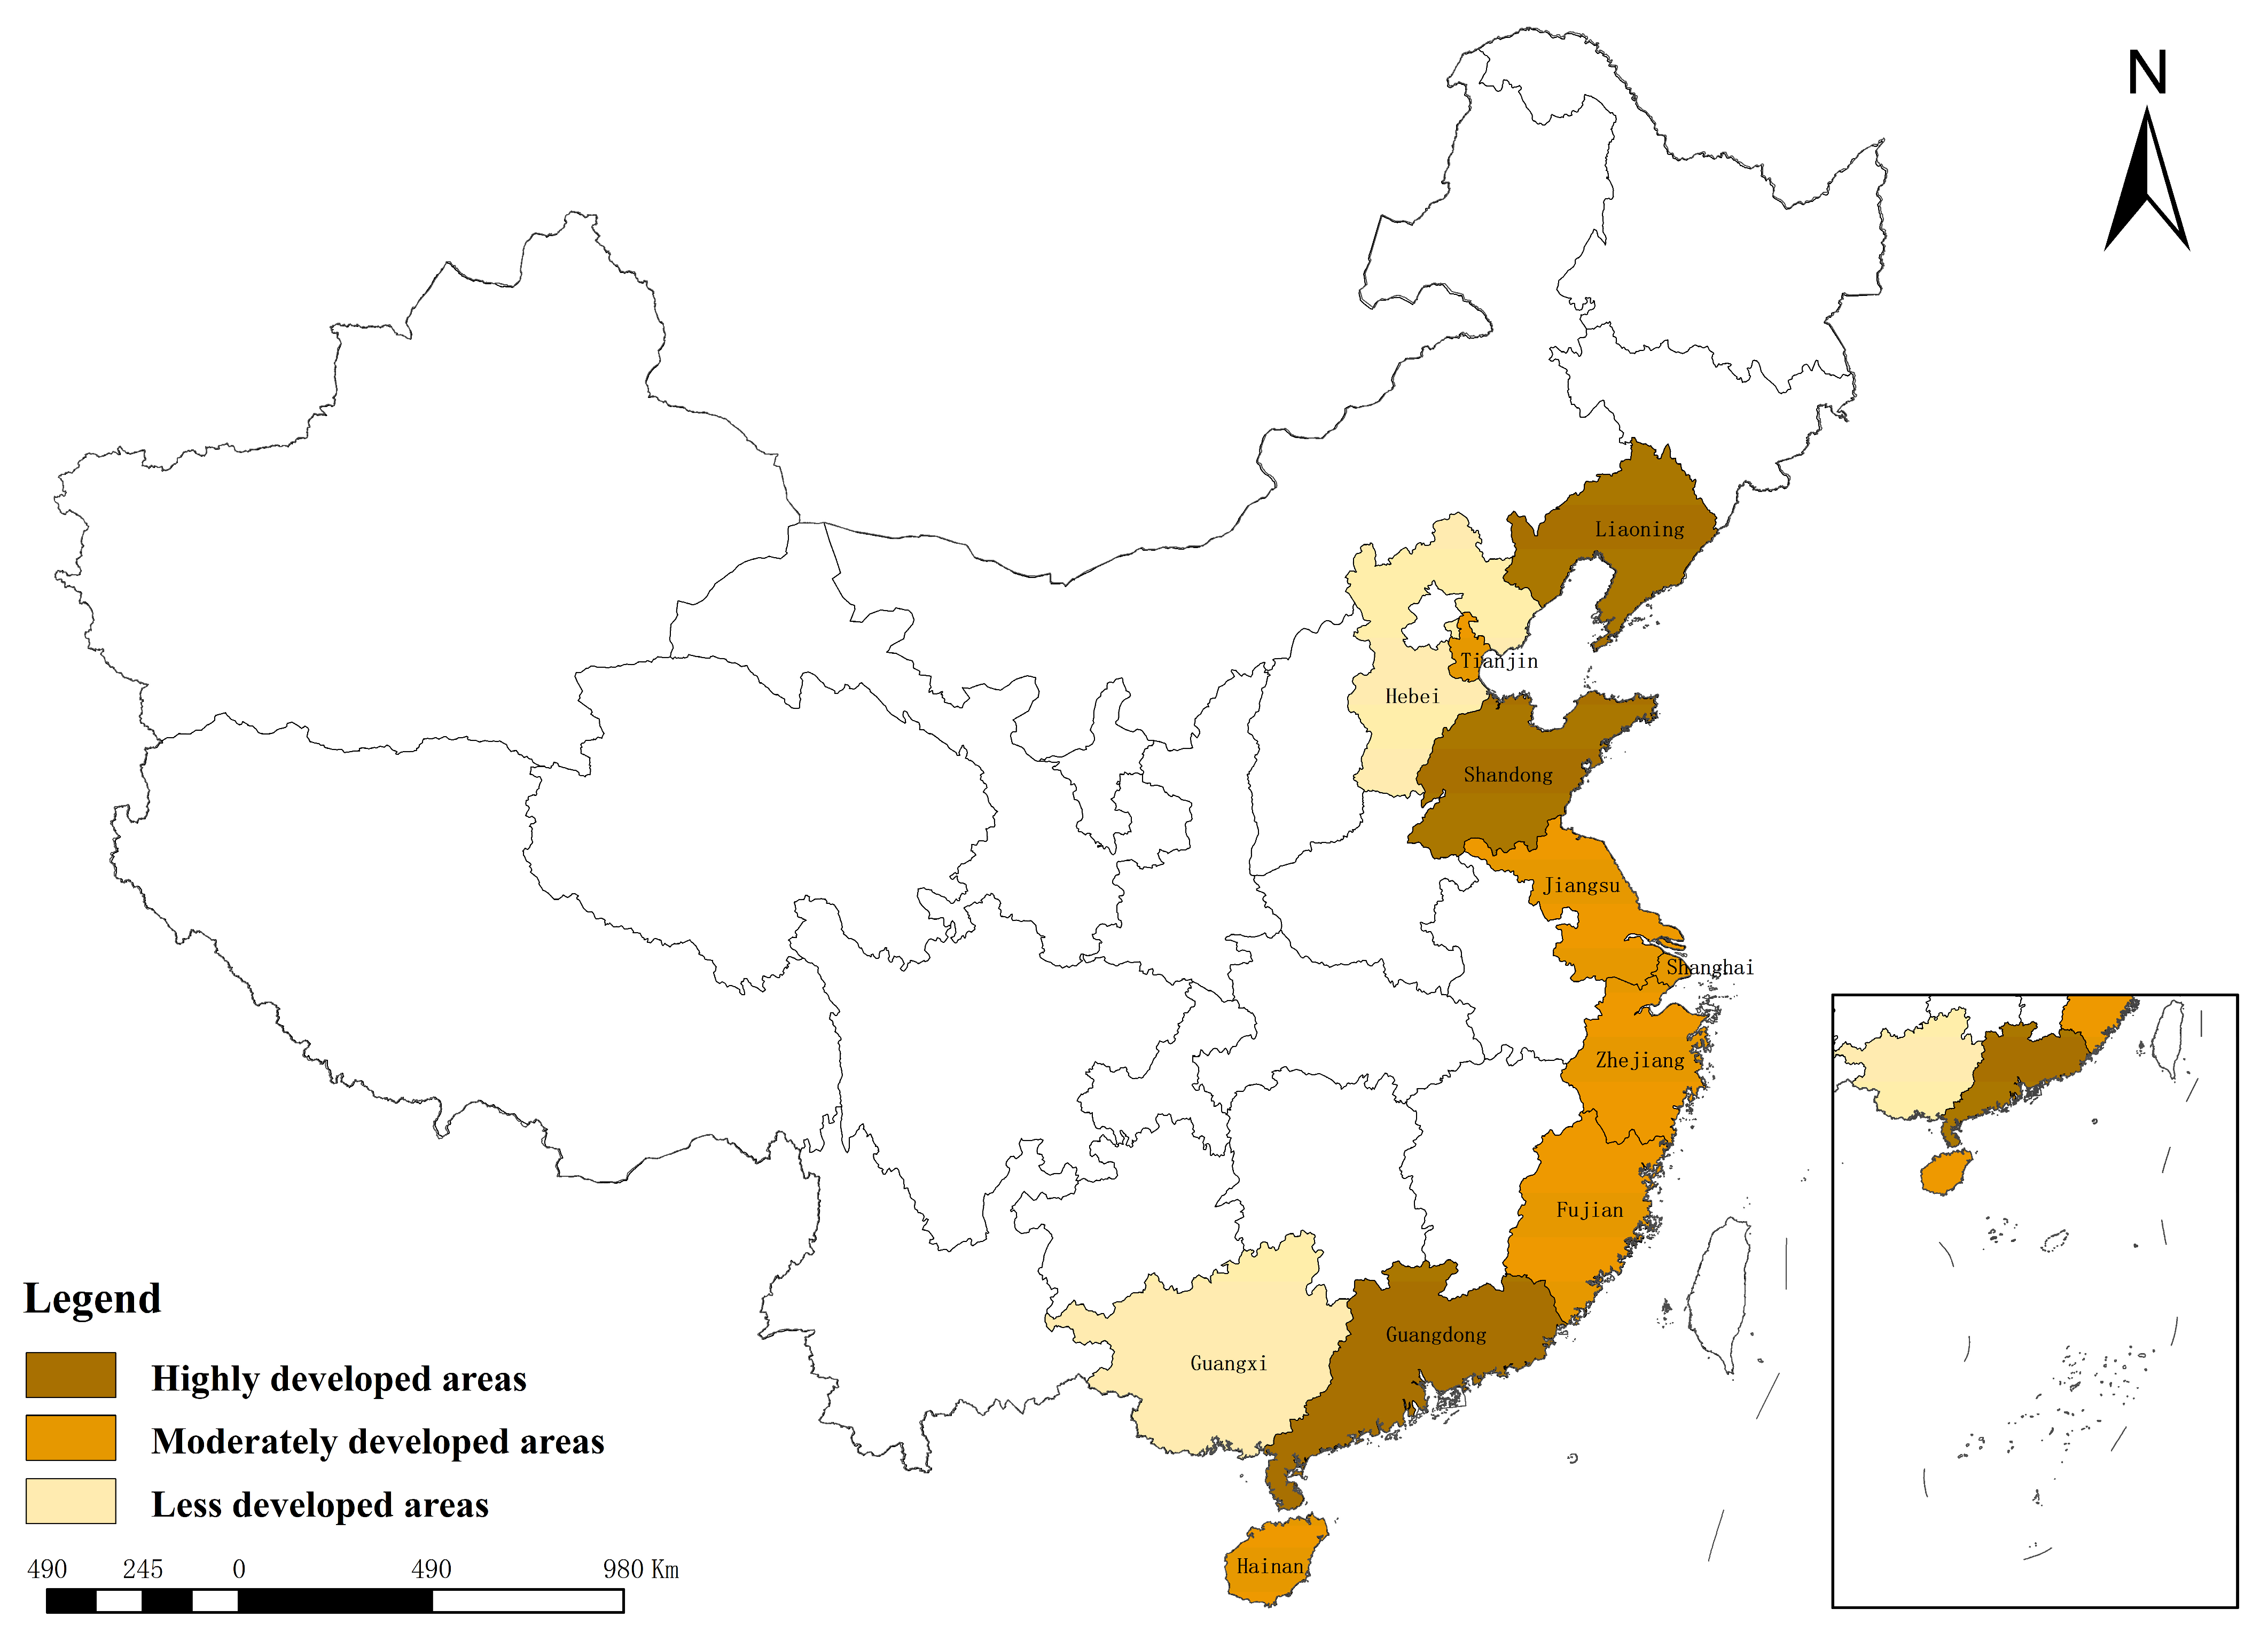
This study computes the mean value of marine economic resilience of 11 coastal provinces and cities from 2007 to 2021. Employing the Jenks Natural Breaks Classification, these areas are categorized, and ArcGIS10.8.1 was used to create a spatial distribution map. The analysis was based on the regional distribution plan described earlier. The results are shown in Table 7 and Figure 5. As indicated in Table 7, Shandong, Liaoning, Guangdong, and Shanghai represent highly developed areas. Tianjin, Fujian, Jiangsu, and Zhejiang are classified as moderately developed areas, while Guangxi and Hebei are less developed areas. Figure 5 indicates that the spatial distribution of MNQPFs exhibits similar characteristics in the Bohai region and the South China Sea regions, each including highly developed, moderately developed, and less developed areas, whereas, the Yellow Sea and East China Sea region demonstrates a more balanced distribution in the development level of these marine forces. Situated at the heart of the Yangtze River Economic Belt, Shanghai benefits from strong economic strength, a rich talent pool, and a concentration of innovation resources. And, its MNQPFs maintain a leading position, solidifying its status as a highly developed area. Zhejiang and Jiangsu, building upon robust economies and strong developmental foundations, further benefit from Shanghai’s radiating influence and driving force. This results in a high level of MNQPFs in these provinces, suggesting significant growth potential [71].
Among the highly developed areas, Shandong, Guangdong, Liaoning, and Shanghai have large populations. Among them, Guangdong and Shanghai have developed marine emerging industries and relatively complete marine infrastructure; Shandong and Liaoning have a number of marine colleges and universities and national marine research institutes, with a high reserve of talent in the marine sector. Although Liaoning’s marine economy is relatively weak compared with Shandong, Shanghai, and Guangdong, its marine ecological environment is superior. Therefore, these four regions have more advantages and potential for the development of MNQPFs [72]. Among the moderately developed areas, Tianjin and Zhejiang have a relatively high level of marine economic development, but their populations are relatively small, and Hainan also has a relatively small population. Jiangsu’s marine economy is dominated by the secondary marine industries. Fujian has relatively few universities and research institutes related to the sea, and the reserve of talent related to the sea needs to be strengthened. These five areas still have shortcomings in the development of MNQPFs and there is still much room for improvement. Among the less developed areas, Hebei and Guangxi have a relatively weak marine economy, with relatively single industry marine industries. Guangxi is adjacent to Guangdong, and Hebei is adjacent to Beijing, making it difficult to effectively attract and retain talent, all of which leads to a low level of MNQPFs in these two areas.

4.3. Benchmark Regression

Based on the theoretical analysis in the previous section, this section mainly explores the impact of marine new quality productive forces on marine economic resilience. The benchmark regression method used is panel regression. Before performing panel regression analysis, the Hausman test is performed to select a random effects model or a fixed effects model for regression analysis. The Hausman test showed that the chi-square statistics for marine new quality productive forces on marine economic resilience, the resistance ability of marine economic resilience, the recovery ability of marine economic resilience, and the evolution ability of marine economic resilience were 7.04, 31.01, 6.16, and 27.33, respectively, with p-values of 0.008, 0.000, 0.046, and 0.000, which are all less than 0.05. This indicates that the model rejects the original hypothesis that “individual effects are not correlated with explanatory variables”, that is, the analysis can use a fixed-effects model. Therefore, this paper uses a two-way fixed effects model for testing.
The presence of multicollinearity among the selected variables could lead to instability in the model’s estimation results, potentially producing misleading conclusions. For this reason, variance inflation factors (VIFs) are used in the model. The resulting VIF values exhibit a maximum of 2.32 and an average of 1.79, indicating the absence of multicollinearity among the explanatory, explained, and control variables. Therefore, these variables can be further analyzed.
Column (1) of Table 8 demonstrates the regression results of the impact of the MNQPFs on marine economic resilience. The regression coefficient is 0.041 and it is significant at the 5% significance level. This means that, for every 1 unit increase in the development level of MNQPFs, marine economic resilience increases by 0.041 units. Therefore, MNQPFs play a significant role in promoting the improvement of marine economic resilience. This verifies Hypothesis 1. Considering that the aforementioned marine economic resilience index system consists of three dimensions: resistance ability, recovery ability, and evolution ability, and since balanced development among these dimensions is crucial for the sustainable improvement of marine economic resilience, this study further analyzes the impact of MNQPFs on these three dimensions. Columns (2)–(4) of Table 8 present the regression results of MNQPFs on the resistance ability, recovery ability, and evolution ability of marine economic resilience, respectively. The impact of MNQPFs on resistance ability is positive and significant at the 1% level, with a regression coefficient of 0.18. The impact on recovery ability is also positive and significant at the 5% level, with a coefficient of 0.324. While the impact of MNQPFs on the evolution ability of marine economic resilience is positive, with a regression coefficient of 0.017, it is not significant. The reason why MNQPFs do not have a significant positive impact on the recovery ability of marine economic resilience may be that the recovery ability of marine economic resilience is related to the stability of the marine economy, its ability to respond to shocks, and the extent of losses. In the process of developing MNQPFs, it is inevitable to rely on the continuous and large-scale investment of marine resources and high energy consumption. Although some resource-intensive technologies can rapidly increase production capacity, they will cause hidden damage to ecological carrying capacity. Moreover, the extensive development model and excessive exploitation of marine resources in some coastal areas may cause imbalances in the marine economic structure and make the marine ecological environment increasingly sensitive and vulnerable, thereby weakening the stability and shock response ability of the marine economy and causing more serious losses. The recovery of the marine economic structure and the marine ecological environment requires more effort and time. Therefore, under such circumstances, the positive effect of MNQPFs on the recovery ability of marine economic resilience is not obvious [73].

4.4. Robustness Test

In order to make the regression process more rigorous and to demonstrate the robustness and reliability of the above analysis, a robustness test of the model is further conducted here.
First, this study conducts a robustness test by excluding the influence of unobservable factors and replacing control variables. Second, in order to solve the endogeneity problem caused by reverse causality, and taking into account the time lag nature of the impact of marine new quality productive forces on marine economic resilience, that is, whether the impact of the current marine new quality productive forces on the development of marine economic resilience is similar to the impact of the previous marine new quality productive forces on the development of marine economic resilience, this study uses the lagged marine new quality productive forces as an explanatory variable for regression analysis to test the robustness of the results.
(1)
Excluding the influence of unobservable factors
Considering the complexity of the real economic environment, the marine economic system often suffers from multidimensional shocks, and the intensity of the response to these shocks varies in each region at the same time, which may have a different impact on the observation results. This study incorporates the interaction of area and year as a fixed effect into the baseline regression model to address the problems caused by these unobservable variables that change over time and vary between individuals. This method is particularly suitable for analyzing the differentiated adjustment mechanisms of different economic systems in the face of multidimensional shocks. The results are shown in Table 9, and the regression results after controlling for area and year-related factors remain robust.
(2)
Replacement of control variables
Among the original control variables, this study selected the ratio of foreign direct investment to GDP to represent the impact of the degree of openness. When performing the robustness test, the ratio of total import and export volume to GDP was selected to replace the ratio of foreign direct investment to GDP. The newly introduced control variable is denoted by Re-open. The test results are shown in Table 10, which are basically consistent with the benchmark regression results.
(3)
Endogeneity discussion
The use of lagged explanatory variables can alleviate the endogeneity problem of mutual causality to a certain extent.
The regression results presented in Table 11 demonstrate that MNQPFs, lagged by one period, exert a significant positive impact on the overall level of marine economic resilience and its two dimensions: resistance ability and recovery ability. Specifically, these lagged forces demonstrate a significant positive impact on the recovery dimension of marine economic resilience. This result shows that the impact of MNQPFs begins to take effect from the current period. However, by observing the value of the coefficient, it is found that the impact of MNQPFs on marine economic resilience in the previous period is even stronger. This result emphasizes the dynamic cumulative effect of MNQPFs. Coastal areas must continue to cultivate the quantitative accumulation of MNQPFs to facilitate a qualitative advancement in these forces and establish a growth trend. This sustained development is crucial to enhancing marine economic resilience [74]. In addition, the lagged one-period MNQPFs positively contribute to marine economic resilience, with significance at the 5% level. This result demonstrates that temporal elements significantly constrain marine economic resilience. Secondly, it suggests that the impact of MNQPFs on marine economic resilience needs to be progressively revealed, and the time cost is relatively significant.

4.5. Heterogeneity Analysis

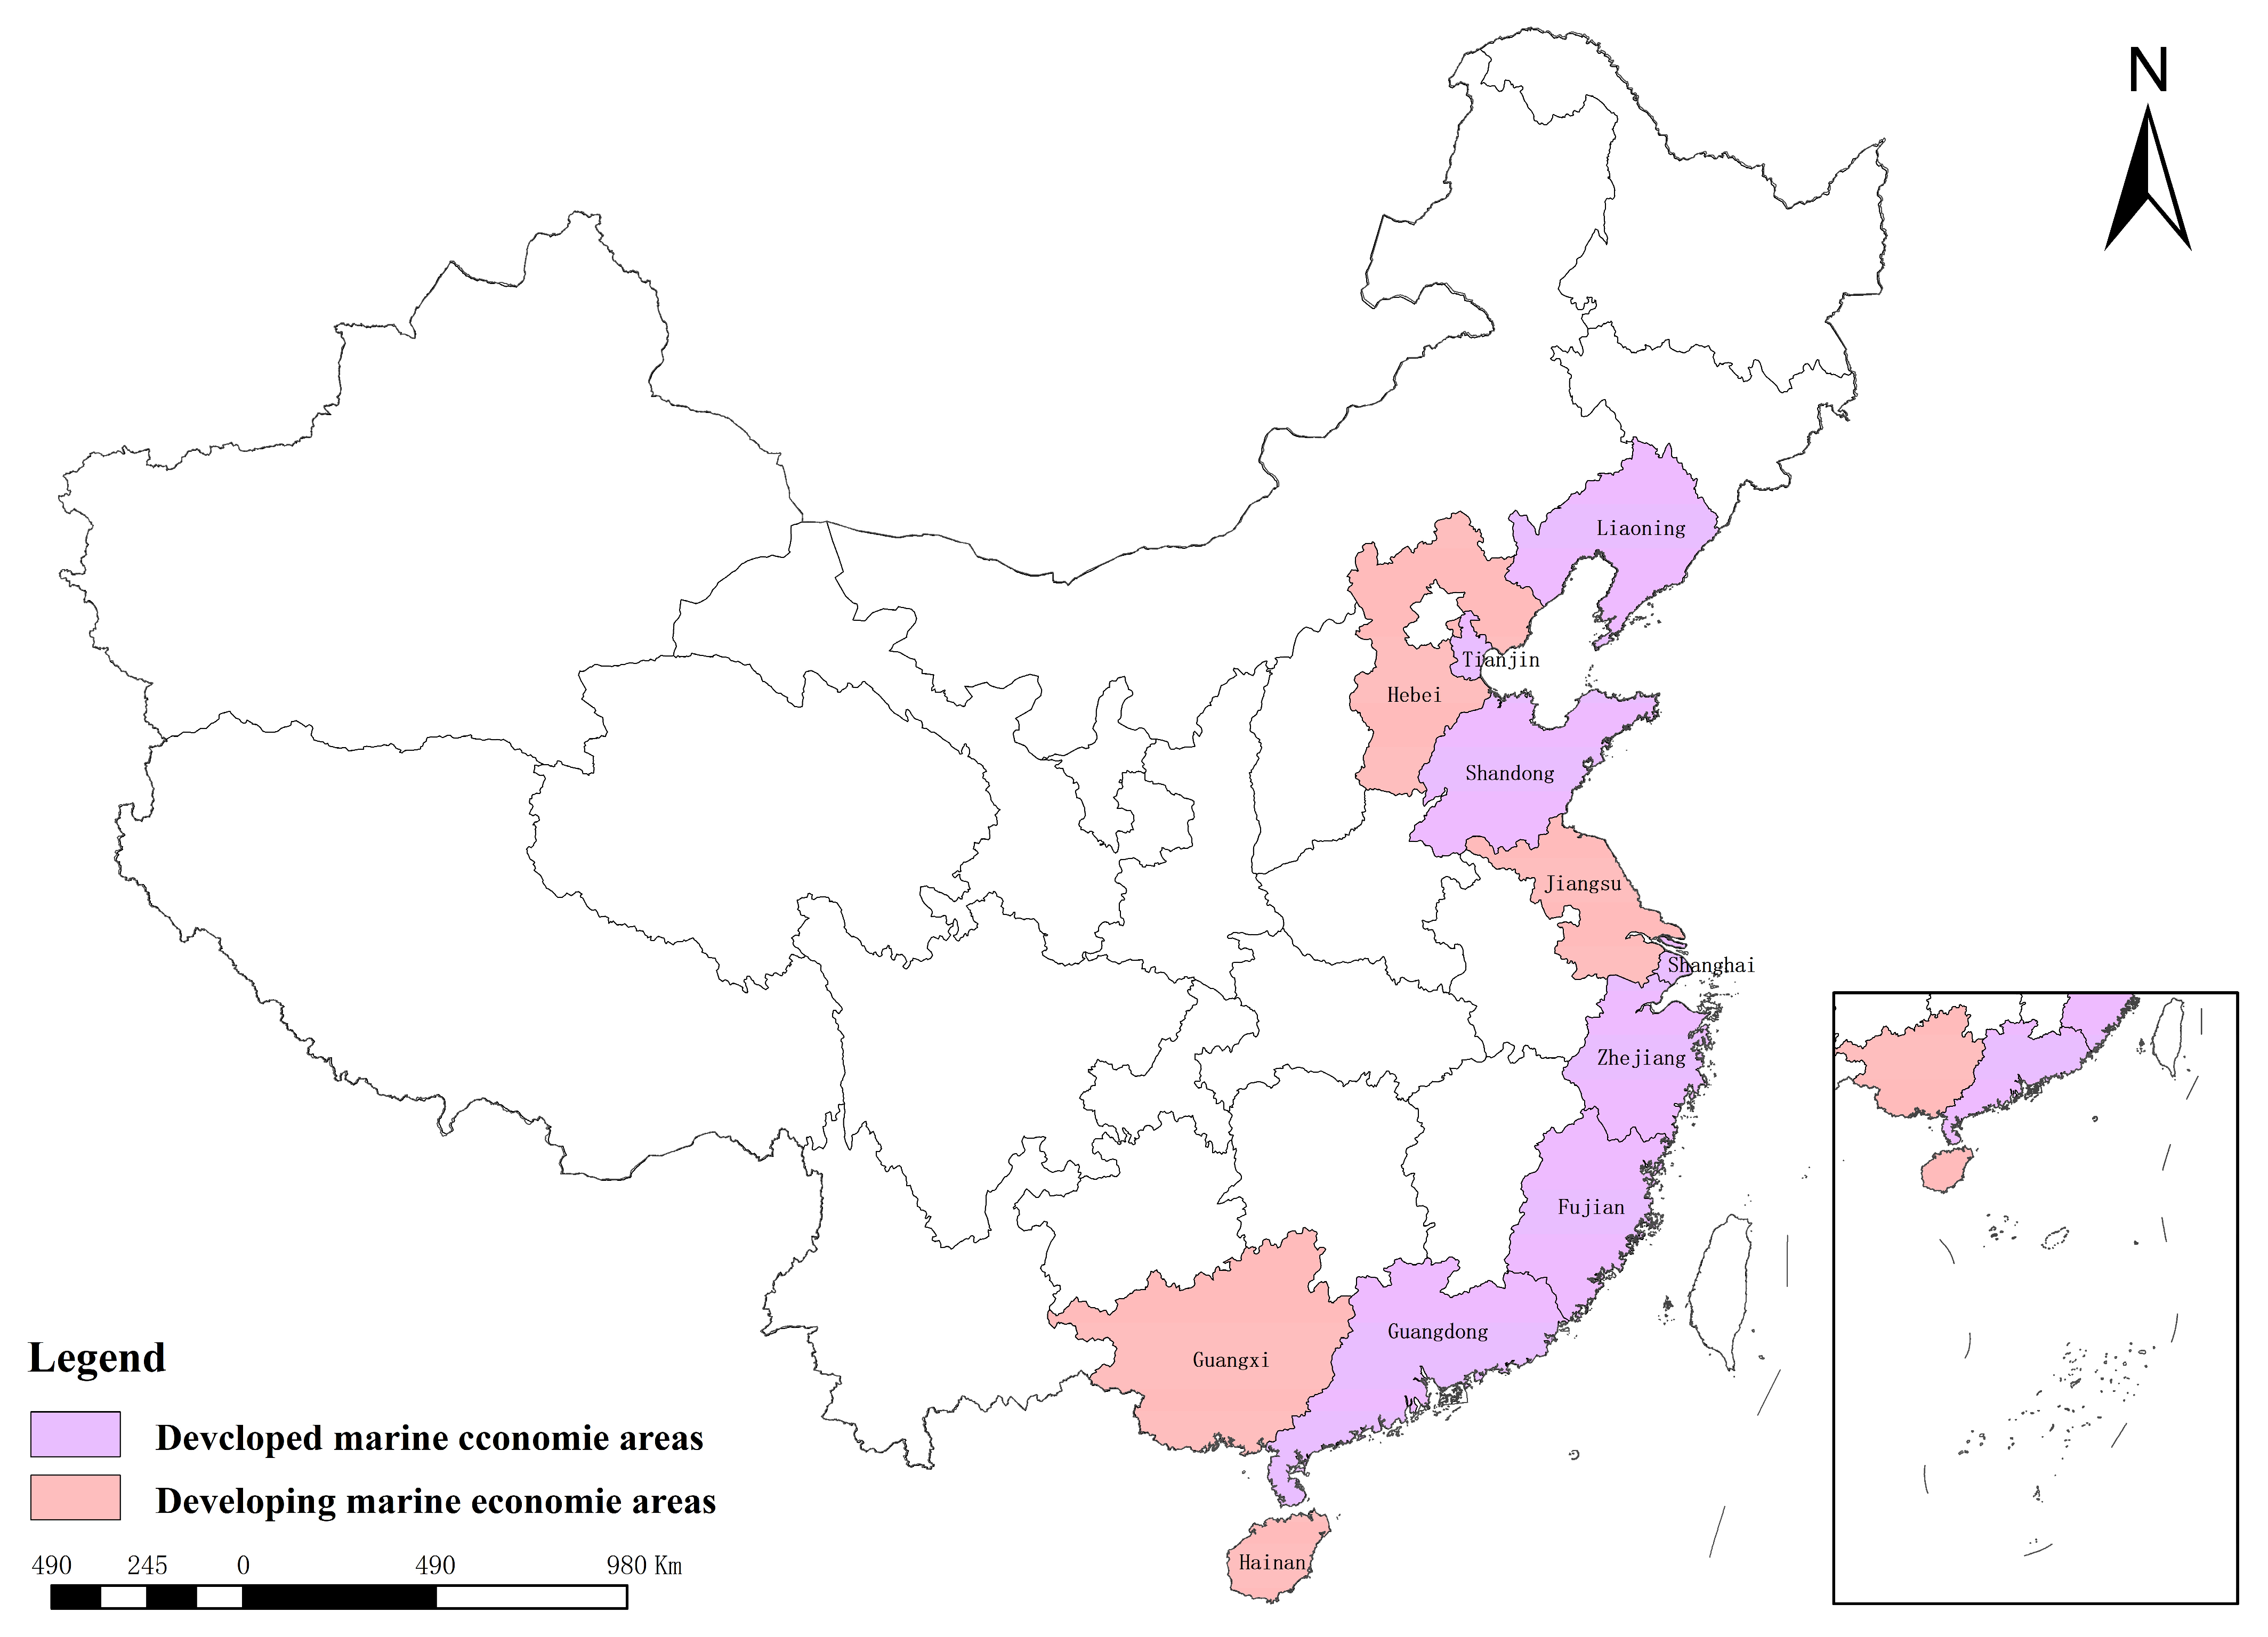
Based on the theoretical analysis above, this article, in accordance with the content of the 13th Five-Year Plan for the Development of the National Marine Economy, the functional stratification of the three major economic circles, the layout of the core urban agglomerations, and the objective gaps in the industrial structure, innovation capacity, and resource utilization efficiency of each province, clearly divides the regions participating in the construction of global marine central cities into developed marine economic areas, including Liaoning, Tianjin, Shandong, Shanghai, Zhejiang, Fujian, and Guangdong; the regions not participating in the construction are divided into developing marine economic areas, including Jiangsu, Hebei, Guangxi, and Hainan. Jiangsu, Guangxi, and Hainan have a certain foundation in the marine economy, but they do not meet the standards set by the plan for “global marine central cities” or “international industrial highlands”, and are, therefore, classified as developing marine economic areas. The results of the division are shown in Figure 6.
This study carries out an empirical analysis comparing these developed and less developed areas. Column (1) of Table 12 presents the regression results demonstrating the impact of MNQPFs on marine economic resilience in developed marine economic areas. The regression coefficient, 0.0549, is significant at the 10% level. Column (2) presents the regression results demonstrating the impact of MNQPFs on marine economic resilience in developed marine economic areas, obtaining a coefficient of 0.0575. This value is greater than that observed for developed areas and achieves significance at the 1% level. This analysis confirms Hypothesis 2.

5. Conclusions and Suggestions

To explore the relationship between MNQPFs and marine economic resilience, this study draws upon panel data from 11 coastal provinces and cities in China, covering the period from 2007 to 2021. Initially, this study establishes an innovative index system for both MNQPFs and marine economic resilience, enabling an assessment of their respective developmental levels across the 11 coastal provinces and cities. Then, utilizing a two-way fixed effects model, this study analyzes the impact of MNQPFs on marine economic resilience and discovers the underlying internal mechanisms at play. The primary conclusions of this research are as follows: (1) Measurements show that there are significant differences in the levels of marine new quality productive forces between different regions. Guangdong, Shandong, Liaoning, and Shanghai have shown good levels of development; Fujian, Zhejiang, Tianjin, and Jiangsu each have certain shortcomings in their development; and Guangxi and Hebei have weak levels of development of MNQPFs. In addition, the Bohai Sea region and the South China Sea region have similar spatial distributions of MNQPFs, while the Yellow Sea and East China Sea region has a more balanced level of development. (2) Calculations show that Guangdong has the highest level of marine economic resilience, consistently ranking first and far above the other provinces and cities. The most provinces and cities are in the moderately developed areas, including Zhejiang, Shanghai, Jiangsu, Shandong, Fujian, and Tianjin. Hainan, Guangxi, Hebei, and Liaoning have a lower level of marine economic resilience. In addition, the overall marine economic resilience of coastal areas shows that the Bohai Sea region is developing weakly, the South China Sea region is developing unevenly, and the Yellow Sea and East China Sea region is developing well. (3) Marine new quality productive forces have a significant positive impact on marine economic resilience. From the perspective of the three dimensions of marine economic resilience, marine new quality productive forces have a significant role in promoting the resistance ability and evolution ability of marine economic resilience, while they exhibit a positive role in promoting the recovery ability of marine economic resilience only in the second year. (4) The promotion impact of marine new quality productive forces on marine economic resilience will be affected by the heterogeneity of the level of marine economic development in coastal areas, and the positive promotion impact of marine new quality productive forces on marine economic resilience in less developed marine economic areas is stronger.
According to the conclusions of this study, the following policy suggestions are put forward:
(1)
Construct a differentiated regional collaborative mechanism to optimize the spatial layout of MNQPFs
Policies for differentiated guidance and regional collaboration should be implemented according to the development shortcomings and spatial distribution characteristics of MNQPFs in different areas. For leading provinces such as Guangdong and Shandong, their universities and scientific research institutions can increase the training of innovative talent in marine science and technology to optimize the layout of national scientific and technological strength for the national maritime strategy, continuously innovate the scientific research ecosystem, further improve the quality and quantity of maritime laborers, and strengthen their capacity for technological innovation and industrial radiation. For areas with shortcomings, such as Fujian and Zhejiang, the government can set up special funds to support the development of emerging marine industries, guide capital investment into emerging marine industries, focus on filling the gaps in marine digital infrastructure and the green energy industry chain, accelerate the transformation and upgrading of traditional marine industries, and cultivate and expand strategic emerging marine industries. For less developed areas such as Guangxi and Hebei, the government should promote the enhancement of their marine economic strength through cross-regional technology transfer and special fund support. The government should also continue to increase funding for marine scientific research, guide and encourage universities and enterprises in these areas to increase investment in research and development, and especially increase investment in the construction of digital infrastructure to create a good hardware and software environment for cultivating MNQPFs.
(2)
Strengthen the infrastructure and industrial upgrading in areas with weak marine economic resilience
For areas with low levels of marine economic resilience, such as Hainan and Guangxi, priority should be given to improving the infrastructure for marine disaster prevention and reduction and optimizing and improving the marine industrial policy system. For example, Hainan needs to strengthen the risk resistance of its ports, and Guangxi should lay out marine ecological restoration and high-value-added industries. For the Bohai Sea region and the South China Sea region, the upgrading and transformation of the marine industrial structure in coastal areas should be accelerated, and the development of the marine economy should be promoted at the policy level. For example, the transformation of traditional fisheries to smart aquaculture should be promoted to reduce the proportion of environmentally dependent industries. In addition, all areas need to strengthen the protection and restoration of the marine ecological environment, enhance the restoration function of the marine ecosystem in coastal areas, provide a good ecological environment to support the development of the marine economy, and thereby enhance marine economic resilience.
(3)
Promote the leapfrog development of underdeveloped marine areas and promote the balanced development of the coastal areas’ economies
Since MNQPFs have a stronger role in promoting the marine economic resilience of underdeveloped marine economic areas, it is recommended that special technical support plans be implemented in Hebei, Guangxi, and other places. For example, a marine science and technology development fund could be established to support localized innovation and marine-related enterprises could be introduced through tax incentives to develop emerging marine industries. Ultimately, the rapid development of the marine economy will be achieved by developing MNQPFs. For developed marine areas, the focus should be on technology spillovers. Scientific research institutions in Shandong, Shanghai, and other places should be encouraged to jointly establish laboratories with less developed areas, establish cross-regional cooperation mechanisms, share resources and advantages, improve the planning system and management mechanism, and promote the balanced development of the marine economy in coastal areas. Only in this way can the role of MNQPFs in enhancing marine economic resilience be better utilized.
This study verifies for the first time that MNQPFs in the marine sector can enhance marine economic resilience and constructs an evaluation index system for MNQPFs and marine economic resilience. In addition, this study effectively and comprehensively reflects the impact of new quality productivity in different dimensions and regions on the growth of marine economic resilience, enriching research on the relationship between the two in the marine field. This study provides a scientific reference for the sustainable development of the marine economy and the cultivation of MNQPFs in coastal areas around the world. However, this study still has limitations, and the spatial effects of MNQPFs on marine economic resilience deserve further exploration.

Author Contributions

Conceptualization, Q.G. and Z.F.; Methodology, Q.G., Z.F. and K.L.; Software, Z.F.; Formal analysis, K.L.; Data curation, K.L.; Writing – original draft, Z.F.; Writing – review & editing, Q.G. All authors have read and agreed to the published version of the manuscript.

Funding

This research was funded by Natural Science Foundation of Shandong Province, grant number ZR2022MG025; Humanities and Social Sciences Research Project of the Ministry of Education of China, grant number 22YJAZH019.

Institutional Review Board Statement

Not applicable.

Informed Consent Statement

Not applicable.

Data Availability Statement

The raw data supporting the conclusions of this article will be made available by the authors on request.

Conflicts of Interest

The authors declare no conflict of interest.

References

  1. Simmie, J.; Martin, R. The economic resilience of regions: Towards an evolutionary approach. Camb. J. Reg. Econ. Soc. 2010, 3, 27–43. [Google Scholar] [CrossRef]
  2. Liu, G.C.; Chen, K.X. The Impact of Innovation Capacity on the Convergence of Marine Economic Resilience in China’s Coastal Regions. Product. Res. 2023, 11, 59–66. [Google Scholar]
  3. Cui, J.; Xu, F.Z. Financial Development, Digital Economy and Resilience of the Marine Economy. Straits Sci. 2024, 3, 160–166. [Google Scholar]
  4. Li, B.; Cao, G. Structural resilience change of China’s marine economic network based on the data of sea-related A-share listed companies. Prog. Geogr. 2022, 41, 945–955. [Google Scholar] [CrossRef]
  5. Sun, C.Z.; Cao, Q.; Zou, W. Assessment of marine economy resilience of coastal cities in Bohai Sea Ring Area based on entropy efficiency model. J. Ningbo Univ. (Nat. Sci. Eng. Ed.) 2020, 33, 10–18. [Google Scholar]
  6. Yin, X.; Fang, Z.M. How Can New Quality Productivity Empower Green Economy. J. Nanjing Tech Univ. (Soc. Sci. Ed.) 2024, 23, 31–41+113. [Google Scholar]
  7. Wang, Y. New Productive Forces:A Theoretical Frame and Index System. J. Northwest Univ. (Philos. Soc. Sci. Ed.) 2024, 54, 35–44. [Google Scholar]
  8. Lin, L.; Gu, T.; Shi, Y. The influence of new quality productive forces on high-quality agricultural development in China: Mechanisms and empirical testing. Agriculture 2024, 14, 1022. [Google Scholar] [CrossRef]
  9. Jiang, Y.M.; Sun, X.Y.; Qiao, Z.Y. The Significance, Basic Framework and Realization Path of Developing New Quality Productivity from the Perspective of Chinese-style Modernization. J. Manag. 2024, 37, 1–15. [Google Scholar]
  10. Dong, X.S.; Lu, Y.S. The Conceptual Origin and Discourse Innovation of New Quality Productive Forces. Social. Stud. 2024, 6, 1–8. [Google Scholar]
  11. Xie, A.; Shao, J.R. Deep Explanation of the Concept of New Quality Productivity and Re-exploration of Its Mechanism—Also on the Discussion of Its Practice in Agricultural and Rural Fields. Hebei Acad. J. 2025, 45, 20–29. [Google Scholar]
  12. Zhang, X.H.; Ma, Y. The Necessity, Scientificity and Focus of Developing New Quality Productive Forces in Accordance with Local Conditions. J. Beijing Univ. Technol. (Soc. Sci. Ed.) 2024, 24, 118–130. [Google Scholar]
  13. Quan, Y.B.; Jin, J.L. Marine New Quality Productive Forces Empower Marine Environmental Governance: Theoretical Logic, Key Issues and Future Path. Ocean Dev. Manag. 2024, 41, 87–95. [Google Scholar]
  14. Jin, X.; Wang, Y.; Yin, K. Research on the measurement and spatiotemporal evolution characteristics of new quality productive forces in China’s marine economy. Front. Mar. Sci. 2024, 11, 1497167. [Google Scholar] [CrossRef]
  15. Shi, Y.T.; Wang, X.D.; Chen, K.X. New quality productivity and urban economic resilience:Theoretical logic and empirical evidence. J. Chongqing Univ. (Soc. Sci. Ed.) 2024, 30, 29–45. [Google Scholar]
  16. Cheng, J.Q.; Lou, X.Y.; Feng, E.D. Study on Driving the Green Development of Liaoning Marine Economy with New Quality Productive Forces. China Fish. 2024, 10, 89–91. [Google Scholar]
  17. Du, J.; Mai, X.L.; Mai, X.M.; Yan, B. Research on the impact of high-quality development of marine economy with new quality productivity based on spatial econometric model. Mar. Sci. Bull. 2025, 1, 117–130. [Google Scholar]
  18. Liang, C.L.; Zhang, J.; Chen, X.L.; Di, Q.B. Mechanism and effect of new productivity empowering high marine economy from the perspective of Chinese modernization. Mar. Sci. Bull. 2025, 1, 131–143. [Google Scholar]
  19. Yu, B.; Chu, C.J.; Liu, S.K. Research on the assessment of high-quality development of China’s coastal fishery economy from the perspective of new quality productivity. Agric. Technol. 2024, 44, 141–148. [Google Scholar]
  20. Li, X.Y.; Zhang, J.W. Research on the effect of new quality productivity forces on regional economic resilience--Empirical study based on spatial spillover effect and threshold effect. Contemp. Econ. 2024, 41, 26–38. [Google Scholar]
  21. Zhang, Y.; Wu, Z.M.; Cao, Z. A Study of the Impact of Regional New Quality Productivity on Economic Resilience in the Context of Industrial Structure. J. East China Univ. Technol. (Soc. Sci.) 2024, 43, 421–429. [Google Scholar]
  22. Zhang, J.R.; Meng, W.F. Theoretical Logic, Practical Challenges and Practical Paths of New Quality Productive Forces to Enhance the Resilience of Agricultural Economy. Reform 2024, 1, 51–60. [Google Scholar]
  23. Dong, W.W.; Wang, H.L. Analysis of the Impact of New Quality Productivity on Regional Economic Resilience. J. Ind. Technol. Econ. 2024, 43, 22–30+161. [Google Scholar]
  24. Li, H.Y. New Quality Productivity, Industrial Synergy Agglomeration and Urban Economic Resilience. Mod. Manag. 2024, 44, 35–43. [Google Scholar]
  25. Zhu, X.L.; Liu, Z.H. New quality productive forces empower closer cooperation between the Global South. Contemp. China World 2024, 3, 36–45+69. [Google Scholar]
  26. Chao, X.J.; Wang, Q. The Logic and Path of High-Quality Development Driven by New Quality Productivity. J. Xi’an Univ. Financ. Econ. 2024, 37, 12–20. [Google Scholar]
  27. Yuan, Z.M.; Li, M.; Li, Y.Z. Data Resources Empowering the Development of Enterprise New Quality Productive Forces: Theoretical Logic, Practical Constraints and Improvement Paths. Sci. Technol. Prog. Policy 2024, 1–10. [Google Scholar]
  28. Liu, L.Y.; Zhang, Y.W. New quality productive forces empower the high-quality development of the county economy: Theoretical logic and practical approach. Rural Econ. 2024, 12, 1–12. [Google Scholar]
  29. Zhang, Y.Q. The Practical Path of Xi Jinping Thought on Ecological Civilization and Marine Ecological Environmental Governance. J. Political Sci. Law 2024, 6, 3–17. [Google Scholar]
  30. Zhou, W.; Xu, L.Y. Further Discussion on New Quality Productive Forces: Misunderstandings, Formation Conditions, and Implementation Paths. Reform 2024, 3, 26–37. [Google Scholar]
  31. He, Z.L. The Scientific Connotation and Contemporary Significance of the Theory of New Quality Productive Forces. Soc. Sci. Chin. High. Educ. Inst. 2024, 3, 4–14+157. [Google Scholar]
  32. Zhu, X.F.; Li, R.X.; Xu, X.L.; Sun, J.C. Construction and Spatiotemporal Evolution of New Productivity Indicators of China. J. Ind. Technol. Econ. 2024, 43, 44–53. [Google Scholar]
  33. Wang, Y.; Wang, R.J. New quality productivity: Index construction and spatio temporal evolution. J. Xi’an Univ. Financ. Econ. 2024, 37, 31–47. [Google Scholar]
  34. Ye, F.; Wang, G.D.; Shi, Y.Y.; Guo, Y.F.; Gao, P. Measurement of the level of marine new quality productive forces in China, regional differences and convergence studies. Mar. Sci. Bull. 2024, 43, 639–651. [Google Scholar]
  35. Lin, S.T.; Zhang, W.J.; Wei, D.X. Essential Meaning, Evolvement Trend and Practical Paths of Sporting Goods Manufacturing Industry Forming New Quality Productive Forces. J. Shenyang Sport Univ. 2025, 44, 117–123. [Google Scholar]
  36. Zheng, Y. Impact mechanism of human capital agglomeration on industrial chain modernization: The moderating effect of talent policies. Geogr. Res. 2025, 44, 129–148. [Google Scholar]
  37. Ruan, S.M.; Shao, T.T. Development Level, Regional Disparities, and Spatiotemporal Evolution Characteristics of New Quality Productivity in the Yangtze River Delta Region. Econ. Probl. 2025, 1, 113–123. [Google Scholar]
  38. Xu, Z.Z.; Ma, D.L. Evaluation of the Cultivation and Development of “Three Networks and Four Modernizations” in New Marine Infrastructure. Shanghai J. Econ. 2024, 4, 91–103. [Google Scholar]
  39. Huang, Q.H.; Sheng, F.F. New Productive Forces System: Factor Characteristics, Structural Bearing and Functional Orientation. Reform 2024, 2, 15–24. [Google Scholar]
  40. Comfort, L.K. Risk and Resilience: Inter-organizational Learning Following the Northridge Earthquake of 17 January 1994. J. Contingencies Crisis Manag. 1994, 2, 157. [Google Scholar] [CrossRef]
  41. Gunderson, L.H.; Holling, C.S. Panarchy: Understanding Transformations in Human and Natural Systems; Island Press: Washington, DC, USA, 2003. [Google Scholar]
  42. Martin, R. Regional economic resilience, hysteresis and recessionary shocks. J. Econ. Geogr. 2012, 12, 1–32. [Google Scholar] [CrossRef]
  43. Chand, S. Pacific Island Regional Integration and Governance: An Overview; ANU Press: Canberra, Australia, 2005; pp. 1–6. [Google Scholar]
  44. Briguglio, L.; Cordina, G.; Farrugia, N.; Vella, S. Economic Vulnerability and Resilience: Concepts and Measurements. Oxf. Dev. Stud. 2009, 37, 229–247. [Google Scholar] [CrossRef]
  45. Jiang, H.H.; Wen, Y.P. Temporal and spatial characteristics of China’s marine economic resilience and its obstacle diagnosis. Chin. Fish. Econ. 2022, 40, 79–88. [Google Scholar]
  46. Song, L.; Zhao, M.R.; Tang, Y.Q. Spatial-temporal differentiation and influencing factors of marine economic resilience in China’s coastal provinces and regions. J. Liaoning Norm. Univ. (Nat. Sci. Ed.) 2022, 45, 377–387. [Google Scholar]
  47. Wang, Y.S. Development and Spatial Structure of China’s Marine Economic Resilience. Areal Res. Dev. 2023, 42, 7–12. [Google Scholar]
  48. Wang, Z.Y.; Wang, Y.X. Spatial and Temporal Differentiation and Influencing Factors of the Marine Economy Resilience in China. Econ. Geogr. 2019, 39, 139–145+151. [Google Scholar]
  49. Ferraro, A.; Marino, E.; Trancone, G.; Race, M.; Mali, M.; Pontoni, L.; Fabbricino, M.; Spasiano, D.; Fratino, U. Assessment of environmental parameters effect on potentially toxic elements mobility in foreshore sediments to support marine-coastal contamination prediction. Mar. Pollut. Bull. 2023, 194, 115338. [Google Scholar] [CrossRef]
  50. Martin, R.; Sunley, P. On the notion of regional economic resilience: Conceptualization and explanation. J. Econ. Geogr. 2014, 15, 1–42. [Google Scholar] [CrossRef]
  51. Wang, Q.; Zhao, L.; Yu, W.; Jia, J.Q. Spatial-Temporal Evolution Characteristics and Influencing Factors of Resilience of Tourism Economic System in China. Geogr. Geo-Inf. Sci. 2020, 36, 113–118. [Google Scholar]
  52. Liu, Y.; Zhang, J.Y. Research on the Evolution of Economic Resilience of China’s Marine Fisheries with the “Technology-Industry” Dual-drive. J. Zhejiang Ocean Univ. (Humanit. Sci.) 2024, 41, 11–19. [Google Scholar]
  53. Liu, J. Integration of Digital Economy and Real Economy, New-quality Productivity and China’s New Industrialization. Stat. Decis. 2024, 40, 19–24. [Google Scholar]
  54. Capello, R.; Caragliu, A.; Fratesi, U. Spatial heterogeneity in the costs of the economic crisis in Europe: Are cities sources of regional resilience? J. Econ. Geogr. 2015, 15, 951–972. [Google Scholar] [CrossRef]
  55. Zhang, L.G.; Chen, T.Q. A double leap in “strength” and “degree”: The logic and path of how new quality productive forces empower the high-quality development of socialized agricultural services. Soc. Sci. J. 2025, 2, 159–169. [Google Scholar]
  56. Wang, Y.H.; Ma, Y.Q. New Quality Productivity, Firm Innovation and Supply Chain Resilience:Micro Evidence from Listed Companies in China. Soc. Sci. Xinjiang 2024, 3, 68–82+177. [Google Scholar]
  57. Li, H.D.; Ma, W.B.; Zhang, L.J.; Lü, Y.J.; Liu, C.Y.; Zhao, L.J. Synergistic Governance of Urban Ecology and Environment: From the Perspectives of Ecological Resilience and Synergistic Efficiency. J. Ecol. Rural Environ. 2023, 39, 1096–1102. [Google Scholar]
  58. Ding, C.H.; Gao, X.; Yi, X. Spatiotemporal Evolution and Influencing Factors of Economic Resilience in Three Major Urban Clusters in the Yangtze River Economic Belt: A Perspective Based on Different City Types. Resour. Environ. Yangtze Basin 2025, 34, 280–294. [Google Scholar]
  59. Zhai, R.X. On the Driving Effects Measurement of Marine Economy in China’s Coastal Areas. Forum Sci. Technol. China 2018, 9, 41–48. [Google Scholar]
  60. Zhou, W.; He, Y.Q. Systematic integration of new quality productive forces: Indicator system and key measures. J. Xinjiang Norm. Univ. (Ed. Philos. Soc. Sci.) 2025, 5, 1–11. [Google Scholar]
  61. Zhan, Y.; Li, S.N. The Logic, Mechanism, and Path of Promoting the Modernization of Industrial Chain through New Quality Productivity Forces. Reform 2024, 5, 54–63. [Google Scholar]
  62. Jiang, Z.Y.; Liu, Q.F.; Song, J.P. Pattern Characteristics and Evolution Mechanism of China’s Regional Economic Resilience. Econ. Geogr. 2023, 43, 1–12. [Google Scholar]
  63. Ding, J.J.; Wang, Z.; Liu, Y.H.; Yu, F.W. Measurement of economic resilience of contiguous poverty-stricken areas in China and influencing factor analysis. Prog. Geogr. 2020, 39, 924–937. [Google Scholar] [CrossRef]
  64. Ding, J.J.; Zhou, C.H. Regional Economic Resilience Effect and Mechanism of Digital Financial Inclusion—Based on the Perspective of Entry and Exit of Micro, Small and Medium-sized Business Entities. World Surv. Res. 2024, 5, 53–63. [Google Scholar]
  65. Tang, Y.; Song, Y.; Xue, D.; Ma, B.; Ye, H. Urban Shrinkage from the Perspective of Economic Resilience and Population Change: A Case Study of the Shanxi-Shaanxi-Inner Mongolia Region. Land 2024, 13, 444. [Google Scholar] [CrossRef]
  66. Zhao, Z.; Hu, Z.; Han, X.; Chen, L.; Li, Z. Evaluation of urban resilience and its influencing factors: A case study of the yichang–jingzhou–jingmen–enshi urban agglomeration in China. Sustainability 2024, 16, 7090. [Google Scholar] [CrossRef]
  67. Huang, Q.; Guo, W.; Wang, Y. A Study of the Impact of New Quality Productive Forces on Agricultural Modernization: Empirical Evidence from China. Agriculture 2024, 14, 1935. [Google Scholar] [CrossRef]
  68. Liang, J.F.; Cheney, S.L. Evaluation and Grey Correlational Analysis of Land Use Performance in Fujian Province Based on Entropy-weight TOPSIS Model. J. Fujian Norm. Univ. (Nat. Sci. Ed.) 2019, 35, 80–87. [Google Scholar]
  69. Xia, S.H.; Wang, J.H.; Wang, M. Research on the development level of rural industry under the background of rural revitalization: Based on entropy weight method—TOPSIS comprehensive evaluation model. Hubei Agric. Sci. 2019, 58, 184–187. [Google Scholar]
  70. Shan, J.J.; Yang, F.W.; Wang, X.Y. Research on blue economy cooperation between Guangdong-Hong Kong-Macao Greater Bay Area and ASEAN: Perspective based on spatial linkages analysis. Urban Probl. 2024, 10, 17–26. [Google Scholar]
  71. Han, J.H.; Fu, H.J.; Jiang, B. The Spatiotemporal Pattern Evolution and Obstacle Factors of New Productive Forces in the Yangtze River Delta Urban Agglomeration. World Surv. Res. 2024, 1–16. [Google Scholar] [CrossRef]
  72. Wang, N.; Liu, H.W.; Gong, Y.R. Measurement of the development level of new quality productive forces, dynamic evolution and characteristics of temporal convergence. Stat. Decis. 2024, 40, 103–108. [Google Scholar]
  73. Zhu, B.Q.; Li, T. Impact of rural industrial integration development on county economic resilience. J. Agro-For. Econ. Manag. 2024, 23, 414–424. [Google Scholar]
  74. Yang, J.L. A Study on the Impact of the Western Land-Sea New Corridor on Enhancing the New Quality of Productive Forces along the Corridor. Econ. Surv. 2024, 41, 45. [Google Scholar] [CrossRef]
Figure 1. Time variation of the level of marine economic resilience. Source: Figure drawn by authors.
Sustainability 17 04457 g001
Figure 2. Nuclear density estimation of the level of marine economic resilience. Source: Figure created by the authors.
Sustainability 17 04457 g002
Figure 3. Spatial distribution of the level of marine economic resilience. Source: Figure drawn by authors. Note: the map is drawn based on the standard map with the approval number of GS (2022) 1873 of the standard map service system of the Ministry of Natural Resources, and the province (city) base map is not modified.
Sustainability 17 04457 g003
Figure 4. Time variation trend of the level of marine new quality productive forces. Source: Data calculated by the authors; figure drawn by authors.
Sustainability 17 04457 g004
Figure 5. Spatial distribution of marine new quality productive forces. Source: Data calculated by the authors; figure drawn by authors. Note: the map is drawn based on the standard map with the approval number of GS (2022) 1873 of the standard map service system of the Ministry of Natural Resources, and the province (city) base map is not modified.
Sustainability 17 04457 g005
Figure 6. Spatial distribution of developed marine economic areas and less developed marine economic areas. Source: Figure drawn by authors. Note: the map is drawn based on the standard map with the approval number of GS (2022) 1873 of the standard map service system of the Ministry of Natural Resources, and the province (city) base map is not modified.
Sustainability 17 04457 g006
Table 1. Index system of MNQPFs. Source: Drawn by the authors.
Primary IndexSecondary IndexTertiary IndexWeightIndex Attribute
New quality laborersLaborer skillsNumber of ocean-related employees0.090640Positive (+)
Number of students majoring in marine specialty0.090945Positive (+)
Labor productivityPer capita marine capital stock0.090877Positive (+)
Per capita GOP of ocean-related employees0.090871Positive (+)
New quality labor objectsNew quality industryProportion of marine tertiary industry in GOP0.090845Positive (+)
Ecological environmentTotal investment in marine environmental pollution control0.090994Positive (+)
Direct discharge of industrial wastewater per unit coastline0.091026Negative (−)
New quality labor resourcesTangible labor resourcesProportion of information technology service income in GDP in coastal areas0.091016Positive (+)
Long distance optical cable length per unit area in coastal areas0.090955Positive (+)
Intangible labor resourcesNumber of patents per capita for personnel engaged in marine scientifical activities0.090846Positive (+)
R&D investment of marine scientific research institutions0.090985Positive (+)
Table 2. Index system of marine economic resilience. Source: Drawn by the authors.
Primary IndexSecondary IndexTertiary IndexWeightIndex Attribute
Marine economic resilienceResistance abilityPer capita GOP0.058762Positive (+)
Contribution rate of GOP ①0.058767Positive (+)
International tourism foreign exchange earnings0.058794Positive (+)
Port cargo throughput0.058823Positive (+)
Comprehensive development index of marine natural resources ②0.058663Positive (+)
Comprehensive index of marine infrastructure ③0.058733Positive (+)
Recovery abilityDisposable income of urban residents0.05894Positive (+)
Registered unemployment rate of residents0.058901Negative (−)
Direct economic losses from marine disasters0.059048Negative (−)
Environmental pollution index ④0.05899Negative (−)
Degree of exploitation of ocean areas ⑤0.058883Negative (−)
Financial development level ⑥0.058809Positive (+)
Evolution abilityMarketization index ⑦0.058814Positive (+)
Number of employees in marine scientific research institutions0.058808Positive (+)
Added value of industries of marine scientific research, education, management, and service0.058867Positive (+)
Number of marine nature reserves0.05868Positive (+)
Economic density of coastline ⑧0.058718Positive (+)
Notes: ① Gross Ocean Product (GOP) contribution rate = GOP/GDP. ② Comprehensive development index of marine natural resources = W i G i , where i = 1,2 , , 6 , and represents mariculture output, marine fishing yield, sea salt production, offshore crude oil extraction, marine natural gas production, and marine mineral production volumes, respectively; W i denotes the weighting coefficient; G i expresses the standardized value. ③ Comprehensive index of marine infrastructure = W j G j , where i = 1 ,   2 ,   3 , and refers to the quantity of production wharves, star-rated hotels, and coastal observation stations, respectively; W j illustrates the weighting coefficient; G j stands for the standardized value. ④ Environmental pollution index = ( D R E ) 1 / 3 , where D indicates the centralized sewage treatment rate, R depicts the harmless waste disposal rate, and E conveys the industrial solid waste utilization rate. ⑤ Degree of exploitation of ocean areas = Mariculture Area/Jurisdictional Marine Area. ⑥ Financial development level = Financial Institution Deposit and Loan Balance / G D P . ⑦ Marketization index is sourced from the China Provincial Marketization Index Database (http://cmi.ssap.com.cn/, accessed on 30 December 2024). ⑧ Economic density of coastline = Gross Ocean Product/Coastline Length.
Table 3. Variable description. Source: Variable selection.
TypeSymbolVariableCalculation
Explained variableMERMarine economic resilienceEntropy weight-Topsis method
Explanatory variableMNQPFsMarine new quality productive forcesEntropy weight-Topsis method
Control variablegovGovernment managementTotal financial expenditure/GDP
openDegree of opennessForeign direct investment/GDP
interLevel of informatizationInternet penetration
marMarket scaleTotal retail sales of urban social consumer goods/GDP
Table 4. Measurement results of marine economic resilience. Source: Data calculated by the authors; table drawn by authors.
YearTianjinHebeiLiaoningShanghaiJiangsuZhejiangFujianShandongGuangdongGuangxiHainan
20070.444 0.345 0.334 0.462 0.401 0.430 0.402 0.420 0.504 0.340 0.389
20080.444 0.346 0.346 0.471 0.400 0.431 0.392 0.444 0.463 0.342 0.384
20090.458 0.352 0.350 0.468 0.413 0.449 0.404 0.439 0.519 0.358 0.386
20100.483 0.352 0.364 0.483 0.436 0.456 0.408 0.454 0.540 0.363 0.396
20110.488 0.355 0.366 0.492 0.441 0.461 0.416 0.455 0.548 0.356 0.406
20120.498 0.350 0.371 0.507 0.442 0.453 0.422 0.453 0.560 0.367 0.416
20130.515 0.375 0.381 0.497 0.444 0.464 0.422 0.470 0.558 0.374 0.421
20140.525 0.380 0.376 0.498 0.447 0.478 0.443 0.488 0.576 0.369 0.400
20150.524 0.386 0.376 0.513 0.450 0.482 0.465 0.492 0.611 0.385 0.418
20160.500 0.371 0.378 0.509 0.434 0.492 0.478 0.502 0.612 0.377 0.419
20170.506 0.385 0.371 0.516 0.436 0.496 0.479 0.508 0.611 0.392 0.418
20180.504 0.394 0.369 0.524 0.441 0.484 0.482 0.502 0.641 0.390 0.415
20190.497 0.397 0.371 0.534 0.455 0.469 0.473 0.488 0.620 0.391 0.417
20200.476 0.399 0.372 0.524 0.453 0.492 0.439 0.500 0.606 0.387 0.409
20210.473 0.399 0.376 0.526 0.464 0.496 0.441 0.507 0.621 0.392 0.399
Table 5. Criteria for the level of marine economic resilience. Source: Classification based on location quotient index.
TypeAreaCriterion
Highly developed areaGuangdong M E R 0.5
Moderately developed areasFujian, Zhejiang, Shanghai, Jiangsu, Shandong, Tianjin 0.4 M E R < 0.5
Less developed areasHainan, Guangxi, Hebei, Liaoning M E R < 0.4
Table 6. Calculation results of MNQPFs. Source: Data calculated by the authors; table drawn by authors.
YearTianjinHebeiLiaoningShanghaiJiangsuZhejiangFujianShandongGuangdongGuangxiHainan
20070.193 0.269 0.286 0.278 0.193 0.257 0.308 0.336 0.361 0.387 0.269
20080.205 0.143 0.264 0.332 0.209 0.279 0.285 0.324 0.339 0.178 0.274
20090.240 0.139 0.301 0.370 0.266 0.277 0.300 0.382 0.345 0.173 0.276
20100.264 0.134 0.317 0.402 0.279 0.281 0.302 0.394 0.431 0.193 0.279
20110.274 0.129 0.320 0.385 0.215 0.264 0.297 0.342 0.362 0.193 0.285
20120.294 0.134 0.354 0.392 0.237 0.285 0.293 0.375 0.375 0.222 0.296
20130.327 0.143 0.368 0.396 0.252 0.295 0.318 0.402 0.379 0.220 0.293
20140.364 0.168 0.392 0.430 0.265 0.315 0.314 0.410 0.381 0.229 0.289
20150.362 0.184 0.461 0.449 0.294 0.334 0.348 0.439 0.428 0.254 0.295
20160.349 0.198 0.410 0.445 0.304 0.349 0.354 0.450 0.464 0.260 0.297
20170.375 0.248 0.403 0.446 0.334 0.353 0.373 0.481 0.474 0.277 0.301
20180.377 0.257 0.395 0.431 0.344 0.365 0.388 0.467 0.472 0.282 0.310
20190.391 0.309 0.403 0.452 0.343 0.370 0.387 0.439 0.500 0.286 0.332
20200.390 0.312 0.403 0.450 0.388 0.378 0.392 0.491 0.475 0.312 0.335
20210.426 0.313 0.371 0.488 0.406 0.380 0.391 0.503 0.498 0.319 0.343
Table 7. Criteria for the level of MNQPFs. Source: Classification based on location quotient index.
TypeAreaCriterion
Highly developed areasGuangdong, Shandong, Liaoning, Shanghai M N Q P F s 0.3
Moderately developed areasFujian, Zhejiang, Jiangsu, Tianjin, Hainan 0.25 M N Q P F s < 0.3
Less developed areasGuangxi, Hebei M N Q P F s < 0.25
Table 8. Benchmark regression results. Source: Calculated by the authors using Stata18.
(1)(2)(3)(4)
VariablesMERMER1MER2MER3
MNQPFs0.041 **0.180 ***0.0170.324 **
(2.18)(2.83)(0.60)(2.58)
open0.020 ***−0.0190.0130.088 **
(2.97)(−0.86)(1.35)(2.02)
mar0.046 ***0.520 ***−0.0020.161
(2.70)(9.06)(−0.08)(1.42)
gov−0.010−0.252 ***−0.061 ***−0.295 ***
(−0.67)(−4.87)(−2.81)(−2.88)
inter−0.0120.528 ***0.091 ***0.332 **
(−0.64)(8.17)(3.68)(2.60)
Constant−1.484 ***−7.801 ***−1.097 ***−5.616 ***
(−8.77)(−13.79)(−4.55)(−5.02)
Observations165165165165
Area FEYESYESYESYES
Year FEYESYESYESYES
Note: ** and *** mean significant at 5%, and 1% level, respectively; t-statistics in parentheses.
Table 9. Results of tests to exclude unobservable factors. Source: Calculated by the authors using Stata.
(1)(2)(3)(4)
VariablesMERMER1MER2MER3
MNQPFs0.040 ***0.319 ***0.0100.244 **
(2.68)(5.20)(0.43)(2.16)
Constant−1.322 ***−4.651 ***−0.808 **−4.903 ***
(−5.90)(−8.05)(−2.70)(−3.04)
ControlsYESYESYESYES
Observations165165165165
Area FEYESYESYESYES
Year FEYESYESYESYES
Area×YearYESYESYESYES
Note: ** and *** mean significant at 5%, and 1% level, respectively; t-statistics in parentheses.
Table 10. Test results for replacing control variables. Source: Calculated by the authors using Stata.
(1)(2)(3)(4)
VariablesMERMER1MER2MER3
MNQPFs0.050 **0.182 ***0.0090.481 ***
(2.56)(2.86)(0.34)(4.17)
Re-open0.0020.0500.066 ***0.543 ***
(0.10)(0.94)(2.93)(5.57)
mar0.068 ***0.501 ***−0.0300.281 ***
(4.22)(9.63)(−1.38)(2.98)
gov−0.000−0.262 ***−0.054 **−0.253 ***
(−0.01)(−5.20)(−2.53)(−2.77)
inter−0.0020.488 ***0.063 **0.074
(−0.07)(6.93)(2.12)(0.58)
Constant−1.392 ***−7.768 ***−0.553 **−3.948 ***
(−7.90)(−13.60)(−2.30)(−3.82)
Observations165165165165
Area FEYESYESYESYES
Year FEYESYESYESYES
Note: ** and *** mean significant at 5%, and 1% level, respectively; t-statistics in parentheses.
Table 11. Robustness test results. Source: Calculated by the authors using Stata.
(1)(2)(3)(4)
VariablesMERMER1MER2MER3
L.MNQPFs0.0898 **0.364 ***0.0761 *0.988 ***
(2.31)(3.59)(1.67)(4.46)
ControlsYESYESYESYES
Constant−1.185 ***−6.601 ***−1.262 ***−0.915
(−6.21)(−13.25)(−4.00)(−0.87)
Observations154154154154
Area FEYESYESYESYES
Year FEYESYESYESYES
Note: *, **, and *** mean significant at 10%, 5%, and 1% level, respectively; t-statistics in parentheses.
Table 12. Heterogeneity analysis. Source: Calculated by the authors using Stata.
(1)(2)
VariablesDevedDeving
MNQPFs0.0549 *0.0575 ***
(1.95)(4.27)
ControlsYESYES
Constant−1.386 ***−1.095 ***
(−9.78)(−6.33)
Observations10560
Area FEYESYES
Year FEYESYES
Note: * and *** mean significant at 10% and 1% level, respectively; t-statistics in parentheses.
Disclaimer/Publisher’s Note: The statements, opinions and data contained in all publications are solely those of the individual author(s) and contributor(s) and not of MDPI and/or the editor(s). MDPI and/or the editor(s) disclaim responsibility for any injury to people or property resulting from any ideas, methods, instructions or products referred to in the content.

