Article

Litter and Pruning Biomass in Mango Orchards: Quantification and Nutrient Analysis

1
Department of Agriculture and Fisheries, Berrimah Farm Science Precinct, GPO Box 3000, Darwin, NT 0801, Australia
2
Auckland Council, Private Bag 92300, Victoria Street West, Auckland 1142, New Zealand
3
Centre for Agriculture and Bioeconomy (CAB), Queensland University of Technology, Brisbane, QLD 4000, Australia
*
Author to whom correspondence should be addressed.
These authors contributed equally to this work.
Sustainability 2025, 17(10), 4452; https://doi.org/10.3390/su17104452
Submission received: 31 March 2025 / Revised: 7 May 2025 / Accepted: 12 May 2025 / Published: 14 May 2025
(This article belongs to the Special Issue Sustainable Management: Plant, Biodiversity and Ecosystem)

Abstract

:
Litter and pruning biomass are integral to nutrient cycling in the plant–soil ecosystem, contributing significantly to organic matter formation and humus development through decomposition and nutrient mineralization, which ultimately influence soil fertility and health. However, the litterfall dynamics in mango orchards are not well understood, and its contribution to nutrient cycling has seldom been measured. This study aimed to estimate litterfall and pruning biomass in mango orchards and assess the nutrient contents of various biomass components. Litter and pruning biomass samples were collected from four commercial mango orchards planted with Kensington Pride (‘KP’) and ‘B74’ (‘Calypso®’) cultivars in the Darwin and Katherine regions, using litter traps placed on the orchard floors. Samples were sorted (leaves, flowers, panicles, fruits, and branches) and analyzed for nutrient contents. Results showed that most biomass abscissions occurred between late June and August, spanning approximately 100 days involving floral induction phase, fruit set, and maturity. Leaves made up most of the abscised litter biomass, while branches were the primary component of pruning biomass. The overall ranking of biomass across both regions and orchards is as follows: leaves > branches > panicles > flowers > fruits. The carbon–nitrogen (C:N) ratio of litter pruning material ranged from 30 (flowers) to 139 (branches). On a hectare basis, litter and biomass inputs contained 1.2 t carbon (C), 21.2 kg nitrogen (N), 0.80 kg phosphorus (P), 4.9 kg potassium (K), 8.7 kg calcium (Ca), 2.0 kg magnesium (Mg), 1.1 kg sulfur (S), 15 g boron (B), 13.6 g copper (Cu), 99.3 g iron (Fe), 78.6 g manganese (Mn), and 28.6 g zinc (Zn). The results indicate that annual litterfall may contribute substantially to plant nutrient supply and soil health when incorporated into the soil to undergo decomposition. This study contributes to a better understanding of litter biomass, nutrient sources, and nutrient cycling in tropical mango production systems, offering insights that support accurate nutrient budgeting and help prevent over-fertilization. However, further research is needed to examine biomass accumulation under different pruning regimes, decomposition dynamics, microbial interactions, and broader ecological effects to understand litterfall’s role in promoting plant growth, enhancing soil health, and supporting sustainable mango production.

1. Introduction

Climate change poses significant challenges to global agriculture production, threatening crop yields, farmers’ livelihoods, and food security [1,2]. Land degradation exacerbates the negative impacts of climate change, increasing vulnerability and reducing adaptation effectiveness [3]. To address these challenges, research efforts must emphasize the need for innovative strategies and policies should enhance agricultural resilience and sustainability [4].
Sustainable agriculture plays a critical role in addressing broader environmental, economic, and social challenges, including climate change, biodiversity loss, and rural poverty, while promoting equitable development and social well-being. It involves developing systems that are both resilient, enabling them to withstand shocks and stress, and persistent, ensuring their long-term viability for future generations. It encompasses the need for sustainable agricultural practices that balance the goal of maximizing food production with the protection of natural resources, ensuring minimal negative environmental impacts [5,6].
Fruit crops are vital components of sustainable production systems as they offer a wide range of benefits by supplying food, timber, and fuel, while boosting farmers’ incomes. As C sinks, they also play a key role in reducing the impacts of climate change [7,8]. Among fruit crops, mango (Mangifera indica L.) is the second-largest tropical fruit produced worldwide and the fourth in total amount of fruit consumed because of its special flavor and taste [9]. Mango production is a profitable horticultural enterprise, with studies demonstrating its economic viability in India [10], Bangladesh [11], Africa [12], Mexico [13], South Florida [14], Southern Italy [15], and Australia [16]. Moreover, mango exports play a significant role in the economic development of producing countries, with reduced trade barriers potentially enhancing both production and market expansion [17]. Beyond its economic value, mango is also nutritionally rich, providing essential minerals and bioactive compounds that offer various health benefits [18].
In Australia, mango was introduced in the early 19th century and is now a significant part of the horticultural industry [19]. Mango plantations are established in a wide range of climatic and soil conditions in northern New South Wales, Western Australia, Queensland, and in the Northern Territory (NT) [20]. Mango farmers in the NT supply the first fruits to the Australian market, contributing around AUD128 million to the NT’s economy and create jobs for more than 3500 individuals [21]. However, mango trees in the NT are planted in savannah areas where soils have low fertility due to their very low organic matter content and water-holding capacity. The low C levels in these light-textured soils result from oxidation during prolonged dry periods, making them prone to erosion regardless of land management practices. Additionally, their leaching, low fertility, and high permeability enhance nitrate and phosphate movement, potentially increasing the risk of acidification due to the loss of basic cations [22,23]. Thus, conservation measures are necessary to ameliorate these soil fertility problems by increasing the quality and accessibility of organic matter and enhancing nutrient recycling in the ecosystem [24].
Understanding nutrient cycling is crucial in agricultural ecosystems for sustainable practices that balance global crop yield demands while preventing under- or over-fertilization and preserving the environment. It ensures the long-term productivity, resilience, and ecological integrity of agricultural ecosystems [25,26]. In orchards, trees produce a considerable quantity of litterfall, which is an important input for replenishing organic matter and returning nutrients to the soil. Litterfall represents the primary biological pathway for nutrient transfer from the plant to the soil [27,28]. Thus, it is an important pathway for maintaining soil fertility in different land-use systems.
In mango orchards, litter and pruning biomass are key components of litterfall. Litter comes from senescing leaves that drop onto the ground regularly. Senescence is the final phase in the development of a leaf and serves as an adaptive strategy for plants to manage stress and adjust to various environmental conditions [29]. During senescence, most nutrients are also recycled back to the plant to support both current and future growth [30]. This nutrient recycling through resorption is a crucial resource conservation strategy for mangoes in the NT, where soil fertility is low [31]. Moreover, pruning is performed annually to maintain the canopy shape and promote new growth, which supports the next crop of fruit and sustains high yields and optimum fruit quality [32]. The pruned material is usually slashed into smaller pieces and left as mulch, joining the litter on the orchard floor.
However, our understanding of litterfall dynamics in the mango ecosystem remains limited and its role has rarely been quantified experimentally [33]. The timing, volume, and nutrient content of fallen and pruned material, and the rates of decomposition of that material in local conditions have not been quantified for mangoes growing in the wet–dry tropics of the NT. Therefore, the amount of nutrients circulating within the orchard as plant residues transition from living biomass to dead organic matter remains unknown.
As part of the More Profit from Nitrogen Program on mangoes that aimed at quantifying the N dynamics under NT conditions, the following questions were posed: (1) What amount of litter and pruned material is cycling annually? (2) When does it accumulate, and in what form? (3) How much C, N, and other nutrients from this material are cycling within orchards annually? The objective of this study was to quantify litterfall and pruning biomass in mango orchards and analyze its nutrient content to evaluate its potential contribution to soil nutrient cycling. Our hypothesis is that mango orchards provide a substantial amount of nutrients, which can help alleviate the low soil fertility and health of the mango orchard in the NT.

2. Materials and Methods

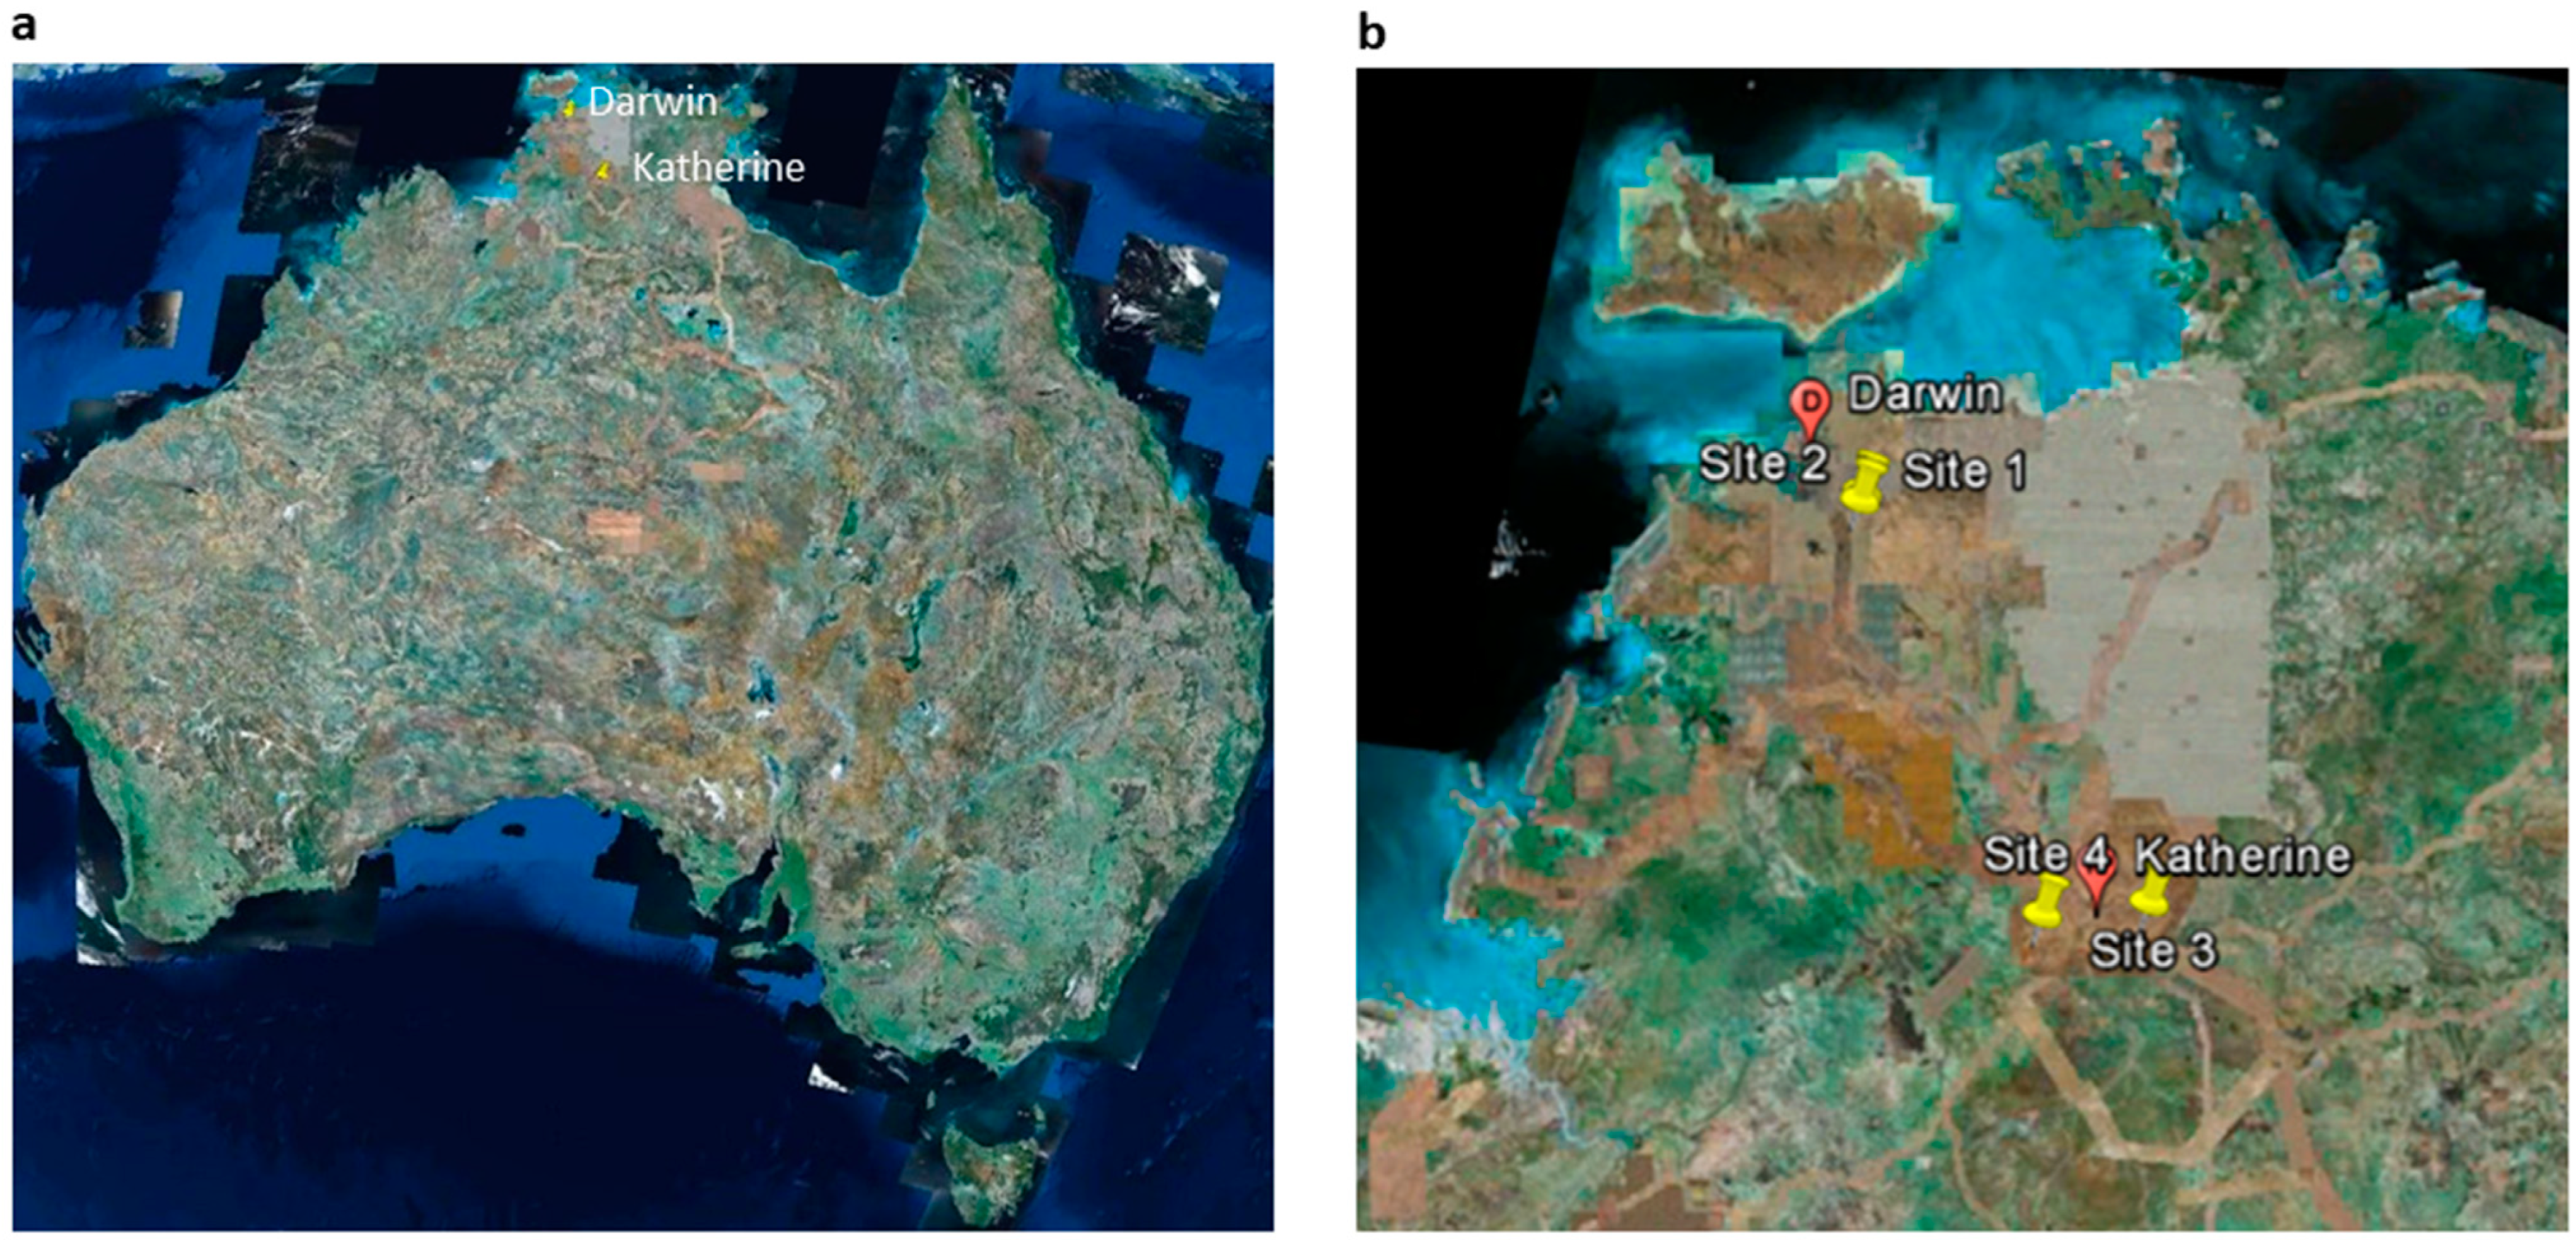
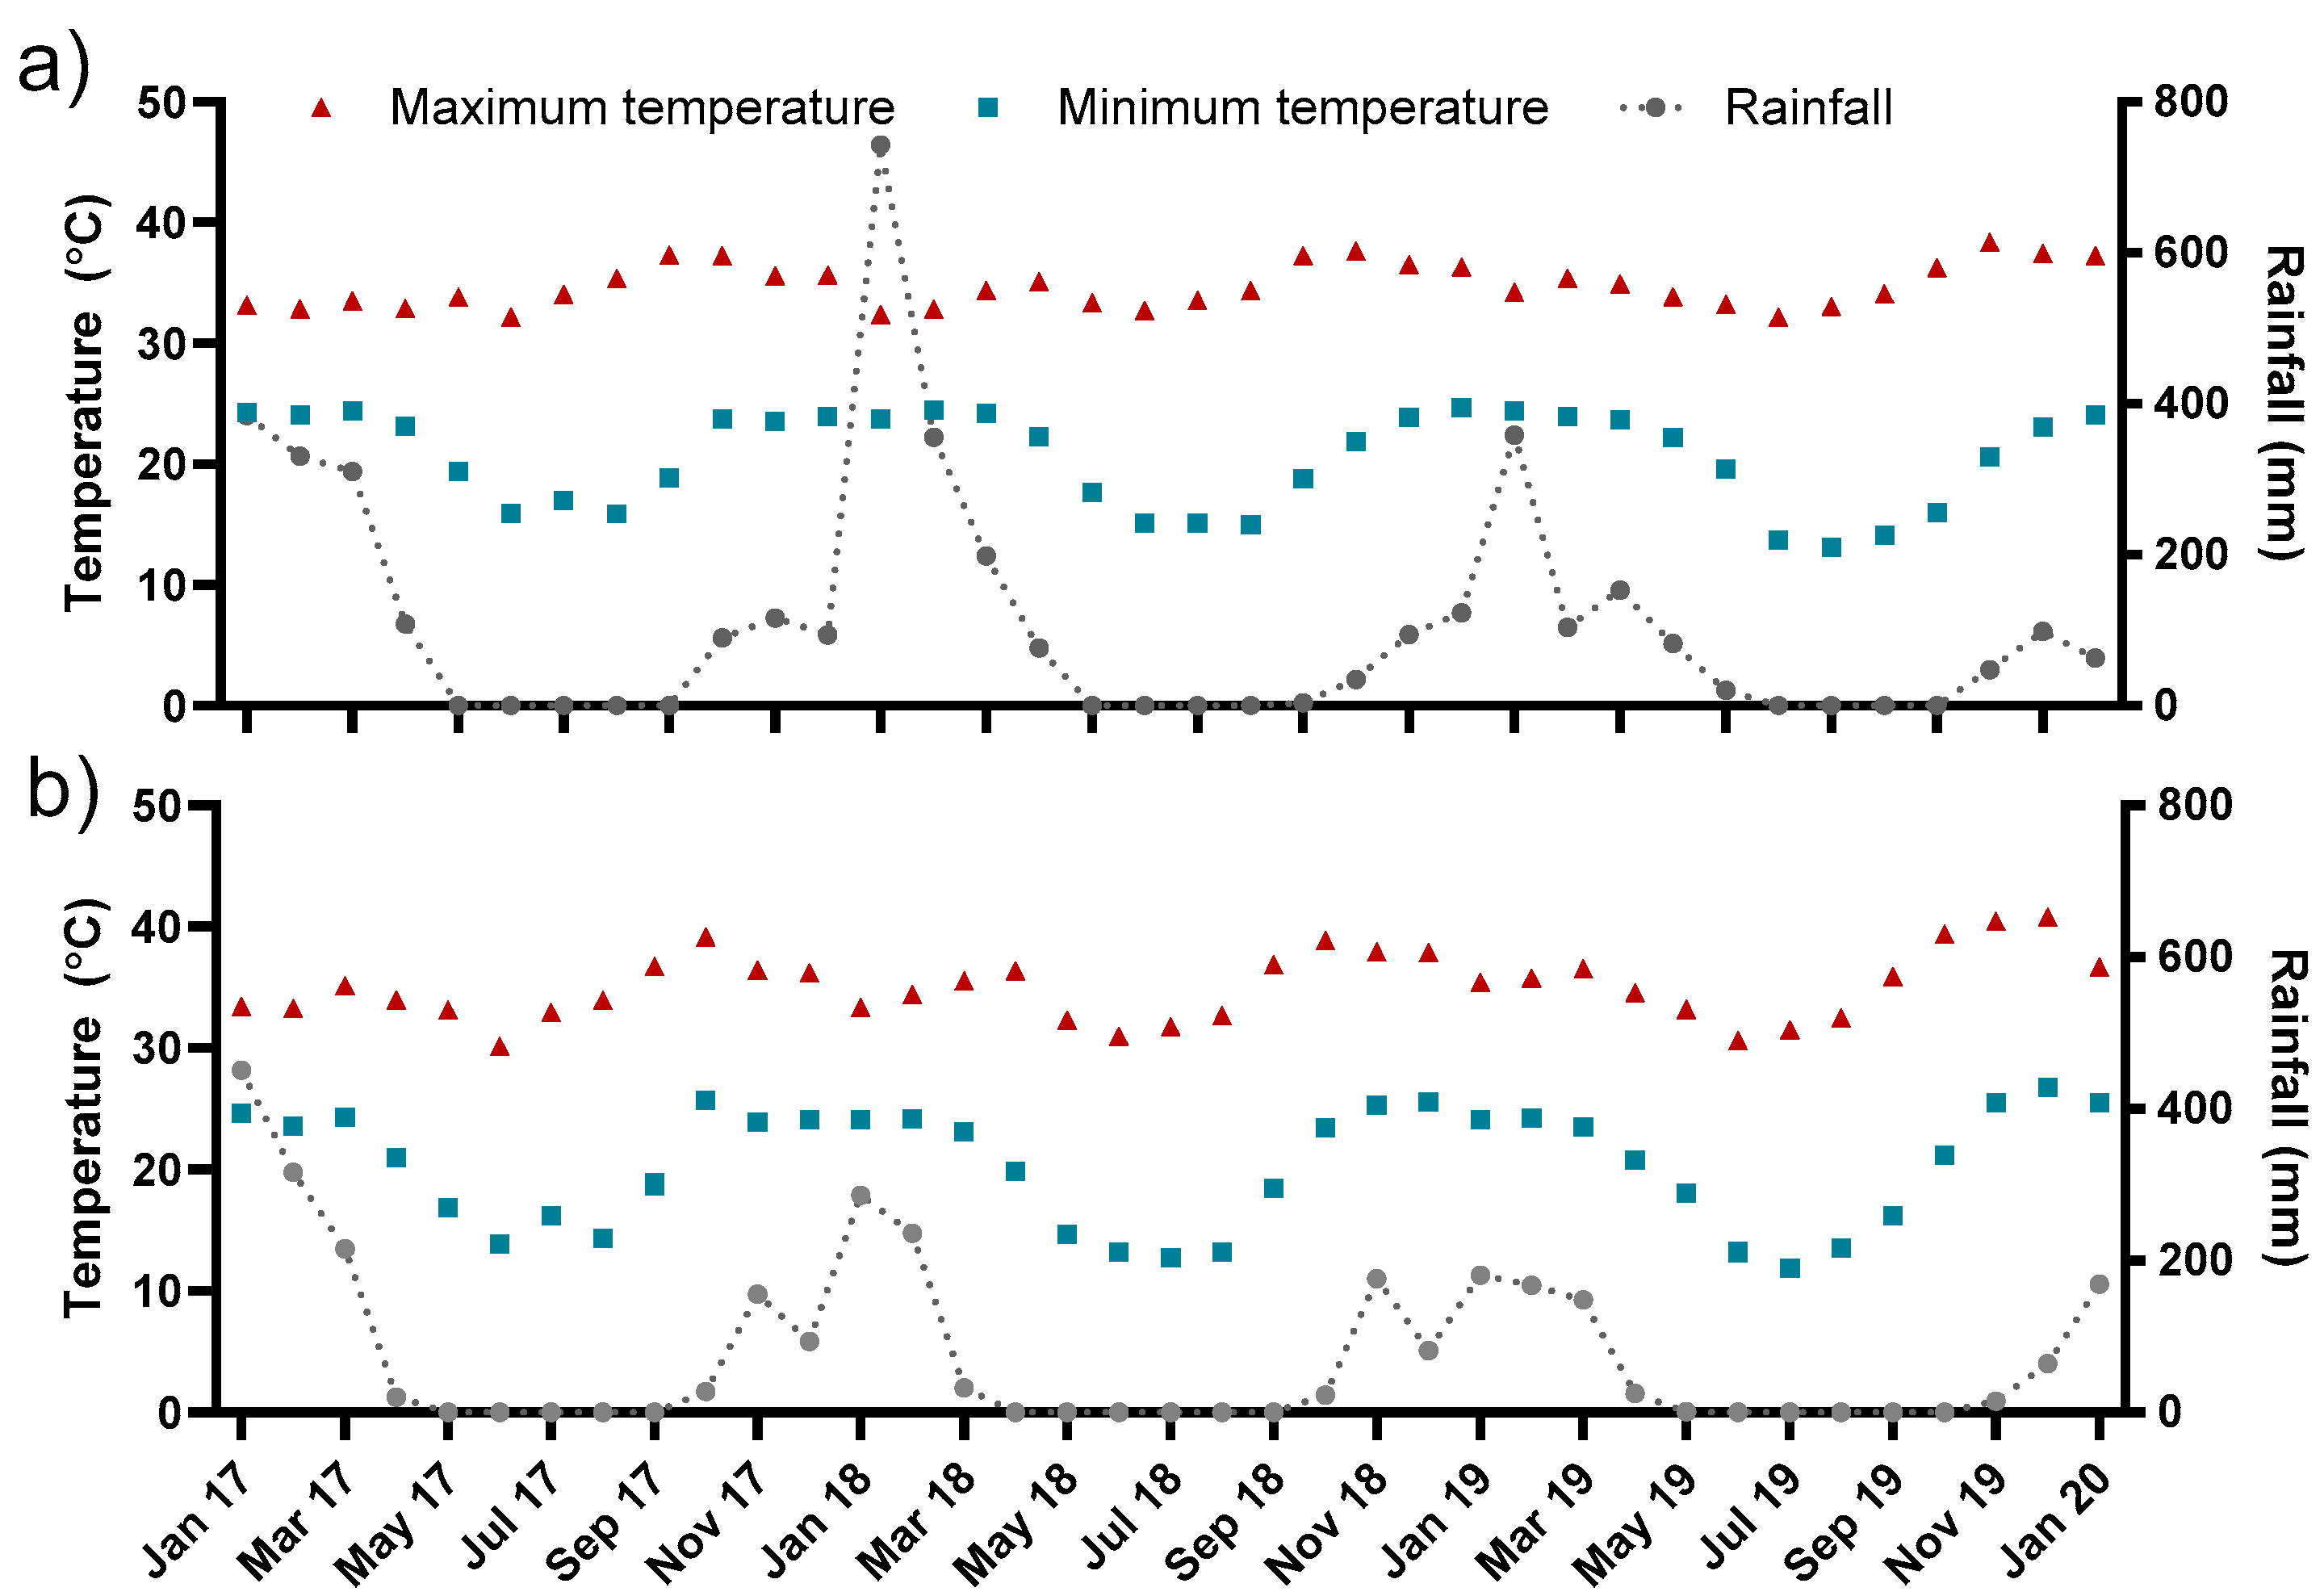
2.1. Experimental Sites

The study was carried out on four commercial mango orchards in the wet–dry tropics of Northern Australia, consisting of two orchards (12°47′28.07″ S 131°09′30.67″ E and 12°44′52.80″ S 131°10′38.97″ E) in the Darwin region during the 2017–2018 cropping season and two orchards (14°32′24.90″ S 132°28′06.20″ E and 14°35′05.80″ S 132°23′33.22″ E) in the Katherine region during the 2018–2019 cropping season (Figure 1).
In both regions, ‘KP’ and ‘B74’ mango orchards were selected because they are the main mango cultivars in the NT, accounting for approximately 60% and 12% of production, respectively [35]. The ‘KP’ mango is a polyembryonic variety characterized by high vigor and an irregular bearing pattern, whereas ‘B74’ is a monoembryonic variety with consistent bearing and medium vigor [36]. Orchards were chosen based on the growers’ willingness to provide experimental trees for the trials. In Darwin, the ‘KP’ trees were 16 years old and planted at a density of 120 trees per hectare, while the ‘B74’ trees were 14 years old and planted at 250 trees per hectare. In Katherine, the ‘KP’ trees were 18 years old and planted at 140 trees per hectare, while the ‘B74’ trees were 8 years old and planted at 300 trees per hectare. Pruning in commercial mango orchards in Australia typically occurs immediately after harvest. At the study sites, both Darwin orchards were pruned in November, directly after harvest. In Katherine, the ‘KP’ orchard was pruned shortly after harvest in February, whereas the ‘B74’ orchard was uncharacteristically pruned later in the season in April.
All orchards were located on Tippera Red Kandosol soils [37]. Both Darwin and Katherin regions have distinct wet and dry seasons. They are prone to intense rainfall and flooding during the wet season. In Darwin, the temperature typically varies from 20 °C to 33 °C and is rarely below 17 °C or above 35 °C, with a minimum humidity of 30% during the dry season. In Katherine, the temperature ranges from 14 °C to 37 °C and is rarely below 10 °C or above 40 °C, and humidity in the dry season is typically less than 10%. Mean annual rainfall ranges from 1724 mm in the Darwin region and 1009 mm in the Katherine region, with the most rain occurring during the distinct November–April wet season (Figure 2).

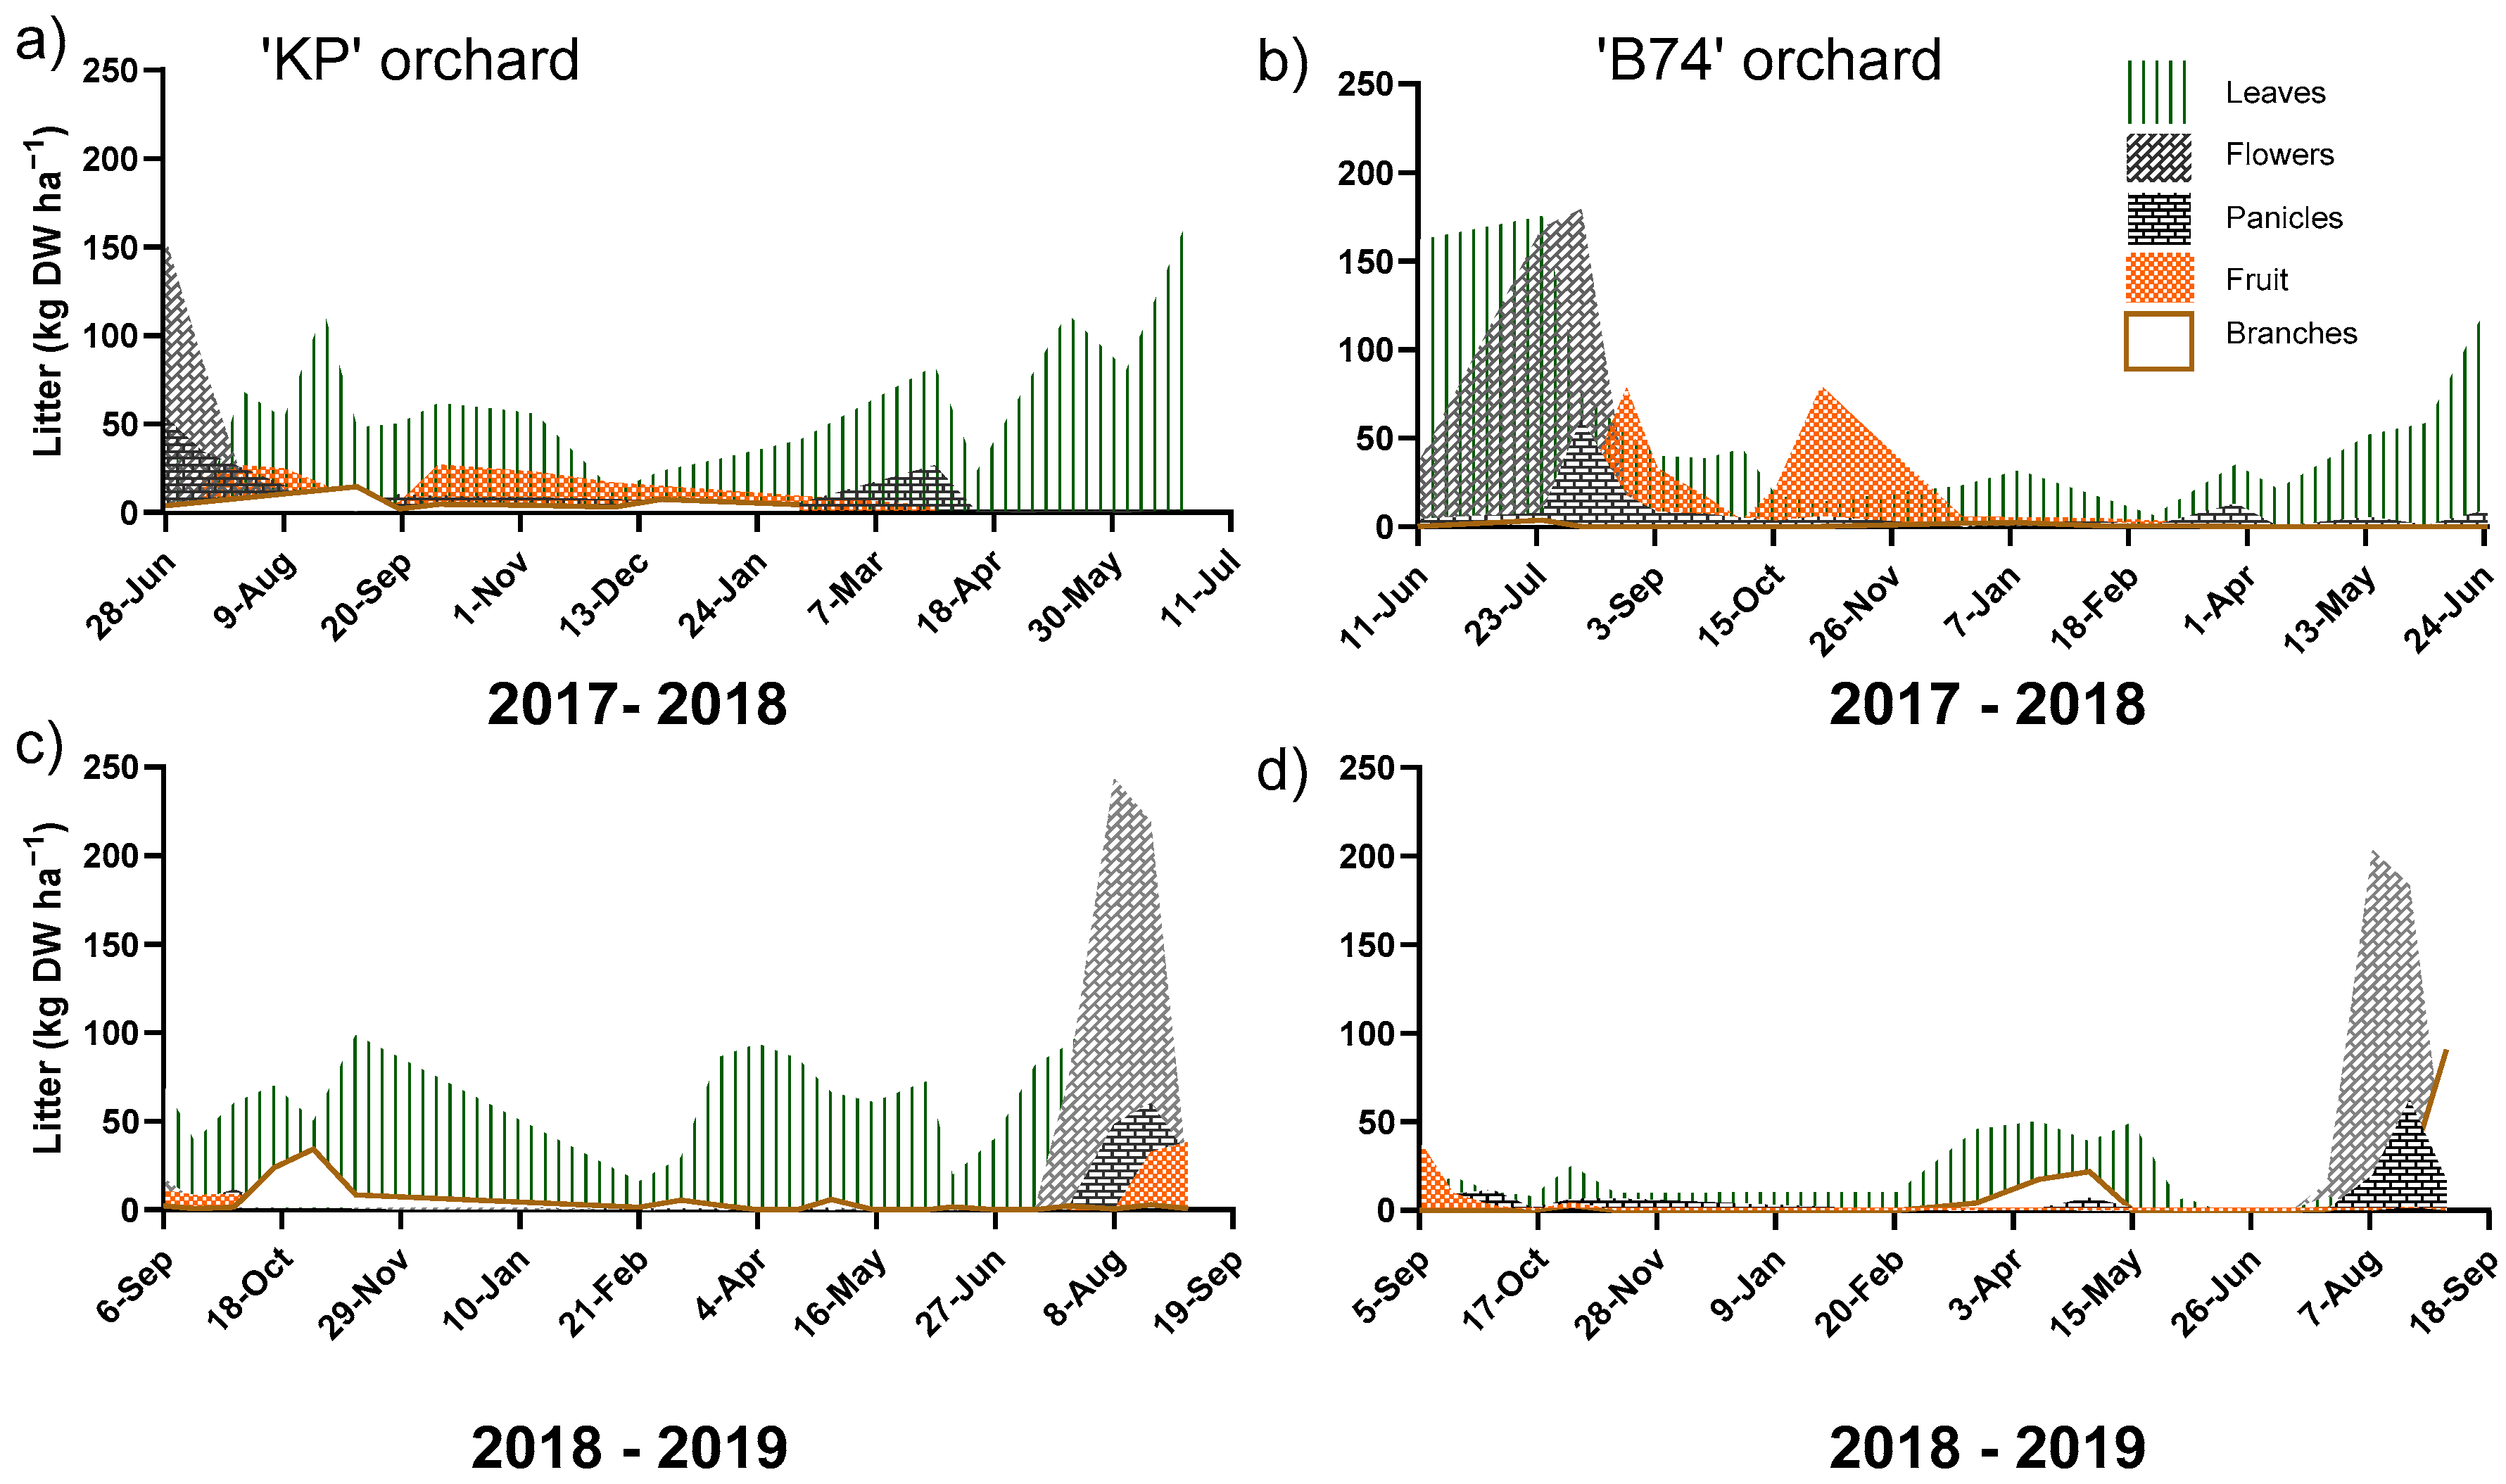
2.2. Litter and Pruning Biomass Collection

Annual litter drop and pruned material was collected from June 2017 to May 2018 in the Darwin region, and from September 2018 to August 2019 in the Katherine region. Litterfall was collected using litter trap technique [39,40,41] but with a bigger area (1 m × 5 m) and 10 litter traps per orchard instead of five traps [42]. Litter traps were constructed using flexible fiberglass flyscreen mesh, metal droppers, and twine. In each orchard, litter traps were set up in an east–west orientation and extending from the trunk to just 0.5 m wide past the drip line of each tree, which were randomly selected across orchard rows. For pruned material, 10 tarpaulins (1.2 m × 5 m) were placed on the ground at the trunk or stem of the tree and extended 0.5 m past the drip line to catch materials, as trees were machine-pruned.
Tree canopy spreads and the tarpaulin collection area were measured prior to pruning and used to calculate the quantity of pruning on a tree basis as litter. Litter collection area or under-canopy area was measured for each tree.
The amount of litter (LW) was calculated using the following formula:
LW   ( kg   tree 1 ) = L C T L T A × T C A
where LCT is the litter dry weight (kg) collected from the trap, LTA is the litter trap area (m2), and TCA is the tree canopy area (m2). TCA was computed using the following formula, π × ( 1 2 TD)2, where TD is the diameter of the tree, which was computed using the following formula:
TD = W 1 + W 2 2
where W1 is the widest width of the crown measured across the row from drip line to drip line and W2 is the widest width of the crown measured along the row from drip line to drip line.
Litterfall was collected weekly to ensure minimal losses or decomposition within the traps. The collected material was sorted into leaves, flowers, panicles, fruits, and branches. Samples were washed and rinsed in Millipore-filtered water, then oven-dried at 50 °C. Dry weights were recorded, subsampled, and ground using a ring mill (ROCKLABS, Dunedin, New Zealand) [43], except for woody material where they were pulverized first using a Retsch SK1 mill (Retsch GmbH, Haan, Germany) [44] before being finely ground in a ring mill.

2.3. Sample Processing and Nutrient Analysis

Total C and N content were analyzed from litter components (leaves, flowers, panicles, fruits, and branches) with samples bulked at active growth, quiescence, flowering, and fruit development to ensure enough material for analysis at different phenological stages of the tree across all orchards [45]. For the total content of other nutrients (P, K, Ca, Mg, S, B, Cu, Fe, Mn, and Zn), analysis was performed only on the bulk sample for litter and pruning biomass.
Total C and N were determined using Dumas dry combustion (CNS928, LECO Corporation, St. Joseph, MI, USA) and other nutrient analyses using ICP-MS (Agilent 8800, Tokyo, Japan) at the Central Analytical Research Facility at Queensland University of Technology [46,47]. The nutrient content was calculated by multiplying the nutrient concentration (%) by the amount of litter per hectare, which was then normalized to 250 trees per hectare. This normalization aligns with current mango industry standards in the NT, where production systems are shifting from low-density (120 trees per hectare) to higher-density systems (250 or more trees per hectare), with trees pruned annually and cultivated in a hedge-like structure.

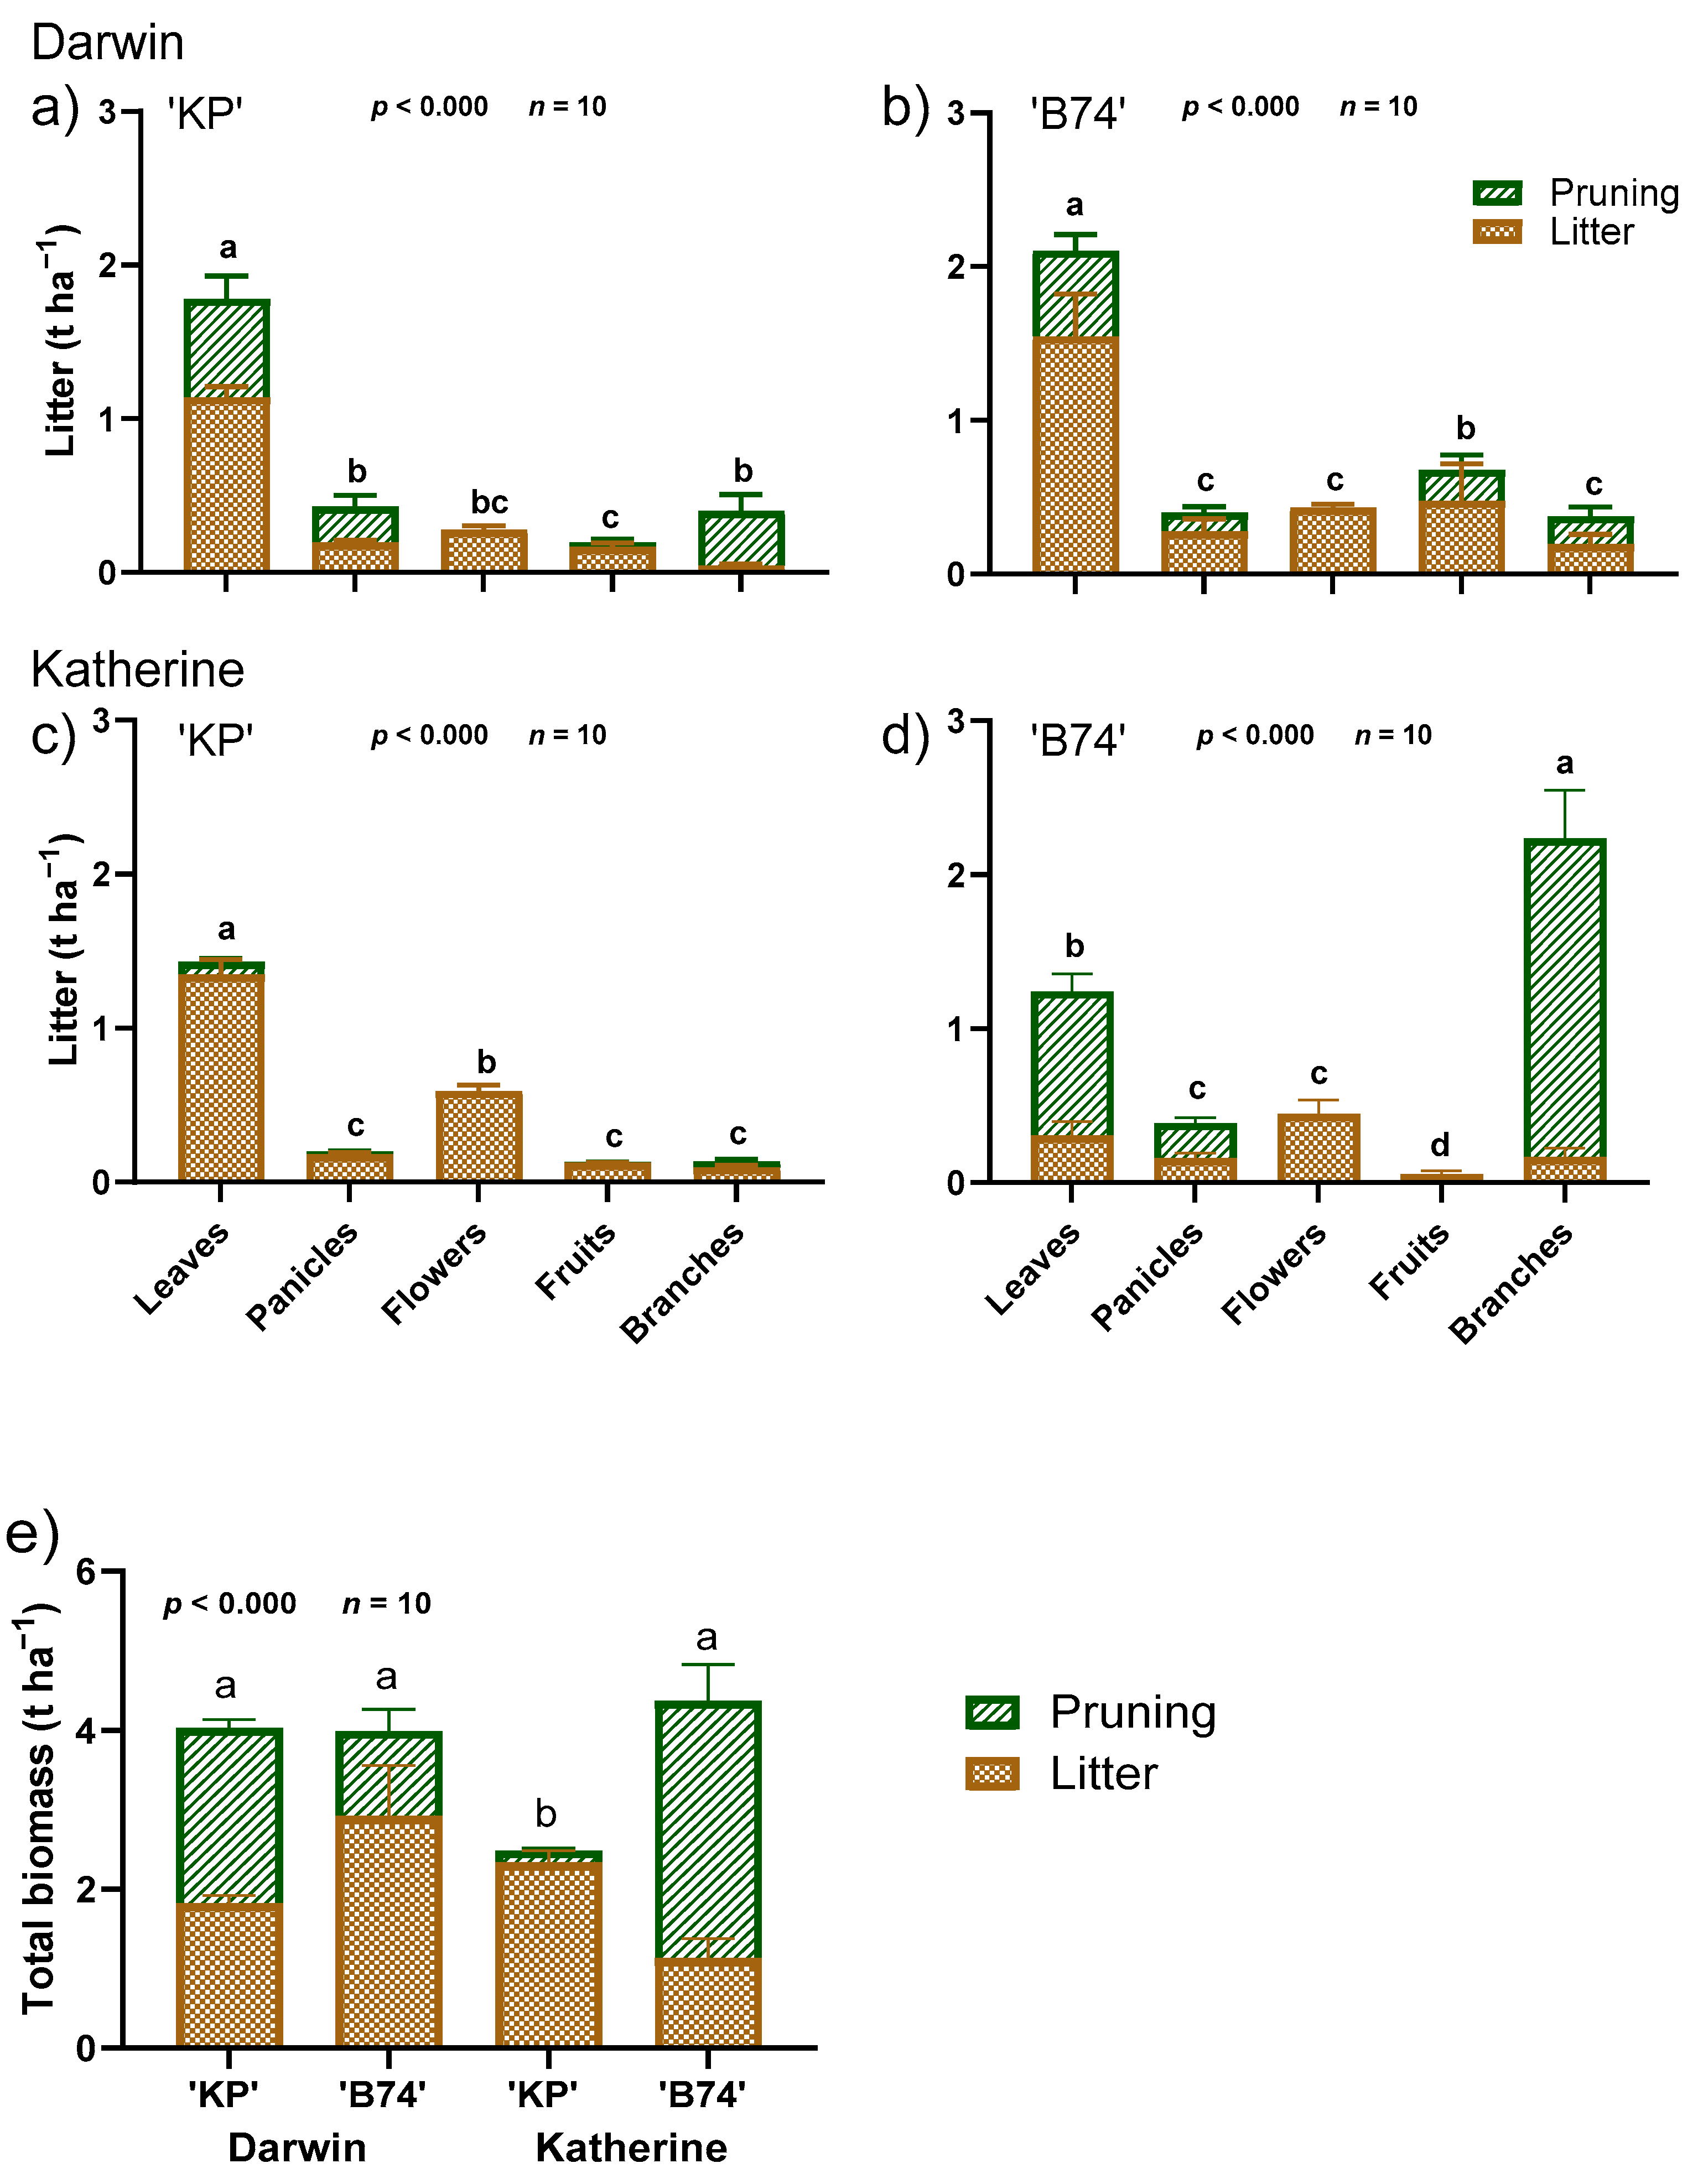
2.4. Statistical Analysis
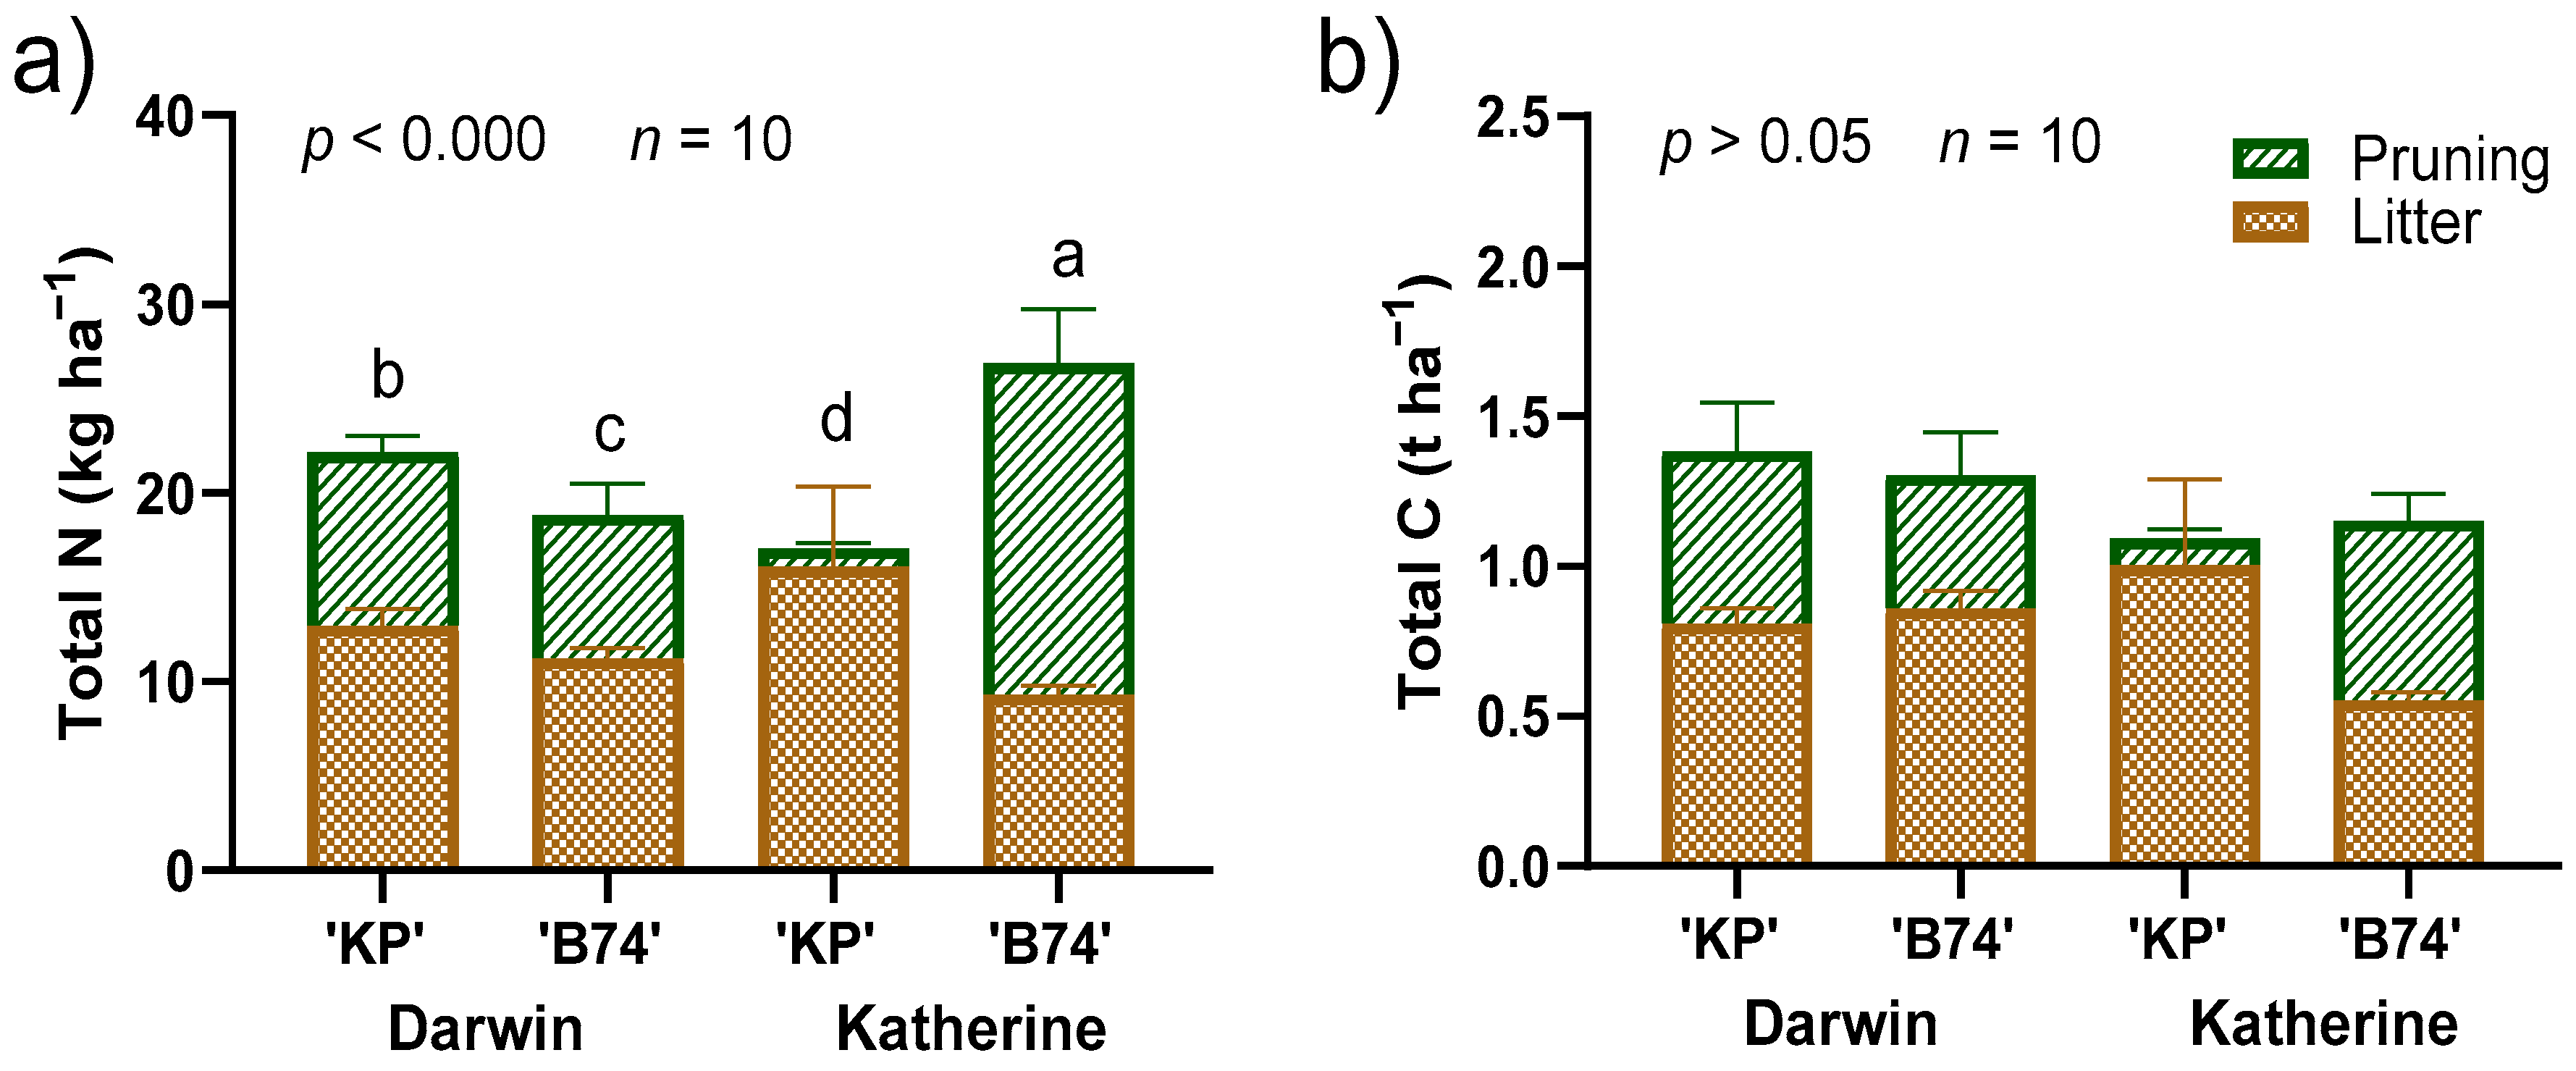
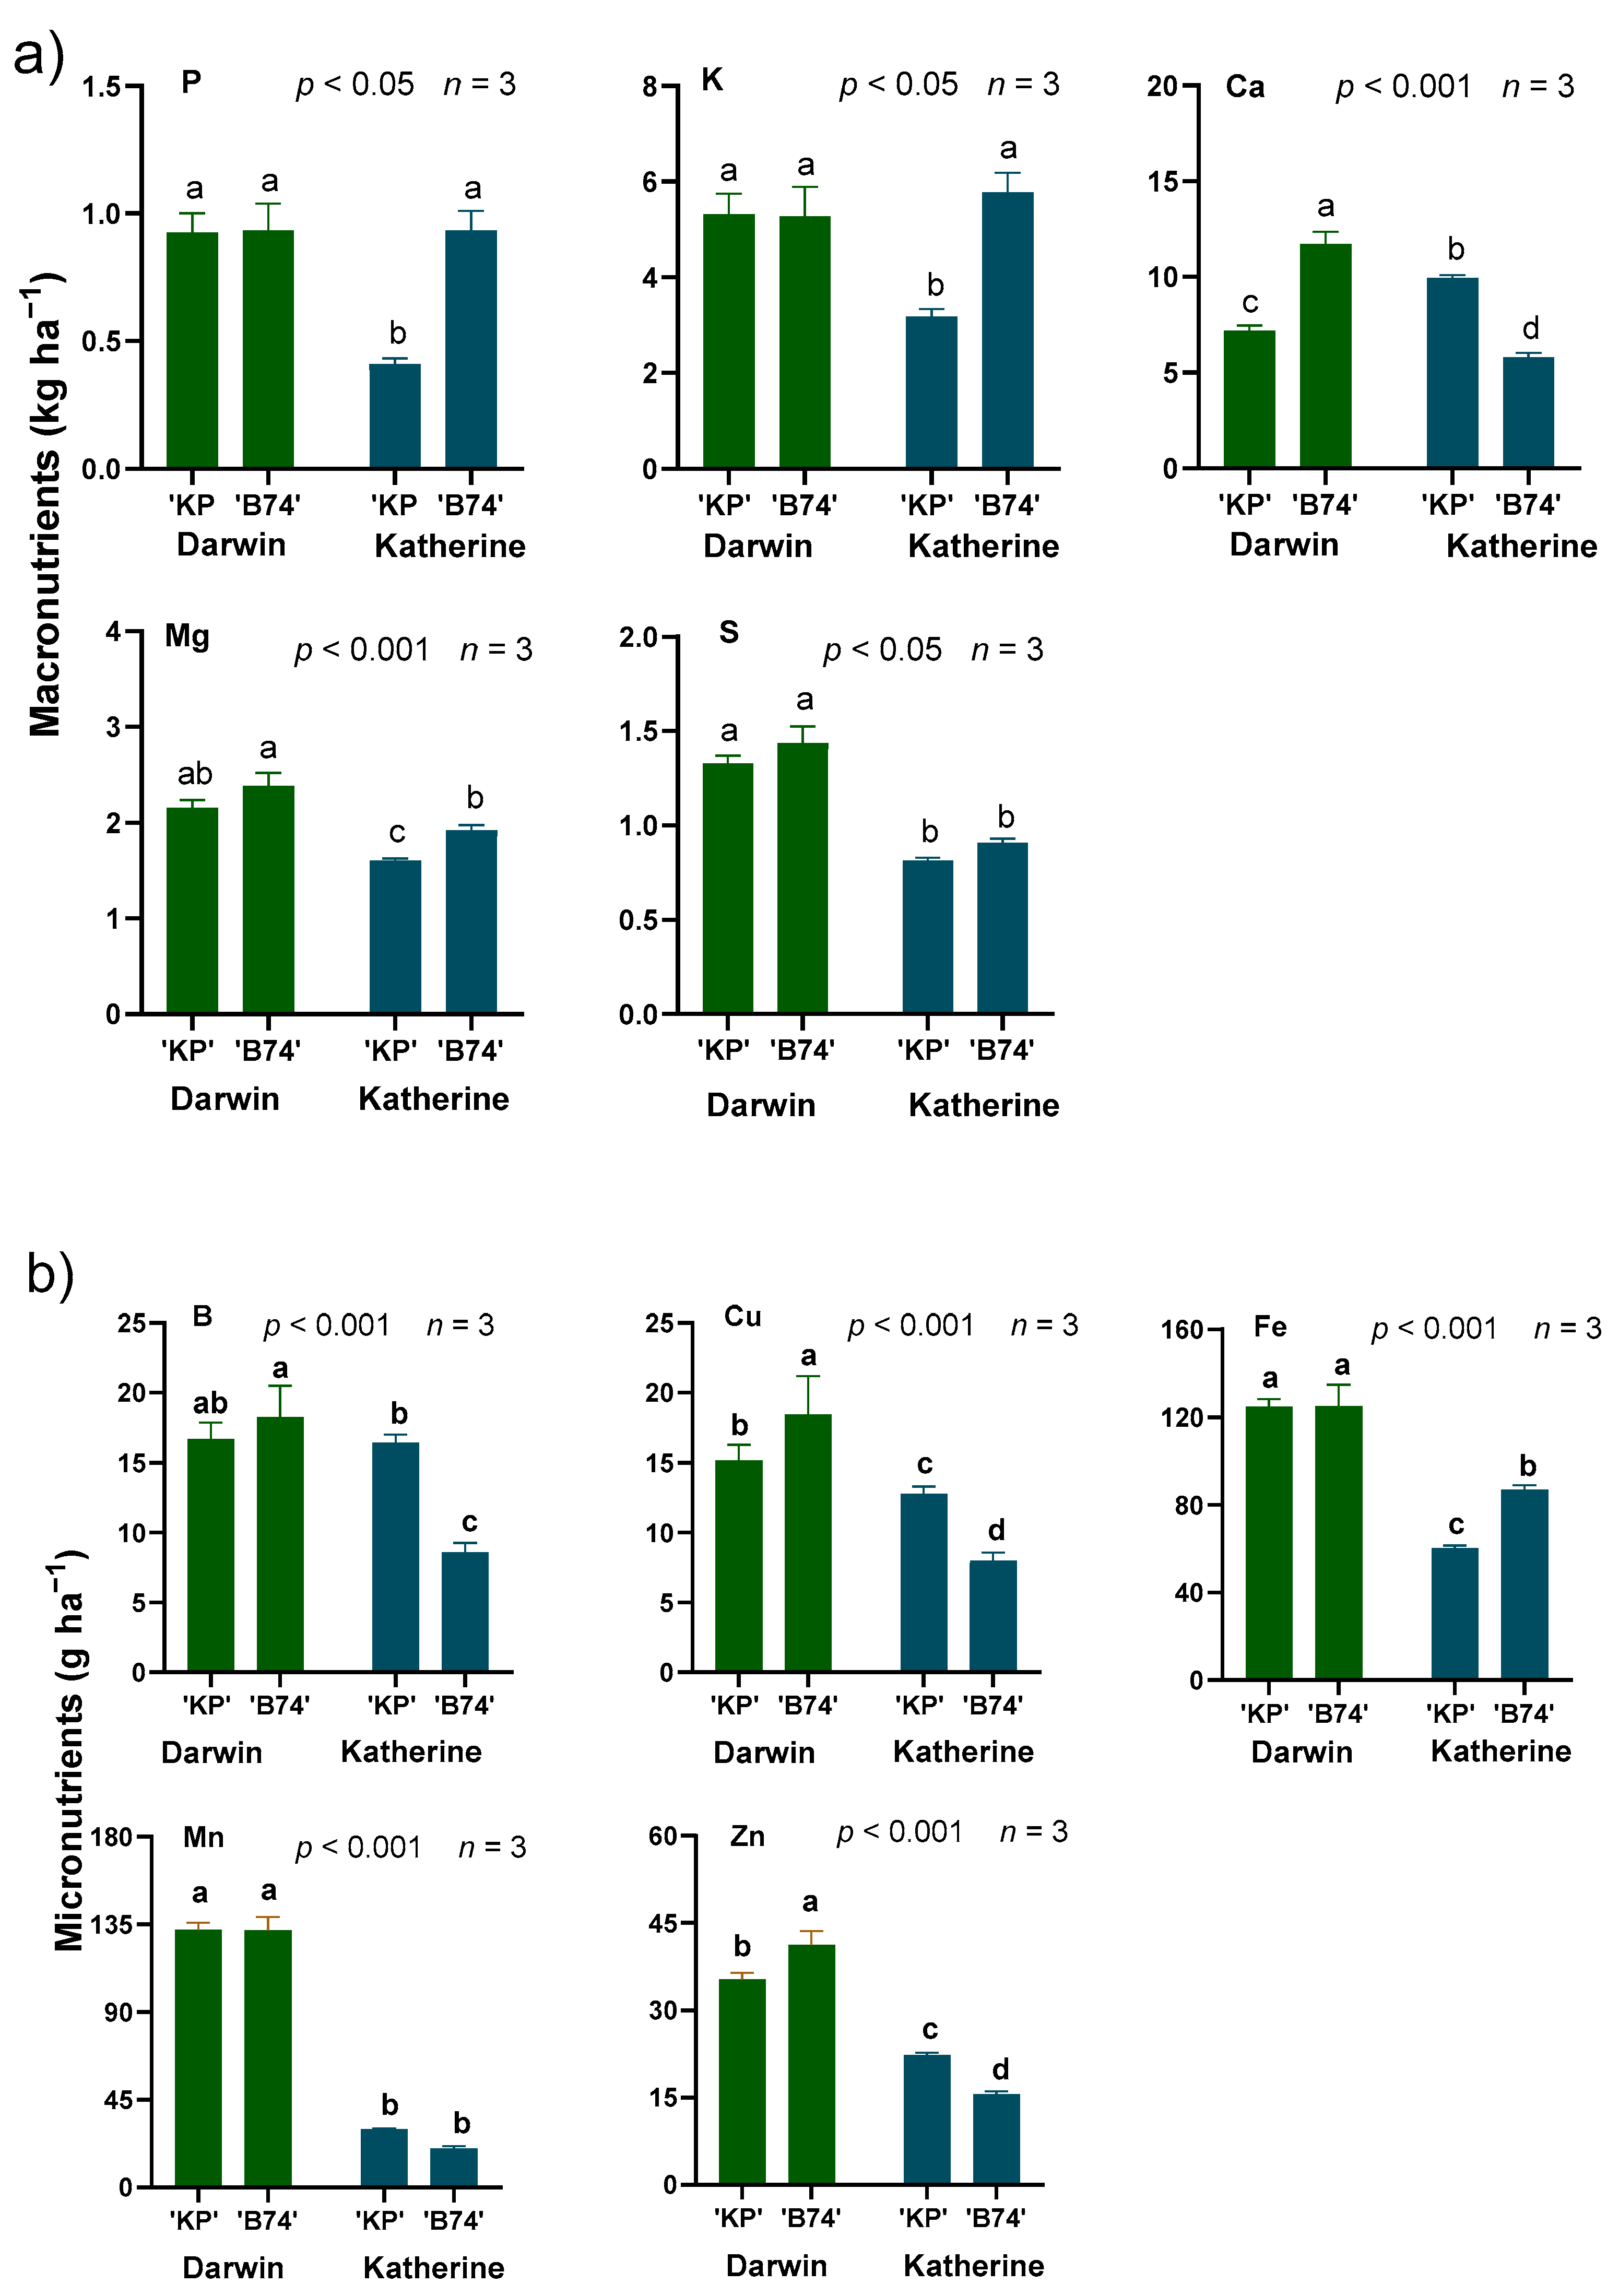
Data were subjected to ANOVA using IRRI’s STAR software version 2.0.1 (Los Baños, Laguna, Philippines) [48], and treatment means were compared using Fisher’s Least Significant Difference test at the 5% level of significance (LSD0.05). Normality and homogeneity of variances were checked using Shapiro–Wilk’s test and Bartlett’s test, respectively. Data visualization was conducted using GraphPad Prism version 10.0.0 software [49].

3. Results

Figure 3 illustrates the dynamics of litter collected over the course of one year in mango orchards located in the Darwin (Figure 3a,b) and Katherine (Figure 3c,d) regions. Most biomass abscission occurred during the floral induction phase and during fruit set to maturity, spanning approximately 100 days. Leaf litter made up the largest component of litter deposited with higher rates of deposition generally observed throughout the dry season across both sites, higher cumulative rates of deposition were observed in ‘KP’ orchard compared to ‘B74’ orchard. The flower biomass in the litter peaked between late June and August in all orchards, contributing an unexpectedly high amount (~150–200 kg ha−1) to the total dry weight of litter during this period. The panicle component of the litter also showed a distinct trend, with panicles primarily dropping during fruit set and reaching a peak of 50 kg ha−1 across all orchards. Immature fruit drop showed variability between the orchards. In the Darwin region, orchards experienced fruit drop ranging 25–50 kg ha−1 during the fruit set period around August–September (Figure 3a,b). A significant quantity of mature fruit remained on the trees and fell as they senesced, contributing to litter biomass during the later months (Figure 3a,b). Moreover, a small amount of branch biomass was collected in all orchards except the Darwin ‘B74’ orchard.
The annual dry weight of the various biomass components in each orchard is shown in Figure 4a–d. The leaf components in both litter and pruning biomass were higher across all orchards, except for the ‘B74’ orchard in the Katherine region (Figure 4d), where branch biomass exceeded that of the leaf components. Additionally, leaf litter biomass was greater than pruning biomass, except in the ‘B74’ orchard in the Katherine region (Figure 4d), where both leaf and branch components were derived from pruning biomass. In the Darwin region, the biomass distribution for litter in the ‘KP’ orchard followed this order: leaves > panicles = branches > flowers > fruits. For the ‘B74’ orchard, it was leaves > fruits > panicles = branches = flowers. In the Katherine region, the biomass distribution for litter in the ‘KP’ orchard was leaves > flowers > panicles = branches = fruits, while in the ‘B74’ orchard, the order was branches > leaves > panicles = flowers > fruits.
Figure 4e shows the annual total dry weights of the litter and pruning materials from orchards in the Darwin region and the Katherine region. Overall, the average amount of biomass from four orchards was 3.7 t ha−1 and ranged from 2.5 t ha−1 to 4.3 t ha−1 with three of four orchards cycling around 4 t ha−1 of plant material over the year when standardized to a planting density of 250 trees ha−1. In the Darwin region, the ‘KP’ and ‘B74’ orchards had similar total biomass. The ‘KP’ orchard recorded 1.8 t ha−1 from abscised materials and 2.2 t ha−1 from pruning biomass. Although the ‘B74’ orchard had a heavier litterfall of 2.9 t ha−1, this was balanced by a lower annual pruned material weight of 1.0 t ha−1. In the Katherine region, the ‘KP’ orchard had lower biomass (2.5 t ha−1) than ‘B74’ orchard (4.3 t ha−1). In the ‘KP’ orchard, the grower performed hedge pruning, cutting all trees back to the previous season’s cuts to maintain a canopy diameter and height of approximately 4–5 m, which resulted in the removal of only 0.15 t ha−1 of pruned material. But a large quantity of abscised litter was collected at the end of the year, totaling 2.3 t ha−1. In contrast, the ‘B74’ orchard underwent a significantly heavier pruning later than usual, during which the dense canopies were also reduced to 4–5 m. This resulted in 3.2 t ha−1 of pruned material, in addition to 1.1 t ha−1 of litter biomass collected over the year.
The total N and C content in litter and pruning biomass differed significantly across orchards in both the Darwin and Katherine regions (Figure 5a). In the Darwin region, total N content in litter and pruned material ranged from 18.6 kg N ha−1 for the ‘B74’ orchard to 22.2 kg N ha−1 for the ‘KP’ orchard, indicating variability in N deposition across orchard types. In the Katherine region, N content varied from 17 kg N ha−1 for the ‘KP’ orchard (Figure 3c) to 26.9 kg N ha−1 for the ‘B74’ orchard, further highlighting the regional and varietal differences in N deposition on the orchard floor.
In contrast, the total C content in litter and pruning material did not exhibit significant variation across orchards (Figure 5b). In the Darwin region, the C content of litter and pruned material was 1.40 t ha−1 for the ‘KP’ orchard and 1.30 t ha−1 for the ‘B74’ orchard, suggesting relatively consistent C content between orchard types. Similarly, in the Katherine region, the C content in the ‘KP’ orchard was 1.10 t ha−1, while the ‘B74’ orchard had 1.20 t ha−1, showing stable C levels between the two orchard types and across regions.
The carbon-to-nitrogen (C:N) ratio showed significant differences among various litter components across four commercial orchards (Figure 6). Abscised flowers, which have high N content, exhibited the lowest C:N ratio, ranging from 30.3 to 40.1. In contrast, higher ratios were observed in leaves (83.5–98.6), panicles (87.8–118.5), and branches (118.1–139.1) across orchards. In the Darwin region, the ranking of C:N ratio was flowers < leaves < panicles < branches. In the Katherine region, the C:N ratio ranking in ‘KP’ orchard was similar to those in Darwin, but in the ‘B74’ orchard, the ranking was flowers < leaves < panicles = branches.
Other macro- and micronutrients were also cycling annually within the mango orchards (Figure 7). The amount of nutrients in the litter and pruning biomass also differed significantly across orchards in both the Darwin and Katherine regions. On a hectare basis, the average amount (and ranges) of other macronutrients that were dropped from the trees onto the orchard floor annually was 0.80 (0.40–1.1) kg P, 4.89 (3.1–6.4) kg K, 8.67 (5.8–13.2) kg Ca, 2.0 (1.5–2.7) kg Mg, and 1.1 (0.8–1.6) kg S (Figure 7a). Moreover, the amount of micronutrients was 15 (7.8–20.6) g B, 13.6 (7.1–21.0) g Cu, 99.3 (58.7–143.1) g Fe, 78.6 (15.4–147.8) g Mn, and 28.6 (14.2–46.8) g Zn (Figure 7b).

4. Discussion

This study showed that the majority of the litter dropped onto orchard floors occurs between the flowering of the trees and fruit harvest. The high variability in the quantity of each litter component during the year reflects the range and differences in management and harvest practices across commercial orchards over time. For example, the amount of leaf litter varied over time, due to the trees’ phenological stages and orchard management practices. Moreover, in the ‘B74’ orchard of the Darwin region, a significant quantity of fruit dropped from trees after harvest, as pickers selectively harvested fruit to meet quality specifications, leaving lower-grade fruit to fall naturally (Figure 3b). In contrast, strip-picking in other orchards minimized post-harvest fruit drop. Notably, post-harvest fruit drop into the litter was less pronounced in the Katherine region orchards. Specifically, at the Katherine ‘KP’ orchard, all healthy fruit was harvested—regardless of commercial grade—due to the availability of a market for mango juice or pulp.
In 2018, the delay in pruning activity and increased amount of pruning biomass removed in the Katherine ‘B74’ orchard were associated with a marked reduction in leaf litter deposition and fruit drop. This was followed by a subsequent increase in floral production as the trees recovered, re-leafed, and resumed normal physiological function (Figure 3d). These trees were the youngest among the orchards, which may have contributed to the comparatively lower amounts of litterfall. Age-dependent variation in litter quantity and quality has been documented across many species, with both interspecific and intraspecific differences observed in senescence dynamics and nutrient cycling processes [50,51]. The amount of biomass removed during post-harvest pruning was substantial, with estimates exceeding 2 t ha−1, potentially altering canopy architecture and influencing source–sink relationships during subsequent phenological stages.
The result of this study adds more information on the limited studies on mango litter accumulation. In the study of Rodrigues and colleagues [52], they reported that mango orchard produced an annual average of 7.06 Mg ha−1 year−1 of litter, with peak production of 186 g m−2 in October during the less rainy season, with leaves contributing 67% of the total litter. Moreover, the overall mean litterfall biomass of mango in India [53] was 0.80 t ha−1 on Pargaon soil and 1.05 t ha−1 on Sawargaon soil. Mango trees also showed varying litterfall patterns, with lower litterfall between January and July (ranging from 0.42 to 0.55 t ha−1) and higher litterfall from August to December (ranging from 0.76 to 1.77 t ha−1).
Reports show that the amount and pattern of litterfall varies with tree species, growth stage, tree density, canopy characteristics, season, and soil conditions. For example, in West Africa [54], the total annual leaf litter production was highest in litchi (8.3 t ha−1), followed by mango (6.3 t ha−1), and lowest in avocado (5.6 t ha−1). Leaf litterfall was highest during autumn and lowest during winter for all species, and annual leaf litter production differed between 2007 and 2008 [54]. In Brazil, the cocoa system yielded an average of 35.04 Mg ha−1 year−1 of litter, followed by native forest with 26.12 Mg ha−1 year−1 and corn with 9.98 Mg ha−1 year−1 [55]. Moreover, litter production of chestnut varied markedly when planted in three sites with different soil properties [56]. Observation was carried out in a 7-year-old citrus orchard, where it was found that the orchard had 1.7 t ha−1 of litter a year, of which 58. 97% were fallen leaves. Litterfall occurred irregularly from month to month, reaching peaks in March and July [57].
In this study, leaf litter deposited over a year contained 6.0–11 kg N ha−1, with flowers adding a substantial 4.6–7.9 kg N ha−1. Owing to its high N content (1.3 ±   0.07 % N). It is well known that mangoes flower prolifically, but a very low percentage of those flowers set fruit, with most flowers senescing from panicles for a range of reasons [58]. It is surprising to observe such an additive quantity of flowers in litter and its N contribution to nutrient recycling in orchards (Figure 3). The combined leaf and flower litter N content is comparable with the amount of N being removed from the orchard through the 10–15 t of harvested fruit [59].
The distribution of C and N between litter and pruning was also consistent with the differences in tree management at each orchard. The leaf litter N content in the NT orchards is comparable to the 0.7% N in mango leaf litter collected under unnamed varieties in Zimbabwe [60] and the Palmer variety in Brazil [61], but lower compared to the 1.5% N measured in litter collected under an unspecified mango variety in India [62]. The amounts of C and N returned with litters in a year in the citrus orchard was 0.70 and 0. 44 t ha−1, respectively.
In the NT, most litter is deposited on orchard floors during the dry season, in May–September. It remains relatively inert until ‘build-up’, where break-of-season rain events increase soil moisture to levels that facilitate the activity of the decomposer communities [62,63]. Despite tropical soil being nutrient-poor, there is evidence that meso- and macrofauna activity (soil fauna ranging in size from small beetles to large cockroaches) augment microfauna population, soil temperature, and soil moisture to break down litter in these environments [64,65]. Temperatures stay high in the tropics and rainfall facilitates litter decomposition, mineralization of organic matter, which then results in either uptake of nutrients via roots or losses via leaching [66]. Vickery [67] shows that long-established mango orchards in both the Darwin and Katherine regions have almost identical total N and C pools compared to paired, adjacent, native savannahs. This means that there has been no alteration in local soil N and C equilibrium in response to long-term changes in land use, implying climate (temperature and rainfall) and, perhaps, biotic decomposers are the dominant factors [63,67].
This study shows a significant difference in C:N ratio among tree plant parts. The C:N ratio of litter biomass, such as leaves, flowers, stems, and branches, reflects the balance of C and N in plant material, which plays a key role in decomposition, nutrient cycling, and ecological dynamics. The results showed that flowers typically have a low C:N ratio (~40), as they are rich in N while leaves and fruits have a moderate C:N ratio (<80), indicating that they release nutrients more gradually, thus contributing to long-term nutrient cycling. In contrast, branches have a higher C:N ratio (>80), as they are more C-dense and N-poor, resulting in slower decomposition and a slower release of nutrients, which helps maintain soil structure over time [68,69,70].
Plant biomass with a lower C:N ratio can also enhance soil nutrient availability by promoting nutrient mineralization and stimulating microbial activity. The lower the C:N ratio, the faster N is released into the soil for immediate use by crops [71]. When the C:N ratio exceeds 35, microbial immobilization occurs, whereas a ratio between 20 and 30 typically results in a balance between mineralization and immobilization. In our study, the C:N ratio of litter materials from Darwin and Katherine orchards ranged between 30 and 139, indicating that most of the litter is unlikely to be quickly mineralized. Instead, it is more likely to be immobilized by soil microbes, especially during the dry season. However, with the onset of the rainy season, higher temperatures and increased moisture promote the decomposition and mineralization of organic matter. Pandeya and colleagues [22] reported that the first rainfall of the season triggers the decomposition of leaf litter on the orchard floor in these regions. Consequently, the tropical soils of the NT remain naturally low in C, even with the addition of pruning and litter materials with high C:N ratios. These findings also suggest that the biomass from trees may require supplementation with inorganic fertilizers to enhance nutrient supply. However, they also observed that adding more N can accelerate decomposition and mineralization during the wet season, which may negatively impact soil organic C levels [22].
Our study also indicates that, aside from C and N, litter and pruning biomass are substantial sources of other macronutrients (P, K, Ca, Mg) and micronutrients (B, Cu, Fe, Mn, Zn). This result provides significant insights into the nutrient dynamics of litter and pruning biomass in mango, particularly by expanding beyond the typical focus on macronutrients like C and N. While most studies in this field have concentrated primarily on the macronutrient content of biomass, there is a distinct lack of research exploring the full spectrum of macro- and micronutrients present in such organic materials.
Generally, litter and pruned tree materials are considered biological yield rather than economic yield. When these litter materials decompose, they release nutrients that contribute to the build-up and maintenance of soil fertility [25,26,27,28], playing a crucial role in nutrient cycling and soil enrichment in orchard ecosystems [62]. Thus, an understanding of nutrient interactions from litterfall in agroecosystems is important as it allows for better prediction and mitigation of the consequences of anthropogenic and environmental changes. It provides detailed information on the nutrient balance of the crop, considering all inputs and outputs and interactions of the above- and below-ground nutrient flows in orchard food webs [72]. Moreover, knowing these processes is crucial for predicting ecosystem responses to climate change and their potential feedback to global biogeochemical cycles [62,64,72]. Thus, litter and pruning biomass represent an important resource that is not typically quantified, yet they contribute to the nutrient cycle within an orchard in the NT.
However, this study is limited by its focus on a single season of litterfall and does not account for long-term variations in nutrient cycling. Additionally, the effects of different environmental factors, such as moisture and temperature, on decomposition rates were not fully explored. The study also did not assess the impact of various pruning methods on litter accumulation and its subsequent effects on soil health. Future research should focus on multi-seasonal studies to assess the long-term impacts of litterfall recycling on soil health and plant growth. Investigating the roles of different environmental conditions, pruning methods, and plant species in litter accumulation and decomposition will provide a more comprehensive understanding of the nutrient cycling process. Additionally, comparing the effectiveness of litterfall-derived nutrients with synthetic fertilizers over extended periods and exploring their contributions to carbon sequestration would be valuable for developing a sustainable mango production system.

5. Conclusions

This study provides a comprehensive analysis of litterfall and pruning biomass in mango orchards, focusing on quantifying annual biomass litter production and determining their nutrient contents. The findings demonstrate that the majority of biomass abscission occurs during the critical phases of floral induction, fruit set, and maturity, with leaves being the predominant component of litter biomass and branches being the main contributor to pruning biomass. The nutrient analysis shows that litter and pruning biomass contain significant quantities of other essential macro- and micronutrients, which can contribute to improving soil health and promoting plant growth when recycled. This research enhances our understanding of nutrient dynamics in mango orchards, which can inform better management practices to sustain the long-term productivity and health of tropical mango production systems. The results advocate for incorporating litterfall in annual N fertilizer budget calculations for mango orchards to enhance NUE and maintain consistent fruit quality while minimizing environmental nutrient losses and ensuring sustainable mango cultivation in tropical NT environments. However, additional research is needed to gain a deeper understanding of the role of litter and pruning biomass in enhancing plant growth and soil health.

Author Contributions

Conceptualization, M.B., A.N. and C.A.A.; methodology, A.N., C.A.A. and D.G.; software, C.A.A. and J.T.; validation, C.A.A. and J.T.; formal analysis, C.A.A. and J.T.; investigation, C.A.A., J.T., D.A., A.N. and D.G.; resources, M.B. and D.R.; data curation, C.A.A. and J.T.; writing—original draft preparation, C.A.A., A.N. and J.T.; writing—review and editing, C.A.A., A.N., J.T., D.A., D.G., M.B. and D.R.; visualization, C.A.A. and J.T.; supervision, C.A.A. and J.T.; project administration, C.A.A., M.B. and D.R.; funding acquisition, M.B. and D.R. All authors have read and agreed to the published version of the manuscript.

Funding

This project was supported by funding from the Australian Government Department of Agriculture, Water, and the Environment as part of its Rural R&D for Profit program, Hort Innovation, using the mango research, development levy and funds, as well as contributions from the Australian Government, the NT Department of Agriculture and Fisheries, the Queensland University of Technology, and the Australian Mango Industry Association.

Institutional Review Board Statement

Not applicable

Informed Consent Statement

Not applicable

Data Availability Statement

The original contributions presented in the study are included in the article. Further inquiries can be directed at the corresponding author.

Acknowledgments

The authors are grateful to the staff of the Plant Industries at Katherine Research Station, especially for the technical assistance of Heshan Jayasekara and Frank Lunguna during the study. We also acknowledge Sarah Carrick from the Centre for Agriculture and Bioeconomy, Queensland University of Technology, as well as the NT commercial mango growers for their continued support and assistance with this study and other mango research activities. Some of the analysis used in this study was conducted at the Queensland University of Technology’s Central Analytical Research Facility. This report is dedicated to the late Bob Williams, former Director of Plant Industry Development at the Northern Territory Department of Primary Industry and Resources (now the Department of Agriculture and Fisheries), for his support and encouragement.

Conflicts of Interest

The authors declare no conflicts of interest.

Abbreviations

The following abbreviations are used in this manuscript:
ANOVAAnalysis of Variance
AUDAustralian Dollar
BBCHBiologische Bundesanstalt, Bundessortenamt und CHemical Industry
BOMBureau of Meteorology
ICP-MSInductively Coupled Plasma–Mass Spectroscopy
IRRIInternational Rice Research Institute
NUENitrogen-Use Efficiency
RAAFRoyal Australian Air Force
STARStatistical Tool for Agricultural Research

References

  1. Amruddin, A.; Mahmood, M.R.; Supardjo, D.; Safruddin, S.; Susilatun, H.R. Analysis of climate change impacts on agricultural production and adaptation strategies for farmers: Agricultural policy perspectives. Glob. Int. J. Innov. Res. 2024, 2, 374–383. [Google Scholar] [CrossRef]
  2. Pratap, D.; Tamuly, G.; Ganavi, N.R.; Anbarasan, S.; Pandey, A.K.; Singh, A.; Priya, P.; Debnath, A.; Iberaheem, M. Climate change and global agriculture: Addressing challenges and adaptation strategies. J. Exp. Agric. Int. 2024, 46, 799. [Google Scholar] [CrossRef]
  3. Webb, N.P.; Marshall, N.; Stringer, L.C.; Reed, M.S.; Chappell, A.; Herrick, J. Land degradation and climate change: Building climate resilience in agriculture. Front. Ecol. Environ. 2017, 15, 450–459. [Google Scholar] [CrossRef]
  4. Saikanth, D.R.K.; Kumar, S.; Rani, M.; Sharma, A.; Srivastava, S.; Vyas, D.; Singh, G.A.; Kumar, S. A Comprehensive review on climate change adaptation strategies and challenges in agriculture. Int. J. Environ. Clim. Change 2023, 13, 10–19. [Google Scholar] [CrossRef]
  5. Çakmakç, R.; Salık, M.A.; Çakmakç, S. Assessment and principles of environmentally sustainable food and agriculture systems. Agriculture 2023, 13, 1073. [Google Scholar] [CrossRef]
  6. Pretty, J. Agricultural sustainability: Concepts, principles and evidence. Philos. Trans. R. Soc. Lond. B Biol. Sci. 2008, 363, 447–465. [Google Scholar] [CrossRef]
  7. Jiang, X.; Zhang, W.; Fernie, A.R.; Wen, W. Combining novel technologies with interdisciplinary basic research to enhance horticultural crops. Plant J. 2022, 109, 35–46. [Google Scholar] [CrossRef]
  8. Sharma, S.; Rana, V.S.; Lakra, J.; Sharma, U. Appraisal of carbon capture, storage and utilization through fruit crops. Front. Environ. Sci. 2021, 9, 258. [Google Scholar] [CrossRef]
  9. Bally, I.S.E.; Dillon, N.L. Mango (Mangifera indica L.) breeding. In Advances in Plant Breeding Strategies: Fruits; Al-Khayri, J., Jain, S., Johnson, D., Eds.; Springer: Cham, Switzerland, 2018; Volume 3, pp. 811–896. [Google Scholar] [CrossRef]
  10. Singh, S.P.; Nandi, A.K. A financial viability and relative profitability of mango orcharding in Lucknow District of Uttar Pradesh. Econ. Affairs 2020, 65, 77–83. [Google Scholar] [CrossRef]
  11. Sarker, F.I.M.G.W.; Biswas, J.C.; Maniruzzaman, M. Climate change adaptation and economic profitability: Crop land shifting to mango orchard in Rajshahi region. Bangladesh Rice J. 2014, 18, 8–17. [Google Scholar] [CrossRef]
  12. Arnoldus, M.; Clausen, B. Production Cost and Profitability of Mango Farming in Ghana: A Benchmark Study Between 4 Countries; Sense GIZ: Cape Town, South Africa, 2019; pp. 1–51. [Google Scholar]
  13. Ayala-Garay, A.V.; Almaguer-Vargas, G.; De la Trinidad-Pérez, N.K.; Caamal-Cauich, I.; Rendón, R. Competitividad de la producción de mango (Mangifera indica L.) en Michoacán. Rev. Chapingo Serie Hortic. 2009, 15, 133–140. [Google Scholar] [CrossRef]
  14. Blare, T.; Ballen, F.H.; Singh, A.; Haley, N.; Crane, J.H. Profitability and cost estimates for producing Mango (Mangifera indica L.) in south Florida. EDIS 2022, 2022. [Google Scholar] [CrossRef]
  15. Testa, R.; Tudisca, S.; Schifani, G.; Di Trapani, A.M.; Migliore, G. Tropical fruits as an opportunity for sustainable development in rural areas: The case of mango in small-sized Sicilian farms. Sustainability 2018, 10, 1436. [Google Scholar] [CrossRef]
  16. Bennett, D.M.; Dickinson, G.R. Economic Case Study of Intensive Mango Systems: A Comparison of the Profitability of Conventional (Low, Medium and High Density) and Trellis (High Density) Mango Canopy Systems in North Queensland Based on Early Trial Results; CRCNA: Queensland, Autralia, 2021; pp. 1–28. [Google Scholar]
  17. Kiloes, A.M.; Joyce, D.C.; Abdul Aziz, A. Exploring the challenges and opportunities of mango export from Indonesia: Insights from stakeholder interviews. Qual. Rep. 2024, 29, 811–830. [Google Scholar] [CrossRef]
  18. Ronie, M.E.; Aziz, A.H.A.; Kobun, R.; Pindi, W.; Roslan, J.; Putra, N.R.; Mamat, H. Unveiling the potential applications of plant by-products in food—A review. Waste Manag. Bull. 2024, 2, 183–203. [Google Scholar] [CrossRef]
  19. Johnson, G.I. Introduction of the mango to Australia. Proc. R. Soc. Qld. 2000, 109, 83–90. [Google Scholar]
  20. Hort Innovation. Australian Horticulture Statistics Handbook; Hort Innovation: Sydney, NSW, Australia, 2024; pp. 100–103. Available online: https://www.horticulture.com.au/contentassets/a36fdfa2427d4ad284c426663b06f15c/hort-innovation-ahsh-2023-24-fruit-r2.pdf (accessed on 7 May 2025).
  21. NT Mangoes, Northern Territory, Australia. Available online: https://ntfarmers.org.au/commodities/mangoes/ (accessed on 28 June 2024).
  22. Pandeya, H.R.; Friedl, J.; De Rosa, D.; Asis, C.T.; Tilbrook, J.; Scheer, C.; Bristow, M.; Grace, P.R.; Rowlings, D.W. Combined effect of nitrogen fertiliser and leaf litter carbon drive nitrous oxide emissions in tropical soils. Nutr. Cycl. Agroecosyst. 2020, 118, 207–222. [Google Scholar] [CrossRef]
  23. Smith, S.; Hill, J. Supporting Sustainable Development–Risks and Impacts of Plant Industries on Soil Condition, Technology Bulletin 340; Northern Territory Government: Darwin, NT, Australia, 2011; pp. 1–27. Available online: https://industry.nt.gov.au/__data/assets/pdf_file/0005/233258/tb340.pdf (accessed on 20 January 2025).
  24. Derpsch, R.; Kassam, A.; Reicosky, D.; Friedrich, T.; Calegari, A.; Basch, G.; Gonzalez-Sanchez, E.; dos Santos, D.R. Nature’s laws of declining soil productivity and Conservation Agriculture. Soil Secur. 2024, 14, 100127. [Google Scholar] [CrossRef]
  25. Schmidt, M.; Corre, M.D.; Kim, B.; Morley, J.; Göbel, L.; Sharma, A.S.I.; Setriuc, S.; Veldkamp, E. Nutrient saturation of crop monocultures and agroforestry indicated by nutrient response efficiency. Nutr. Cycl. Agroecosyst. 2021, 119, 69–82. [Google Scholar] [CrossRef]
  26. Mosier, S.; Córdova, S.C.; Robertson, G.P. Restoring soil fertility on degraded lands to meet food, fuel, and climate security needs via perennialization. Front. Sustain. Food Syst. 2021, 5, 706142. [Google Scholar] [CrossRef]
  27. Khalsa, S.D.S.; Smart, D.R.; Muhammad, S.; Armstrong, C.M.; Sanden, B.L.; Houlton, B.Z.; Brown, P.H. Intensive fertilizer use increases orchard N cycling and lowers net global warming potential. Sci. Total Environ. 2020, 722, 137889. [Google Scholar] [CrossRef]
  28. Chave, J.; Navarrete, D.; Almeida, S.; Álvarez, E.; Aragão, L.E.O.C.; Bonal, D.; Châtelet, P.; Silva-Espejo, J.E.; Goret, J.Y.; von Hildebrand, P.; et al. Regional and seasonal patterns of litterfall in tropical South America. Biogeosciences 2010, 7, 43–55. [Google Scholar] [CrossRef]
  29. Zhao, W.; Zhao, H.; Wang, H.; He, Y. Research progress on the relationship between leaf senescence and quality, yield and stress resistance in horticultural plants. Front. Plant Sci. 2022, 13, 1044500. [Google Scholar] [CrossRef] [PubMed]
  30. Estiarte, M.; Campioli, M.; Mayol, M.; Penuelas, J. Variability and limits of nitrogen and phosphorus resorption during foliar senescence. Plant Commun. 2023, 4, 100503. [Google Scholar] [CrossRef]
  31. Asis, C.A.; Niscioli, A. Impact of twig-tip dieback on leaf nutrient status and resorption efficiency of mango (Mangifera indica L.) Trees. Horticulturae 2024, 10, 678. [Google Scholar] [CrossRef]
  32. Mitra, S. Mango cultivation practices in the tropics: Good agricultural practices to maximize sustainable yields. In Achieving Sustainable Cultivation of Mangoes; Sauco, V.G., Lu, P., Eds.; Burleigh Dodds Science Publishing: Cambridge, UK, 2018; pp. 149–163. [Google Scholar]
  33. Sayer, E.J.; Tanner, E.V. Experimental investigation of the importance of litterfall in lowland semi-evergreen tropical forest nutrient cycling. J. Ecol. 2010, 98, 1052–1062. [Google Scholar] [CrossRef]
  34. Google EarthTM. Available online: https://earth.google.com/web/ (accessed on 25 April 2025).
  35. Ahammad, R.; Sangha, K. A Literature Review of the Horticulture Sector in Northern Australia; The Cooperative Research Centre for Developing Northern Australia: Darwin, Northern Territory, Australia, 2022; pp. 1–29. [Google Scholar]
  36. Asis, C.A.; Tilbrook, J.; Anson, D.; Niscioli, A.; Bristow, M.; Friedl, J.; Rowlings, D. Estimating nitrogen uptake efficiency of mango varieties from foliar KNO3 application using a 15N tracer technique. Nitrogen 2024, 5, 1124–1134. [Google Scholar] [CrossRef]
  37. Isbell, R.F. ; National Committee on Soil and Terrain. The Australian Soil Classification, 3rd ed.; CSIRO Publishing: Melbourne, Australia, 2021; pp. 67–73. [Google Scholar]
  38. Climate Data Online, Bureau of Meteorology, Australia. Available online: http://www.bom.gov.au/climate/data/index.shtml (accessed on 3 January 2025).
  39. Junaedi, A.; Hardiwinoto, S.; Supriyo, H.; Mindawati, N. Litter productivity and leaf litter nutrient return of three native tree species in drained tropical peatland, Riau-Indonesia. IOP Conf. Ser. Earth Environ. Sci. 2020, 533, 012007. [Google Scholar] [CrossRef]
  40. Morffi-Mestre, H.; Ángeles-Pérez, G.; Powers, J.S.; Andrade, J.L.; Huechacona Ruiz, A.H.; May-Pat, F.; Chi-May, F.; Dupuy, J.M. Multiple factors influence seasonal and interannual litterfall production in a tropical dry forest in Mexico. Forests 2020, 11, 1241. [Google Scholar] [CrossRef]
  41. Yao, M.K.; Koné, A.W.; Otinga, A.N.; Kassin, E.K.; Tano, Y. Carbon and nutrient cycling in tree plantations vs. natural forests: Implication for an efficient cocoa agroforestry system in West Africa. Reg. Environ. Change 2021, 21, 44. [Google Scholar] [CrossRef]
  42. Finotti, R.; Freitas, S.R.; Cerqueira, R.; Vieira, M.V. A method to determine the minimum number of litter traps in litterfall studies. Biotropica 2003, 35, 419–421. [Google Scholar] [CrossRef]
  43. Scott: Automation That Transforms. Available online: https://scottautomation.com/en/ (accessed on 23 November 2024).
  44. Berauer, B.J.; Wilfahrt, P.A.; Schuchardt, M.A.; Schlingmann, M.; Schucknecht, A.; Jentsch, A. High land-use intensity diminishes stability of forage provision of mountain pastures under future climate variability. Agronomy 2021, 11, 910. [Google Scholar] [CrossRef]
  45. Hernández-Delgado, P.M.; Aranguren, M.; Reig, C.; Fernández-Galván, D.; Mesejo, C.; Martínez-Fuentes, A.; Galán-Saúco, V.; Agustí, M. Phenological growth stages of mango (Mangifera indica L.) according to the BBCH scale. Sci. Hortic. 2011, 130, 536–540. [Google Scholar] [CrossRef]
  46. LECO Corporation 928 Series: Macro Determination Through Combustion. Available online: https://www.leco.com/products/928-series/ (accessed on 23 January 2025).
  47. Agilent: Gas Chromatography/Mass Spectrometry (GC/MS). Available online: https://www.agilent.com/en/product/gas-chromatography-mass-spectrometry-gc-ms (accessed on 23 January 2025).
  48. Htwe, N.M.; Phyu, S.L.; Thu, C.N. Assessment of genetic variability and character association of Myanmar local rice (Oryza sativa L.) germplasm. J. Exp. Agric. Int. 2019, 40, 1–10. [Google Scholar] [CrossRef]
  49. GraphPad: Comprehensive Analysis and Powerful Statistics, Simplified. Available online: https://www.graphpad.com/scientific-software/prism/ (accessed on 23 November 2024).
  50. Savaci, G.; Sariyildiz, T. Effects of stand age on litter quality, decomposition rate and nutrient release of Kazdagi fir (Abies nordmanniana subsp. equi-trojani). iForest Biogeosci. For. 2020, 13, 396. [Google Scholar] [CrossRef]
  51. Morffi-Mestre, H.; Ángeles-Pérez, G.; Powers, J.S.; Andrade, J.L.; Feldman, R.E.; May-Pat, F.; Chi-May, F.; Dupuy-Rada, J. Leaf litter decomposition rates: Influence of successional age, topography and microenvironment on six dominant tree species in a tropical dry forest. Front. For. Glob. Change 2023, 6, 1082233. [Google Scholar] [CrossRef]
  52. Rodrigues, J.C.; Miranda, I.S.; de Sousa, A.M.L. Can mango orchards rehabilitate degraded areas by nutrient cycling? J. Environ. Manag. 2019, 231, 1176–1181. [Google Scholar] [CrossRef] [PubMed]
  53. Navnage, N.P.; Pharande, A.L.; Kadlag, A.D.; Bainade, S.P. Litter dynamics of mango trees grown in different shrink-swell soil series of Maharashtra. Intl. J. Adv. Chem. Res. 2021, 3, 38–42. [Google Scholar] [CrossRef]
  54. Murovhi, N.R.; Materechera, S.A.; Mulugeta, S.D. Seasonal changes in litter fall and its quality from three sub-tropical fruit tree species at Nelspruit, South Africa. Agrofor. Syst. 2012, 86, 61–71. [Google Scholar] [CrossRef]
  55. Pereira, D.G.C.; Portugal, A.F.; Giustolin, T.A.; Maia, V.M.; Megda, M.X.V.; Kondo, M.K. Litter decomposition and nutrient release in different land use systems in the Brazilian semi-arid region. Catena 2023, 231, 107345. [Google Scholar] [CrossRef]
  56. Patrício, M.D.S.; Nunes, L.F.; Pereira, E.L. Litterfall and litter decomposition in chestnut high forest stands in northern Portugal. For. Syst. 2012, 21, 259–271. [Google Scholar] [CrossRef]
  57. Wu, Z.D.; Wang, Y.X.; Cai, Z.J.; You, Z.M.; Zhang, W.J.; Weng, B.Q. Amount and decomposition characteristics of litters in citrus orchard in Fuzhou, China. J. Ecol. Rural Environ. 2010, 26, 231–234. [Google Scholar]
  58. Pérez Méndez, V.; Herrero Romero, M.; Hormaza Urroz, J.I. Different factors involved in the low fruit set of mango (Mangifera indica). Acta Hortic. 2019, 1231, 43–48. [Google Scholar] [CrossRef]
  59. Tilbrook, J.; Niscioli, A.; Rowlings, D.; Asis, C. Optimising Nutrient Management for Improved Productivity and Fruit Quality in Mango (RRDP1720), Final Report Submitted to the Cotton Research and Development Corporation—More Profit from Nitrogen Program; CRDC: Narrabri, NSW, Australia, 2021. [Google Scholar]
  60. Musvoto, C.; Campbell, B.M.; Kirchmann, H. Decomposition and nutrient release from mango and miombo woodland litter in Zimbabwe. Soil Biol. Biochem. 2000, 32, 1111–1119. [Google Scholar] [CrossRef]
  61. de Almeida, C.X.; Pita Junior, J.L.; Rozane, D.E.; de Souza, H.A.; Hernandes, A.; Natale, W.; Farraudo, A. Nutrient cycling in mango trees. Ciênc. Agrár. 2014, 35, 259–266. [Google Scholar] [CrossRef]
  62. Naik, S.K.; Maurya, S.; Mukherjee, D.; Singh, A.K.; Bhatt, B.P. Rates of decomposition and nutrient mineralization of leaf litter from different orchards under hot and dry sub-humid climate. Arch. Agron. Soil Sci. 2018, 64, 560–573. [Google Scholar] [CrossRef]
  63. García-Palacios, P.; McKie, B.G.; Handa, I.T.; Frainer, A.; Hättenschwiler, S. The importance of litter traits and decomposers for litter decomposition: A comparison of aquatic and terrestrial ecosystems within and across biomes. Funct. Ecol. 2016, 30, 819–829. [Google Scholar] [CrossRef]
  64. Parsons, S.A.; Congdon, R.A.; Lawler, I.R. Determinants of the pathways of litter chemical decomposition in a tropical region. New Phytol. 2014, 203, 873–882. [Google Scholar] [CrossRef]
  65. Peguero, G.; Sardans, J.; Asensio, D.; Fernández-Martínez, M.; Gargallo-Garriga, A.; Grau, O.; Llusià, J.; Margalef, O.; Márquez, L.; Ogaya, R.; et al. Nutrient scarcity strengthens soil fauna control over leaf litter decomposition in tropical rainforests. Proc. R. Soc. B 2019, 286, 20191300. [Google Scholar] [CrossRef]
  66. Anaya, C.A.; Jaramillo, V.J.; Martínez-Yrízar, A.; García-Oliva, F. Large rainfall pulses control litter decomposition in a tropical dry forest: Evidence from an 8-year study. Ecosystems 2012, 15, 652–663. [Google Scholar] [CrossRef]
  67. Vickery, B.S. The Limit to Soil Organic Carbon Sequestration in Tropical Soils. Bachelor’s Thesis, Queensland University of Technology, Brisbane, Queensland, Australia, 2019. [Google Scholar]
  68. Spohn, M. Microbial respiration per unit microbial biomass depends on litter layer carbon-to-nitrogen ratio. Biogeosciences 2015, 12, 817–823. [Google Scholar] [CrossRef]
  69. Zhang, J.; He, N.; Liu, C.; Xu, L.; Chen, Z.; Li, Y.; Wang, R.; Yu, G.; Sun, W.; Xiao, C.; et al. Variation and evolution of C:N ratio among different organs enable plants to adapt to N-limited environments. Glob. Change Biol. 2020, 26, 2534–2543. [Google Scholar] [CrossRef] [PubMed]
  70. Sione, S.M.J.; Ledesma, S.; Aceñolaza, P.G.; Wilson, M.G. Biomass Carbon and Nitrogen allocation in different tree species: Do tree compartments and size affect C: N relationship? Silva Finnica 2022, 56, 10755. [Google Scholar] [CrossRef]
  71. Watson, C.A.; Atkinson, D.; Gosling, P.; Jackson, L.R.; Rayns, F.W. Managing soil fertility in organic farming systems. Soil Use Manag. 2002, 18, 239–247. [Google Scholar] [CrossRef]
  72. Gentile, R.M.; Boldingh, H.L.; Campbell, R.E.; Gee, M.; Gould, N.; Lo, P.; McNally, S.; Park, K.C.; Richardson, A.C.; Stringer, L.D.; et al. System nutrient dynamics in orchards: A research roadmap for nutrient management in apple and kiwifruit. A review. Agron. Sustain. Dev. 2022, 42, 64. [Google Scholar] [CrossRef]
Figure 1. Map showing (a) the location of Darwin and Katherine in the Northern Territory, Australia, and (b) the four mango orchards located in the Darwin and Katherine regions [34].
Sustainability 17 04452 g001
Figure 2. Temperature and rainfall records for the Darwin (a) and Katherine (b) mango-growing regions [38]. Figures are redrawn from BOM sites in Acacia Hills, NT for Darwin orchards and RAAF Base Tindal, Katherine, NT for Katherine orchards.
Sustainability 17 04452 g002
Figure 3. Litter collected over a year in orchards in the Darwin region (a,b) and the Katherine region (c,d). Data are standardized to a tree density of 250 trees ha−1.
Sustainability 17 04452 g003
Figure 4. Annual dry weights of the different components (ad) and total biomass (e) of the litter and pruning materials from orchards in the Darwin region (a,b,e) and the Katherine region (ce), standardized to a tree density of 250 trees ha−1. Data are presented as mean ± SEM; means with similar letters are not significantly different based on LSD0.05.
Sustainability 17 04452 g004
Figure 5. Total N content (a) and total C content (b) of litter and pruning biomass from the Darwin and Katherine regions, standardized to a tree density of 250 trees ha−1. Data are presented as mean ± SEM; means with similar letters and those without letters are not significantly different based on LSD0.05.
Sustainability 17 04452 g005
Figure 6. C:N ratio of different biomass components of combined litter and pruning biomass in the Darwin region (a,b) and the Katherine region (c,d), standardized to a tree density of 250 trees ha−1. Data are presented as mean ± SEM; means with similar letters are not significantly different based on LSD0.05.
Sustainability 17 04452 g006
Figure 7. Macronutrient (a) and micronutrient (b) contents of the litter and pruning biomass, standardized to a tree density of 250 trees ha−1. Data are presented as mean ± SEM; means with similar letters are not significantly different based on LSD0.05.
Sustainability 17 04452 g007
Disclaimer/Publisher’s Note: The statements, opinions and data contained in all publications are solely those of the individual author(s) and contributor(s) and not of MDPI and/or the editor(s). MDPI and/or the editor(s) disclaim responsibility for any injury to people or property resulting from any ideas, methods, instructions or products referred to in the content.

