Theoretical Connotation and Measurement Indicator System of Ecological Green Development Level in China
Abstract
1. Introduction
2. Materials and Methods
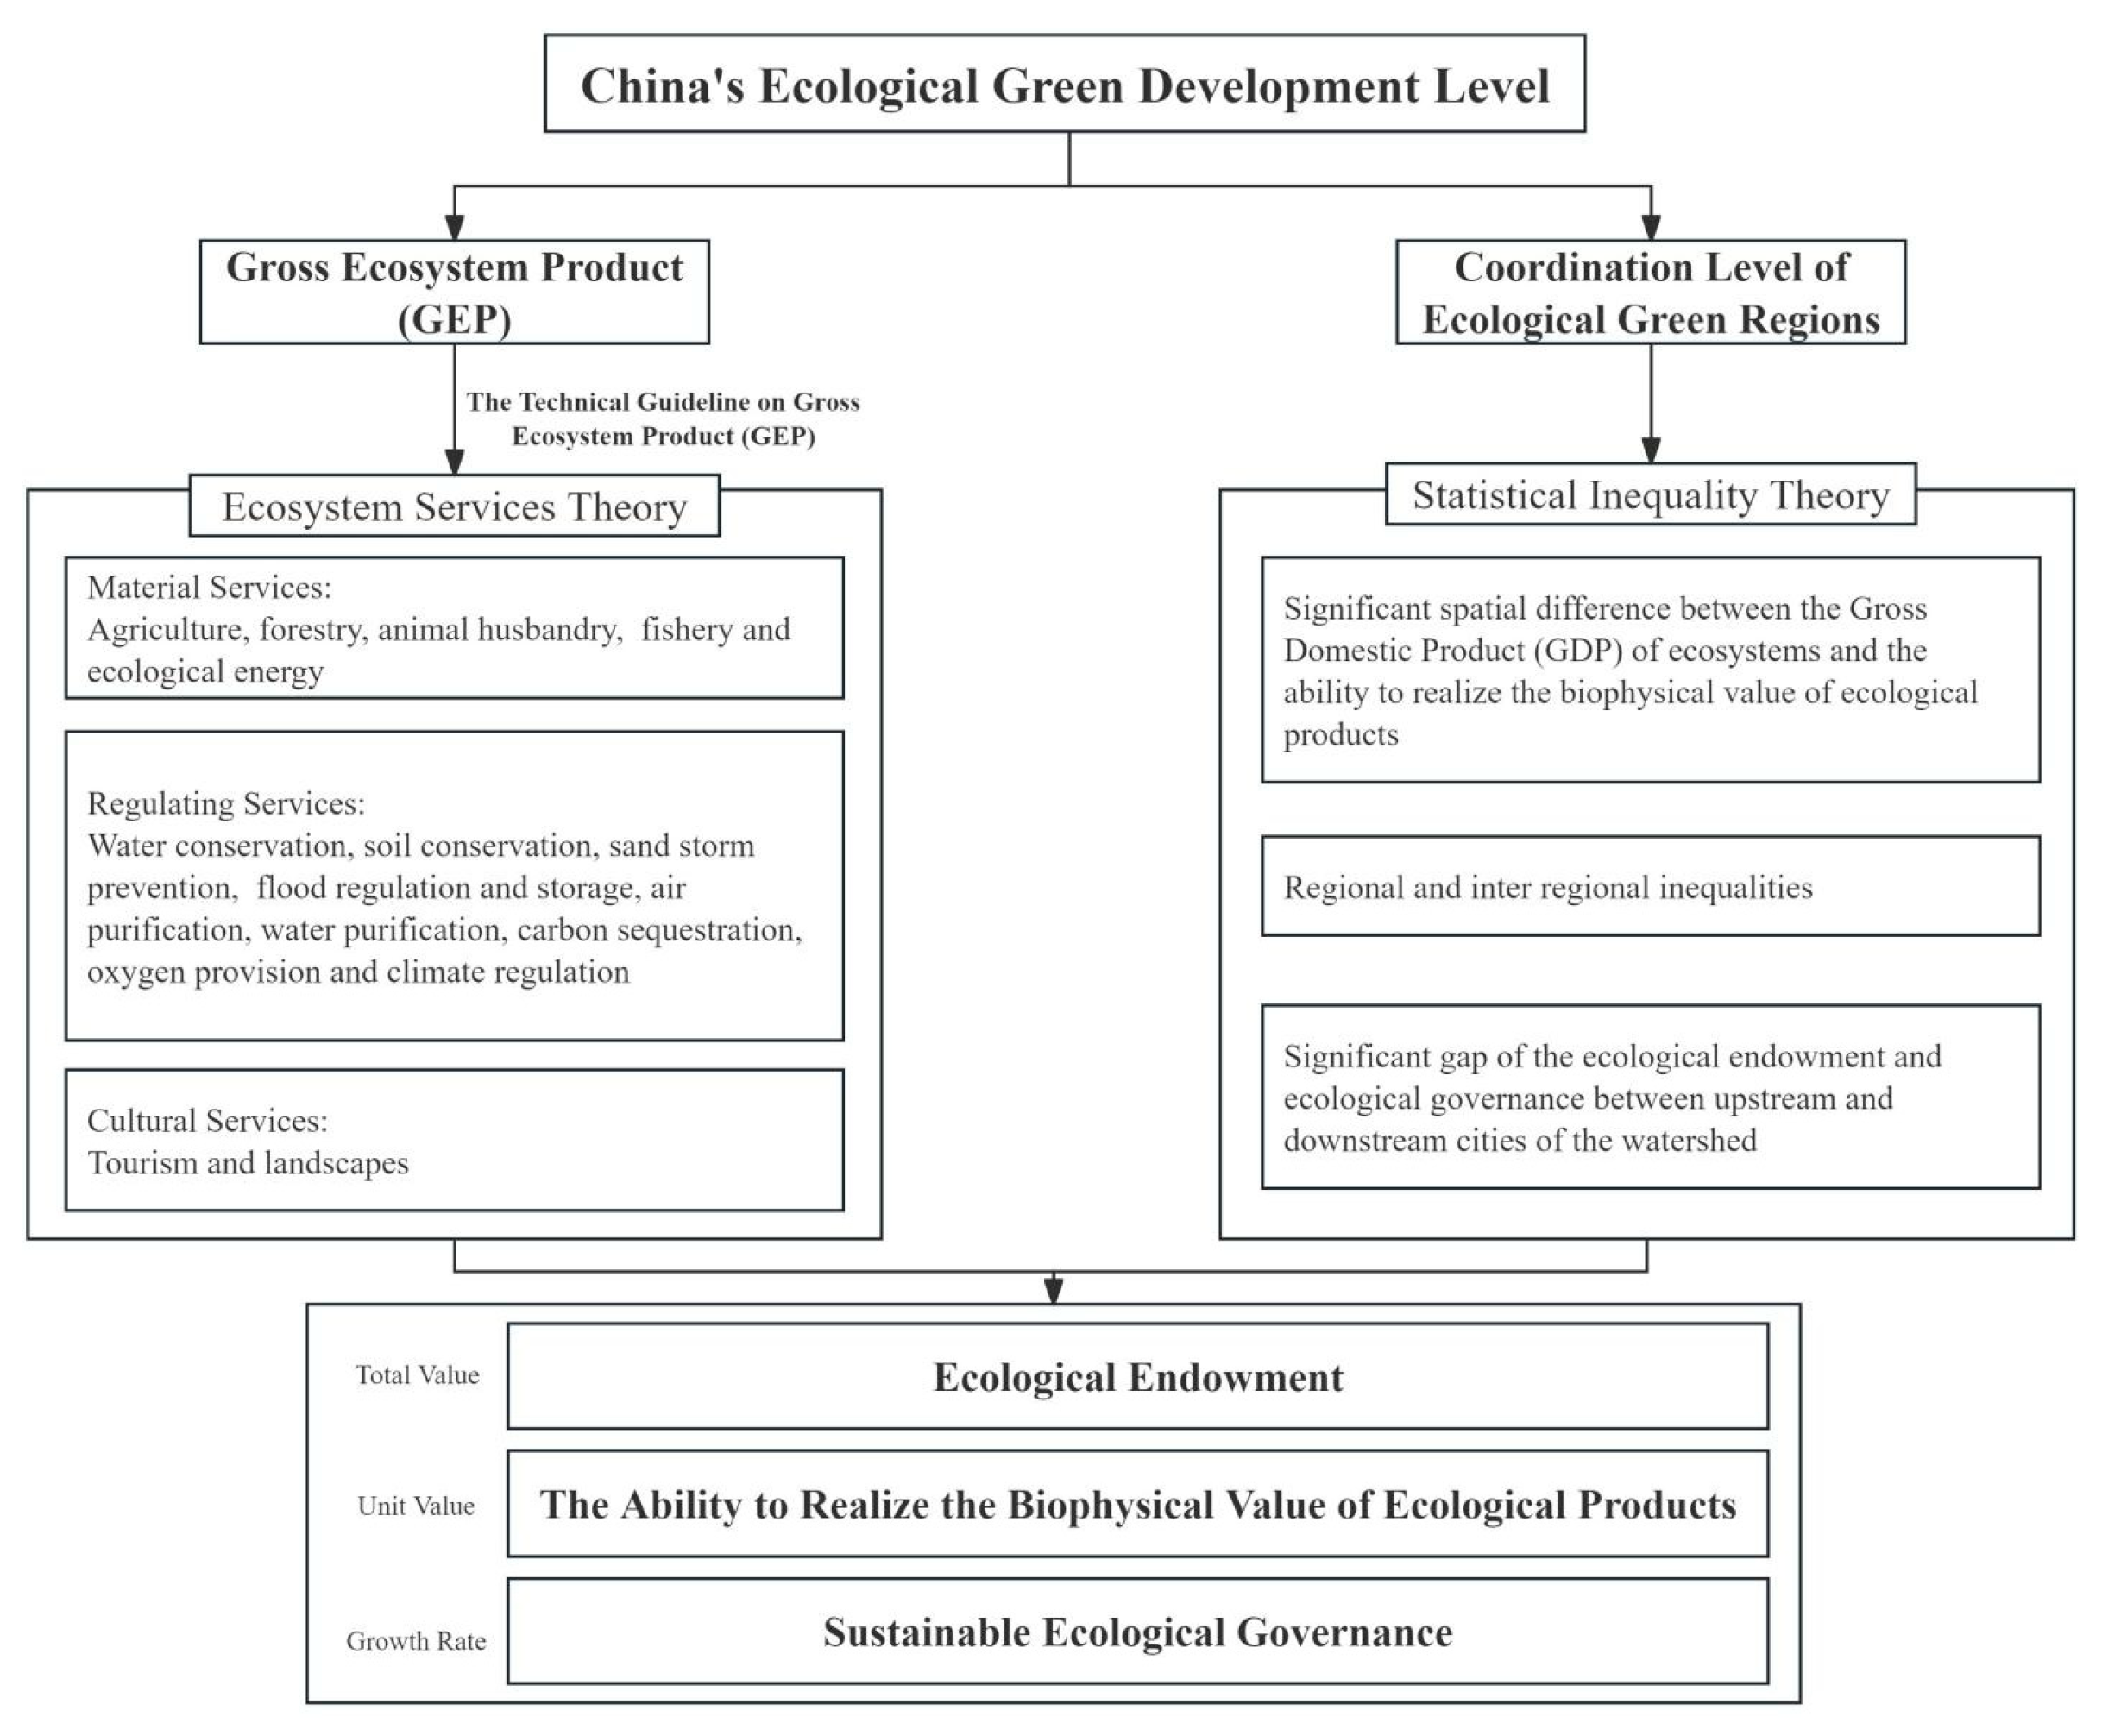
2.1. Ecosystem Services Theory
2.2. Statistical Inequality Theory
2.3. Database and Data Processing
- (1)
- Weather Data
- (2)
- Geological Data
- (3)
- Economic Data
- (4)
- Data Processing
3. Results
3.1. Measure Results of China’s Ecological Green Development Level
3.1.1. Inadequate Realization of GEP
- (1)
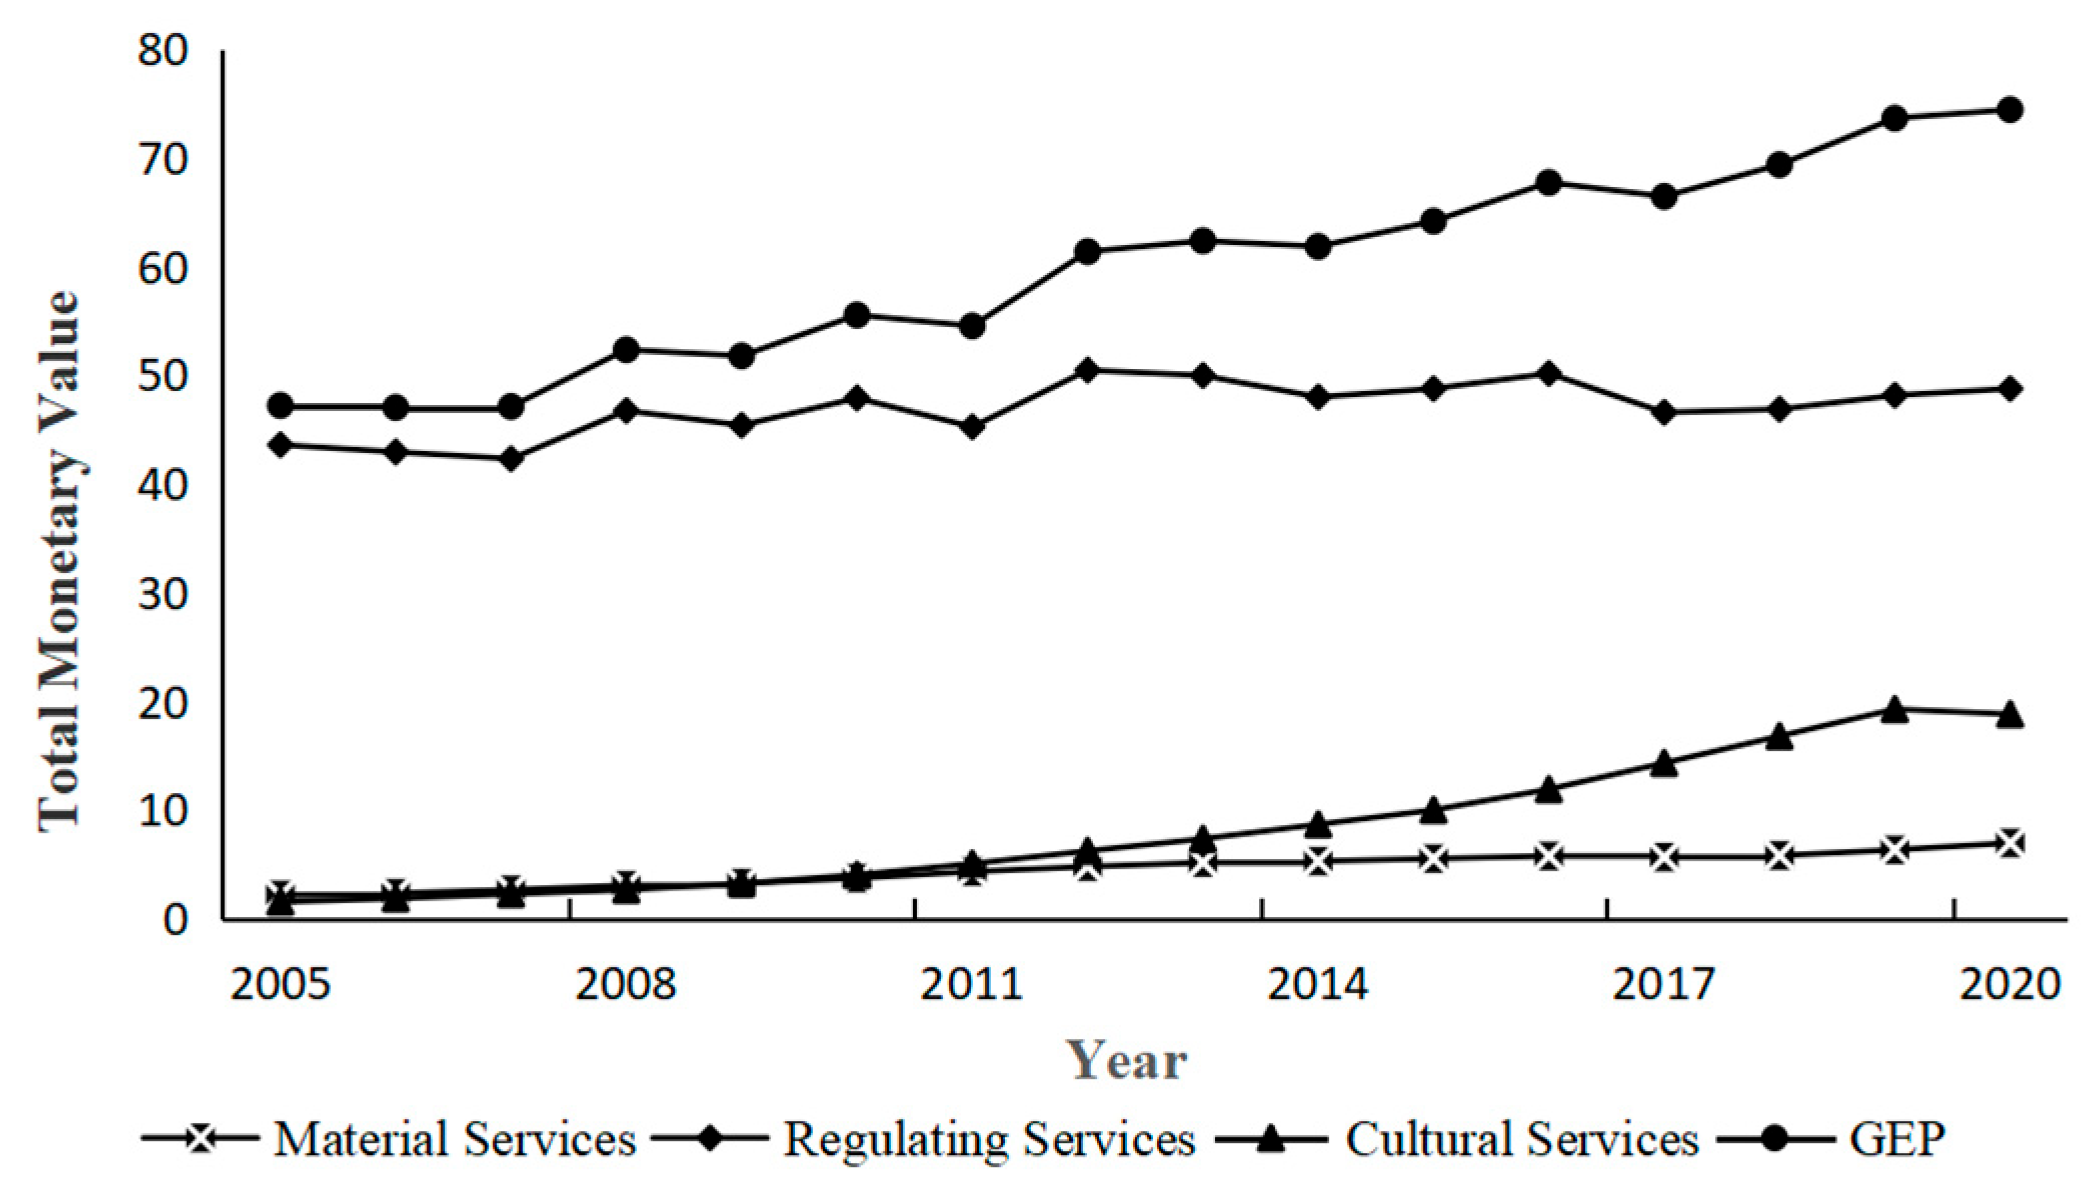
- Compared to GDP, GEP growth is sluggish.
- (2)
- Natural constraints limit the ecosystem regulation services.
- (3)
- Incomplete regulation functioning of non-forest ecosystems.
3.1.2. Incoordinated Ecological Green Development Among Regions
- (1)
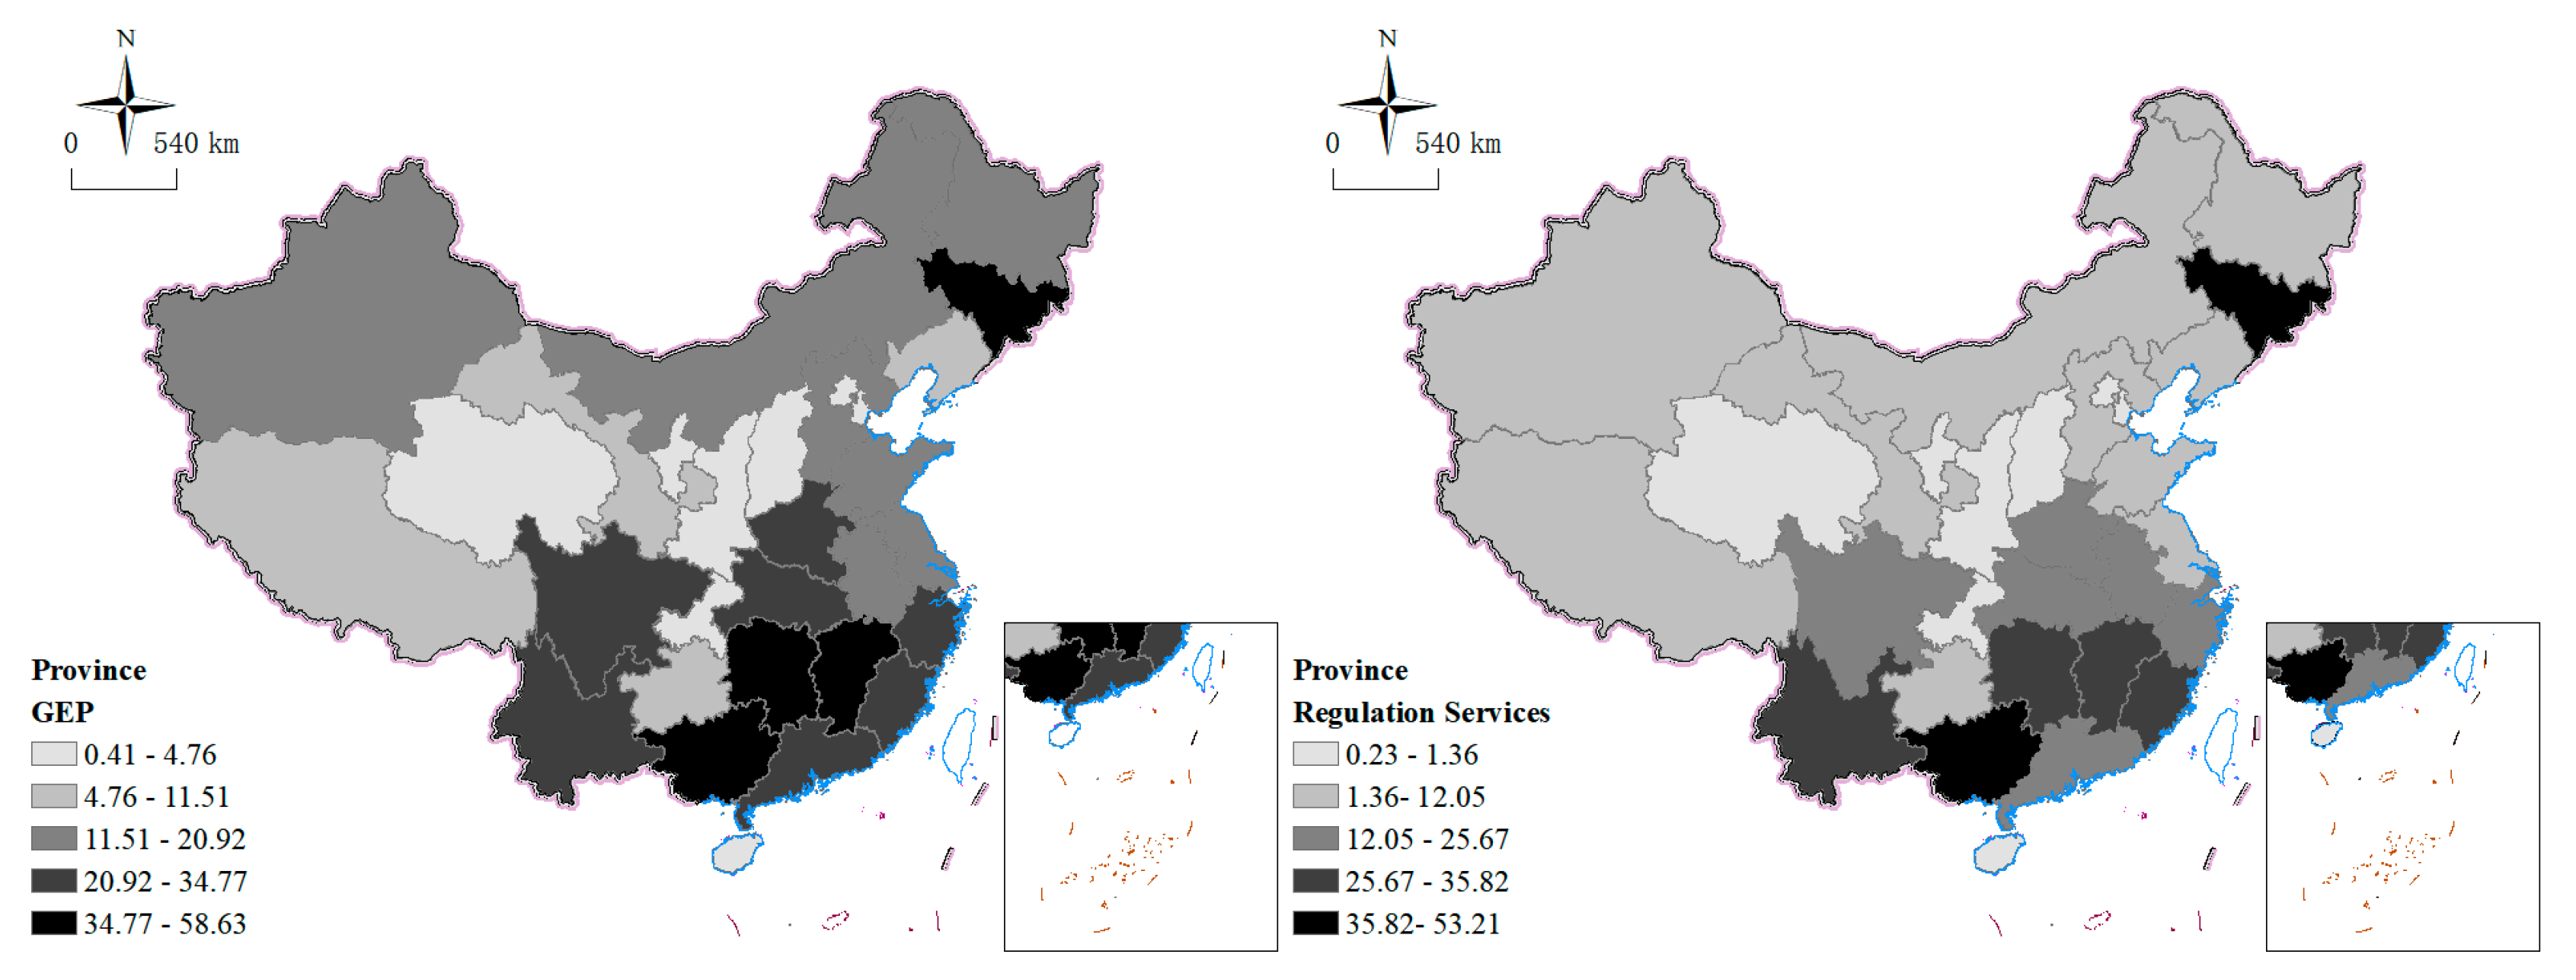
- Provincial Differences.
- (2)
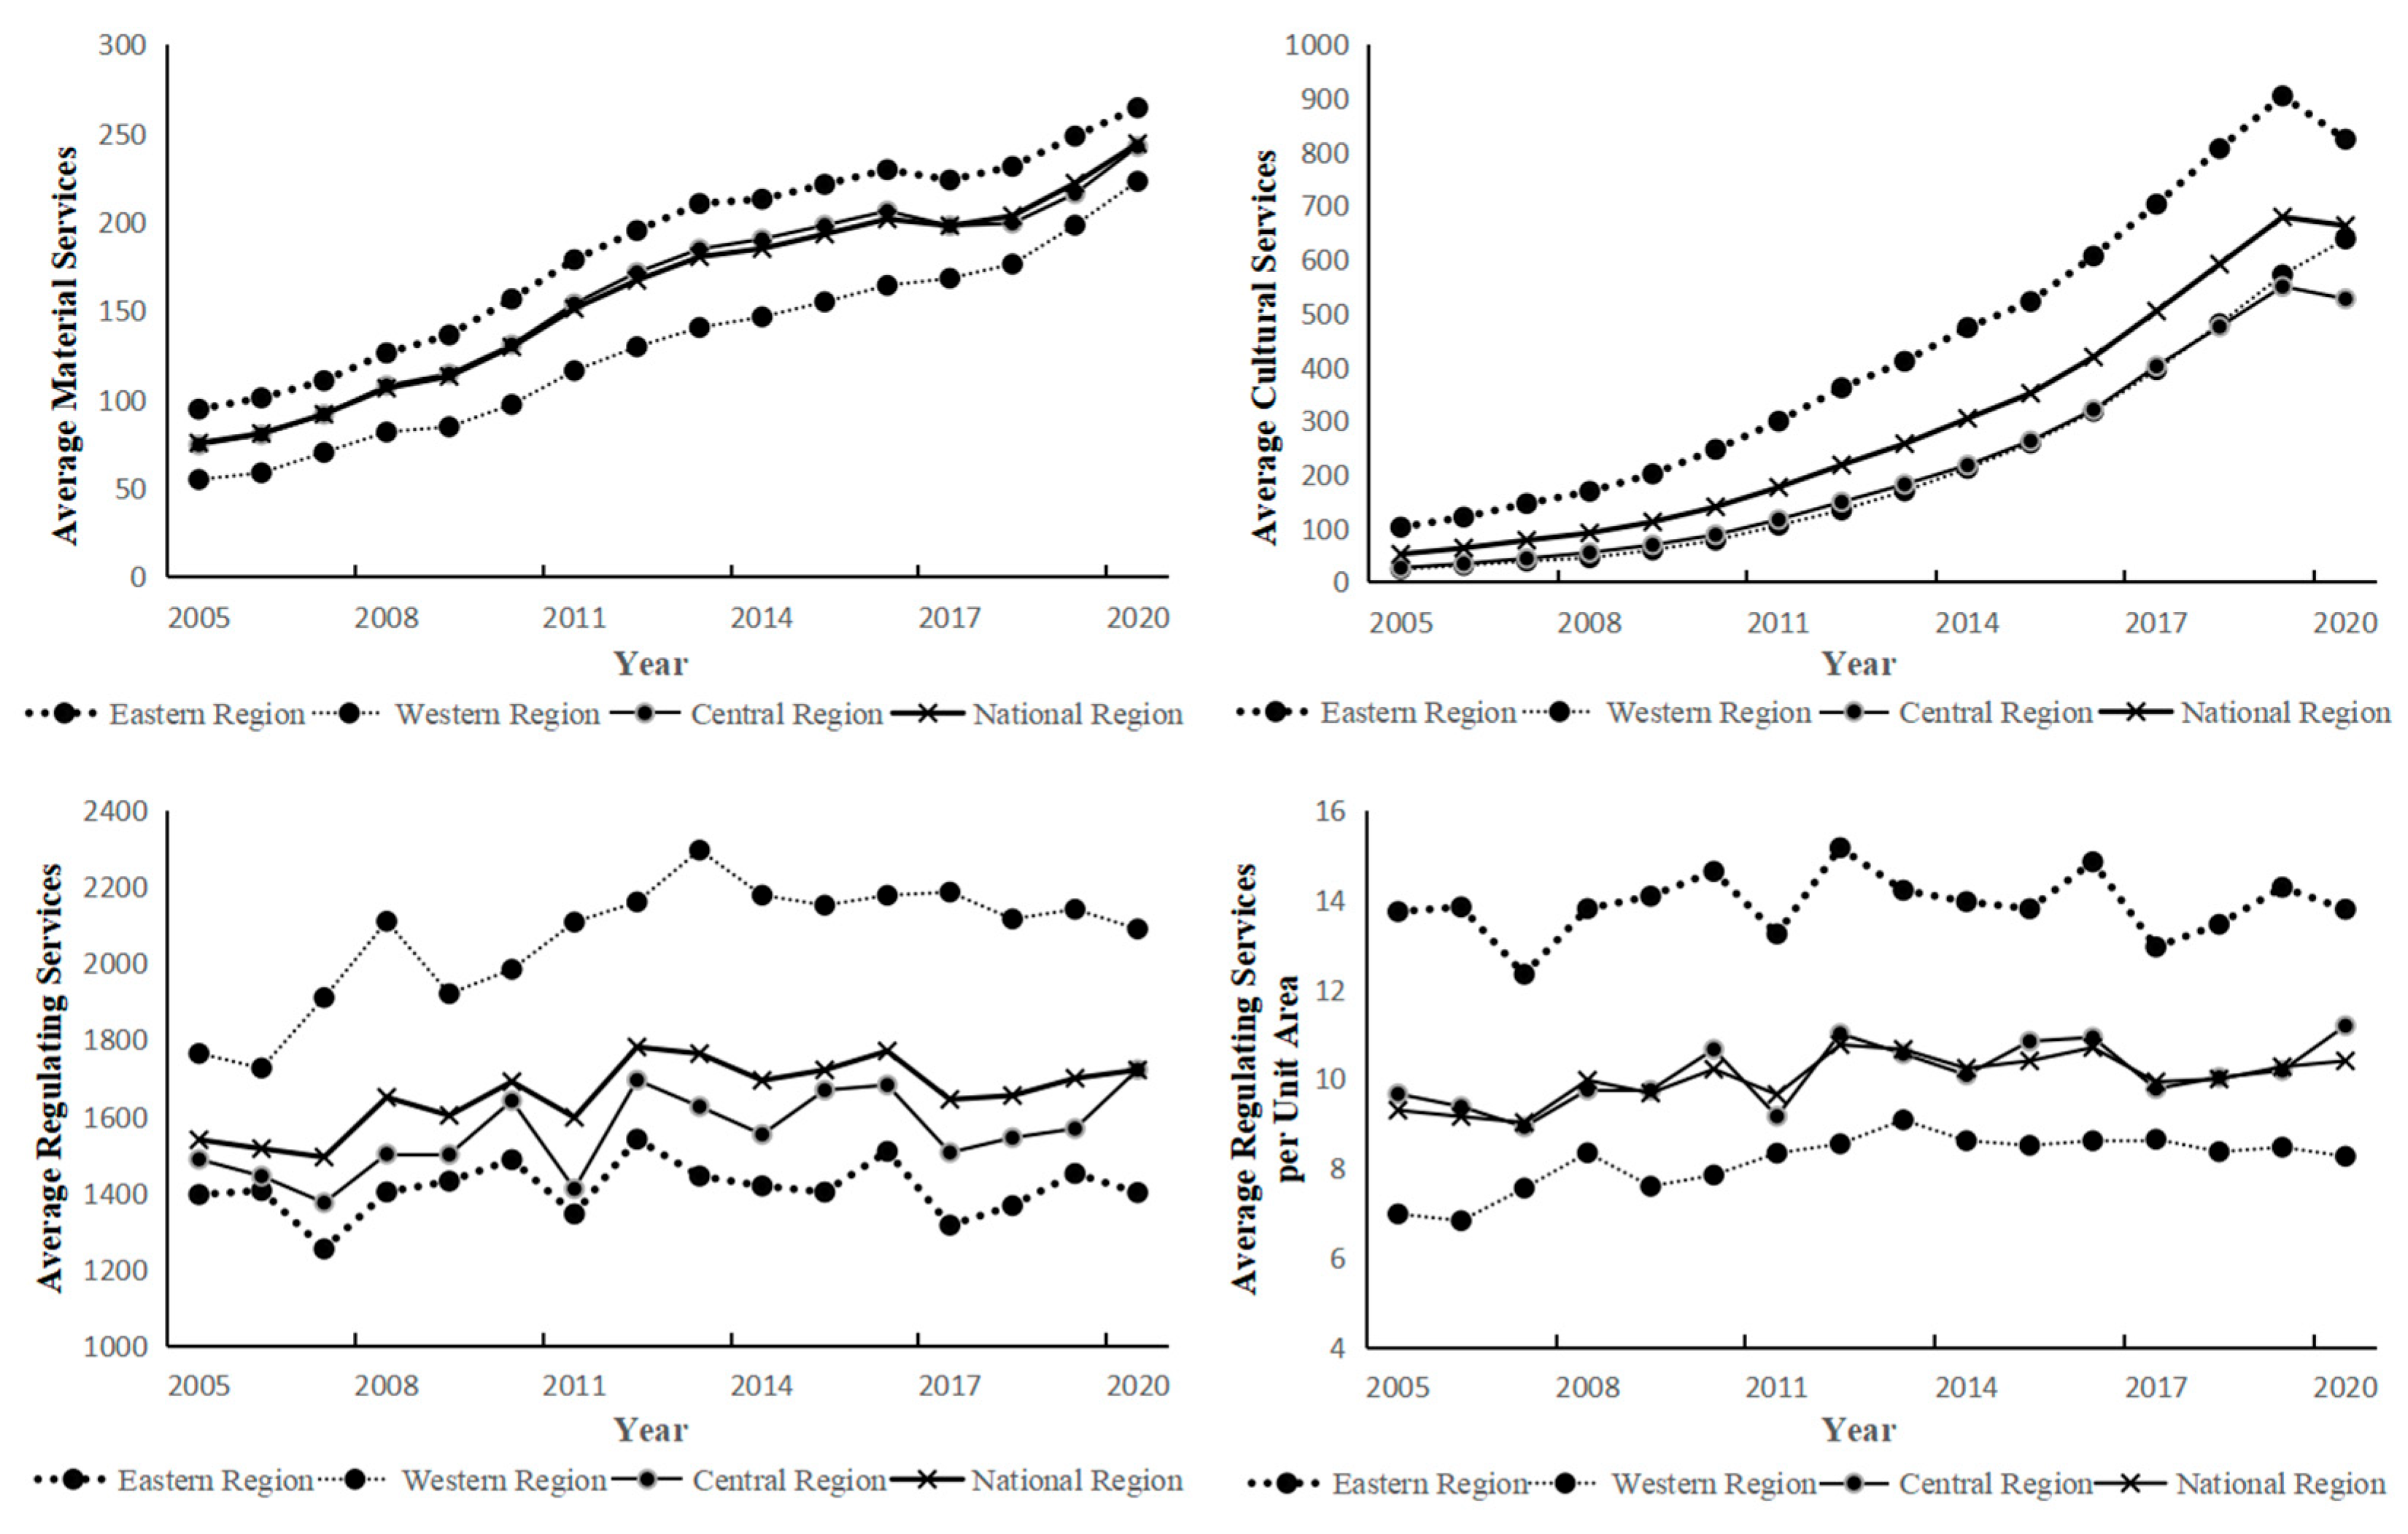
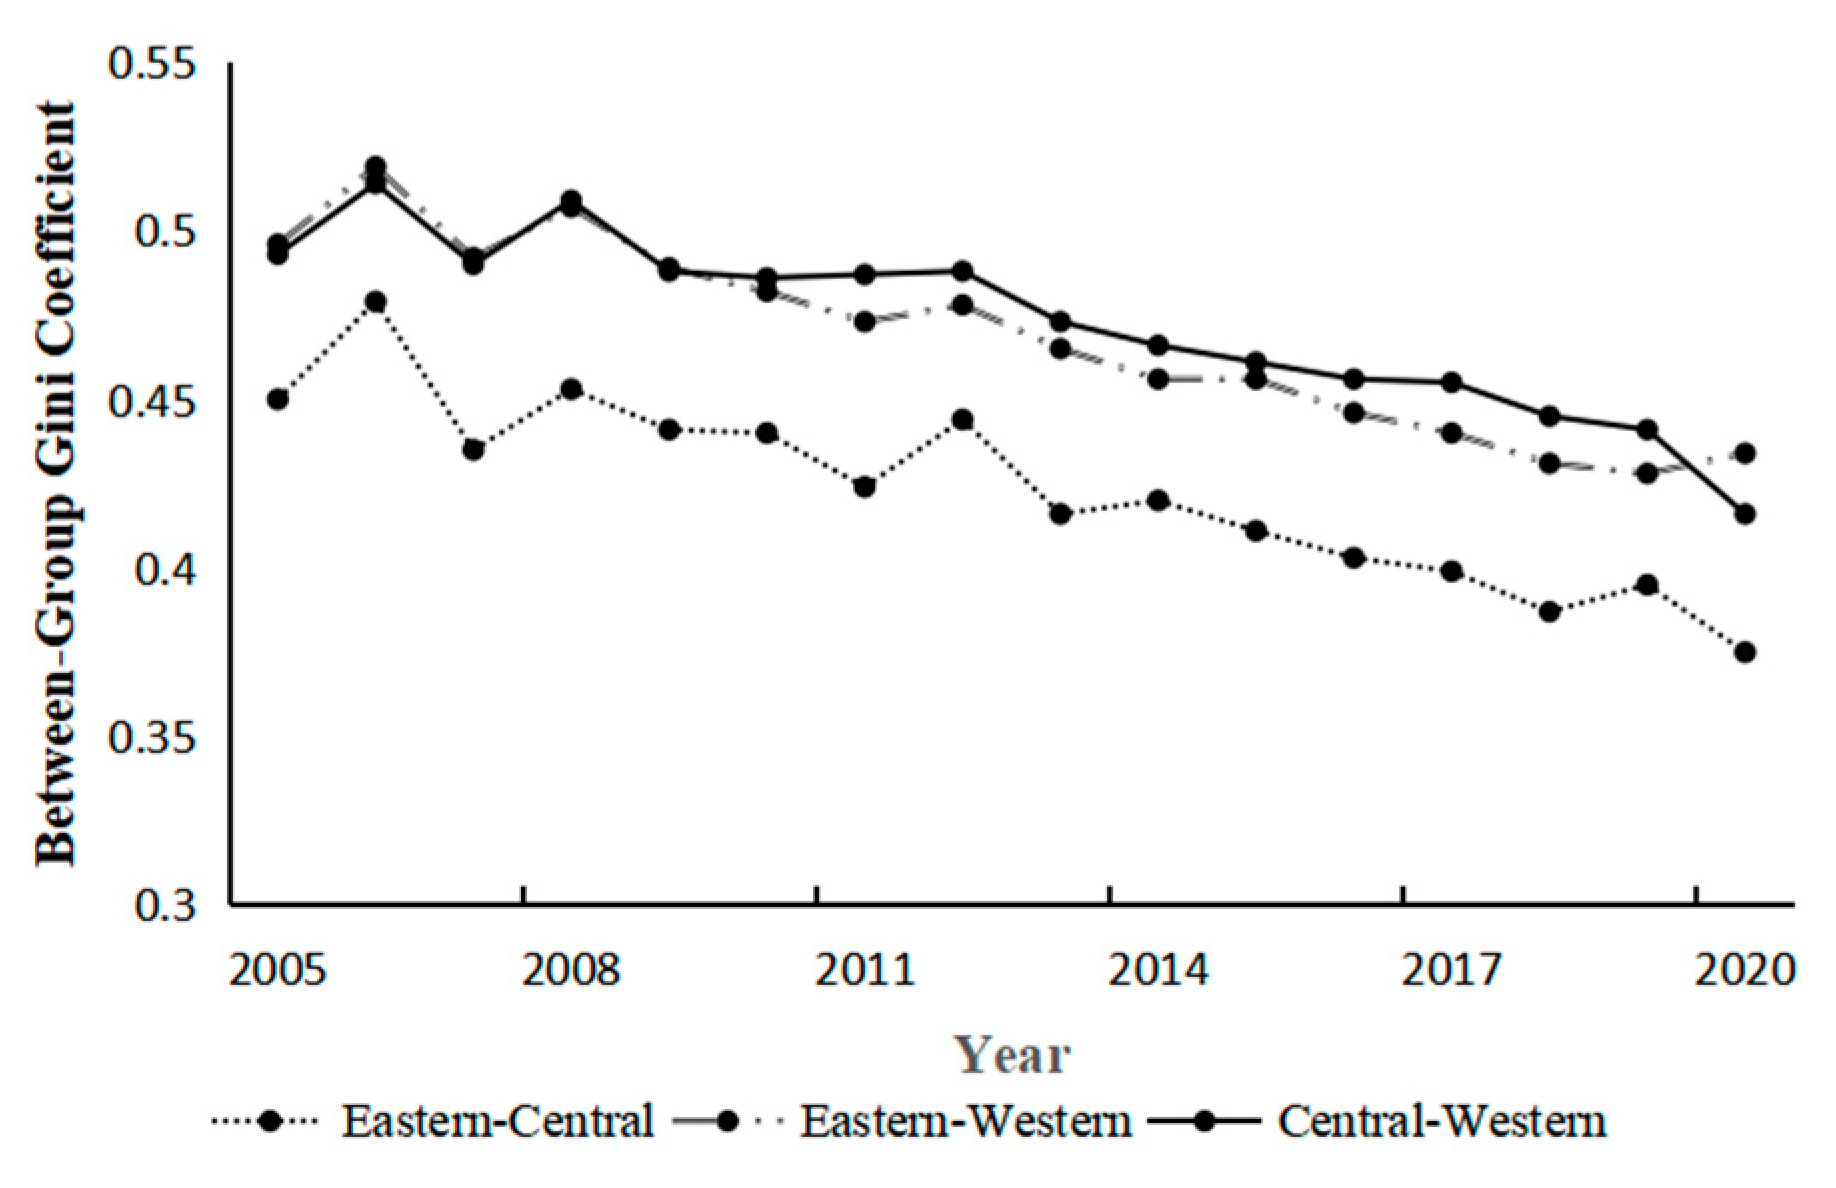
- Regional differences.
3.2. Spatial Econometric Analysis and Robustness Testing
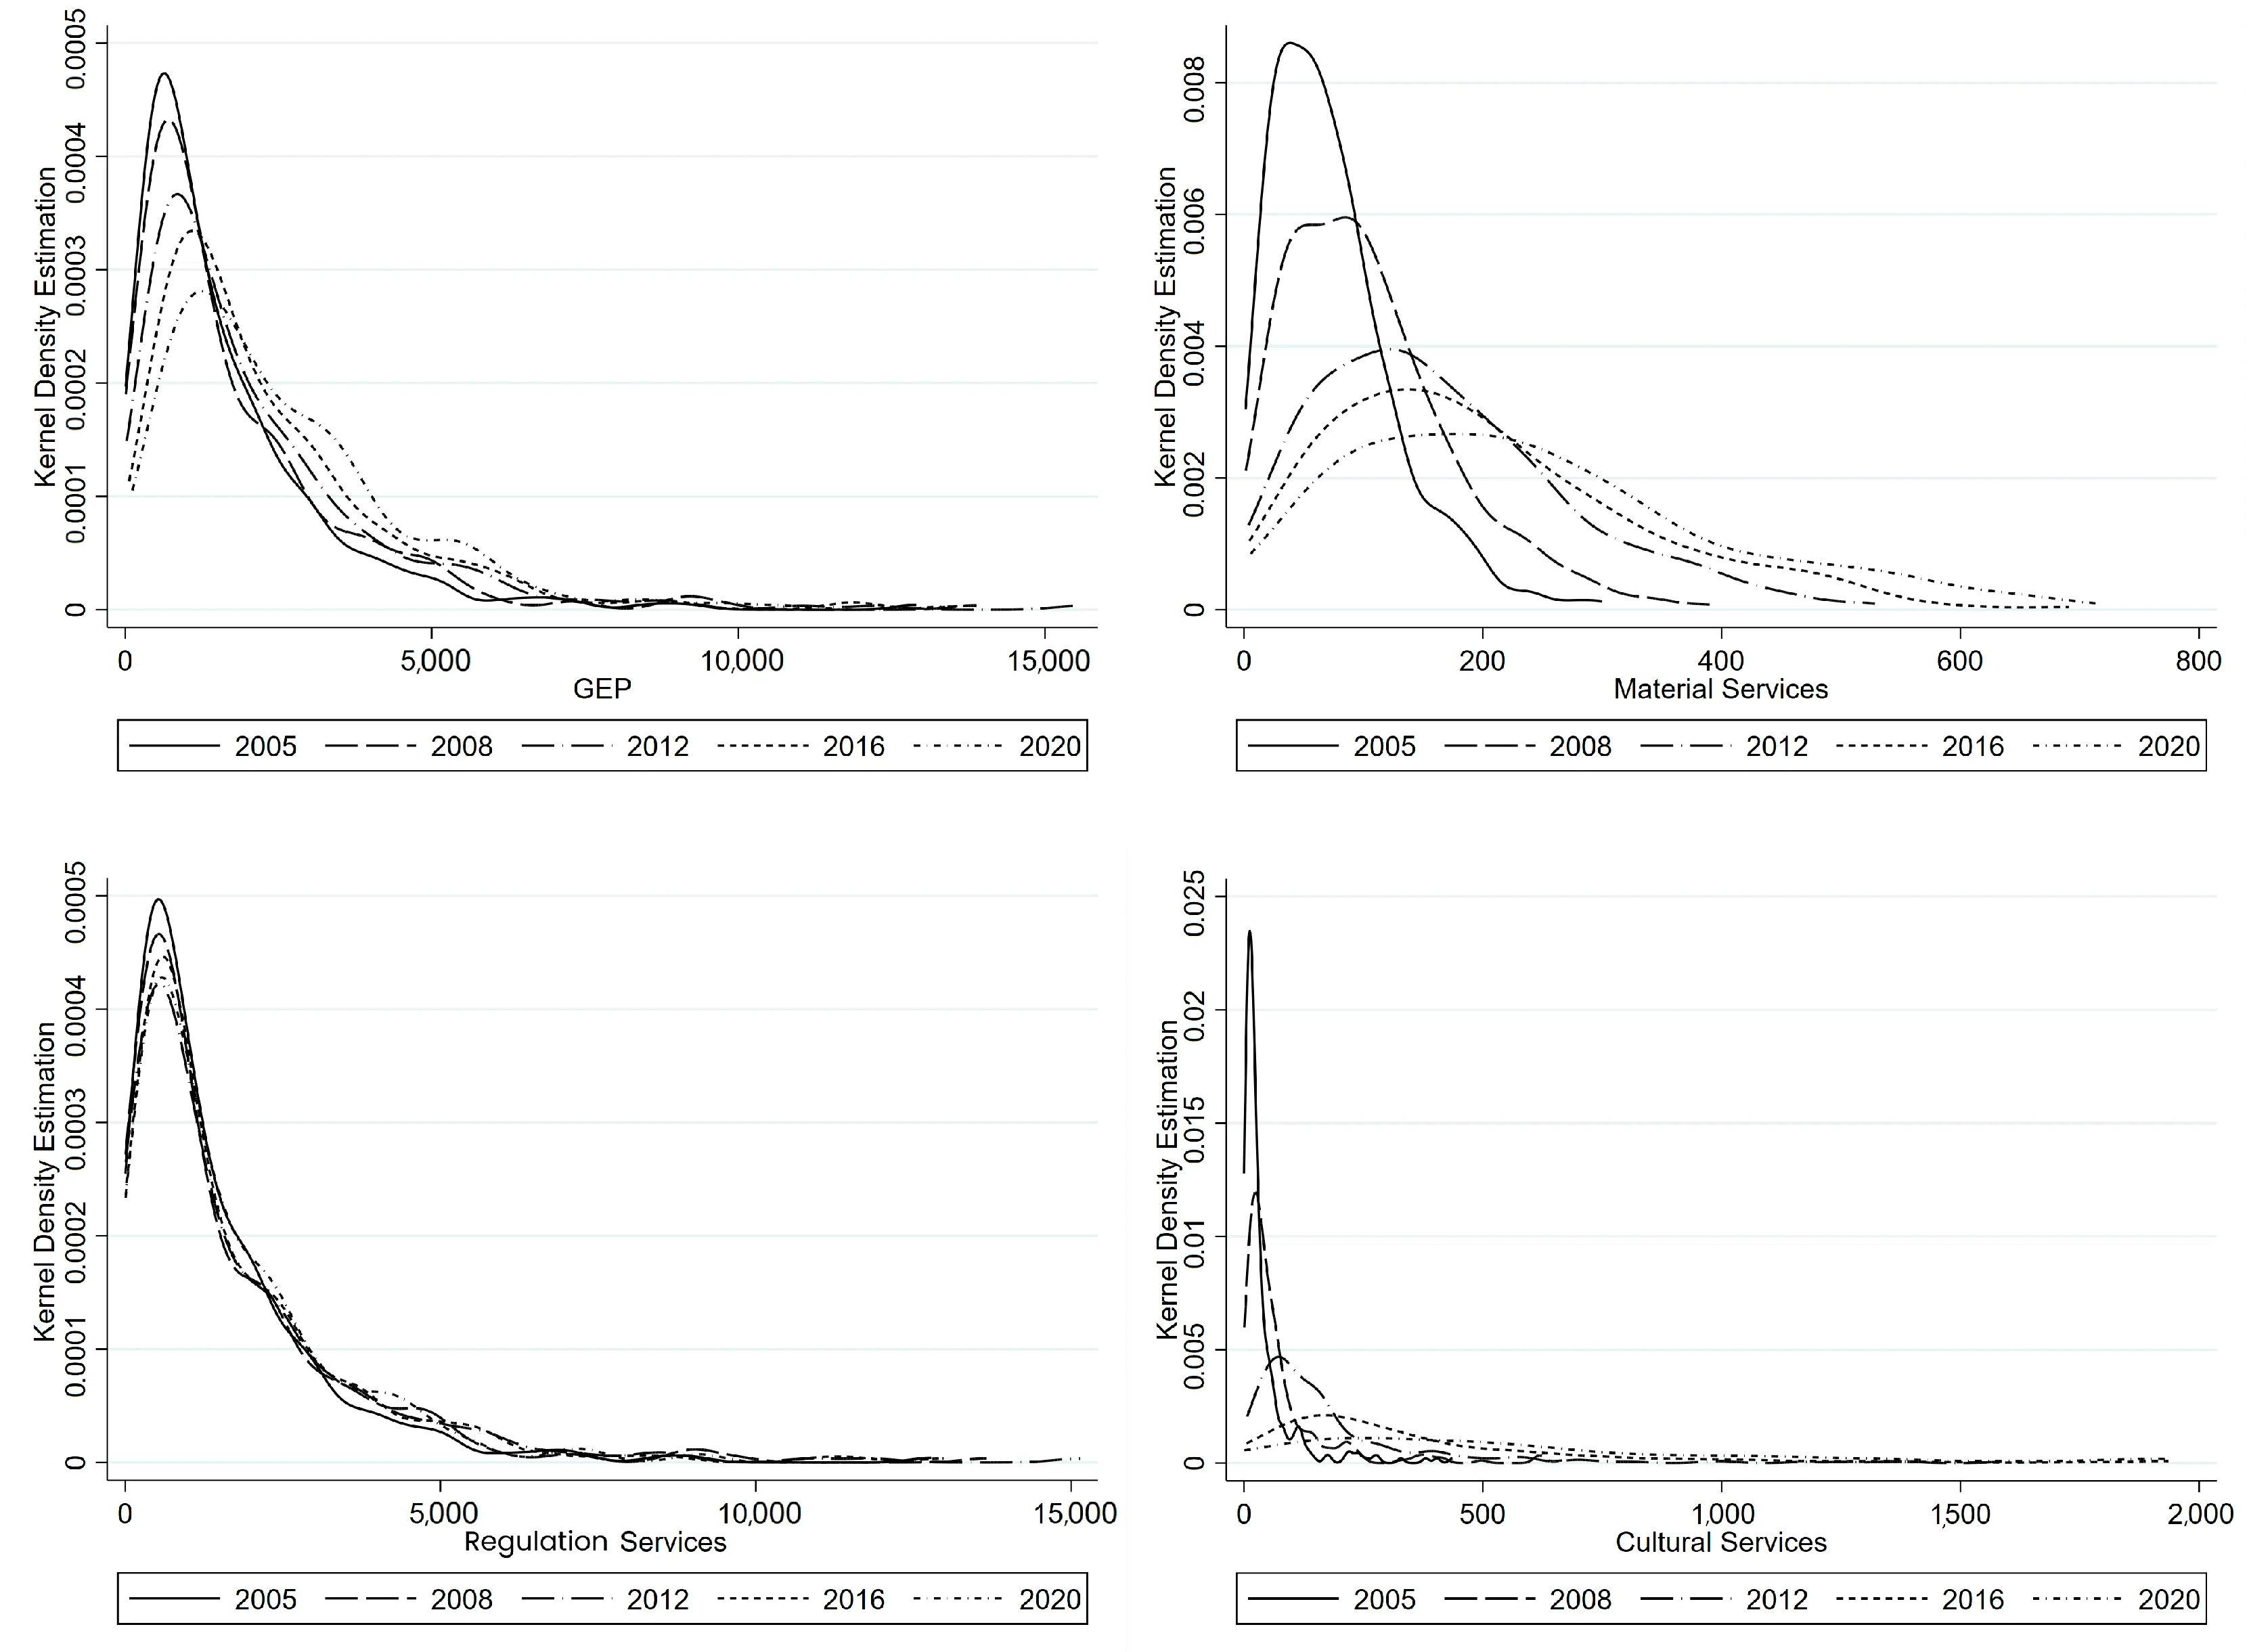
3.2.1. Dynamic Evolution of GEP Based on Kernel Density Estimation
3.2.2. Spatial Correlation of GEP– Based on Spatial Moran’s I
3.3. Driving Mechanisms
3.3.1. Resource Endowment Versus Utilization Efficiency
3.3.2. Dual Constraints of Natural Thresholds and Market Failures
3.3.3. Policy Implementation Gaps
4. Discussion
4.1. Conclusion
4.2. Study Limitations
4.3. Suggestions
Author Contributions
Funding
Institutional Review Board Statement
Informed Consent Statement
Data Availability Statement
Conflicts of Interest
Appendix A
| Indicator | Indicator Description |
|---|---|
| Material Product Supply | Ecosystems in China’s districts and counties provide a wide range of material products including agricultural, forestry, animal husbandry, fishery products, and ecological energy. The biophysical value of these products are derived from the statistical yearbooks of respective districts and counties. The monetary value of material services is determined using the market value method. |
| Water Conservation | Water conservation services refer to the ecosystem’s ability to intercept, store, and infiltrate precipitation, thereby enhancing soil moisture, regulating storm runoff, replenishing groundwater, and increasing the availability of water resources. The biophysical value of water conservation is calculated using the Integrated Valuation of Ecosystem Services and Trade-offs model (InVEST model), specifically its Water Yield module. The monetary value of water conservation, primarily manifested in its economic benefit for water storage and retention, is assessed using the shadow engineering approach. |
| Soil Conservation | Soil conservation involves protecting the soil from erosion, increasing soil resilience, and reducing soil loss through various ecosystem components such as forest canopies, litter, and root systems. The biophysical value of soil conservation is calculated using the InVEST model’s Soil Retention module, which incorporates elevation data, rainfall erosivity factor, soil erodibility factor, land use data, biophysical tables, parameters, and watershed boundaries to generate raster data on potential and actual soil erosion for various ecosystems nationwide. The monetary value of soil conservation is assessed using the replacement cost method, which considers the reduction in non-point source pollution and sediment deposition. |
| Sand Storm Prevention | Sand storm prevention refer to the ecosystem’s ability to mitigate soil loss and sandstorm hazards caused by strong winds. The physical quantity of windbreak and sand fixation is calculated using the Revised Wind Erosion Equation (RWEQ). The value of sand storm prevention is assessed using the restoration cost method, which considers the cost of rehabilitating degraded sandy land or restoring vegetation. |
| Flood Regulation and Storage | Flood regulation and storage refers to the natural ecosystem’s ability to absorb large amounts of precipitation and transit water, store flood peak water volume, reduce and delay flood peaks, thereby mitigating the threats and losses caused by flood peaks during the flood season. This study follows the approach of Wang Liyan et al. (2017) to examine the function of lakes and marshes in regulating and storing floodwater to mitigate flood threats [20]. The physical quantity of flood regulation is calculated based on the area of various ecosystems, using the following formula: This study employs the shadow engineering method, using the construction cost of reservoirs to calculate the monetary value of flood regulation regulation and storage by natural ecosystems: |
| Air Purification | Air purification refers to the ecosystem’s ability to absorb, filter, block, and decompose air pollutants (such as SO2, NOx, particulate matter, etc.), thereby improving the atmospheric environment. In this study, only the ecosystem’s ability to absorb SO2, NOx, and dust are considered to calculate the biophysical value of air purification [7,35,36,37]. This study uses the replacement cost method to calculate the value of air purification by considering the cost of industrial air pollutant treatment [38,39]. |
| Water Purification | Water purification refers to the ability of aquatic ecosystems such as lakes, rivers, and marshes to adsorb, degrade, and transform water pollutants, thereby purifying the aquatic environment. In this study, the purification capacity of ecosystem for COD, total nitrogen and total phosphorus is considered to calculate the biophysical value of water purification [40,41]. Similar to air purification, this study uses the replacement cost method to calculate the monetary value of water purification by considering the cost of water pollutant treatment. |
| Carbon Sequestration | Carbon sequestration refers to the ecosystem’s ability to absorb atmospheric CO2, synthesize organic matter, and store carbon in plants or soils. This study calculates the biophysical value of terrestrial ecosystem carbon sequestration using the Net Ecosystem Productivity (NEP) method [39,42]. The monetary value of ecosystem carbon sequestration can be calculated using the market value method and the carbon market trading price. |
| Oxygen Provision | The oxygen release function of ecosystems refers to the plants’ ability to release oxygen during photosynthesis, thereby maintaining atmospheric oxygen stability and improving the human living environment. This study calculates the biophysical value of oxygen release capacity using the NEP method based on the chemical equation of photosynthesis: The monetary value of ecosystem oxygen provision is calculated using the market value method and the industrial oxygen production price: |
| Climate Regulation | Climate regulation services refer to the ecosystem’s ability to absorb solar energy through vegetation transpiration and water surface evaporation, thereby lowering temperature, increasing air humidity, and improving human living comfort. This study uses the biophysical value of total energy consumed by ecosystem transpiration and evaporation as the physical quantity of climate regulation. This study employs the replacement cost method, using the electricity consumption required for artificial temperature and humidity regulation to calculate the monetary value of ecosystem climate regulation. |
| Tourism and Landscapes | Ecosystems in various districts and counties in China provide humans with the functions of leisure tourism and landscape appreciation. The physical quantity and value of these services are derived from the statistical yearbook data of each district and county. The monetary value of cultural services is calculated using the method of monetary market value and tourism revenue. |
| Function |
Secondary Indicators | Indicator Formula | Formula Description |
|---|---|---|---|
| Material Product Supply | Agricultural; Forestry; Animal Husbandry; Fishery; Other Product; Ecological Energy | represents the biophysical value represents the output (kg) of the i-th product denotes the unit price (CNY/kg) of the i-th product. | |
| Regulation Services | Water Conservation | is the monetary value of water conservation (CNY/a) represents the biophysical value within the assessment area (m3/a) denotes the construction and maintenance cost per unit storage capacity of a reservoir (CNY/m3). | |
| Soil Conservation | is the biophysical value of soil conservation (t/a) R represents the rainfall erosivity factor K denotes the soil erodibility factor L and S are the slope length and steepness factors (dimensionless) C and P are the vegetation cover and management factor and soil conservation practice factor (dimensionless) is the total monetary value of soil conservation (CNY/a) represents the monetary value of reducing sediment deposition (CNY/a) denotes the monetary value of reducing non-point source pollution (CNY/a). | ||
| Sand Storm Prevention | is the biophysical value of sand storm prevention (t/a) WF represents the climatic factor (kg/m) EF denotes the soil erodibility factor, SCF is the soil crusting factor K is the surface roughness factor, C is the vegetation cover factor. is the monetary value of sand storm prevention (CNY/a) denotes the soil bulk density (t/m3) h is the thickness of sand covering the soil (m) C represents the cost of sand control engineering per unit area (CNY/m2). | ||
| Flood Regulation and Storage | = | is the biophysical value of flood regulation and storage (m3) is the flood regulation capacity of lakes (m3) is the flood regulation capacity of marshes (m3). is the total marsh area (km2) h is the soil water storage depth in marsh wetlands ρ is the soil bulk density of marsh wetlands (g/cm3) is the density of water (g/cm3) F is the soil saturated water content of marsh wetlands (dimensionless) E is the natural water content of marsh wetlands before flooding (dimensionless). is the total marsh area (km2) H is the surface water storage height in marsh wetlands is the monetary value of ecosystem flood regulation (CNY) is the construction cost per unit storage capacity of the reservoir | |
| Air Purification | is the biophysical value of air purification capacity of the ecosystem (kg) is the unit area purification capacity of the j-th air pollutant by the i-th type of ecosystem (kg/km2), i represents the ecosystem type (forest, shrubland, grassland; dimensionless) Aᵢ is the area of the i-th type of ecosystem (km2), and j represents the type of air pollutant (SO2, NOx, dust) (dimensionless). is the monetary value of air purification by the ecosystem (CNY) is the treatment cost of the j-th air pollutant (CNY/t) [41,43,44]. | ||
| Water Purification | is the biophysical value of water purification capacity (kg) is the monetary value of water purification by the ecosystem (CNY/a) is the treatment cost of the j-th water pollutant (CNY/t) | ||
| Carbon Sequestration | is the biophysical value of carbon sequestration capacity of the terrestrial ecosystem (t) NEP is calculated based on the NPP and the conversion coefficient provided in the guidelines. is monetary the value of ecosystem carbon sequestration (CNY) is the carbon price | ||
| Oxygen Provision | is the biophysical value of oxygen release capacity of the ecosystem (t·O2) is the carbon sequestration capacity of the terrestrial ecosystem (t·CO2) is the monetary value of ecosystem oxygen provision (CNY/a) is the industrial oxygen production price | ||
| Climate Regulation | is the biophysical value of energy consumed by ecosystem transpiration and evaporation (kW·h) is the energy consumed by ecosystem vegetation transpiration (kW·h) is the energy consumed by wetland ecosystem evaporation (kW·h). is the monetary value of ecosystem climate regulation (CNY/a) is the local electricity price (CNY/kW·h) | ||
| Cultural Services | Tourism and Landscapes | is the monetary value of cultural services (CNY) is the monetary value of tourism (CNY) is the monetary value of landscapes (CNY) |
| Secondary Indicator | Data | Database (Data Source) |
|---|---|---|
| Product Supply | Value-added | China County Statistical Yearbook (County Bureau of Statistics) |
| Water Conservation | Precipitation | Monthly Precipitation and Evapotranspiration Data (National Geographical System Science Data Center) |
| Evapotranspiration | ||
| Root depth | Bedrock Depth Data [45,46,47] | |
| Plant-available water content | World Soil Database (National Tibetan Plateau Data Center) | |
| Land use | CLCD Data (School of Remote Sensing and Information Engineering, Wuhan University) | |
| Watershed boundary | Elevation Data (Geospatial Data Cloud) | |
| Soil Conservation | Slope data | |
| Rainfall erosivity factor | Annual Precipitation Data (National Geographical System Science Data Center) | |
| Soil erodibility factor | World Soil Database (National Tibetan Plateau Data Center) | |
| Land use | CLCD Data (School of Remote Sensing and Information Engineering, Wuhan University) | |
| Watershed boundary | Elevation Data (Geospatial Data Cloud) | |
| Sand Storm Prevention | Wind force factor | Daily Wind Speed Data, Precipitation, Evapotranspiration Data (National Geographical System Science Data Center) |
| Soil moisture | ||
| Snow cover factor | China’s Long Time Series Snow Depth Dataset (National Tibetan Plateau Data Center) | |
| Soil erodibility factor | World Soil Database (National Tibetan Plateau Data Center) | |
| Soil crusting factor | ||
| Vegetation cover factor | China’s Annual Vegetation (NDVI) Data (Chinese Academy of Sciences Resource and Environment Science Data Platform) | |
| Surface roughness factor | Elevation Data (Geospatial Data Cloud) | |
| Flood Regulation and Storage | Lake area | CLCD Data (School of Remote Sensing and Information Engineering, Wuhan University) |
| Lake region | China Lake Records (The Technical Guideline on Gross Ecosystem Product) | |
| Air purification | Forest, shrubland, and grassland area | CLCD Data (School of Remote Sensing and Information Engineering, Wuhan University) |
| Absorption capacity of atmospheric pollutants | Literature [7,35,36,37,47,48,49] | |
| Water Purification | Wetland area | CLCD Data (School of Remote Sensing and Information Engineering, Wuhan University) |
| Absorption capacity of water pollutants | Literature [38,42] | |
| Carbon Sequestration | Net ecosystem productivity (NEP) | Net Primary Productivity (NPP) (Google Earth Engine platform) |
| NPP conversion factor | Conversion Factors of Provinces and Cities (The Technical Guideline on Gross Ecosystem Product) | |
| Oxygen Provision | NEP | Net primary Productivity (NPP) (Google Earth Engine platform) |
| Climate Regulation | Forest, shrubland, and grassland area | CLCD Data (School of Remote Sensing and Information Engineering, Wuhan University) |
| Number of days with max daily temperature above 26 °C | Daily Temperature Data and Monthly Evapotranspiration Data (National Geographical System Science Data Center) | |
| Water surface evaporation | CLCD Data (School of Remote Sensing and Information Engineering, Wuhan University) | |
| Tourism and Landscapes | Tourism revenue | China County Statistical Yearbook (County Bureau of Statistics) |
References
- Costanza, R.; d’Arge, R.; de Groot, R.; Farber, S.; Grasso, M.; Hannon, B.; Limburg, K.; Naeem, S.; O’Neill, R.V.; Paruelo, J.; et al. The Value of the World’s Ecosystem Services and Natural Capital. Nature 1997, 387, 253–260. [Google Scholar] [CrossRef]
- Joshi, A.P.; Joshi, S.; Sudhanshu, R.K.; Pant, D.; Rai, S.; Rawat, A.; Purohit, H. Deciphering Uttarakhand’s human efforts towards the ecology through Gross Environment Product (GEP) calculations. Environ. Sustain. Indic. 2025, 25, 100578. [Google Scholar] [CrossRef]
- Peng, T.; Wu, W. Green GDP Accounting: Further Research and Discussion in the Context of Low-carbon Development. China Popul. Resour. Environ. 2010, 20, 81–86. [Google Scholar]
- Wang, N.; Liu, J.; Wu, D.; Gao, S.; Wang, R. Regional Eco-compensation based on Ecosystem Service Assessment: A Case Study of Shandong Province. Acta Ecol. Sin. 2010, 30, 6646–6653. [Google Scholar]
- Ma, G.; Yu, F.; Wang, J.; Zhou, X.; Yuan, J.; Mou, X.; Zhou, Y.; Yang, W.; Peng, F. Measuring Gross Ecosystem Product (GEP) of 2015 for Terrestrial Ecosystems in China. China Environ. Sci. 2017, 37, 1474–1482. [Google Scholar]
- Wang, J.; Ma, G.; Yu, F.; Peng, F.; Yang, W.; Zhou, X.; Zhou, Y.; Zhao, X. Study on China’s Gross Economic-ecological Product Accounting in 2015. China Popul. Resour. Environ. 2018, 28, 1–7. [Google Scholar]
- Wu, Y.; Kang, W.; Guo, Q.; Wang, W. Functional Value of Absorption and Purgation to Atmospheric Pollutants of Urban Forest in Guangzhou. Sci. Silvae Sin. 2009, 45, 42–48. [Google Scholar]
- Dagum, C. Decomposition and interpretation of Gini and the generalized entropy inequality measures. Statistica 1997, 57, 295–308. [Google Scholar]
- Ma, T.; Liu, Y.; Yang, M. Spatial-temporal heterogeneity for commercial building carbon emissions in China: Based the Dagum Gini coefficient. Sustainability 2022, 14, 5243. [Google Scholar] [CrossRef]
- Bosch, J.M.; Hewlett, J.D. A Review of Catchment Experiments to Determine the Effect of Vegetation Changes on Water Yield and Evapotranspiration. J. Hydrol. 1982, 55, 3–23. [Google Scholar] [CrossRef]
- Zhou, G.; Wei, X.; Chen, X.; Zhou, P.; Liu, X.; Xiao, Y.; Sun, G.; Scott, D.F.; Zhou, S.; Han, L.; et al. Global Pattern for the Effect of Climate and Land Cover on Water Yield. Nat. Commun. 2015, 6, 5918. [Google Scholar] [CrossRef] [PubMed]
- Stuerck, J.; Poortinga, A.; Verburg, P.H. Mapping Ecosystem Services: The Supply and Demand of Flood Regulation Services in Europe. Ecol. Indic. 2014, 38, 198–211. [Google Scholar] [CrossRef]
- Nedkov, S.; Burkhard, B. Flood Regulating Ecosystem Services—Mapping Supply and Demand, in the Etropole Municipality, Bulgaria. Ecol. Indic. 2012, 21, 67–79. [Google Scholar] [CrossRef]
- Bennett, H.H. Soil Conservation, 1st ed.; McGraw-Hill Book Company: New York, NY, USA, 1939; pp. 1–993. [Google Scholar]
- Lal, R. Soil Conservation and Ecosystem Services. Int. Soil Water Conserv. Res. 2014, 2, 36–47. [Google Scholar] [CrossRef]
- Huang, J.; Wang, H.; Dai, Q.; Han, D. Analysis of NDVI Data for Crop Identification and Yield Estimation. IEEE J. Sel. Top. Appl. Earth Obs. Remote Sens. 2017, 7, 4374–4384. [Google Scholar] [CrossRef]
- Huang, J.; Wang, X.; Li, X.; Tian, H.; Pan, Z. Remotely Sensed Rice Yield Prediction Using Multi-Temporal NDVI Data Derived from NOAA’s-AVHRR. PLoS ONE 2013, 8, e70816. [Google Scholar] [CrossRef]
- Cramer, W.; Kicklighter, D.W.; Bondeau, A.; Iii, B.M.; Churkina, G.; Nemry, B.; Ruimy, A.; Schloss, A.L.; ThE Participants OF ThE Potsdam NpP Model Intercomparison. Comparing Global Models of Terrestrial Net Primary Productivity (NPP): Overview and Key results. Glob. Change Biol. 1999, 5 (Suppl. S1), iii–iv. [Google Scholar] [CrossRef]
- Dong, T.; Zhang, L.; Xiao, Y.; Zheng, H.; Huang, B.; Ouyang, Z. Assessment of Ecological Assets and Gross Ecosystem Product Value in Ordos City. Acta Ecologica Sinica 2019, 39, 3062–3074. [Google Scholar]
- Wang, L.; Yi, X.; Zhiyun, O.; Qin, W.; Wenjing, B.; Jian, Z.; Ling, R. Gross Ecosystem Product Accounting in the National Key Ecological Function Area:an Example of Arxan. China Popul. Resour. Environ. 2017, 27, 146–154. [Google Scholar]
- Cai, Q.; Fang, D.; Chen, B. Social vulnerability assessment for air pollution in China. Environ. Impact Assess. Rev. 2025, 114, 107925. [Google Scholar] [CrossRef]
- Terrell, G.R.; Scott, D.W. Variable kernel density estimation. Ann. Stat. 1992, 20, 1236–1265. [Google Scholar] [CrossRef]
- Anselin, L. Local indicators of spatial association—LISA. Geogr. Anal. 1995, 27, 93–115. [Google Scholar] [CrossRef]
- Liu, J.; Li, S.; Ouyang, Z.; Tam, C.; Chen, X. Ecological and socioeconomic effects of China’s policies for ecosystem services. Proc. Natl. Acad. Sci. USA 2008, 105, 9477–9482. [Google Scholar] [CrossRef]
- Fu, B.; Wang, S.; Liu, Y.; Liu, J.; Liang, W.; Miao, C. Hydrogeomorphic ecosystem responses to natural and anthropogenic changes in the Loess Plateau of China. Annu. Rev. Earth Planet. Sci. 2017, 45, 223–243. [Google Scholar] [CrossRef]
- Zhu, Z.; Ren, J.; Liu, X. Green infrastructure provision for environmental justice: Application of the equity index in Guangzhou, China. Urban For. Urban Green. 2019, 46, 126443. [Google Scholar] [CrossRef]
- Auty, R. Sustaining Development in Mineral Economies: The Resource Curse Thesis, 3rd ed.; Routledge: London, UK, 2002; pp. 1–288. [Google Scholar]
- Sachs, J.D.; Warner, A.M. The curse of natural resources. Eur. Econ. Rev. 2001, 45, 827–838. [Google Scholar] [CrossRef]
- Liu, J.; Raven, P.H. China’s environmental challenges and implications for the world. Crit. Rev. Environ. Sci. Technol. 2010, 40, 823–851. [Google Scholar] [CrossRef]
- Bryan, B.A.; Gao, L.; Ye, Y.; Sun, X.; Connor, J.D.; Crossman, N.D.; Stafford-Smith, M.; Wu, J.; He, C.; Yu, D.; et al. China’s response to a national land-system sustainability emergency. Nature 2018, 559, 193–204. [Google Scholar] [CrossRef]
- Rockström, J.; Steffen, W.; Noone, K.; Persson, Å.; Chapin, F.S., III; Lambin, E.; Lenton, T.M.; Scheffer, M.; Folke, C.; Schellnhuber, H.J.; et al. Planetary boundaries: Exploring the safe operating space for humanity. Ecol. Soc. 2009, 14, 32. [Google Scholar] [CrossRef]
- Daily, G.C.; Polasky, S.; Goldstein, J.; Kareiva, P.M.; Mooney, H.A.; Pejchar, L.; Ricketts, T.H.; Salzman, J.; Shallenberger, R. Ecosystem services in decision making: Time to deliver. Front. Ecol. Environ. 2009, 7, 21–28. [Google Scholar] [CrossRef]
- Liu, Y.; Li, Y. Revitalize the world’s countryside. Nature 2017, 548, 275–277. [Google Scholar] [CrossRef] [PubMed]
- Lo, K. Ecological civilization, authoritarian environmentalism, and the eco-politics of extractive governance in China. Extr. Ind. Soc. 2020, 7, 1029–1035. [Google Scholar] [CrossRef]
- Han, S.Y.; Tian, D.L.; Yan, W.D.; Liang, X.C.; Wang, G.J.; Zhu, F. Evaluation of Eco-service Functions of Major Forest Types in Hunan Province. J. Cent. South Univ. For. Technol. 2009, 29, 6–13. [Google Scholar]
- Zhao, Y.; Li, S.; Yan, Z. The Effect of Greenland on Absorbed Dust and Its Assessment Method. J. Huazhong Agric. Univ. 2002, 6, 582–586. [Google Scholar]
- Jia, J.; Luo, W.; Du, T.; Li, Z.; Lu, Y. Valuation of Changes of Ecosystem Services of Tai Lake in Recent 10 years. Acta Ecol. Sin. 2015, 35, 2255–2264. [Google Scholar]
- Zhang, B.; Gao, J.; Xie, G.; Wang, Y. Preliminary Evaluation of Air Temperature Reduction of Urban Green Spaces in Beijing. Acta Ecol. Sin. 2012, 32, 7698–7705. [Google Scholar] [CrossRef][Green Version]
- Li, G.; Zhao, W.; Wei, Y.; Fang, X.; Gao, B.; Dai, L. Evaluation on the Influence of Natural Forest Protection Program on Forest Ecosystem Service Function in Changbai Mountain. Acta Ecol. Sin. 2015, 35, 984–992. [Google Scholar]
- Zhou, Z.; Li, J.; Feng, X. The Value of Fixing Carbon and Releasing Oxygen in the Guanzhong-Tianshui Economic Region using GIS. Acta Ecol. Sin. 2013, 33, 2907–2918. [Google Scholar] [CrossRef]
- Baskent, E.Z.; Borges, J.G.; Kašpar, J.; Tahri, M. A design for addressing multiple ecosystem services in forest management planning. Forests 2020, 11, 1108. [Google Scholar] [CrossRef]
- Yan, F.; Shangguan, W.; Zhang, J.; Hu, B. Depth-to-bedrock Map of China at a Spatial Resolution of 100 Meters. Sci. Data 2020, 7, 2. [Google Scholar] [CrossRef]
- Suding, K.; Spotswood, E.; Chapple, D.; Beller, E.; Gross, K. Ecological dynamics and ecological restoration. In Foundations of Restoration Ecology; Island Press: Washington, DC, USA, 2016; pp. 27–56. [Google Scholar]
- Jin, X.; Fang, D.; Chen, B.; Wang, H. Multiobjective layout optimization for low impact development considering its ecosystem services. Resour. Conserv. Recycl. 2024, 209, 107794. [Google Scholar] [CrossRef]
- Li, Q.; Sun, G. Study on Annual Changes and Synchronousness of Atmosphere Pollution Reduction by Woodland and Grassland in Xi’an. Syst. Sci. Compr. Stud. Agric. 2008, 1, 73–77. [Google Scholar]
- Cai, Q.; Fang, D.; Chen, B. Ecological network analysis for urban physical-virtual water cycle: A case study of Beijing. Ecol. Model. 2025, 501, 110972. [Google Scholar] [CrossRef]
- Jin, X.; Jiang, W.; Fang, D.; Wang, S.; Chen, B. Evaluation and driving force analysis of the water-energy-carbon nexus in agricultural trade for RCEP countries. Appl. Energy 2024, 353, 122143. [Google Scholar] [CrossRef]
- Yuan, Z.; Tian, D.; Yuan, H. Research on SO2 Cleansing Ability of the Air of Forest Biology System and Sabsorbed Potential. Hunan For. Sci. Technol. 2005, 1, 1–4. [Google Scholar]
- Ma, X.; Sun, G.; Ren, Z. The Values of Vegetation Purified Air and Its Measure in Xin’an City. J. Arid. Land Resour. Environ. 2002, 4, 83–86. [Google Scholar]




| Year | GEP | GDP | Material Product Supply | Regulation Services | Cultural Services |
|---|---|---|---|---|---|
| 2005 | 47.17 | 18.60 | 2.14 | 43.55 | 1.48 |
| 2008 | 52.31 | 32.12 | 3.01 | 46.70 | 2.60 |
| 2011 | 54.49 | 48.34 | 4.28 | 45.21 | 5.00 |
| 2014 | 61.81 | 64.44 | 5.24 | 47.95 | 8.62 |
| 2015 | 64.14 | 68.56 | 5.47 | 48.72 | 9.95 |
| 2017 | 66.41 | 83.09 | 5.60 | 46.54 | 14.27 |
| 2020 | 74.40 | 100.55 | 6.91 | 48.72 | 18.77 |
| Year | Forest Ecosystem | Wetland Ecosystem | Grassland Ecosystem | Farmland Ecosystem | ||||
|---|---|---|---|---|---|---|---|---|
| Monetary Value | Area | Monetary Value | Area | Monetary Value | Area | Monetary Value | Area | |
| 2005 | 34.53 | 229.95 | 4.44 | 13.74 | 3.91 | 191.52 | 0.61 | 287.18 |
| 2008 | 38.08 | 231.71 | 3.87 | 14.03 | 4.07 | 189.34 | 0.60 | 287.31 |
| 2011 | 36.76 | 232.55 | 3.58 | 14.25 | 4.34 | 188.73 | 0.46 | 286.23 |
| 2014 | 39.39 | 231.67 | 3.90 | 14.44 | 4.03 | 190.19 | 0.56 | 283.84 |
| 2017 | 39.11 | 233.60 | 4.71 | 14.41 | 4.10 | 188.44 | 0.70 | 281.93 |
| 2020 | 34.53 | 229.95 | 4.44 | 13.74 | 3.91 | 191.52 | 0.61 | 287.18 |
| Province | GEP | Regulation Services | Value per Area | Province | GEP | Regulation Services | Value per Area |
|---|---|---|---|---|---|---|---|
| Beijing | 4.76 | 1.31 | 7.57 | Hubei | 25.42 | 20.01 | 13.97 |
| Tianjin | 0.41 | 0.23 | 3.04 | Hunan | 41.17 | 35.18 | 19.60 |
| Hebei | 15.50 | 9.47 | 4.94 | Guangdong | 28.37 | 25.67 | 3.44 |
| Shanxi | 0.58 | 0.45 | 1.64 | Guangxi | 58.63 | 53.21 | 25.39 |
| Inner Mongolia | 55.57 | 46.35 | 29.64 | Hainan | 0.73 | 0.53 | 27.82 |
| Liaoning | 15.78 | 10.45 | 6.68 | Chongqing | 1.70 | 1.36 | 2.57 |
| Jilin | 11.28 | 8.42 | 5.09 | Sichuan | 29.10 | 21.03 | 11.69 |
| Heilongjiang | 25.44 | 22.04 | 4.91 | Guizhou | 8.85 | 6.45 | 12.21 |
| Shanghai | 3.26 | 0.35 | 7.01 | Yunnan | 31.35 | 28.68 | 16.45 |
| Jiangsu | 19.12 | 9.04 | 9.23 | Tibet | 11.51 | 8.19 | 5.12 |
| Zhejiang | 28.62 | 20.68 | 21.98 | Shaanxi | 20.69 | 17.21 | 8.46 |
| Anhui | 20.92 | 15.64 | 12.00 | Gansu | 10.16 | 8.79 | 2.24 |
| Fujian | 34.77 | 30.45 | 27.82 | Qinghai | 2.29 | 0.25 | 2.45 |
| Jiangxi | 40.61 | 35.82 | 23.47 | Ningxia | 0.66 | 0.34 | 1.38 |
| Shandong | 18.10 | 9.33 | 6.04 | Xinjiang | 14.91 | 12.05 | 15.64 |
| Henan | 17.45 | 10.48 | 6.57 |
| Year | Proximity Weight Matrix | Distance Weight Matrix | ||
|---|---|---|---|---|
| I | Z | I | Z | |
| 2005 | 0.425 *** | 10.646 | 0.084 *** | 0.005 |
| 2006 | 0.481 *** | 11.984 | 0.102 *** | 0.005 |
| 2007 | 0.357 *** | 9.099 | 0.066 *** | 0.005 |
| 2008 | 0.441 *** | 11.056 | 0.089 *** | 0.005 |
| 2009 | 0.449 *** | 11.166 | 0.092 *** | 0.005 |
| 2010 | 0.431 *** | 10.788 | 0.085 *** | 0.005 |
| 2011 | 0.374 *** | 9.48 | 0.067 *** | 0.005 |
| 2012 | 0.429 *** | 10.735 | 0.085 *** | 0.005 |
| 2013 | 0.395 *** | 9.956 | 0.075 *** | 0.005 |
| 2014 | 0.379 *** | 9.572 | 0.077 *** | 0.005 |
| 2015 | 0.382 *** | 9.642 | 0.076 *** | 0.005 |
| 2016 | 0.391 *** | 9.806 | 0.083 *** | 0.005 |
| 2017 | 0.367 *** | 9.254 | 0.078 *** | 0.005 |
| 2018 | 0.353 *** | 8.892 | 0.071 *** | 0.005 |
| 2019 | 0.375 *** | 9.408 | 0.079 *** | 0.005 |
| 2020 | 0.349 *** | 8.809 | 0.078 *** | 0.005 |
Disclaimer/Publisher’s Note: The statements, opinions and data contained in all publications are solely those of the individual author(s) and contributor(s) and not of MDPI and/or the editor(s). MDPI and/or the editor(s) disclaim responsibility for any injury to people or property resulting from any ideas, methods, instructions or products referred to in the content. |
© 2025 by the authors. Licensee MDPI, Basel, Switzerland. This article is an open access article distributed under the terms and conditions of the Creative Commons Attribution (CC BY) license (https://creativecommons.org/licenses/by/4.0/).
Share and Cite
Yu, X.; Yang, H.; Shi, Y. Theoretical Connotation and Measurement Indicator System of Ecological Green Development Level in China. Sustainability 2025, 17, 4451. https://doi.org/10.3390/su17104451
Yu X, Yang H, Shi Y. Theoretical Connotation and Measurement Indicator System of Ecological Green Development Level in China. Sustainability. 2025; 17(10):4451. https://doi.org/10.3390/su17104451
Chicago/Turabian StyleYu, Xi, Hanshuo Yang, and Yao Shi. 2025. "Theoretical Connotation and Measurement Indicator System of Ecological Green Development Level in China" Sustainability 17, no. 10: 4451. https://doi.org/10.3390/su17104451
APA StyleYu, X., Yang, H., & Shi, Y. (2025). Theoretical Connotation and Measurement Indicator System of Ecological Green Development Level in China. Sustainability, 17(10), 4451. https://doi.org/10.3390/su17104451


