Article

Has Climate Change Affected the Occurrence of Compound Heat Wave and Heavy Rainfall Events in Poland?

by
Joanna Wibig
* and
Joanna Jędruszkiewicz
Department of Meteorology and Climatology, University of Łódź, 90-139 Łódź, Poland
*
Author to whom correspondence should be addressed.
Sustainability 2025, 17(10), 4447; https://doi.org/10.3390/su17104447
Submission received: 31 March 2025 / Revised: 26 April 2025 / Accepted: 9 May 2025 / Published: 14 May 2025

Abstract

:
In the recent decades, an ongoing increase in maximum temperature during summer has been observed in Poland, especially in the central-southern and southeastern areas. This raises the vulnerability of these regions not only to heat waves and drought but also to floods. The potential effect of compound heat waves and extreme rainfall events may be more serious than the effects of these events occurring separately. This research is the first attempt in Poland to investigate whether the presence of a heat wave increases the likelihood of extreme rainfall events, if so, by how much, and whether this changes with warming. For this purpose, we used daily maximum temperature values and 6 h precipitation datasets from 44 meteorological stations in Poland for the 1966–2024 period. It was proven that compound heat wave and extreme rainfall events occurred in Poland with spatially differentiated frequency. They occurred the least frequently on the coast and the most frequently in southwestern, southeastern, and northeastern Poland. The extreme rainfall occurred most often between noon and midnight on the last heat wave day. During these hours, the likelihood of extreme rainfall is, on average, 3.5 times higher than that expected according to climatology norms. With warming, the frequency of days with these compound events increases at the rate of 1.22 days per decade, and the frequency of compound events increases at a rate of 3.75 events per decade. Although a detailed analysis of the mechanisms responsible for such events is planned for further research, the preliminary study revealed that in most cases, the approach of a cold front with a mesoscale thundercloud system was responsible for heat wave termination with extreme rainfall. Since we cannot prevent the growing number of heat waves or heavy precipitation events that terminate the heat wave events in Poland, the adaptation strategy needs to be implemented to meet the sustainable development goals regarding climate actions. This refers primarily to urban planning, agriculture (agroecosystems), social health, and well-being.

1. Introduction

The expected future warming in Europe carries major implications for climate and weather extremes, such as more frequent, prolonged, and severe heat waves or heavier rainfall in one place and more severe and prolonged droughts in another [1,2]. The impacts of extreme weather events are often exacerbated, since these events do not occur in isolation. We refer to them as compound weather and/or climate events. The IPCC SREX [3] defines compound events as follows:
“In climate science, compound events can be (1) two or more extreme events occurring simultaneously or successively, (2) combinations of extreme events with underlying conditions that amplify the impact of the events, or (3) combinations of events that are not themselves extremes but lead to an extreme event or impact when combined. The contributing events can be of similar (clustered multiple events) or different type(s)”.
The effect of such a combination contributes to a significant increase in societal or environmental risk. Even though a considerable number of climate-related disasters result from compound events, the understanding, analysis, quantification, and prediction of such events are still in their infancy [4].
Over the last two decades, numerous studies have indicated strong links between the occurrence of heat waves and drought periods in the United States [5], India [6], Europe [7,8], and Poland [9]. The explanation of the physical mechanism leading to such a compound extreme event was proposed by Refs. [10,11,12]. They stated that the high co-occurrence of heat waves and droughts is caused by feedback between the availability of moisture in the soil and vegetation and the exchange of sensible and latent heat.
The possible relationship between heat waves and heavy rainfall as a compound event has rarely been raised. However, recent studies have suggested an increased probability of heavy rainfall in mid-latitudes, if preceded by a heat wave. This has been observed in Australia, India, Western and Central Europe, the United States [13,14], and China [15], exemplifying a sequential compound extreme event when a heat wave precedes heavy rainfall. Such situations can be attributed to the fact that more precipitation can be expected in warmer air due to its greater capacity for water vapor [16,17,18]. Wibig and Piotrowski [19] have shown that this has also been observed in Poland.
It has been hypothesized that rainfall following a heat wave may be greater (more intense) than the average [15,20]. Sauter et al. [14] have analyzed the probability of high-intensity one-hour rainfall occurring immediately after a heat wave. They have found the strongest relationships in Central Europe (Germany, Belgium) and Japan, where the probability of heavy rainfall following a heat wave increases by about four times compared to that expected by climatology norms. Additionally, they suggested that this relationship can be the strongest in temperate and colder climates.
Heavy rainfall can lead to flooding, which is the most severe in urban areas where the ability to provide water infiltration and discharge through the sewerage system is severely restricted. It can also impact infrastructure stability and social life through limitations in mobility. Even more dangerous is the heavy rainfall that follows a prolonged heat wave and drought. When the soil is dry, in some circumstances, water can have a lower ability to infiltrate into the ground, i.e., due to the more hydrophobic properties of the upper layer and lower porosity of the soil. Then, the saturation level is quickly exceeded, which in turn enhances the runoff and exacerbates the negative effects of flooding [21]. This, in turn, can have a major impact on human health and property. Heavy rainfall in the agricultural area may interrupt agrotechnical work, cause losses due to the appearance of anaerobic conditions in the soil (root death, development of root diseases), and significantly increase soil erosion, destroying the fertile soil layer. The increasing risk of food production losses can increase social poverty. The importance of understanding the relationship between heat waves and heavy rainfall is crucial for the implementation of future adaptation strategies to create a more sustainable future.
Several papers have been published regarding extreme weather events in Poland, but they concern heat [22,23,24,25] and precipitation extremes [26,27] occurring individually. However, there is a paucity of studies regarding compound extreme weather events. This research is innovative in Poland and introduces new insights into the sequence of hazardous events, such as heat waves and heavy precipitation. The current study aims to investigate whether there is a relationship between the occurrence of heat waves and extremely heavy precipitation in Poland. We want to find answers to several questions. How many heat waves are terminated by heavy precipitation? How many heavy precipitation events are preceded by heat waves? Is the probability of heavy precipitation following a heat wave greater than climatology norms would suggest? Does the situation change with climate warming?
It is beyond the scope of this study to describe the mechanism that causes the occurrence of precipitation after a heat wave, but we would like to present some examples of synoptic situations that are conducive to HWHP events, which will be more deeply analyzed in further research.

2. Data and Methods

2.1. Data

In this study, we used the data from 44 meteorological stations in Poland for the 1966–2024 period, acquired from the Institute of Meteorology and Water Management National Research Institute (IMWM-NRI) (https://danepubliczne.imgw.pl/data/dane_pomiarowo_obserwacyjne, last accessed on 15 March 2025). These were daily maximum temperatures (Tmax) and 6 h precipitation totals. The Tmax data series are complete and homogeneous. In the case of precipitation totals, the datasets from 40 stations are complete. The remaining four had single gaps, comprising 14 days in Sulejów, 6 in Płock, 2 in Wieluń, and 5 in Racibórz. In all cases, daily totals were available, but term data were missing. Daily values were converted to 6 h values in proportion to the values at the nearest stations. The location of the stations is shown in Figure 1.
In the case study, the satellite images captured by the Meteosat 7 and Meteosat 8 (since 2017) were used to characterize the synoptic situation for selected dates. These images were acquired from the international weather forecasting websites of the Kachelmann Group (https://meteologix.com, accessed on 25 March 2025). The “satellite nature” image is the product created based on combined information from day and night infrared radiation. It was colored to distinguish cold air masses or cold cloud tops (white area). The “topos alert” image presented the height/temperature of the cloud top. Weather characteristics were supported by an analysis of the archived weather maps delivered by MetOffice (https://www.wetter3.de, accessed on 25 March 2025)

2.2. Methods

2.2.1. Heat Waves

There are many definitions of heat waves (HWs). A comprehensive review of these was presented by Perkins and Alexander [28]. In the Polish literature, heat wave definitions were reviewed by Kossowska-Cezak, Krzyżewska, and Kuchcik [29,30,31]. For this study, a relatively simple definition was adopted. Heat waves were defined using Tmax for each station individually according to the local temperature climatology in the reference period 1971–2000. Firstly, the 95th percentiles of Tmax for the summer period (June, July, and August; hereafter, JJA) were established for each station separately. The heat wave was identified if the daily Tmax exceeded the appropriate 95th percentile value for at least three consecutive days [32] (Abaurrea et al., 2007). If two heat waves are separated by one day with a temperature below the required threshold, the entire period is considered as one heat wave.
Heat waves were characterized by their spatial distribution in the analyzed period, and the frequency of occurrence in particular months. Additionally, the number of days in HWs was calculated for each year and averaged across all stations. On this basis, a linear trend was estimated. For this purpose, the least squares method was used, and the significance of the trend was tested using a Student’s test at the significance level of 95%. Additionally, the coefficient of determination was calculated. Long-term changes in Tmax were also determined using the same method. In each year, instead of the highest annual maximum temperature, the 99th percentile of the daily maximum temperature values was selected. This is often considered a more robust procedure.

2.2.2. Heavy Precipitation Events

A heavy precipitation (HP) event was detected when the 6 h rainfall exceeded the threshold value established for each station separately, defined as the 95th percentiles of 6 h precipitation totals from all observations in which the precipitation was at least 0.1 mm during the summer months (JJA) in the reference period from 1971 to 2000 [14]. Additionally, the frequency of extreme precipitation events in the annual and daily cycle was analyzed.

2.2.3. Compound Heat Wave and Heavy Precipitation Events

A compound HWHP event was identified when a heat wave was followed by a heavy precipitation event at a single station. Three cases were distinguished: a situation when a high 6 h rainfall occurred on the last day of the heat wave (HWHP0), one day after the heat wave (HWHP1), and two days after the heat wave (HWHP2) [14,15]. All 6 h periods were divided into three groups, i.e., those with high precipitation, equal to or higher than the 95th percentile (HP), with low and medium precipitation, below the 95th percentile (LMP), and without precipitation (DRY). The likelihood of these groups was checked for the whole year and for the summer months (JJA). Then, the number of stations simultaneously experiencing an HWHP event was determined. HWHP events were defined as situations in which a single station experienced HP after HW, and HWHP days were identified as days when an HWHP event occurred at least at one station. Long-term changes in HWHP days and events were estimated. To investigate how quickly heavy precipitation occurs after a heat wave, the number of cases of HP were counted in all 6 h periods of the last HW day and for the two following days. To test whether the occurrence of the HW increases the likelihood of HP, the likelihood of HP after HW was compared with the climatological likelihood of HP. We limited our investigations to the summer months because in these months, the frequencies of both HW and HP were high enough to make the results robust. Since the chance for HP decreases rapidly after noon on the last day of HW, we tested it separately for two and six 6 h periods from noon on the last day of HW. To determine the extent to which HW terminate with HP and whether it changes with warming, the number of HW events, the number of HW events followed by HP (HWHP), and the number of HW events followed by LMP (HWLMP) were calculated in each year, and the linear trends of these values were estimated. In addition, the percentage of HWs ending with HPs (HWHP/HW) and with LMPs (HWLMP/HW) was also counted for each year, and the trends of these series were estimated.

2.2.4. Case Study Characteristics

In this part of the study, the main focus was on the extensive HWHP events. Among 48 events when the HWHP occurred at at least five stations, three were chosen for further analysis. In addition to the spatial criterion, the location of the event was also considered to present their individuality. Each case study was described by Tmax, precipitation, and satellite images products. Firstly, the exceedance of the 95th percentile for each day of HW was calculated and averaged among each station (e.g., if Tmax was 34 °C and the 95th percentile was 30 °C, the 4 °C was taken for further averaging). Secondly, the precipitation totals were calculated for the last day of HW (D0), the first day after the HW (D1), and the second day after the HW (D2), if rainfall appeared. These values were provided on the map in the dot’s corners. Also, the precipitation totals for D0-D2 were presented on the map through a color bar.
Spatial distribution maps were created in Surfer 19.1, using kriging as the gridding method. Box plots were prepared using Grapher 17 software. A variant was used in which the box extends from the 1st to the 3rd quartile, with a bar indicating the median position. Whiskers extend from the end of the box to a distance of a 1.5 interquartile range. Outliers are shown as dots.

3. Results

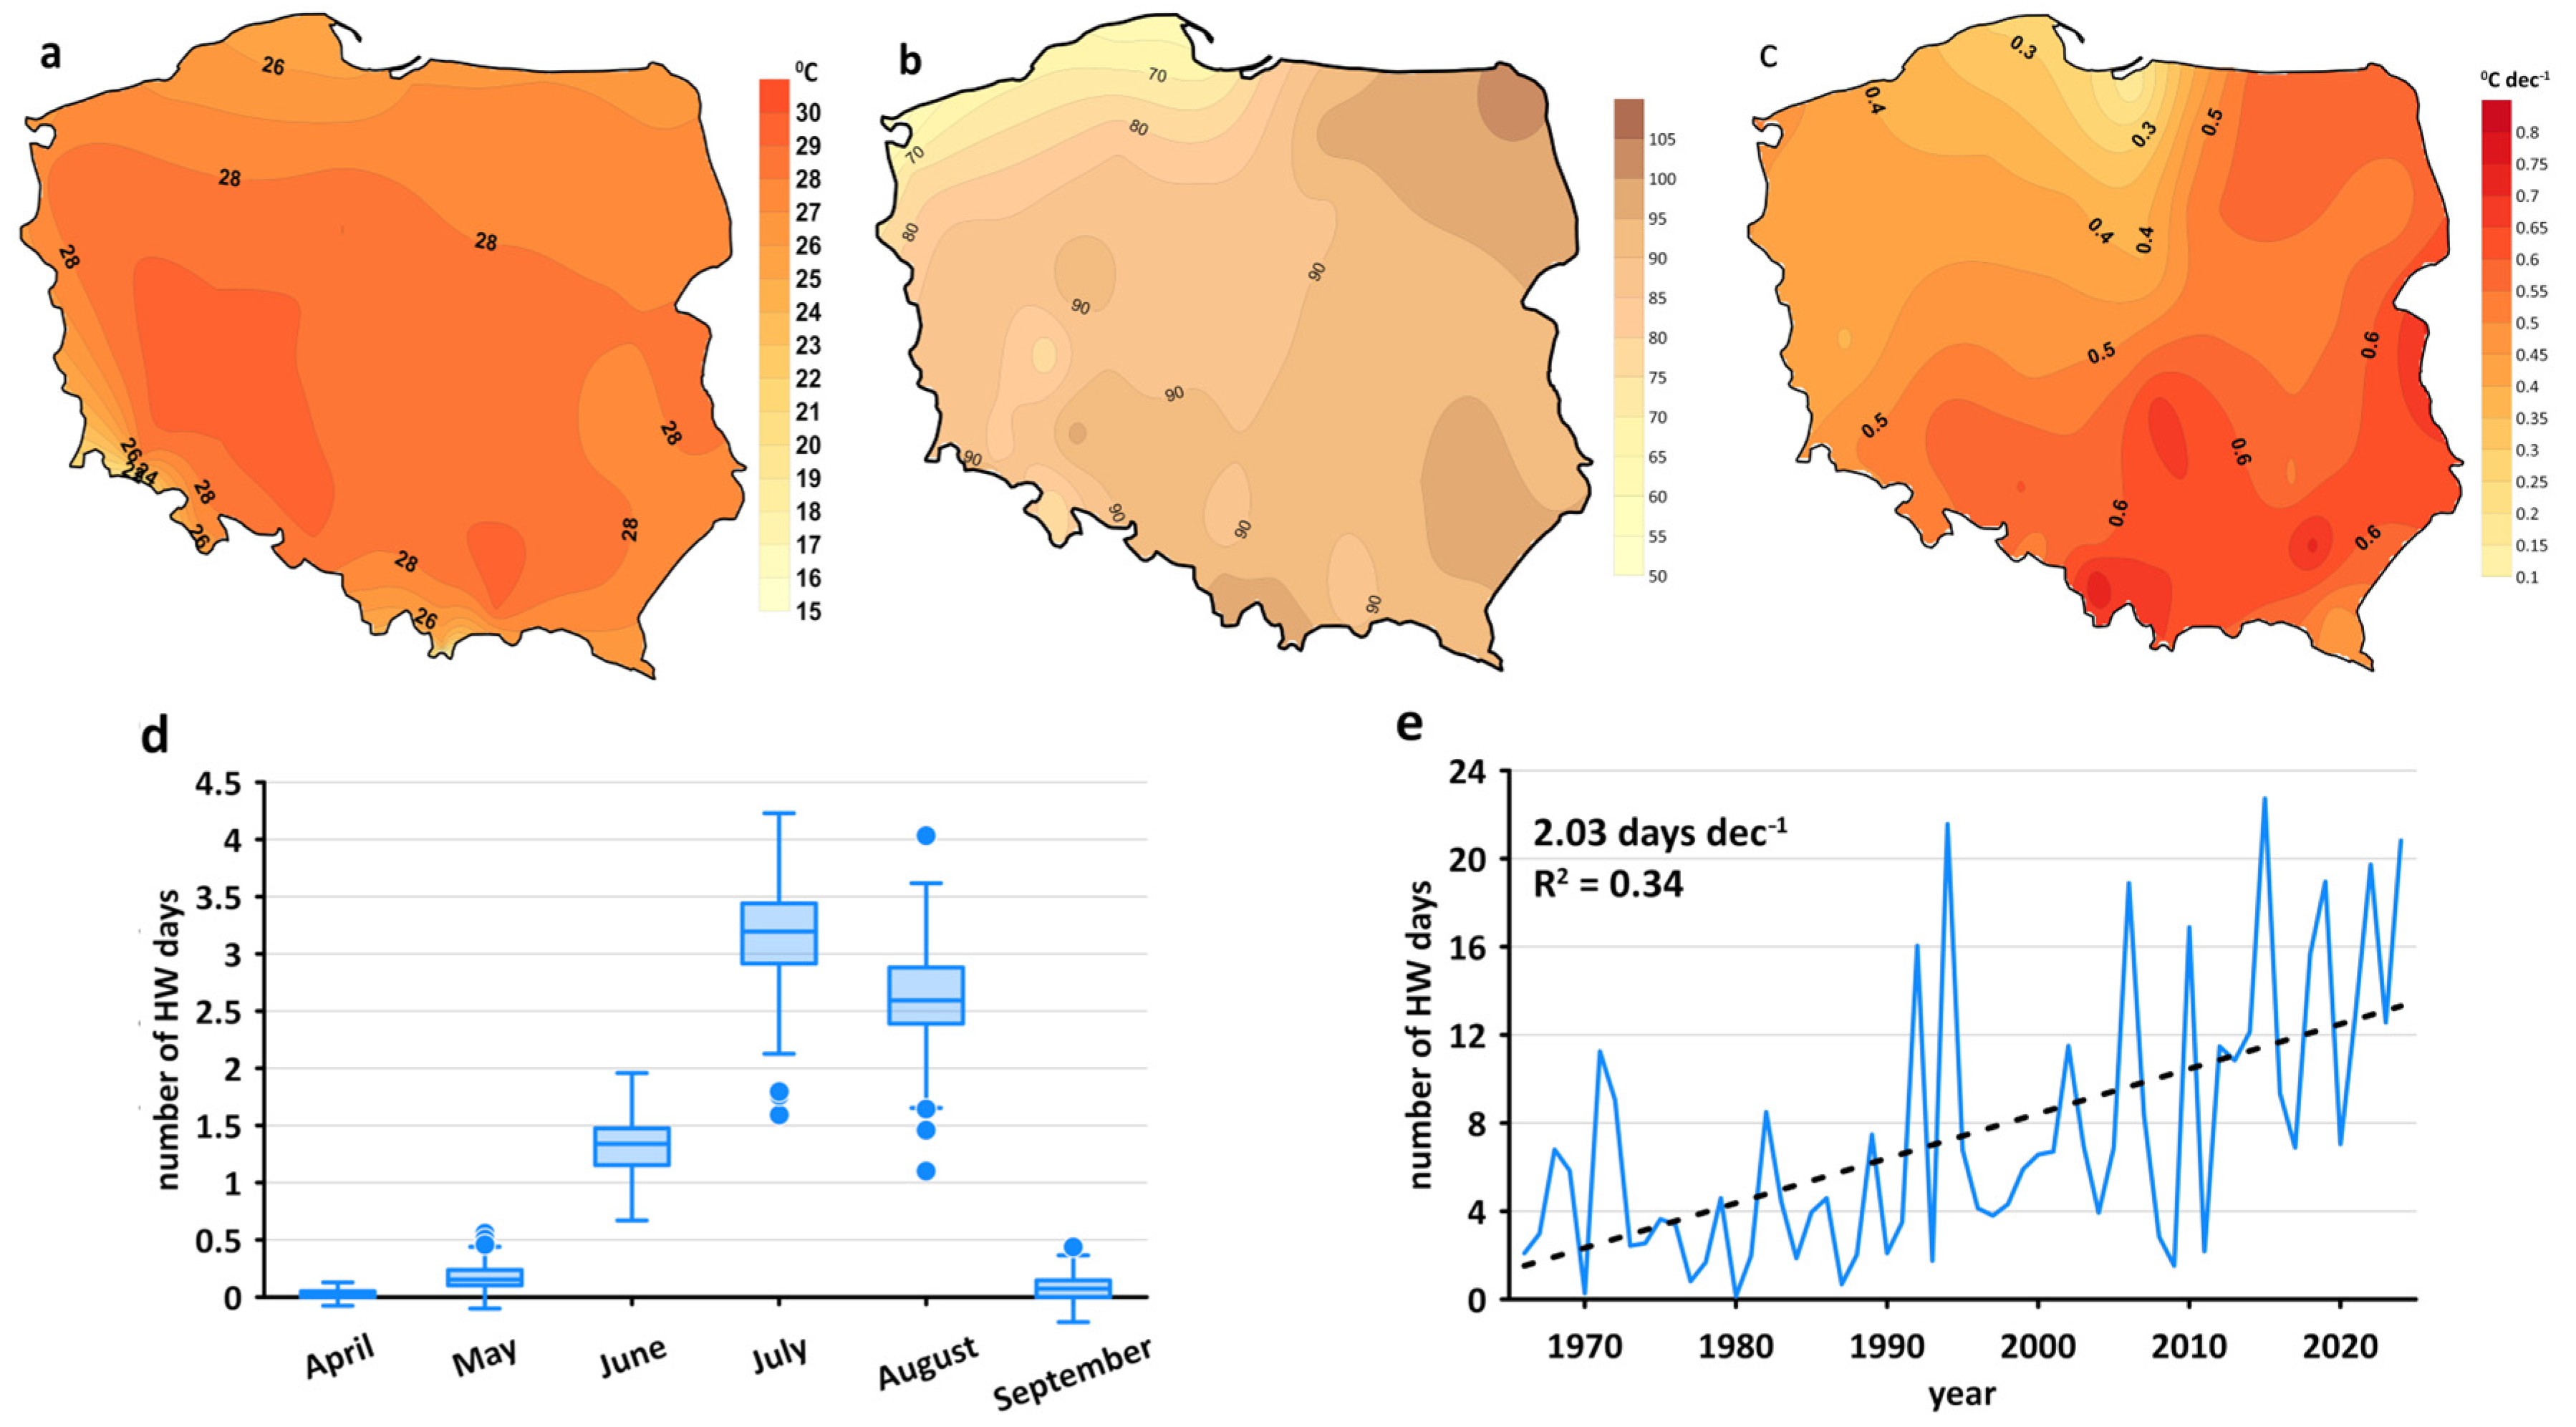
3.1. Heat Wave Characteristics

In Poland, the 95th percentile of daily Tmax values from summer (JJA) in the reference period 1971–2000 ranged from 25.1 °C in Hel to 29.3 °C in Opole, and were lower only in mountain and foothill stations (16.8 °C on Śnieżka 1603 m a.s.l., 15.7 °C on Kasprowy Wierch 1991 m a.s.l., and 24.8 °C in Zakopane 844 m a.s.l.). Except for the mountain region, the lowest values (<27 °C) were recorded in northern Poland (at the seaside), and the highest (>29 °C) in southwestern Poland (Lower Silesia) (Figure 2a).
HWs occurred in Poland from April to September, although not at all stations. They occurred most frequently in July and August (Figure 2d). The occurrence of HWs is spatially diverse. Their total number in the analyzed period ranges from 51 in Świnoujście (at the seaside) to 102 in Suwałki (in northeastern Poland) (Figure 2b). HWs are relatively less frequent over the sea in the northwestern part of the country, and their frequency increases towards the east and the southeast. This is due to the increase in Tmax. The Tmax trend was calculated for the 99th percentile of the daily Tmax of each year. The 99th percentile was chosen instead of the highest annual values because it is a more robust value and is less sensitive to individual measurement errors. The spatial distribution of the trend slopes is presented in Figure 2c. The increases range from 0.16 °C per decade in Elbląg (the only station where the increase is statistically insignificant) to 0.73 °C per decade in Bielsko-Biała. The Tmax trends increase from the north and northwest to the southeast of Poland. Apart from the station in Elbląg, it is statistically significant at the 99% level at all stations. Due to a significant increase in Tmax, the number of heat wave days (HWD) also increased successively in the analyzed period, at an average rate of 2.03 days per decade (Figure 2e).

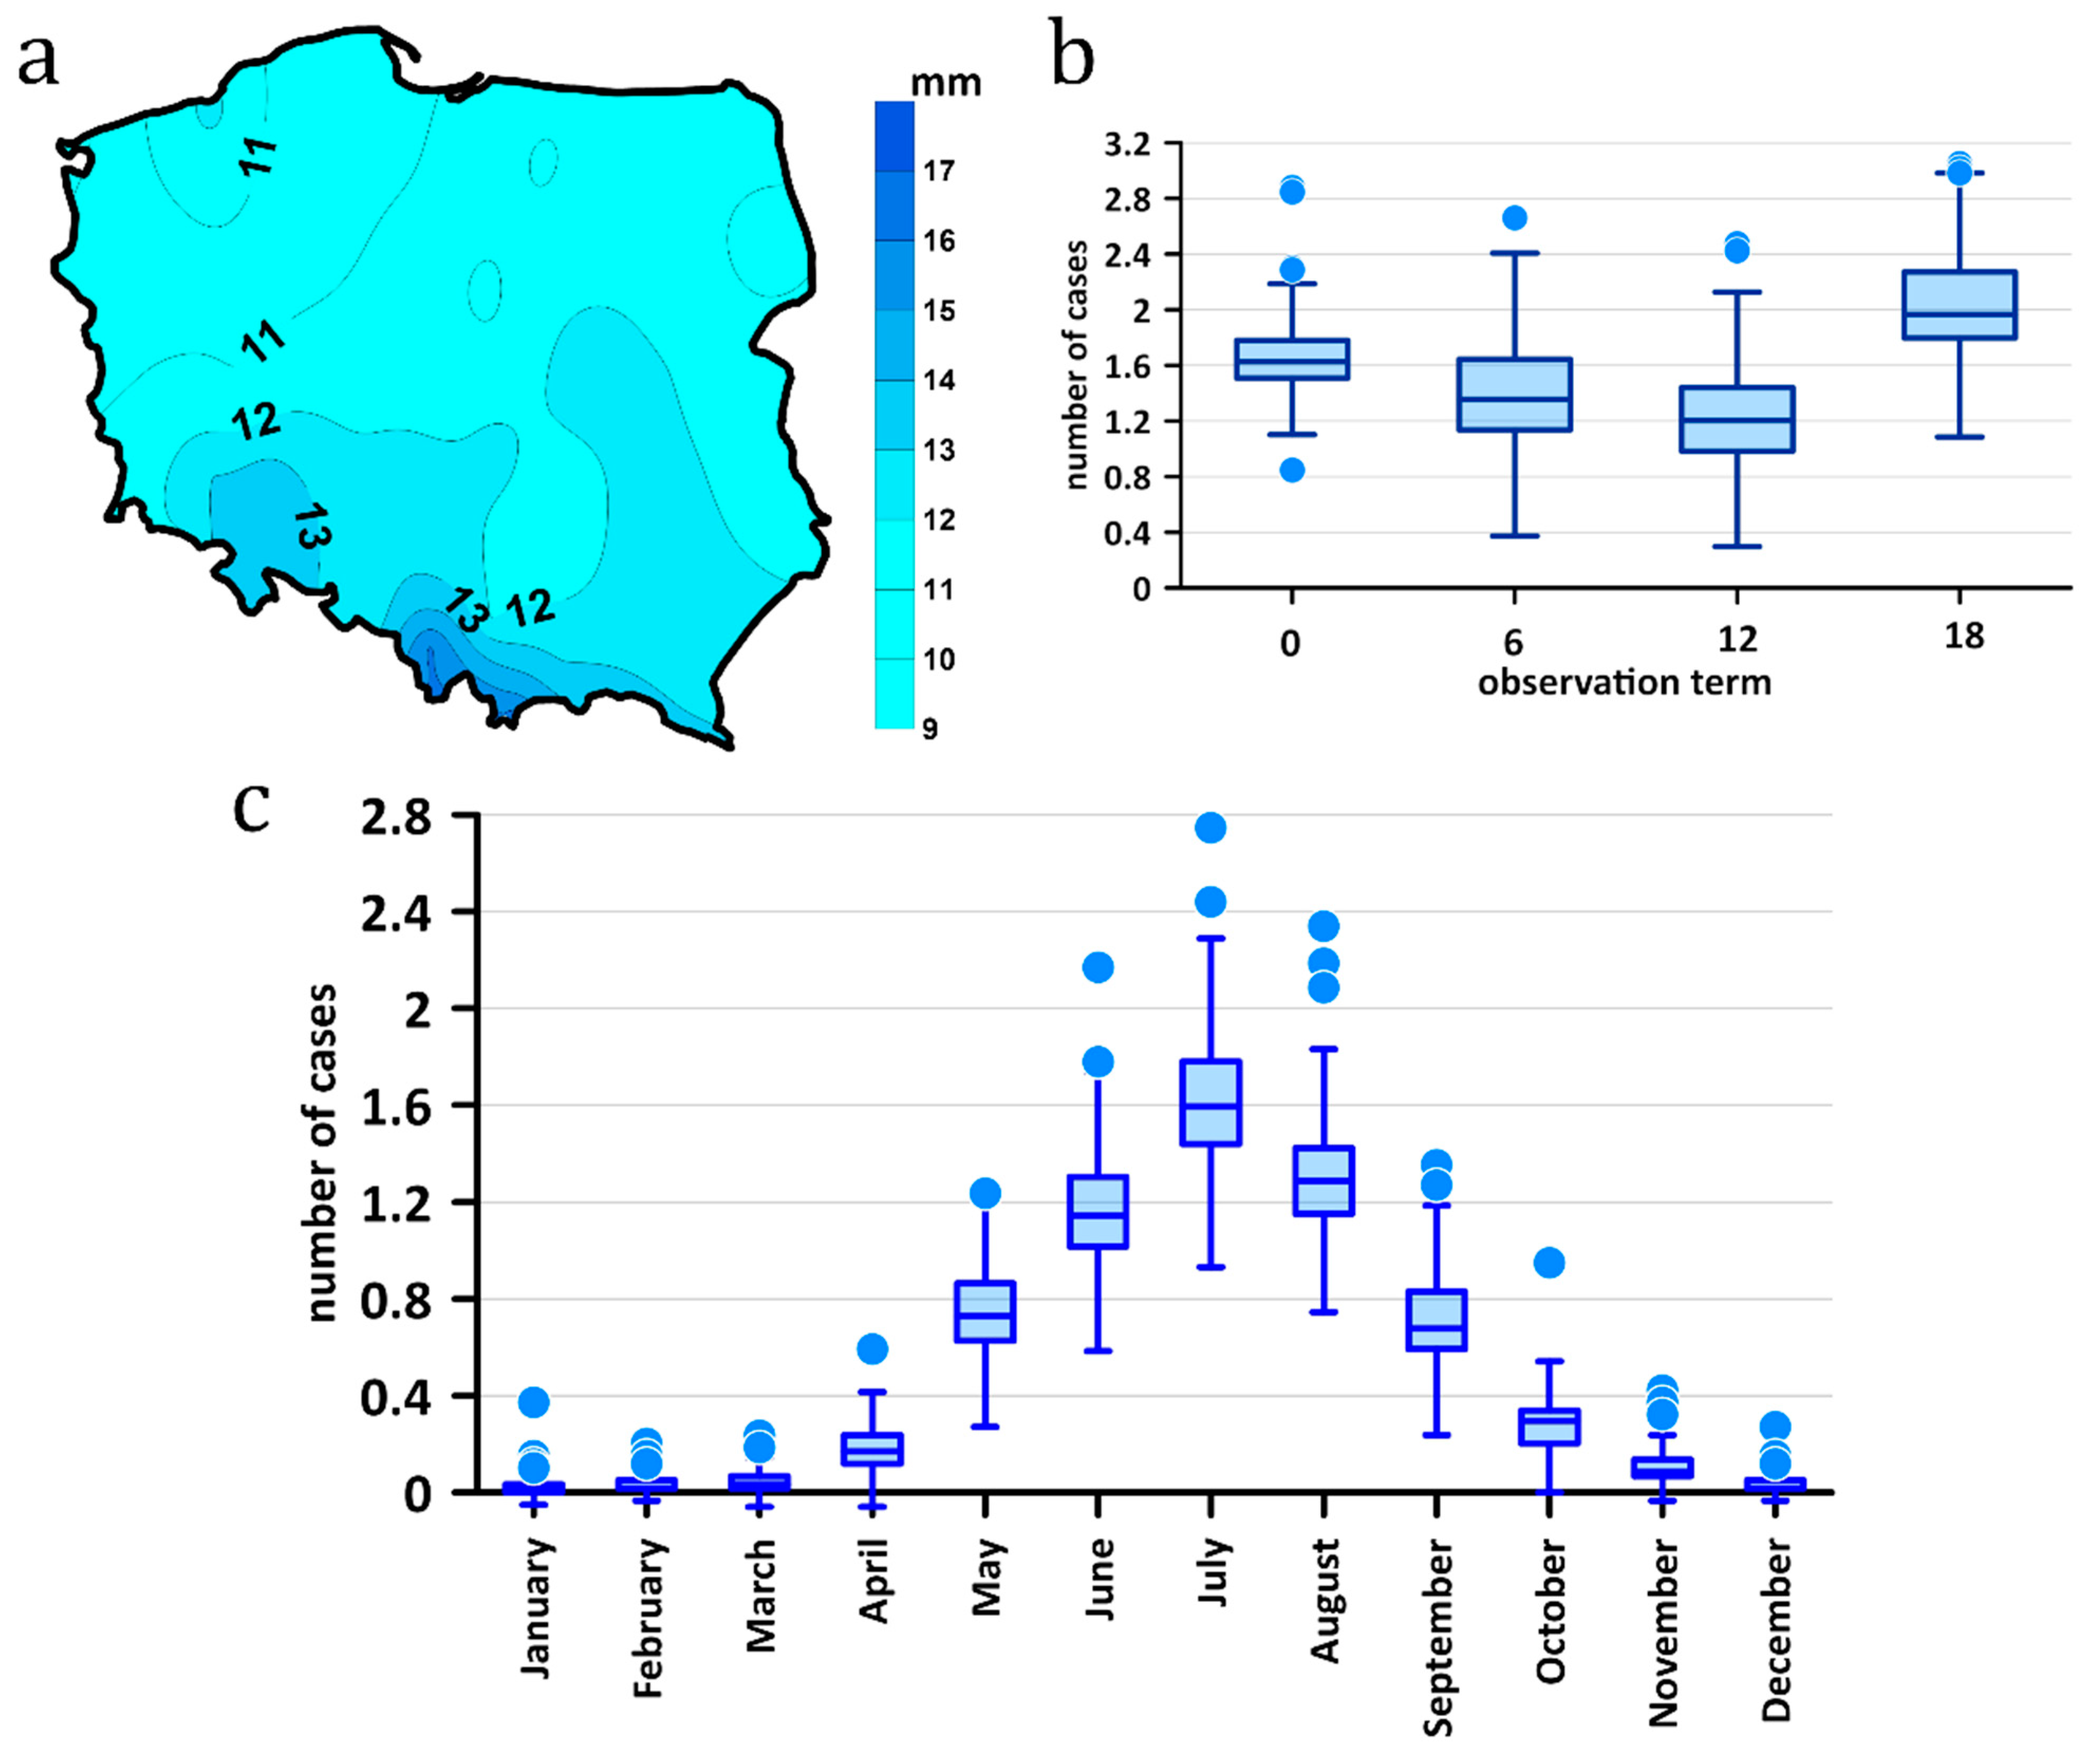
3.2. Heavy Precipitation Characteristic

The HP events occur when the 6 h precipitation sum exceeds the threshold value defined as the 95th percentile of the 6 hourly precipitation from all observations in which the precipitation was at least 0.1 mm during the summer months (JJA) in the reference period from 1971 to 2000. The spatial distribution of such calculated threshold values is presented in Figure 3a. These vary from 9.0 mm in Świnoujście, a station located in northwestern Poland close to the coast, to 17.1 mm on Kasprowy Wierch (Tatra Mt.), a mountain station located in southern Poland at an altitude of 1991 m a.s.l.
The distribution of HP in the daily cycle indicates a predominance of heavy precipitation in the afternoon and evening hours (6 h precipitation observed at 6:00 p.m. and 12:00 p.m., respectively) (Figure 3b). The fewest such cases were recorded in the morning hours until noon (6:00 and 12:00 a.m.). In the annual cycle, heavy rainfall occurs most often in the summer months (with the maximum in July), but it can be found in all seasons (Figure 3c).
The frequency of HP events is characterized by high year-to-year variability, but there are no long-term increasing or decreasing trends.
All 6 h periods were divided into three groups: HP events (defined above), LMP (periods with low or moderate precipitation with values from 0.1 to the threshold values for the HP events), and DRY (dry) periods without precipitation or precipitation below 0.1 mm. The frequency of HP events ranges from 0.32% in Warsaw to 0.75% on Śnieżka and Kasprowy Wierch throughout the year, and in summer (JJA) from 0.85% in Kalisz to 1.97% on Kasprowy Wierch (Figure 4a,d). The lowest frequencies are observed in central Poland and the highest in the south. The frequency of LMP events ranges from 19.02% in Kalisz to 26.27% in Lesko, with considerably higher values in mountain regions (44% on Śnieżka, 37% on Kasprowy Wierch, and 30% in Zakopane). In summer, LMP events are less frequent and vary from 16.60% in Warszawa and Włodawa to 24.07% in Lesko. Throughout the year, higher frequencies of LMP events are observed in the mountains (32.5% on Kasprowy Wierch, 32.4% on Śnieżka, and 29.2% in Zakopane). As in the case of HP events, the lowest frequencies of the LMP events are observed in central Poland and the highest in the south (Figure 4b,e). The frequency of DRY events ranges from 73.11% in Lesko to 80.66% in Kalisz, with noticeably lower frequency in the mountains (55% on Śnieżka, 62% on Kasprowy Wierch, and 69% in Zakopane). In summer, DRY events are more frequent and vary from 74.40% in Lesko to 82.45% in Warszawa. Throughout the year, lower frequencies of DRY events are observed in the mountains (66.0% on Śnieżka, 65.6% on Kasprowy Wierch, and 69.1% in Zakopane). In contrast to the results for HP and LMP events, the highest frequencies of the DRY events are observed in central Poland and the lowest in the south (Figure 4c,f).

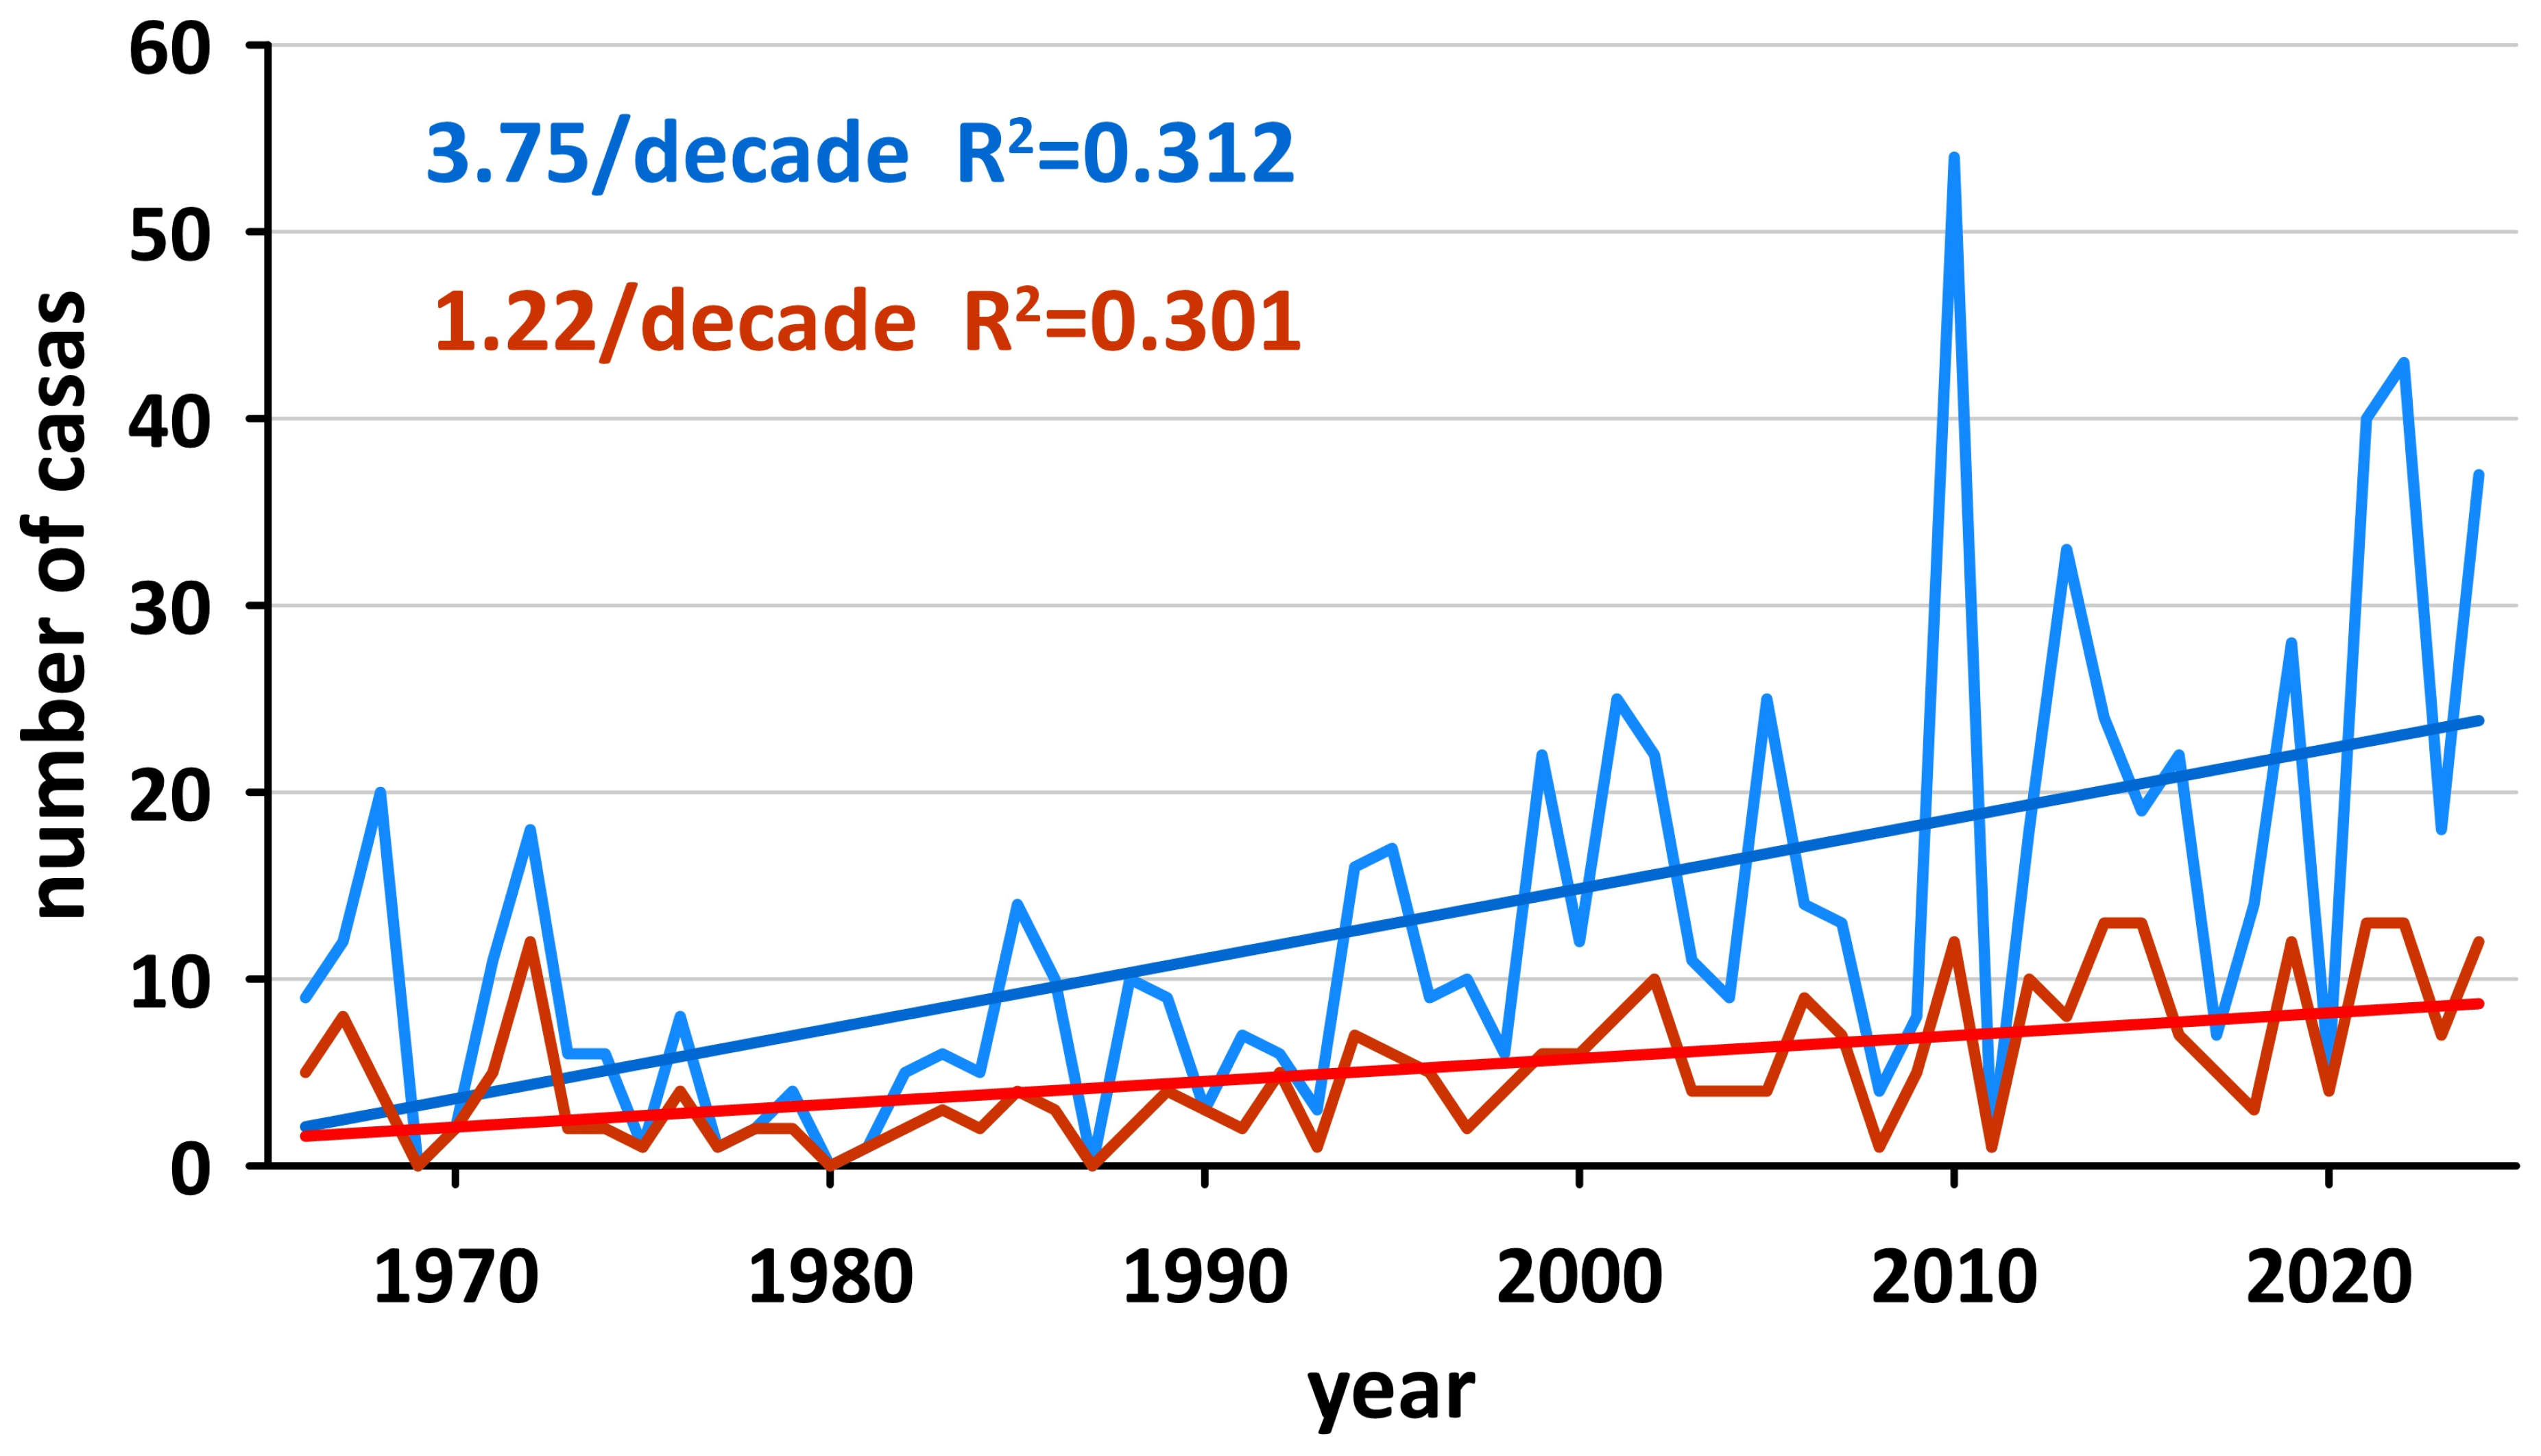
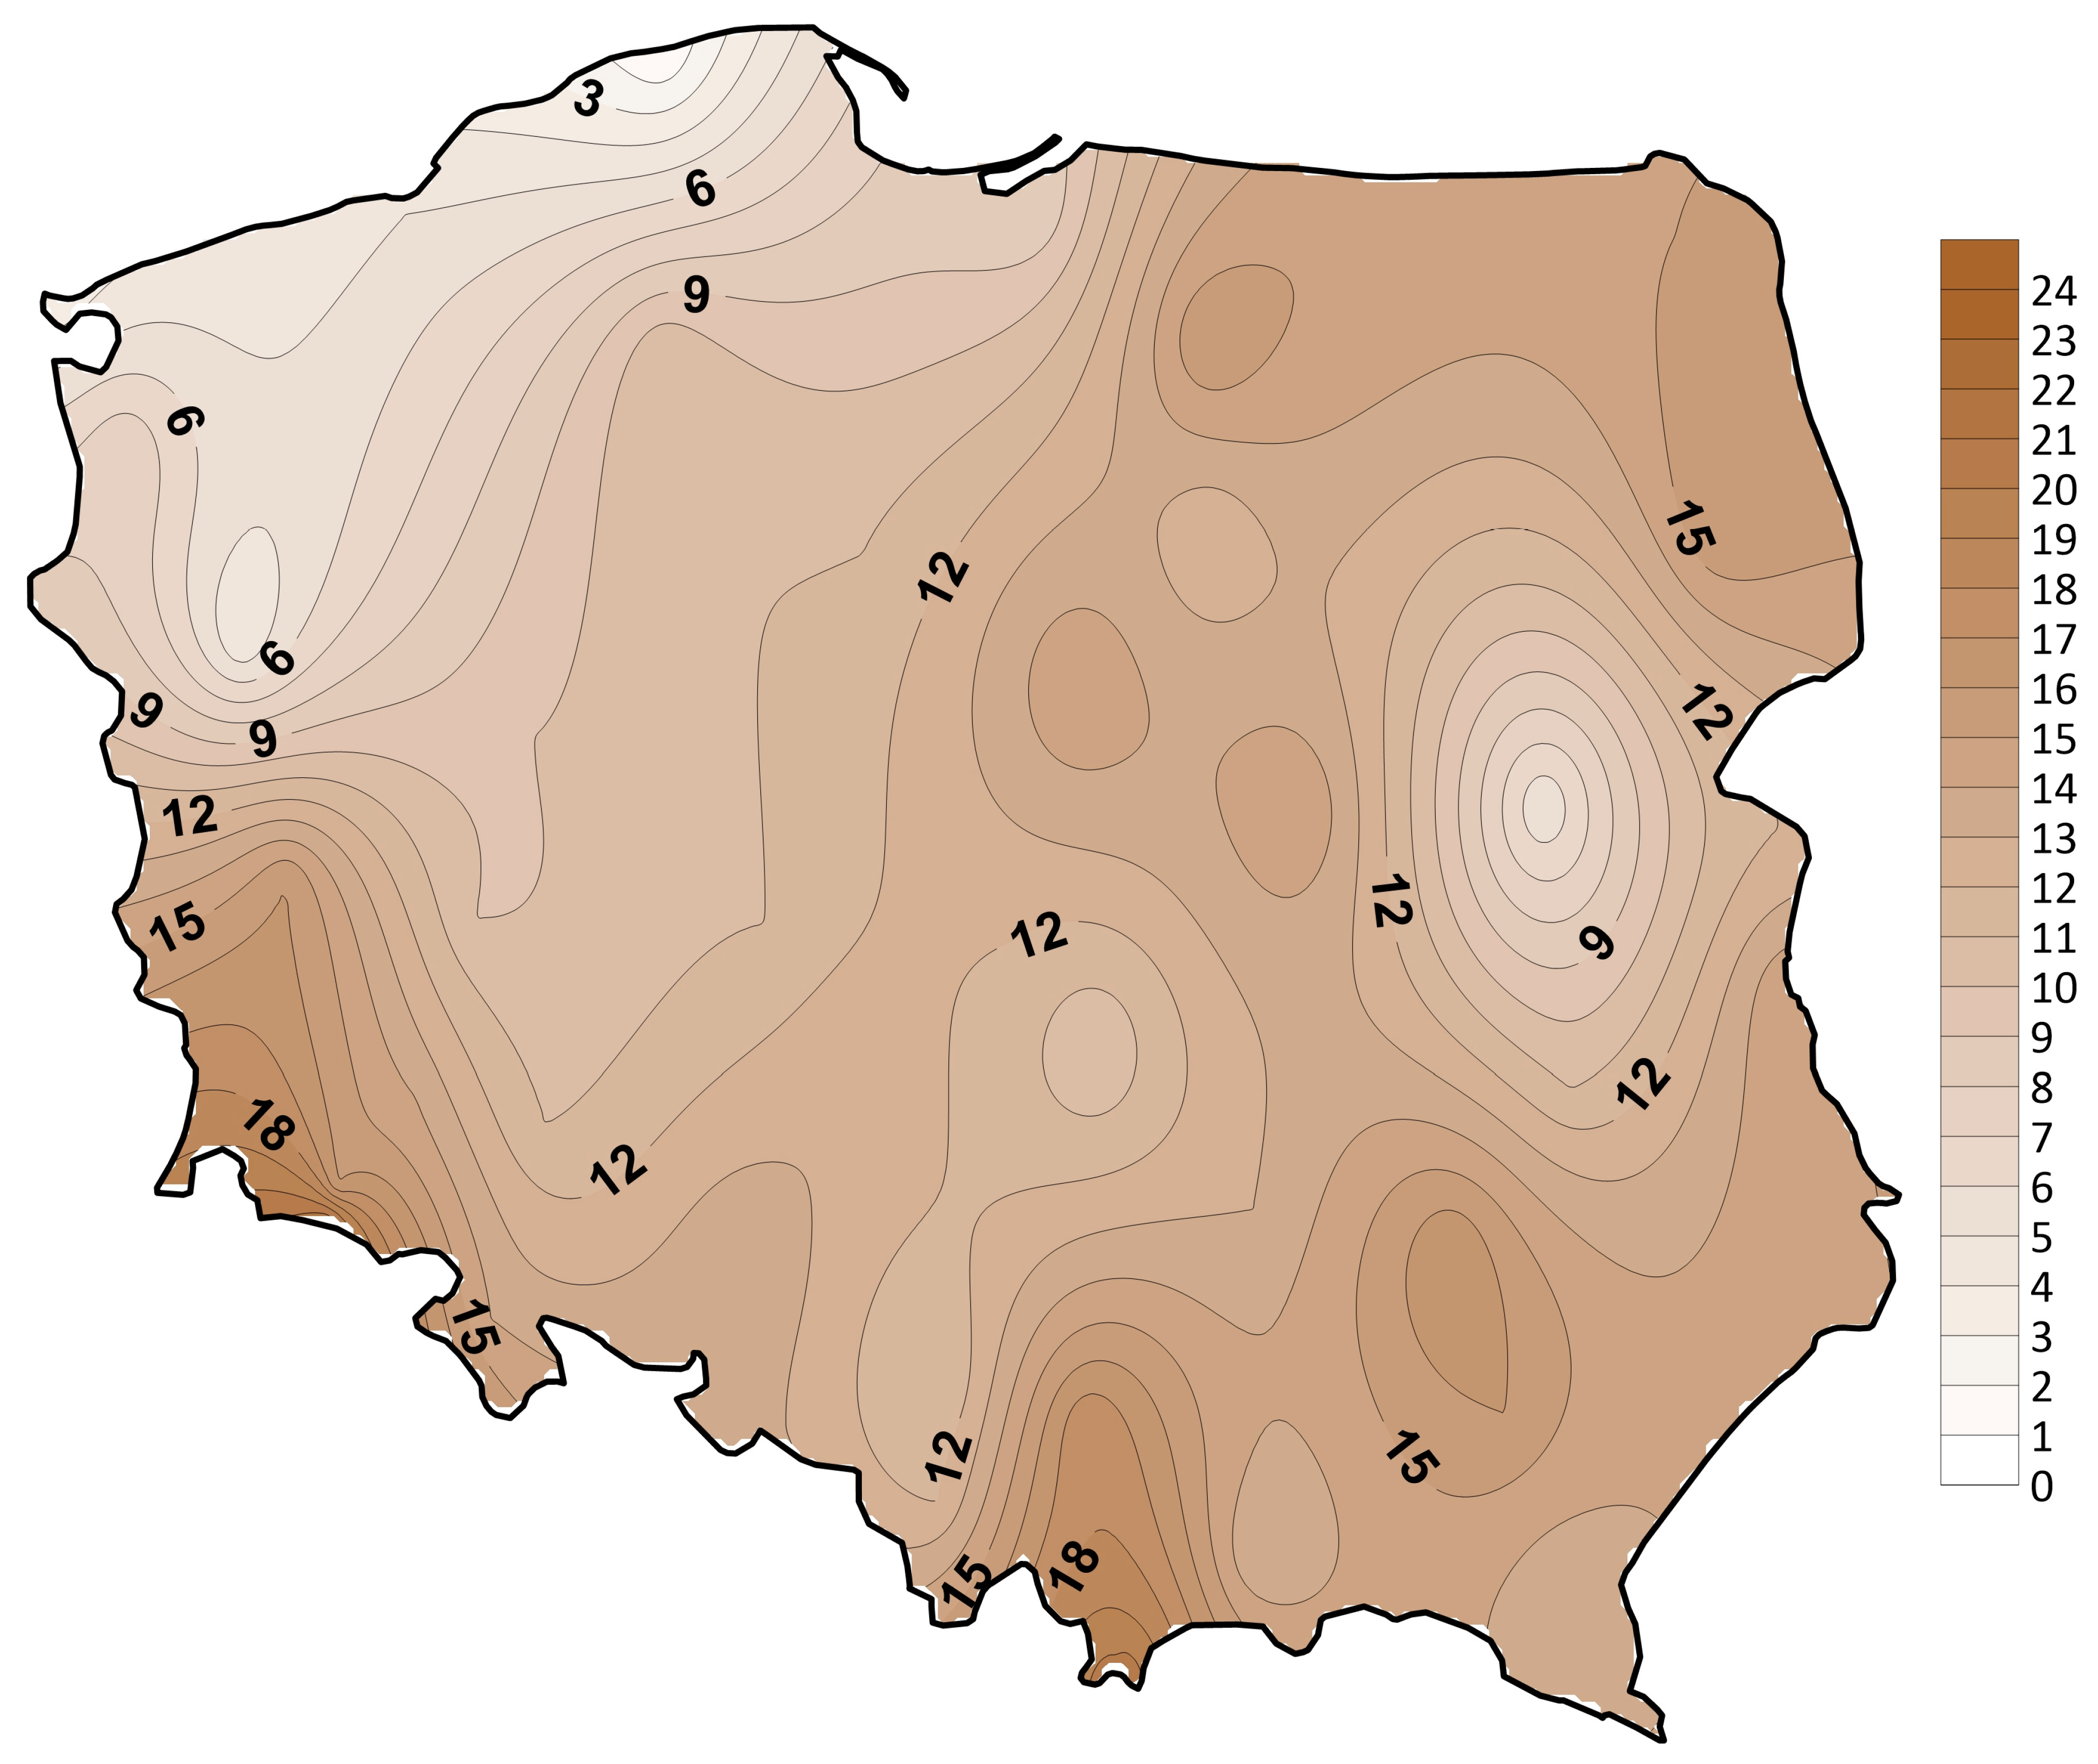
3.3. Compound HWHP Characteristics

In the analyzed period, HWHP events occurred during 302 days. In almost half of the cases (144), they were observed at only one station. For 33 days, the event occurred at more than five stations. The most extensive HWHP was recorded at 13 stations on 23 July 2010. Figure 5 presents the number of days on which the HWHP event was observed at a particular number of stations. Compound HWPW events appeared from May to September (Table 1), but mostly in July (136 days) and August (91 days). They were very rare in May (6 days) and September (10 days).
The number of HWHP events at individual stations (number of days weighted by the number of stations at which the event occurred) was 765. They occurred for 302 days. This means that the HWHP event occurred on average 13.0 times per year, during, on average, 5.1 days. Among all 765 HWHP events, 353 were recorded as HWHP0 events, which means that heavy rainfall was observed during the last day of the HW. A total of 287 were HWHP1 events, with heavy rainfall occurring the day after the HW, and 199 were HWHP2 events, with heavy rainfall occurring two days after the HW. After 64 HWs, heavy rainfall occurred during 2 days, and after 5 HWs, heavy rainfall occurred in all three analyzed days.
With warming, there is a clear, statistically significant increase in the number of HWHP days, at a rate of 1.22 days per decade, and a similarly significant increase in the number of HWHP events, at a rate of 3.75 events per decade. This trend explains almost one-third of the variability in both the number of days and the number of HWHP events (Figure 6).
HWHP events are not evenly distributed across Poland (Figure 7). In the analyzed period, they occurred least frequently at the seaside. Only one such event was recorded in Łeba and three in Świnoujście. They occurred most frequently in the mountains, i.e., 23 events were observed on Śnieżka, 21 on Kasprowy Wierch, and 20 in Zakopane. In the lowland areas, they were most frequently recorded in the eastern and southwestern part of the country (17 HWHP events in Sandomierz and 16 in Olsztyn, Białystok, Rzeszów, Jelenia Góra, and Zielona Góra). On average, 12.4 such events were recorded in Poland, which is approximately once per 5 years.
The detailed course of the HP events in 6 h intervals is shown in Figure 8. It can be seen that the HP event occurred most often in the afternoon on the last day of the HW. Increased frequencies were also observed on the first day after the HW, especially at night and in the early afternoon. They were very rare at night and before noon on the last day of the HW.
Such a distribution of high precipitation frequencies provided the basis for selecting two periods to investigate whether and to what extent the frequency of high precipitation following a heat wave is higher than normal. For this purpose, we selected only HWs occurring in the summer (JJA) because at that time, the probability of both an HW and HP are the highest and relatively even. In the first case, we analyzed two 6 h periods from noon to midnight of the last day of the HW (from 12:00 UTC of D0 to 00:00 UTC of D1). In the second period, there were six such periods from noon of the last day of the heat wave to midnight of the day after the heat wave (from 12:00 UTC of D0 to 00:00 UTC of D2). We compared the frequencies of HP events in these periods with the frequencies on all summer days shown in Figure 4d. The results are presented in Figure 9.
Analysis of precipitation events during six 6 h periods from noon on the last day of the HW to midnight of the following day showed that on average, there is a 2.58% chance of an HP event occurring during each of these six periods. At two stations, these chances were below 1%, at nine, they were between 3% and 4%, and at three mountain stations, they were above 4% (Figure 9a). Compared with data from the entire summer period, the chance of high precipitation increases by 2.27 times. At two stations, these values were below 1, and at six, they exceeded 3 (Figure 9c). The highest values were found in central-eastern and southwestern Poland.
If we consider only two terms from noon to midnight on the last day of the HW, the chance for an HP event increases even more, e.g., by 3.98%, on average. At 2 stations, these values are slightly below 1%, at 13, they are between 5% and 7%, and at 2, they are above 7% (Figure 9b). Compared with climatology norms, the chance of high precipitation increases 3.52 times. At two stations, these values are below 1; at six, they exceed 5 (Figure 9d). During this period, the highest values are also found for similar areas of central-eastern and southwestern Poland.
Along with the increase in the chances of HP events, the frequency of the occurrence of LMP events also increases 1.13 times, if we consider six 6 h periods, and 1.30 times, if we consider only the first two 6 h intervals. This increase, expressed in the number of cases, is greater than that for the HP events, but smaller in percentage terms because HP events occur much less often. Meanwhile, the chance of DRY periods decreases by 6% and 11%, respectively.
The frequency of HW, HWHP, and HWLMP events increased statistically significantly in the study period (Figure 10a). This means that not only do heat waves become more common in Poland, but they are also more frequently accompanied by heavy precipitation or any rainfall above 0.1 mm. However, no statistically significant changes were observed in the number of heavy precipitation days or precipitation days (≥0.1 mm) [26,27]. More than 13% of HWs in Poland are terminated by HP (and even more frequently, up to 20% in southern Poland). About 55% of HWs are terminated by less abundant rainfall (LMP). This means that almost 70% of HWs in Poland are terminated by any rainfall ≥ 0.1 mm (Figure 10b). During the analyzed period, the percentage of HW events ending with heavy precipitation (HWHP/HW) and light or moderate precipitation (HWLMP/HW) increases slightly (Figure 10b), although this increase was not statistically significant. This situation indicates that HP events become more likely following heat waves.

3.4. Case Study

In Poland, most of the HWHP events were observed in three regions: northeastern (Masuria and Podlachia region), southwestern (Lower Silesia and Sudeten Mt.), and southeastern (Tatra Mt., Lesser Poland, and Subcarpathia). These three regions are characterized below as individual cases.

3.4.1. HWHP Event on 8 July 2001

The HP, which started on the evening of 8 July 2001 was preceded by a short HW of 3–4 days covering most of north Poland (9 stations). The 95th percentile of Tmax was exceeded by 1.5–3 °C (Figure 11a), making the HW moderate in severity. During that evening, the precipitation was intensive (in Mława, Białystok, and Terespol), but did not exceed 20 mm in total (Figure 11b) due to a fast-moving cold front. The front moved toward the northeastern direction with a highly developed Cb cloud in the afternoon, illustrated in Figure 11c,d. The second round of rainfall started the next day (D1) in the afternoon and lasted until noon on the second day (D2) after the end of the HW. At this time, the long-lasting low-pressure center located in Poland (Figure 11e,f) gave rise to the development of well-structured Cb cells. The most extreme rainfall was recorded in Chojnice, Elbląg, and Kętrzyn in the late evening of D1 and early morning of D2, with daily totals of 36–50 mm and 20–40 mm, respectively, and a three-day rainfall of 68–78 mm. It is worth mentioning that HWHP events near the Baltic coastline are quite unusual; in this part of the country, HWs occur occasionally.

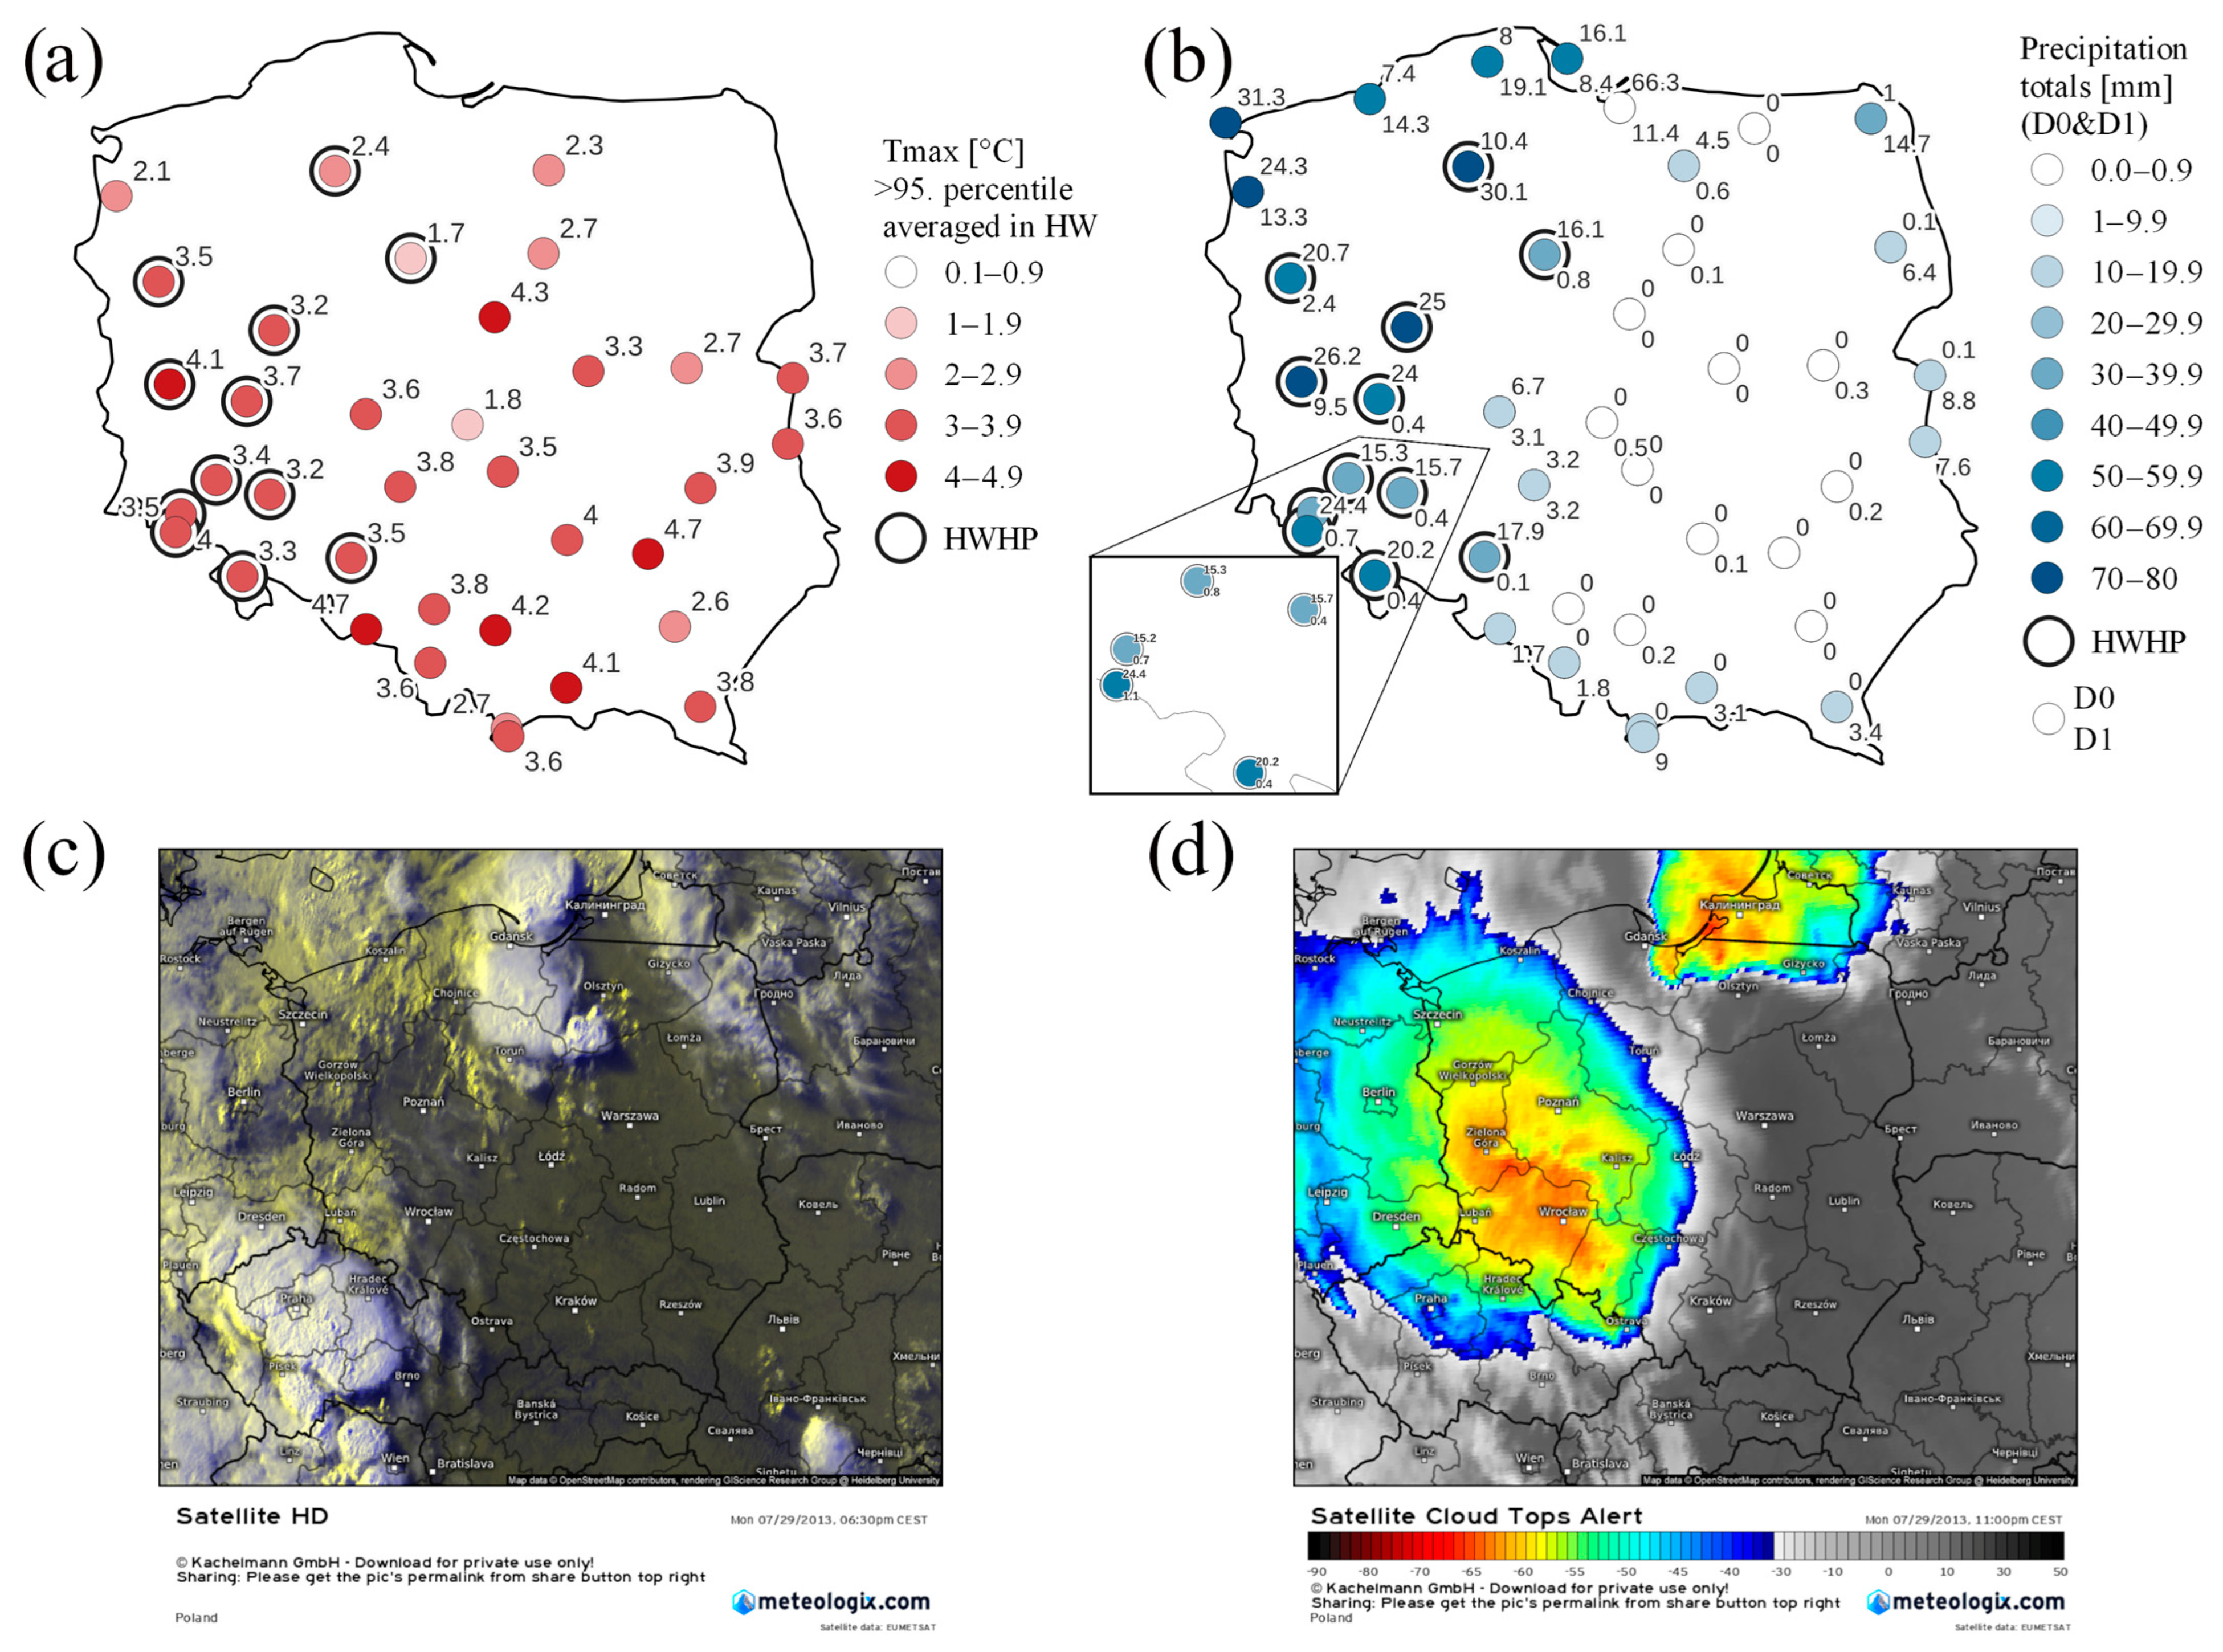
3.4.2. HWHP Event on 29 July 2013

The HWHP event on 29 July 2013 was preceded by a 3–5 day HW in most of the country, except the northeastern parts (12 stations). The most severe HW was observed in southwestern and southern Poland, where the 95th percentile of Tmax was exceeded by 3.2–4.7 °C (Figure 12a). The HW was related to a high-pressure system stretching from eastern to southern Europe. During the last day of the HW, the cold front, associated with the low-pressure center over the British Isles, moved eastwards from Germany and the Czech Republic. The mesoscale convective system (MCS) was created in the Czech Republic at the head of the trough in the unstable air masses and crossed the Polish border in the evening (Figure 12c,d). The developing structure covered all of western Poland and moved northwards, providing very high precipitation in Lower Silesia and Greater Poland, with daily totals of D0 equal to 20–26 mm (mostly at night) and up to 30 mm in northwestern Poland just after midnight (Figure 12b). This is a great example of the high thermodynamic processes that occur when much cooler polar maritime air meets very warm, long-lasting polar continental or tropical air.
A similar pattern of heavy rainfall in the widespread area of southwestern Poland, breaking the HW event, has often been observed in the past (i.e., 19 June 1968, 17 August 1974, 6 July 1999, 21 August 2000, 30 July 2005, 17 July 2010, 23 July 2010, and 22 June 2023).

3.4.3. HWHP Event on 10 August 2018

The last situation is related to the HWHP events that occurred on 10 August 2018. Similar to the previous case, the HW in Poland was related to a high-pressure system located in Eastern Europe. Very high Tmax, with 2–4 °C above the 95th percentile threshold, was recorded in most of Poland, except for the western and eastern borders (Figure 13a). The cold front, connected to the low-pressure center over Scandinavia, moved eastwards and gave rise to the mesoscale convective complex in front of the trough in central-eastern Poland (from the Tatra Mt. and Lower Poland to Podlachia) in the afternoon hours (Figure 13c,d). High precipitation (up to 31 mm) was recorded in this area (Figure 13b–d). On the next day (D1), the low-pressure center and the cold front persisted in the same area, resulting in more heavy precipitation (up to 44 mm) before noon (Figure 12b,e). This case is not isolated, as similar weather patterns were observed, i.e., on 20 August 2004, 31 July 2005, 16 August 2010, 22 June 2021, and 12 July 2024.
Most of the HWHP events that were recorded at the same time in the extensive area of Poland were preceded by a short HW that lasted for 3–5 days. There is a typical weather pattern associated with these events when a well-developed anticyclone is located in Eastern Europe, and the cold front, which is connected to a cyclone situated in the area of the British Isles or Scandinavia, enters Polish territory. The high-temperature gradient between the polar maritime air and polar continental/tropical air gives rise to convective instability and multicell or supercell thunderstorms that bring cooler air and terminate the HW.

4. Discussion

Previous studies have examined HW and HP events separately, yet their compound HWHP events when extreme precipitation occurs just after a heat wave, have not been investigated in Poland. The increase in the probability of HP events just after HW events has been presented for China [15], Australia, the United States, Japan, and Western Europe [14]. The latter authors indicate that the probability of extreme rainfall after HWs strongly varies with the location and suggest that compound HW and HP events are more likely to occur in moderate and high latitudes in the humid climate zone. On the contrary, they did not find an increase in the frequency of their occurrence in Southern Europe, where conditions are too dry in summer.
The findings of this study suggest that the likelihood of HP events following heat waves in Poland during summer is higher compared to climatology norms, but varies with location. Generally, higher probability occurs is in eastern and southwestern Poland. The highest probability of such events, almost 20%, was found in southern Poland and the lowest, only a few percent, was observed in the coastline region. On average, in Poland, the likelihood is 13.8%. On the coast, the relatively low frequency of HP following the heat waves results from the fact that the air over land is usually warmer than over the sea, and when moist air from the sea flows over the land, it warms and its relative humidity decreases, so as a result of convection, when precipitation occurs, it is less often extreme. On the other hand, an increased frequency of HP following heat waves is observed in the mountains, where thermal convection is strengthened by the orographic effect. These results are similar to those presented by Sauter et al. [14] for Western Europe, including Germany. At the same time, more than 55% of heat waves are terminated by precipitation below the 95th percentile threshold, meaning that almost 70% of HWs are followed by precipitation. This is more than climatology norms would indicate.
The likelihood of extreme precipitation is greatest on the last day of an HW. Almost half of the cases of HP occur from noon to midnight on that day, their number decreases on the first day after the HW, and is even smaller on the second day. The fact that among HWHP events, those in which HP occurs in the afternoon hours of the last day of the HW dominate was also indicated by Refs. [13,14]. The highest values are found in eastern and southwestern Poland. Compared with climatology norms, the likelihood of extreme precipitation in the afternoon hours of the last day of the heat wave increased by 3.52 times. At the coast, the likelihood is close to climatology norms, but in central, southwestern and southern Poland, it is even higher, at more than 5 times (Figure 9d). Sauter et al. [14] found similar results for Western Europe, with an increase of more than four times in Belgium and more than three times in southern Germany.
The frequency of HWHP events increased statistically significantly in the analyzed period. At the same time, no statistically significant changes were observed in the number of days with heavy precipitation [26,27]. Despite this fact, the percentage of HW events terminated by heavy precipitation (HWHP/HW) slightly increased, but not significantly. The relatively stable number of HP events, with an increasing frequency of HWHP events, means that the share of HP events preceded by HW is increasing. Zhou et al. [33] also indicate such a phenomenon in China. This is a hazardous situation because prolonged periods of heat increase evaporation and can dry soils, making it more hydrophobic and less porous, which may reduce water infiltration and increase the risk of flash floods [34]. In this way, the appearance of compound heat waves and heavy rainfall can cause greater damage than individual HW and HP events.
A detailed analysis of the widespread HWHP events in Poland indicated that in most cases, short-lasting HWs (3–5 days) were terminated by heavy rainfall, accompanied by a cold front. This was the typical pattern when, over the Polish territory, heated polar continental or tropical air masses related to a high-pressure system in Eastern Europe met much cooler polar marine air coming from the Atlantic through Central Europe (Germany, the Czech Republic). These conditions foster convective instability and give rise to MCS development in the afternoon of the last HW day. This pattern (cold front with thunderstorm) is more consistent with the results obtained by Sauter et al. [35] for Central (Germany) than Eastern Europe. In some cases, when the low-pressure system lasts longer over the British Isles or Scandinavia, the frontal area becomes more stationary, occupying the same area of Poland for a longer period and causing more heavy rainfall from the cloud system moving northwards on the next days (from the afternoon of D1 to the morning of D2). In some circumstances, in D1, a weak cyclone appears inside the stationary front, exaggerating the rainfall.

5. Conclusions

This research investigated the occurrence of HWHP events in Poland, providing comprehensive characteristics of HW, HP, and HWHP events from 1966 to 2024. This is the first time that heat waves and heavy precipitation have been treated as a sequence of hazardous events in Poland, which makes the research novel. HWHP events vary spatially, with the highest occurrence rates in southwestern, southeastern, and northeastern Poland, particularly in the Tatra and Sudeten regions, and the lowest rate in the northwestern, due to the Baltic influence. One of the most important findings is that the number of compound HW and HP events has increased over time compared to climatology norms. HP terminates up to 20% of HWs (in Southern Poland), and generally, up to 70% of HWs are ended by any precipitation (≥0.1 mm), which also exceeds climatological norms. About half of HWHP events are terminated by HP during the last day of the HW (from noon to midnight), and the likelihood of HP events during these hours is 3.5 times higher than climatology norms show. Except for the mountain regions, these situations also become the most frequent in central-eastern Poland and along the eastern border. Considering precipitation changes related to HW in the summer, the probability of both HP and LMP events that terminate HWs has increased over time, in contrast to DRY events, which have become less expected. These trends are cause for concern. In recent last decades, summer in Poland has become hotter and drier. HP breaking HW events during prolonged drought might increase the risk of flooding due to the lower capability for water infiltration. A detailed analysis of the mechanisms responsible for such changes in the weather pattern will be investigated in future research. However, the preliminary study of extensive HWHP events revealed that in most cases, the approach of a cold front with a mesoscale thundercloud system was responsible for HW termination. More frequently occurring HWs and HWHP events increase the risk to human health and life, especially due to an aging population that is less mobile and more susceptible to weather hazards. Furthermore, this pattern impacts agriculture production, food security, and sustainable social development, posing a real challenge regarding the creation of the adaptation strategies in health care, urban planning, and agriculture.

Author Contributions

Conceptualization, J.W. and J.J.; methodology, J.W. and J.J.; software, J.W. and J.J.; validation, J.W.; formal analysis, J.W. and J.J.; investigation, J.W. and J.J.; resources, J.W. and J.J.; data curation, J.W. and J.J.; writing—original draft preparation, J.W. and J.J.; writing—review and editing, J.W. and J.J.; visualization, J.W. and J.J.; supervision, J.W.; project administration, J.W. funding acquisition, J.W. All authors have read and agreed to the published version of the manuscript.

Funding

This research was funded by the National Science Center (NCN) (grant number 2023/51/B/ST10/01926).

Informed Consent Statement

Not applicable.

Data Availability Statement

The Polish meteorological data were obtained from the Institute of Meteorology and Water Management—National Research Institute (IMWM-NRI) (https://danepubliczne.imgw.pl/data/dane_pomiarowo_obserwacyjne (accessed on 15 March 2025). The satellite products used in the study were provided by the Kachelmann Group (https://meteologix.com (accessed on 25 March 2025), and the weather maps that support the analyses were acquired from MetOffice (https://www.wetter3.de (accessed on 25 March 2025).

Acknowledgments

We would like to thank the Institute of Meteorology and Water Management—National Research Institute, the Kachelmann Group, and MetOffice for providing data used in the study, along with the anonymous reviewers who provided valuable comments.

Conflicts of Interest

The authors declare no conflicts of interest.

References

  1. Jacob, D.; Kotova, L.; Teichmann, C.; Sobolowski, S.P.; Vautard, R.; Donnelly, C.; Koutroulis, A.G.; Grillakis, M.G.; Tsanis, I.K.; Damm, A.; et al. Climate Impacts in Europe Under +1.5 °C Global Warming. Earth’s Future 2018, 6, 264–285. [Google Scholar] [CrossRef]
  2. King, A.D.; Karoly, D.J. Climate Extremes in Europe at 1.5 and 2 Degrees of Global Warming. Environ. Res. Lett. 2017, 12, 114031. [Google Scholar] [CrossRef]
  3. Seneviratne, S.I.; Nicholls, N.; Easterling, D.; Goodess, C.M.; Kanae, S.; Kossin, J.; Luo, Y.; Marengo, J.; McInnes, K.; Rahimi, M.; et al. Changes in Climate Extremes and Their Impacts on the Natural Physical Environment. In Managing the Risks of Extreme Events and Disasters to Advance Climate Change Adaptation; Field, C.B., Barros, V., Stocker, T.F., Qin, D., Dokken, D.J., Ebi, K.L., Mastrandrea, M.D., Mach, K.J., Plattner, G.-K., Allen, S.K., et al., Eds.; Cambridge University Press: Cambridge, UK, 2012; pp. 109–230. [Google Scholar]
  4. Zscheischler, J.; Martius, O.; Westra, S.; Bevacqua, E.; Raymond, C.; Horton, R.M.; van den Hurk, B.; AghaKouchak, A.; Jézéquel, A.; Mahecha, M.D.; et al. A Typology of Compound Weather and Climate Events. Nat. Rev. Earth Environ. 2020, 1, 333–347. [Google Scholar] [CrossRef]
  5. Mazdiyasni, O.; AghaKouchak, A. Substantial Increase in Concurrent Droughts and Heatwaves in the United States. Proc. Natl. Acad. Sci. USA 2015, 112, 11484–11489. [Google Scholar] [CrossRef]
  6. Sharma, S.; Mujumdar, P. Increasing Frequency and Spatial Extent of Concurrent Meteorological Droughts and Heatwaves in India. Sci. Rep. 2017, 7, 15582. [Google Scholar] [CrossRef]
  7. Ciais, P.; Reichstein, M.; Viovy, N.; Granier, A.; Ogée, J.; Allard, V.; Aubinet, M.; Buchmann, N.; Bernhofer, C.; Carrara, A.; et al. Europe-Wide Reduction in Primary Productivity Caused by the Heat and Drought in 2003. Nature 2005, 437, 529–533. [Google Scholar] [CrossRef]
  8. Tripathy, K.P.; Mishra, A.K. How Unusual Is the 2022 European Compound Drought and Heatwave Event? Geophys. Res. Lett. 2023, 50, e2023GL105453. [Google Scholar] [CrossRef]
  9. Wibig, J.; Jȩdruszkiewicz, J. Warm and Dry Compound Events in Poland. Atmosphere 2024, 15, 1019. [Google Scholar] [CrossRef]
  10. Seneviratne, S.I.; Corti, T.; Davin, E.L.; Hirschi, M.; Jaeger, E.B.; Lehner, I.; Orlowsky, B.; Teuling, A.J. Investigating Soil Moisture–Climate Interactions in a Changing Climate: A Review. Earth-Sci. Rev. 2010, 99, 125–161. [Google Scholar] [CrossRef]
  11. Miralles, D.G.; Gentine, P.; Seneviratne, S.I.; Teuling, A.J. Land–Atmospheric Feedbacks During Droughts and Heatwaves: State of the Science and Current Challenges. Ann. N. Y. Acad. Sci. 2019, 1436, 19–35. [Google Scholar] [CrossRef]
  12. Yin, J.; Slater, L.; Gu, L.; Liao, Z.; Guo, S.; Gentine, P. Global Increases in Lethal Compound Heat Stress: Hydrological Drought Hazards Under Climate Change. Geophys. Res. Lett. 2022, 49, e2022GL100880. [Google Scholar] [CrossRef]
  13. Sauter, C.; White, C.J.; Fowler, H.J.; Westra, S. Temporally Compounding Heatwave–Heavy Rainfall Events in Australia. Int. J. Climatol. 2023, 43, 1050–1061. [Google Scholar] [CrossRef]
  14. Sauter, C.; Fowler, H.J.; Westra, S.; Ali, H.; Peleg, N.; White, C.J. Compound Extreme Hourly Rainfall Preconditioned by Heatwaves Most Likely in the Mid-Latitudes. Weather Clim. Extrem. 2023, 40, 100563. [Google Scholar] [CrossRef]
  15. You, J.; Wang, S. Higher Probability of Occurrence of Hotter and Shorter Heat Waves Followed by Heavy Rainfall. Geophys. Res. Lett. 2021, 48, e2021GL094831. [Google Scholar] [CrossRef]
  16. Lenderink, G.; van Meijgaard, E. Increase in Hourly Precipitation Extremes Beyond Expectations from Temperature Changes. Nat. Geosci. 2008, 1, 511–514. [Google Scholar] [CrossRef]
  17. Berg, P.; Moseley, C.; Haerter, J.O. Strong Increase in Convective Precipitation in Response to Higher Temperatures. Nat. Geosci. 2013, 6, 181–185. [Google Scholar] [CrossRef]
  18. Ali, H.; Fowler, H.J.; Lenderink, G.; Lewis, E.; Pritchard, D. Consistent Large-Scale Response of Hourly Extreme Precipitation to Temperature Variation Over Land. Geophys. Res. Lett. 2021, 48, e2020GL090317. [Google Scholar] [CrossRef]
  19. Wibig, J.; Piotrowski, P. Impact of the Air Temperature and Atmospheric Circulation on Extreme Precipitation in Poland. Int. J. Climatol. 2018, 38, 4533–4549. [Google Scholar] [CrossRef]
  20. Zhang, W.; Villarini, G. Deadly Compound Heat Stress-Flooding Hazard Across the Central United States. Geophys. Res. Lett. 2020, 47, e2020GL089185. [Google Scholar] [CrossRef]
  21. Barendrecht, M.H.; Matanó, A.; Mendoza, H.; Weesie, R.; Rohse, M.; Koehler, J.; de Ruiter, M.; Garcia, M.; Mazzoleni, M.; Aerts, J.C.J.H.; et al. Exploring Drought-to-flood Interactions and Dynamics: A Global Case Review. Wires Water 2024, 11, e1726. [Google Scholar] [CrossRef]
  22. Wibig, J. Hot Days and Heat Waves in Poland in the Period 1951–2019 and the Circulation Factors Favoring the Most Extreme of Them. Atmosphere 2021, 12, 340. [Google Scholar] [CrossRef]
  23. Wibig, J. Heat Waves in Poland in the Period 1951–2015: Trends, Patterns and Driving Factors. Meteorol. Hydrol. Water Manag. 2017, 6, 37–45. [Google Scholar] [CrossRef]
  24. Owczarek, M.; Tomczyk, A.M. Impact of Atmospheric Circulation on the Occurrence of Very Strong and Extreme Cold Stress in Poland. Quaest. Geogr. 2022, 41, 111–126. [Google Scholar] [CrossRef]
  25. Tomczyk, A.M.; Bednorz, E.; Półrolniczak, M.; Kolendowicz, L. Strong Heat and Cold Waves in Poland in Relation with the Large-Scale Atmospheric Circulation. Theor. Appl. Climatol. 2019, 137, 1909–1923. [Google Scholar] [CrossRef]
  26. Łupikasza, E. Seasonal Patterns and Consistency of Extreme Precipitation Trends in Europe, December 1950 to February 2008. Clim. Res. 2017, 72, 217–237. [Google Scholar] [CrossRef]
  27. Łupikasza, E.; Małarzewski, Ł. Precipitation Change. In Climate Change in Poland: Past, Present, Future; Falarz, M., Ed.; Springer Climate: Cham, Switzerland, 2021; pp. 349–373. [Google Scholar]
  28. Perkins, S.E.; Alexander, L.V. On the Measurement of Heat Waves. J. Clim. 2013, 26, 4500–4517. [Google Scholar] [CrossRef]
  29. Kuchcik, M. Defining Heat Wave—Different Approaches. Geogr. Pol. 2006, 79, 47–63. [Google Scholar]
  30. Kossowska-Cezak, U. Heat Waves and Heat Periods—Distinguishing Methods and Results of Application. Pr. Geogr. 2010, 123, 143–149. (In Polish) [Google Scholar]
  31. Krzyżewska, A. The Review of the Methods Defining Heat Waves and Frost Waves. Przegląd Geofiz. 2014, 59, 157–173. (In Polish) [Google Scholar]
  32. Abaurrea, J.; Asín, J.; Cebrián, A.C.; Centelles, A. Modeling and forecasting extreme heat events in the central Ebro Valley, a continental Mediterranean area. Glob. Planet. Change 2007, 57, 43–58. [Google Scholar] [CrossRef]
  33. Zhou, Z.; Zhang, L.; Zhang, Q.; Cao, H.; Zhang, H.; Jia, B.; Liu, L.; Tang, Z.; Chen, J. Amplified Temperature Sensitivity of Extreme Precipitation Events Following Heat Stress. npj Clim. Atmos. Sci. 2024, 7, 243. [Google Scholar] [CrossRef]
  34. IPCC. Climate Change 2023: Synthesis Report, Summary for Policymakers. Contribution of Working Groups I, II and III to the Sixth Assessment Report of the Intergovernmental Panel on Climate Change Core Writing Team; Lee, H., Romero, J., Eds.; IPCC: Geneva, Switzerland, 2023.
  35. Sauter, C.; Catto, J.L.; Fowler, H.J.; Westra, S.; White, C.J. Compounding Heatwave-Extreme Rainfall Events Driven by Fronts, High Moisture, and Atmospheric Instability. JGR Atmos. 2023, 128, e2023JD038761. [Google Scholar] [CrossRef]
Figure 1. Locations of the meteorological stations.
Sustainability 17 04447 g001
Figure 2. Spatial distribution of (a) 95th percentile of Tmax in summer months (JJA) in the reference period 1971–2000; (b) the total number of heat waves in the analyzed period; (c) trends in the annual 99th percentile of Tmax; (d) monthly frequency of heat waves; (e) long-term trend in the average number of heat wave days in Poland. Note. The value inside the interquartile range box reflects the median. The outstanding values (blue dots) represent values higher/lower than 1.5 interquartile range box.
Sustainability 17 04447 g002
Figure 3. (a) Spatial distribution of 95th percentile of 6 h precipitation totals for summer (JJA) in the reference period 1971–2000; (b) distribution of mean frequency of heavy rainfall at four measurement terms; (c) distribution of the mean monthly number of 6 h heavy precipitation events at all stations. Note. The value inside the interquartile range box reflects the median. The outstanding values (blue dots) represent values higher/lower than 1.5 interquartile range box.
Sustainability 17 04447 g003
Figure 4. Spatial distribution of relative frequencies of (a) HP events throughout the year; (b) LMP events throughout the year; (c) dry events throughout the year; (d) HP events during summer; (e) LMP events during summer; (f) dry events during summer.
Sustainability 17 04447 g004
Figure 5. Number of days on which the HWHP event is observed at the given number of stations.
Sustainability 17 04447 g005
Figure 6. Long-term changes in HWHP days (red lines) and HWHP events (blue lines).
Sustainability 17 04447 g006
Figure 7. Spatial distribution of the total number of HWHP events in Poland in the period 1966–2024.
Sustainability 17 04447 g007
Figure 8. Number of events with HP observed in individual 6 h periods on the last day of HW (day 0) and the two following days.
Sustainability 17 04447 g008
Figure 9. Spatial distribution of relative frequency of HP events within (a) 36 h and (b) 12 h from noon of the last day of HW and the change in the chance of HP events after HW compared with HP within the entire summer period at (c) 36 h (d) 12 h following noon of the last day of HW.
Sustainability 17 04447 g009
Figure 10. Long-term changes in (a) the summer (JJA) number of HW (blue), HWLMP (black), and HWHP (red) events, with trend lines (dashed); (b) percent of HW followed by LMP events (blue) and HP events (black), with trend lines (dashed). Slopes and determination coefficients are given in the upper left corners.
Sustainability 17 04447 g010
Figure 11. HWHP on 8 July 2001 with (a) mean maximum temperature exceedance of 95th percentile (color scale and values); (b) precipitation totals for HWHP0-2 (color scale), and precipitation totals for individual D0, D1, and D2 (values); (c) satellite nature image on D0 (03:00 p.m. UTC); (d) satellite cloud tops alert image on D0 (03:00 p.m. UTC); (e) satellite nature image on D1 (03:00 p.m. UTC); (f) satellite nature image on D2 (05:00 a.m. UTC). Note. HWHP (noted with a circle) is the station where HW ended with HP, D0 is the last day of HW, D1 is the first day after the HW, and D2 is the second day after the HW.
Sustainability 17 04447 g011
Figure 12. HWHP on the date 29 July 2013 with (a) mean maximum temperature exceedance of 95th percentile during the HW (color scale and values); (b) precipitation totals for HWHP0-1 (color scale) and precipitation totals for individual D0 and D1 (values); (c) satellite HD image (D0 16:30 UTC); (d) satellite cloud tops (D0 21:00 UTC). Note. HWHP (noted with a circle) is the station where HW ended with HP, D0 is the last day of HW, and D1 is the first day after the HW.
Sustainability 17 04447 g012
Figure 13. HWHP on 10 August 2018 with (a) mean maximum temperature exceedance of 95th percentile (color scale and values); (b) precipitation totals for HWHP0-1 (color scale) and precipitation totals for individual D0 and D1 (values); (c) satellite HD image (D0 15:30 UTC); (d) satellite cloud tops (D0 15:30 UTC); (e) satellite HD image (D1 9:00 UTC). Note. HWHP (noted with a circle) is the station where HW ended with HP, D0 is the last day of HW, and D1 is the first day after the HW.
Sustainability 17 04447 g013
Table 1. Number of days on which HWHP event is observed in each month.
MonthsNumber of Days
May6
June59
July136
August91
September10
Disclaimer/Publisher’s Note: The statements, opinions and data contained in all publications are solely those of the individual author(s) and contributor(s) and not of MDPI and/or the editor(s). MDPI and/or the editor(s) disclaim responsibility for any injury to people or property resulting from any ideas, methods, instructions or products referred to in the content.

