1. Introduction
Methylene blue (MB) is a synthetic dye extensively used in industries such as textiles, pharmaceuticals, and paper manufacturing, resulting in significant water pollution. Even at trace concentrations, MB poses environmental and health risks, demanding highly sensitive detection methods and effective removal strategies [
1,
2]. Human exposure to MB can lead to symptoms such as increased heart rate, cyanosis, vomiting, and shock [
1]. In aquatic ecosystems, even low MB concentrations can be harmful. For example, the microalga
Spirulina platensis exhibits an EC
50 value of 1.08 mg/L (~3.37 × 10
−6 M), and the crustacean
Daphnia magna shows chronic toxicity at concentrations as low as 4.7 μg/L (~1.47 × 10
−7 M) [
3,
4]. Although specific regulatory limits for MB residues in food are not well defined, its potential for bioaccumulation raises concerns for both environmental and food safety [
5].
The global discharge of synthetic dyes, including methylene blue, is estimated to reach approximately 7 × 10⁵ tons per year, exerting substantial pressure on freshwater ecosystems and necessitating the development of sustainable monitoring and remediation technologies. Conventional treatment approaches, such as chemical coagulation and Fenton oxidation, often involve high reagent consumption, generate considerable sludge volumes, and impose significant energy demands. Therefore, addressing these environmental challenges requires innovative solutions that balance environmental protection, economic viability, and social equity.
Standard analytical techniques, such as UV–Vis spectroscopy and chromatography, often struggle to detect MB at ultra-trace levels without extensive sample preparation, limiting their applicability in environmental monitoring. For instance, one study reported a UV–Vis detection limit of 0.464 mg/L (~1.45 × 10
−6 M) [
6], while another achieved a lower limit of 0.65 μg/L (~2.03 × 10
−8 M) using a combination of dispersive solid-phase and cloud point extraction methods—but at the cost of added complexity [
7]. These limitations highlight the need for advanced or complementary analytical approaches for trace detection of MB in aqueous environments.
Surface-enhanced Raman spectroscopy (SERS), first reported in the 1970s, has since evolved into a powerful analytical technique capable of enhancing Raman signals by several orders of magnitude. This enhancement arises from localized surface plasmon resonance (LSPR) effects occurring at nanostructured metal surfaces, where the collective oscillation of conduction electrons generates intense local electromagnetic fields that amplify the Raman signal of nearby molecules [
8]. Among various nanostructured materials, silver nanowires (AgNWs) have emerged as particularly effective SERS substrates due to their high aspect ratio and capacity to form dense plasmonic hot spots at junctions and overlapping points. For example, chemical etching of AgNWs has been shown to increase surface roughness and create additional SERS-active sites [
9], while aligned AgNW arrays prepared by self-assembly methods achieved enhancement factors as high as 6.12 × 10
11 under 532 nm laser excitation [
10]. Additionally, cross-patterned AgNW films deposited on gold substrates further enhance SERS activity by increasing the density of junctions that serve as hot spots [
11].
Despite its remarkable sensitivity, SERS-based detection presents certain limitations when compared to other analytical methods such as electrochemical sensors and immunosensors. One notable challenge is the variability in signal enhancement due to non-uniform substrate fabrication, which can impact reproducibility [
12]. Furthermore, SERS often requires optimization of laser excitation parameters and analyte–substrate interactions, which may limit its robustness in complex sample matrices [
13]. In contrast, electrochemical sensors typically offer straightforward miniaturization and real-time detection capabilities, while immunosensors benefit from high specificity owing to antibody–antigen recognition [
14,
15]. However, these techniques may lack the molecular-level information accessible through SERS and often require extensive labeling or immobilization strategies. Thus, integrating SERS with advanced substrate design and complementary degradation strategies can mitigate these issues and expand its applicability in environmental sensing.
MB is frequently used as a model molecule in SERS studies due to its intense and well-defined Raman peak at ~1626 cm
−1, associated with aromatic ring stretching vibrations. While silver nanostars and nanoparticles have been commonly employed for MB detection via SERS [
16], studies utilizing AgNW-based substrates for this purpose remain relatively scarce. The recent availability of commercially produced AgNWs with high purity and uniform dimensions has facilitated the fabrication of reliable and reproducible SERS substrates.
Effective environmental remediation, however, requires not only sensitive pollutant detection but also complete degradation into non-toxic byproducts. Advanced oxidation processes (AOPs) are widely applied for this purpose and have shown high efficacy in breaking down persistent organic pollutants such as MB [
1]. Among these, dielectric barrier discharge (DBD) plasma has drawn particular interest due to its ability to generate a wide range of reactive oxygen and nitrogen species (RONS) directly in aqueous solutions without the need for added reagents [
17]. The oxidative environment created by DBD plasma includes hydroxyl radicals (•OH), ozone (O
3), hydrogen peroxide (H
2O
2), and atomic oxygen (O), all of which contribute to MB degradation through mechanisms such as aromatic ring cleavage, demethylation, and deamination—ultimately leading to the formation of biodegradable intermediates or complete mineralization into CO
2 and H
2O [
18].
Titania nanostructures, particularly nanotubes (TiNTs), are extensively utilized in AOPs due to their high surface area, superior photocatalytic activity, and remarkable chemical stability. When exposed to ultraviolet (UV) and visible light, TiNTs facilitate the generation of reactive species capable of degrading organic dyes such as MB. The photocatalytic efficiency of TiNTs can be further improved by doping with elements like cerium, which enhances charge carrier separation and broadens the absorption spectrum [
19]. The prevalent use of TiNTs in photocatalytic water treatment highlights their significance as a complementary or alternative approach to plasma-based degradation processes.
Monitoring MB degradation is crucial for evaluating treatment efficiency. SERS poses a highly sensitive method to track molecular changes, detecting even trace concentrations beyond the limits of conventional techniques. By analyzing shifts in Raman bands, it enables the identification of intermediates, supports kinetic studies, and aids in optimizing degradation parameters [
20,
21].
The integration of ultra-sensitive SERS detection with reagent-free AOPs, such as DBD plasma and TiNT-mediated photocatalysis, offers a greener alternative to traditional methods by minimizing chemical inputs, secondary pollution, and energy consumption. This approach directly contributes to United Nations Sustainable Development Goal (SDG) 6, particularly targets 6.3 (improving water quality by reducing pollution) and 6.a (expanding international cooperation and technology transfer for water-related activities), supporting global efforts toward sustainable water management.
Several studies have demonstrated the utility of SERS for detecting and monitoring the degradation of organic dyes such as MB, typically employing silver nanoparticles, nanostars, or composite nanostructures as active substrates [
16,
20,
21]. These platforms have achieved high enhancement factors and have been applied to evaluate photocatalytic processes and dye–substrate interactions. However, most reports emphasize qualitative detection or narrow concentration ranges, often under optimized laboratory conditions with less emphasis on degradation kinetics or the tracking of residual intermediates. Furthermore, AgNW-based substrates—despite their high enhancement potential due to well-defined plasmonic junctions—remain underexplored in degradation studies. In this work, we address these gaps by developing an accessible AgNW–SERS platform capable of detecting MB at concentrations as low as 10
−16 M and by applying it to monitor degradation dynamics induced by both DBD plasma and TiO
2 nanotube photocatalysis. The ability to establish a semi-quantitative correlation between MB concentration and SERS intensity over twelve orders of magnitude represents a significant advance toward high-sensitivity, molecule-level environmental diagnostics, and time-dependent monitoring of pollutant degradation.
2. Materials and Methods
2.1. SERS Substrate Preparation
SERS substrates were prepared by drop-casting 10 µL of an aqueous silver nanowire solution (Nanostructured & Amorphous Materials Inc., code 0475NW3W, Beijing, China; diameter: 25–35 nm, length: 15–25 µm) onto clean glass slides, followed by drying at room temperature overnight. Fabrication requires no organic solvents and generates negligible solid waste, illustrating a benign-by-design approach aligned with green nanofabrication principles. The resulting dried AgNW spots served as SERS-active substrates for Raman analysis. Additional details regarding substrate preparation and characterization are provided in the
Supplementary Materials (Section S1, Figures S1 and S2).
2.2. Methylene Blue Solutions
Methylene blue (MB, C16H18ClN3S, CAS No. 7220-79-3, Sigma-Aldrich (São Paulo, Brazil), ≥82% dye content) solutions were prepared at seven different concentrations—1.5 × 10⁻⁴ M, 1.5 × 10⁻⁵ M, 1.5 × 10⁻⁶ M, 1.5 × 10⁻⁷ M, 1.5 × 10⁻¹⁰ M, 1.5 × 10⁻¹³ M, and 1.5 × 10⁻¹⁶ M—using deionized water as the solvent. A 10 µL drop of each solution was deposited onto the AgNW substrates for Raman analysis. For control experiments, identical volumes of each concentration were also placed on bare glass slides to verify the enhancement due to the SERS effect.
2.3. Synthesis, Characterization, and Photocatalytic Application of Titanate Nanotubes (TiNTs) for Methylene Blue Degradation
TiNTs were synthesized via a hydrothermal method. Briefly, 1 g of TiO
2 nanoparticles—prepared according to the method described by da Silva et al. (2019) [
22]—was dispersed in 50 mL of a 10 mol·L
−1 sodium hydroxide (NaOH, Cinética) solution and stirred at 600 rpm for 20 min. The mixture was then transferred to a Teflon-lined stainless steel autoclave and heated at 150 °C for 24 h. The resulting precipitate was washed by centrifugation using a 0.1 mol·L
−1 hydrochloric acid (HCl, Neon) solution, followed by repeated rinsing with deionized water until the pH reached 5. The final product was dried at 60 °C for 24 h.
The morphology and structure of the synthesized nanomaterial were comprehensively characterized using transmission electron microscopy (TEM), Raman spectroscopy, and X-ray diffraction (XRD), as detailed in the
Supplementary Materials (Section S2, Figures S3–S5). TEM imaging revealed cylindrical, hollow structures with average lengths of 148 ± 68 nm and diameters of 8 ± 1 nm. Raman spectra confirmed the presence of anatase and rutile TiO
2 phases, along with characteristic Ti–O and Ti–OH vibrational modes associated with titanate structures.
Importantly, the XRD pattern exhibited a distinct low-angle reflection at 2θ ≈ 10°, indicative of the (200) plane of hydrogen trititanate (H
2Ti
3O
7 or H
2Ti
6O
13), which is a hallmark of scroll-like nanotube structures. This feature is not typically observed in nanorods, which require higher hydrothermal synthesis temperatures and present different diffraction profiles. As reported by Lan et al. [
23], nanorods tend to form at temperatures exceeding 180 °C and display sharper peaks corresponding to more crystalline phases. Thus, the combination of morphological and structural features observed here confirms the successful synthesis of titanate nanotubes under the adopted conditions.
To evaluate the photocatalytic degradation of MB, a stock solution with a concentration of 10 mg·L−1 was prepared. TiNTs were employed as the photocatalyst, with 0.5 mg of TiNTs added to 60 mL of the MB solution.
The experiment commenced with a 15 min dark stirring period to ensure homogeneous dispersion of the photocatalyst and to allow adsorption–desorption equilibrium between MB molecules and the TiNT surface. A sample collected at the end of this period was designated as the “initial” condition.
Following this equilibration phase, the suspension was exposed to UV irradiation under continuous stirring in a photodegradation chamber. Aliquots were withdrawn at predetermined intervals of 15, 30, 60, 75, and 90 min using a syringe. To prevent interference in subsequent analyses, TiNTs were removed from each aliquot via syringe filtration.
Immediately after collection, the filtered aliquots were analyzed using UV–Vis spectroscopy to determine the residual MB concentration. Portions of each sample were also reserved for SERS analysis using AgNW-based substrates, as illustrated in
Scheme 1.
2.4. Degradation of Methylene Blue via Dielectric Barrier Discharge (DBD) Plasma
A separate set of experiments was performed using a coaxial DBD plasma system [
24,
25] operated with compressed air supplied at 5 L/min to evaluate the degradation of MB under plasma-induced advanced oxidation conditions.
For this experiment, 60 mL of the 10 mg/L MB solution was placed in a beaker and subjected to direct exposure from the air plasma jet for 40 min. During treatment, approximately 2 mL aliquots were collected at specific time points (1, 2, 3, 4, 5, 6, 7, 8, 9, 10, 15, 20, 30, and 40 min) using Pasteur pipettes.
After collecting, all aliquots were immediately analyzed by UV–Vis spectroscopy to quantify the remaining MB concentration. In addition, portions of each sample were used for SERS measurements. For this purpose, 10 µL of each aliquot was dropped-cast onto AgNW-coated glass substrates and left to dry overnight at room temperature, as depicted in
Scheme 1.
2.5. Optical Characterization of MB Solutions
UV–Vis spectroscopy was utilized to analyze the absorbance spectra of the MB samples before and after treatment with plasma or photodegradation. Measurements were conducted using a Thermo Scientific GENESYS 180 spectrophotometer (Thermo Scientific Brazil, São Paulo, Brazil), covering a spectral range from 200 to 800 nm. All measurements were performed using a 10 mm path-length quartz cuvette to ensure accurate optical transmission and minimize interference in the UV range.
Fluorescence emission spectra were acquired using a Fluoromax Plus-C spectrofluorometer (HORIBA, São Paulo, Brazil). Samples were contained within a 10 mm path-length quartz cuvette. Excitation was performed at 450 nm, and emission spectra were recorded over the wavelength range of 500 to 800 nm.
2.6. Raman Spectroscopy
Raman spectra were acquired using a LabRAM Odyssey Raman spectrometer (HORIBA, São Paulo, Brazil) equipped with excitation lasers at 532 nm, 633 nm, and 785 nm. Spectral acquisition was performed in the 100–1700 cm
−1 range. A 50× long working distance objective was employed for measurements in liquid-phase samples, while both 50× and 100× objectives were used for dried samples, depending on the specific experimental configuration and desired spatial resolution (see
Figure S6 of the Supplementary Materials).
All AgNW-based SERS substrates were prepared and dried under stable ambient laboratory conditions (22–24 °C, relative humidity ~50–55%) to ensure the reproducibility of nanowire self-assembly and hot spot formation. Although no active environmental control system was used, maintaining consistent temperature and humidity during substrate drying proved important for achieving uniform SERS responses and should be standardized in future applications.
Raman measurements were also conducted under the same ambient conditions, without external temperature regulation. To assess the background signal and minimize interferences, preliminary spectra were acquired on bare glass slides before testing the AgNW substrates. Laser power settings (3 mW, 0.3 mW, and 0.03 mW) and integration times were optimized to prevent localized heating, photothermal damage, and detector saturation—especially at higher MB concentrations (10−4 to 10−6 M). These precautions also contributed to improved signal detection at ultra-low concentrations.
For the quantitative assessment of the SERS enhancement factor (EF), the Raman band at approximately 1626 cm−1—assigned to the C–C ring stretching mode of MB—was selected due to its high intensity, reproducibility, and minimal spectral overlap with other features. Slight shifts of ±5 cm−1 were occasionally observed, consistent with variations arising from analyte–substrate interactions and experimental conditions.
The number of probed molecules (N) was estimated based on the analyte concentration, the laser spot size, and the dried droplet area, following the detailed methodology provided in the
Supplementary Information. This approach allowed the EF to be calculated consistently by normalizing the Raman and SERS intensities with respect to molecular density.
The
EF was calculated for each concentration using the following equation, which accounts for differences in acquisition parameters such as laser power and exposure time [
26,
27]:
where
and
are the integrated intensities of the selected peak for the SERS-active (AgNW substrate) and non-SERS-active (glass slide) samples, respectively;
t denotes the acquisition time,
the laser power, and
the estimated number of molecules probed within the laser excitation volume for each case.
This methodology enables consistent and comparative evaluation of signal enhancement across varying sample conditions and concentrations.
3. Results
3.1. Optical and Fluorescence Characterization of MB Samples
Methylene blue was used as the model dye in this study and prepared by dissolving the solid compound in deionized water. Its UV–Vis absorption spectra across a broad concentration range—from 1.5 × 10
−4 M to 1.5 × 10
−16 M—are shown in
Figure 1.
Figure 1a displays the spectra for concentrations between 1.5 × 10
−4 M and 1.5 × 10
−5 M. At 1.5 × 10
−4 M, strong absorbance is observed across the visible range (particularly from ~520 to 700 nm), accompanied by spectral broadening and baseline elevation due to optical saturation and molecular aggregation. As the concentration decreases, the spectrum becomes more resolved, with four characteristic peaks emerging at 246, 292, 613, and 664 nm. The peak at 664 nm is attributed to monomeric MB, while the shoulder at 613 nm is indicative of aggregated species in solution [
28,
29].
Figure 1b presents data corresponding to ultra-dilute analyte concentrations (1.5 × 10
−8 M to 1.5 × 10
−16 M). In this range, absorbance values drop significantly, and spectral features become less defined. The 664 nm peak, although still discernible at higher dilutions, approaches the detection limit of the UV–Vis spectrophotometer as concentration decreases, limiting reliable quantification below approximately 10
−7 M.
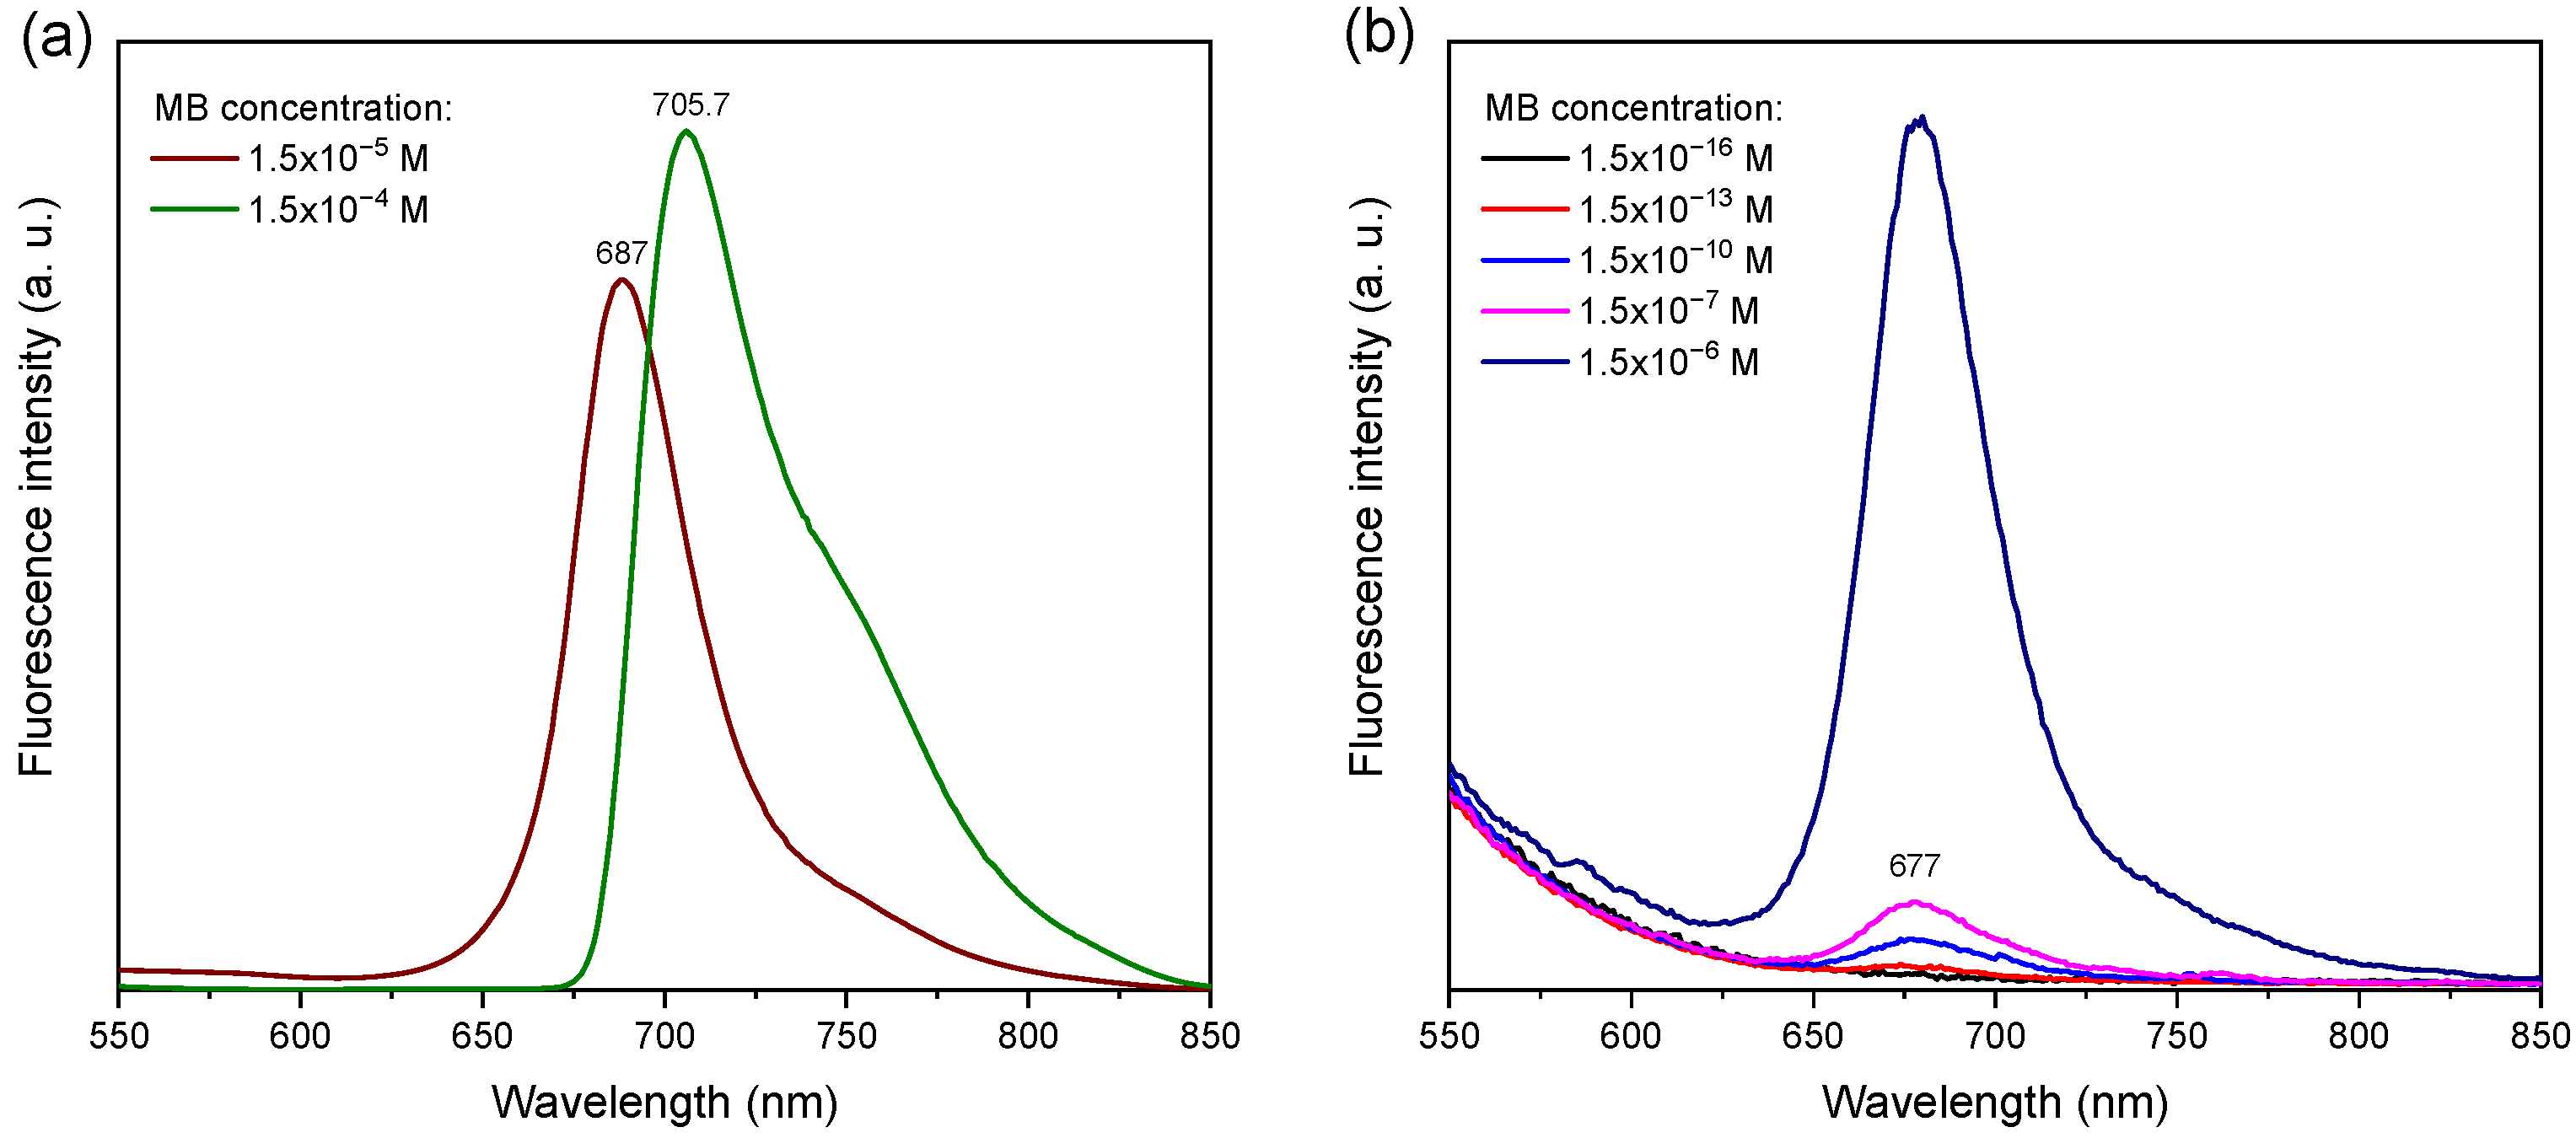
Figure 2 shows the fluorescence emission spectra of MB in deionized water across concentrations from 1.5 × 10
−16 M to 1.5 × 10
−4 M. At low concentrations, a well-defined emission band centered around 677 nm is observed, corresponding to the radiative decay of monomeric MB in aqueous solution [
29]. This emission remains clearly detectable down to 1.5 × 10
−13 M, highlighting the high sensitivity of fluorescence spectroscopy under the conditions employed.
At higher concentrations, particularly at 1.5 × 10
−4 M, the emission peak undergoes red-shifting and broadening (
Figure 2a), effects typically attributed to molecular aggregation. Such aggregates alter the electronic environment and result in distinct emissive behavior compared to monomeric species [
30]. Although the fluorescence intensity initially increases with concentration, it eventually plateaus or decreases due to self-quenching, driven by close molecular packing and energy transfer between excited states.
In contrast, for MB concentrations of 1.5 × 10
−14 M and below (
Figure 2b), the emission signal becomes indistinguishable from baseline noise, setting 1.5 × 10
−13 M as the practical fluorescence detection limit in this system.
The emission profile of MB overlaps with common Raman excitation wavelengths, which has implications for SERS measurements. The fluorescence maximum at ~677 nm lies near the 633 nm laser line and significantly overlaps with the 785 nm region due to spectral broadening at high concentrations. This overlap may introduce substantial fluorescence background, interfering with the detection of Raman signals at those excitation wavelengths.
In contrast, excitation at 532 nm—though further from the emission maximum—provides a higher Raman scattering cross-section and can yield stronger SERS signals. However, it also increases the risk of photodegradation or fluorescence saturation at high dye concentrations. Therefore, the selection of an excitation wavelength must balance minimizing fluorescence background and maximizing SERS signal enhancement.
3.2. SERS of MB and Fluorescence Interference
Figure 3 displays the Raman spectra of MB at a concentration of 1.5 × 10
−5 M, obtained using three different excitation wavelengths: 532 nm, 633 nm, and 785 nm. Clear differences in spectral quality and fluorescence interference are evident, primarily influenced by the overlap between the MB emission spectrum and the excitation wavelength.
Among the lasers tested, the 633 nm excitation produced the highest-quality Raman spectrum, with strong signal intensity, well-defined peaks, and minimal fluorescence background. This result is attributed to the proximity of the excitation wavelength to, but slightly below, the MB emission maximum (~677 nm), reducing overlap with fluorescence emission while still ensuring effective Raman scattering.
The 532 nm laser also enabled the observation of key Raman features; however, the spectra exhibited increased the fluorescence background, likely due to the higher photon energy and excitation efficiency of this wavelength, which can promote photoluminescence and possible photodegradation—especially at higher concentrations. Despite this, the 532 nm line is commonly used for SERS due to its higher Raman cross-section [
31].
In contrast, 785 nm excitation resulted in a strong fluorescence background that significantly obscured the Raman features. This is consistent with the fluorescence spectra presented in
Figure 2, which shows intense and broad emission bands extending into the near-infrared region, overlapping the 785 nm excitation and detection window. As a result, the Raman signal was suppressed and the spectral baseline elevated, making 785 nm less suitable for MB detection under these conditions.
The characteristic Raman peaks of MB observed in this study are consistent with those reported by Li et al. [
32] and are listed in
Table 1. Notably, the most intense and reliable peak was consistently found at 1626 cm
−1, corresponding to the C–C ring stretching vibration. This peak was used for enhancement factor (EF) calculations due to its strong intensity and reproducibility across different samples and conditions. Additionally, a small peak at ~243 cm
−1 was observed in all spectra and is attributed to silver oxide, originating from the AgNW substrate.
To further assess the influence of laser power on signal quality and reproducibility, we focused on the 1626 cm
−1 Raman peak—chosen for its stability, high intensity, and consistent appearance across all experimental conditions. Across the full concentration range, we observed that higher laser powers (3 mW) yielded stronger signals but also increased the risk of spectral distortion due to local heating or saturation, especially at micromolar MB concentrations. Conversely, lower powers (0.3 mW and 0.03 mW) reduced this risk and were more suitable for measurements in the single-molecule regime. This power-dependent behavior aligns with the response trends observed in the calibration curves (see
Figure 4b), where signal intensity exhibits nonlinear increases at higher concentrations, potentially influenced by both molecular adsorption dynamics and partial signal saturation. These findings emphasize the importance of carefully optimizing laser parameters when employing SERS for quantitative analysis.
3.3. Determination of MB Concentration and Enhanced Factor via SERS
Figure 4a presents the Raman spectra of MB at concentrations ranging from 1.5 × 10
−16 to 1.5 × 10
−4 M, acquired using 633 nm laser excitation. These results demonstrate the remarkable sensitivity of the AgNW-based SERS substrates, which enabled the detection of MB at concentrations far below the detection limits of conventional optical techniques. The characteristic Raman band at ~1626 cm
−1 becomes increasingly intense with concentration, making it a robust marker for detection and quantification.
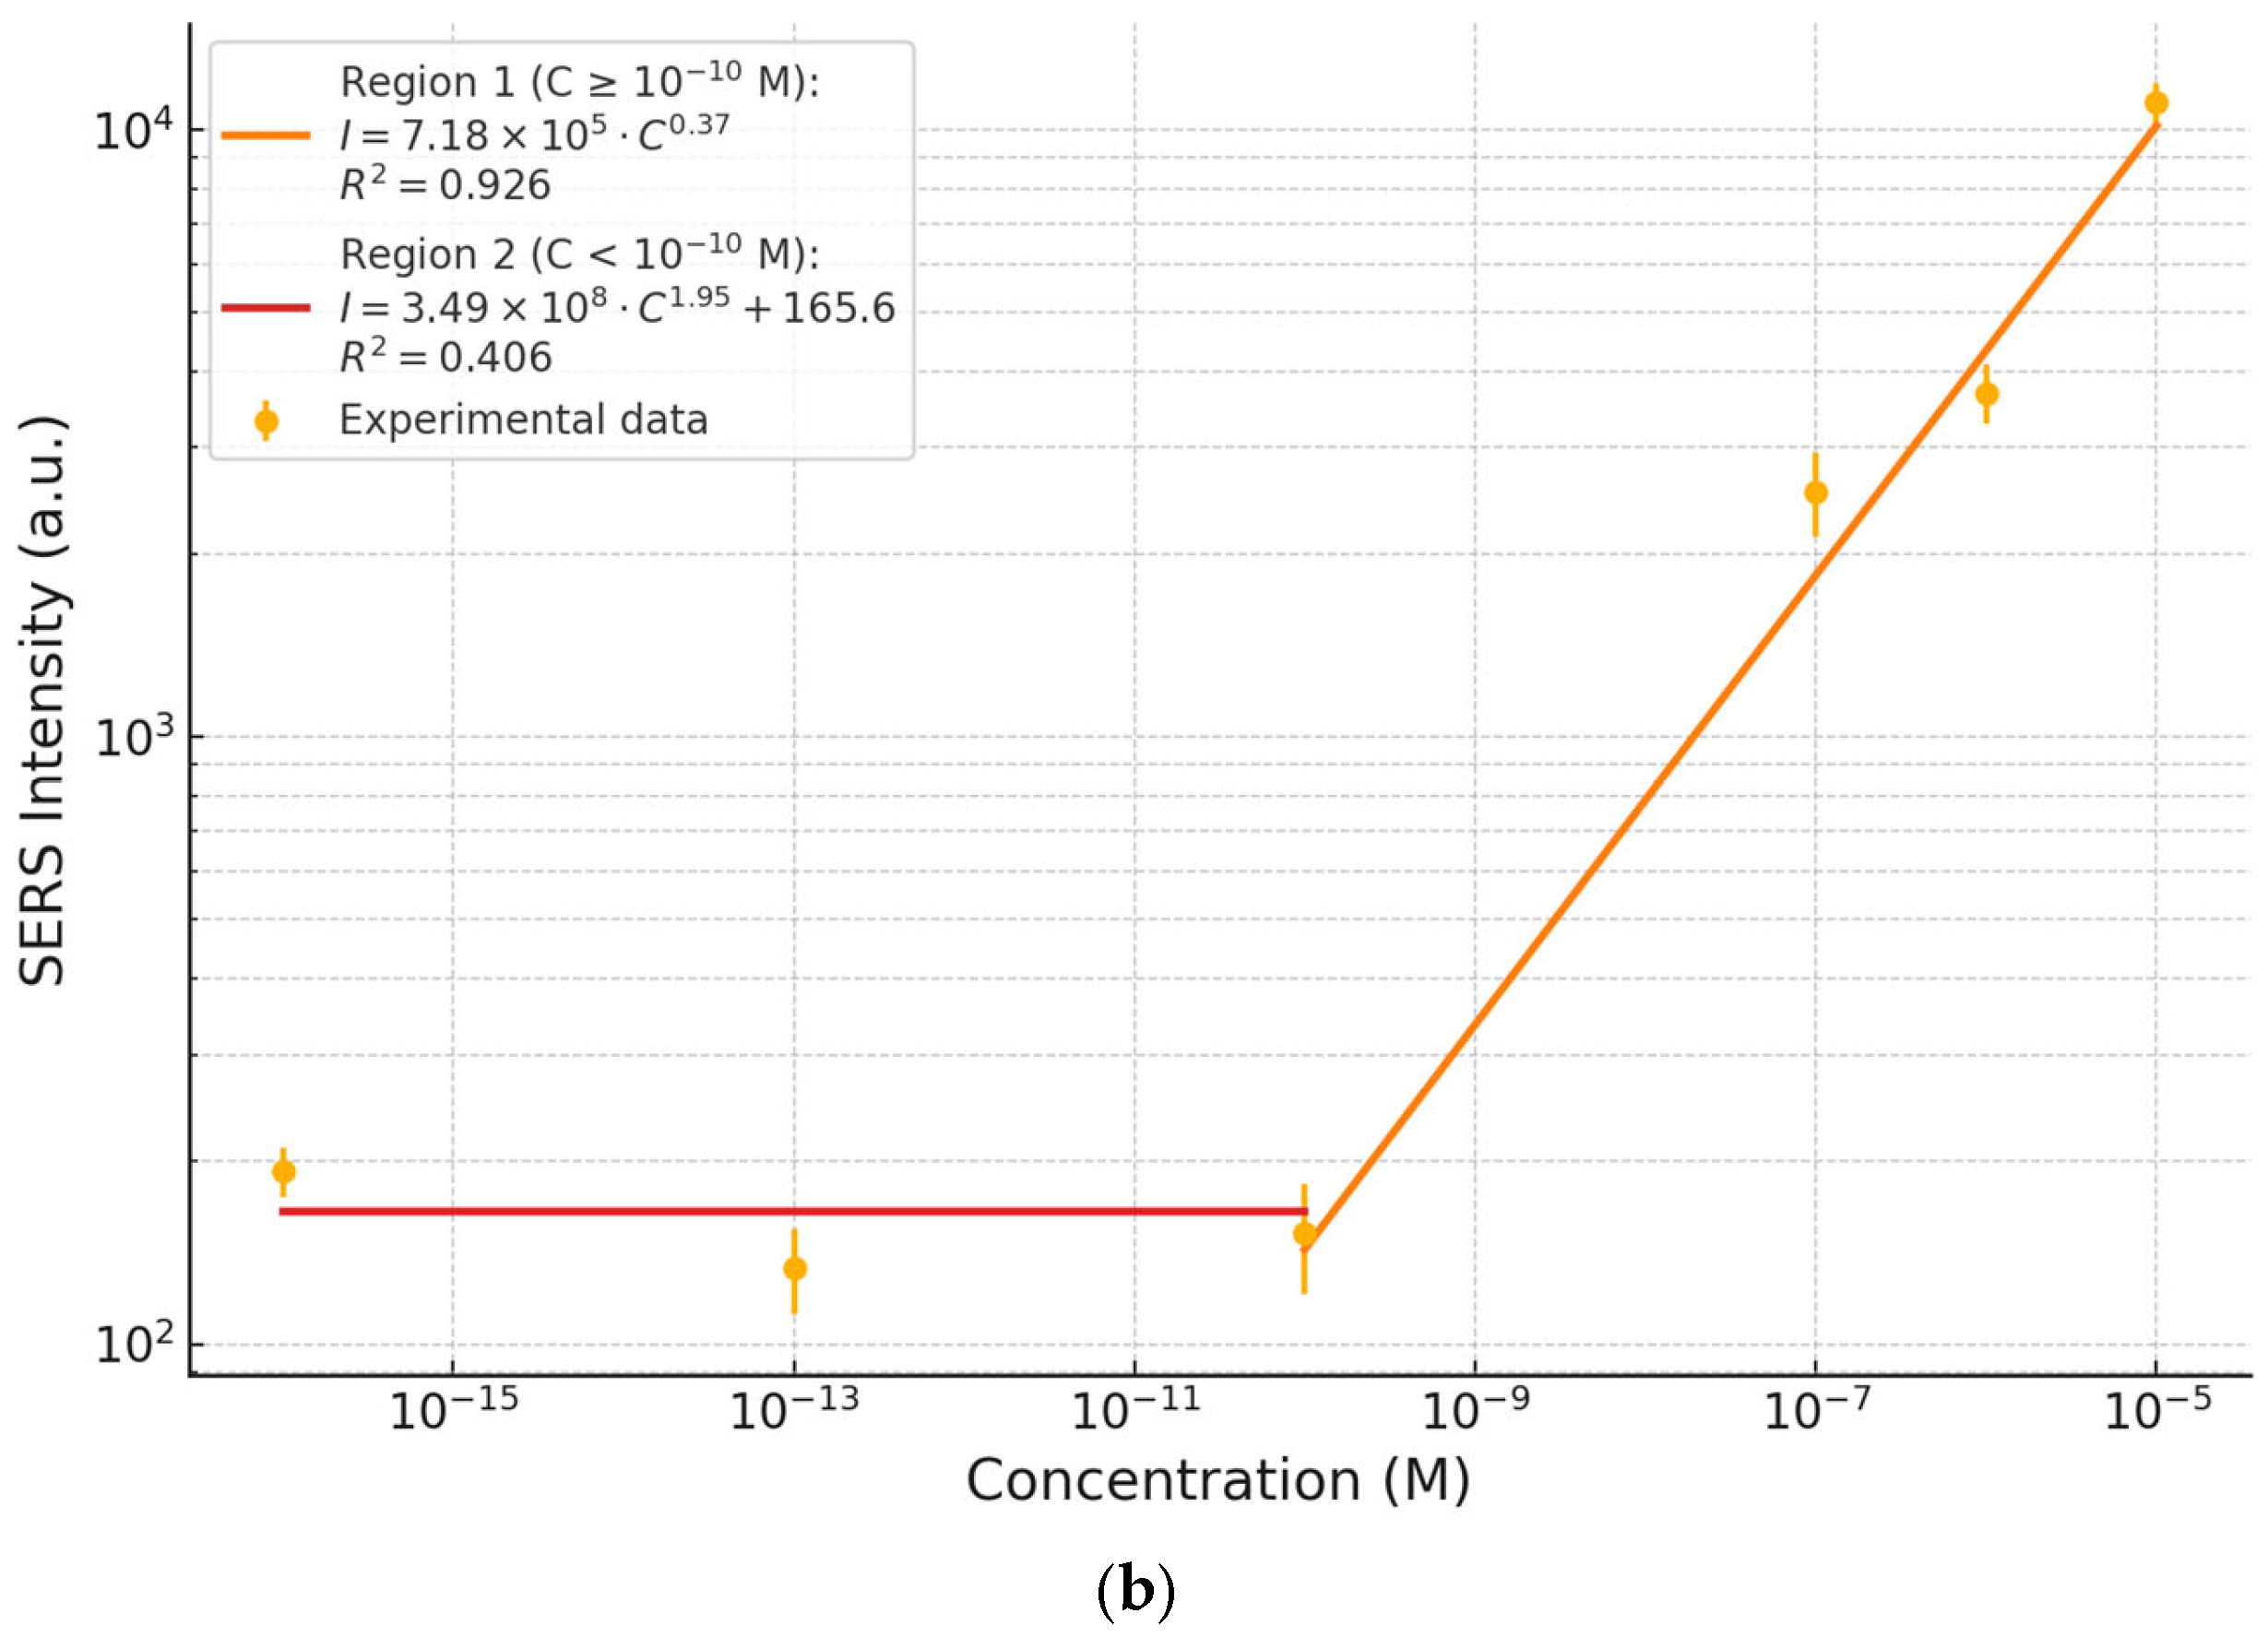
To evaluate the semi-quantitative performance of the SERS platform, the intensity of the 1626 cm
−1 peak was measured for each concentration and plotted as a function of MB concentration in
Figure 4b. The resulting calibration curve spans over more than ten orders of magnitude, divided into two distinct regions.
In Region 1 (C ≥ 10−10 M), a power-law relationship is observed, indicative of typical SERS behavior in which the signal increases with concentration due to enhanced molecular adsorption and activation at plasmonic hot spots. In Region 2 (C < 10−10 M), the signal plateaus, with minimal variation in intensity, reflect the detection limit of the platform and the transition into the single- or few-molecule regime.
Despite the nonlinear overall behavior—expected in SERS due to surface saturation effects, adsorption dynamics, and hot spot distribution—the response exhibits excellent reproducibility. This complex yet predictable trend underscores the platform’s robustness for semi-quantitative analysis, even at ultralow analyte concentrations.
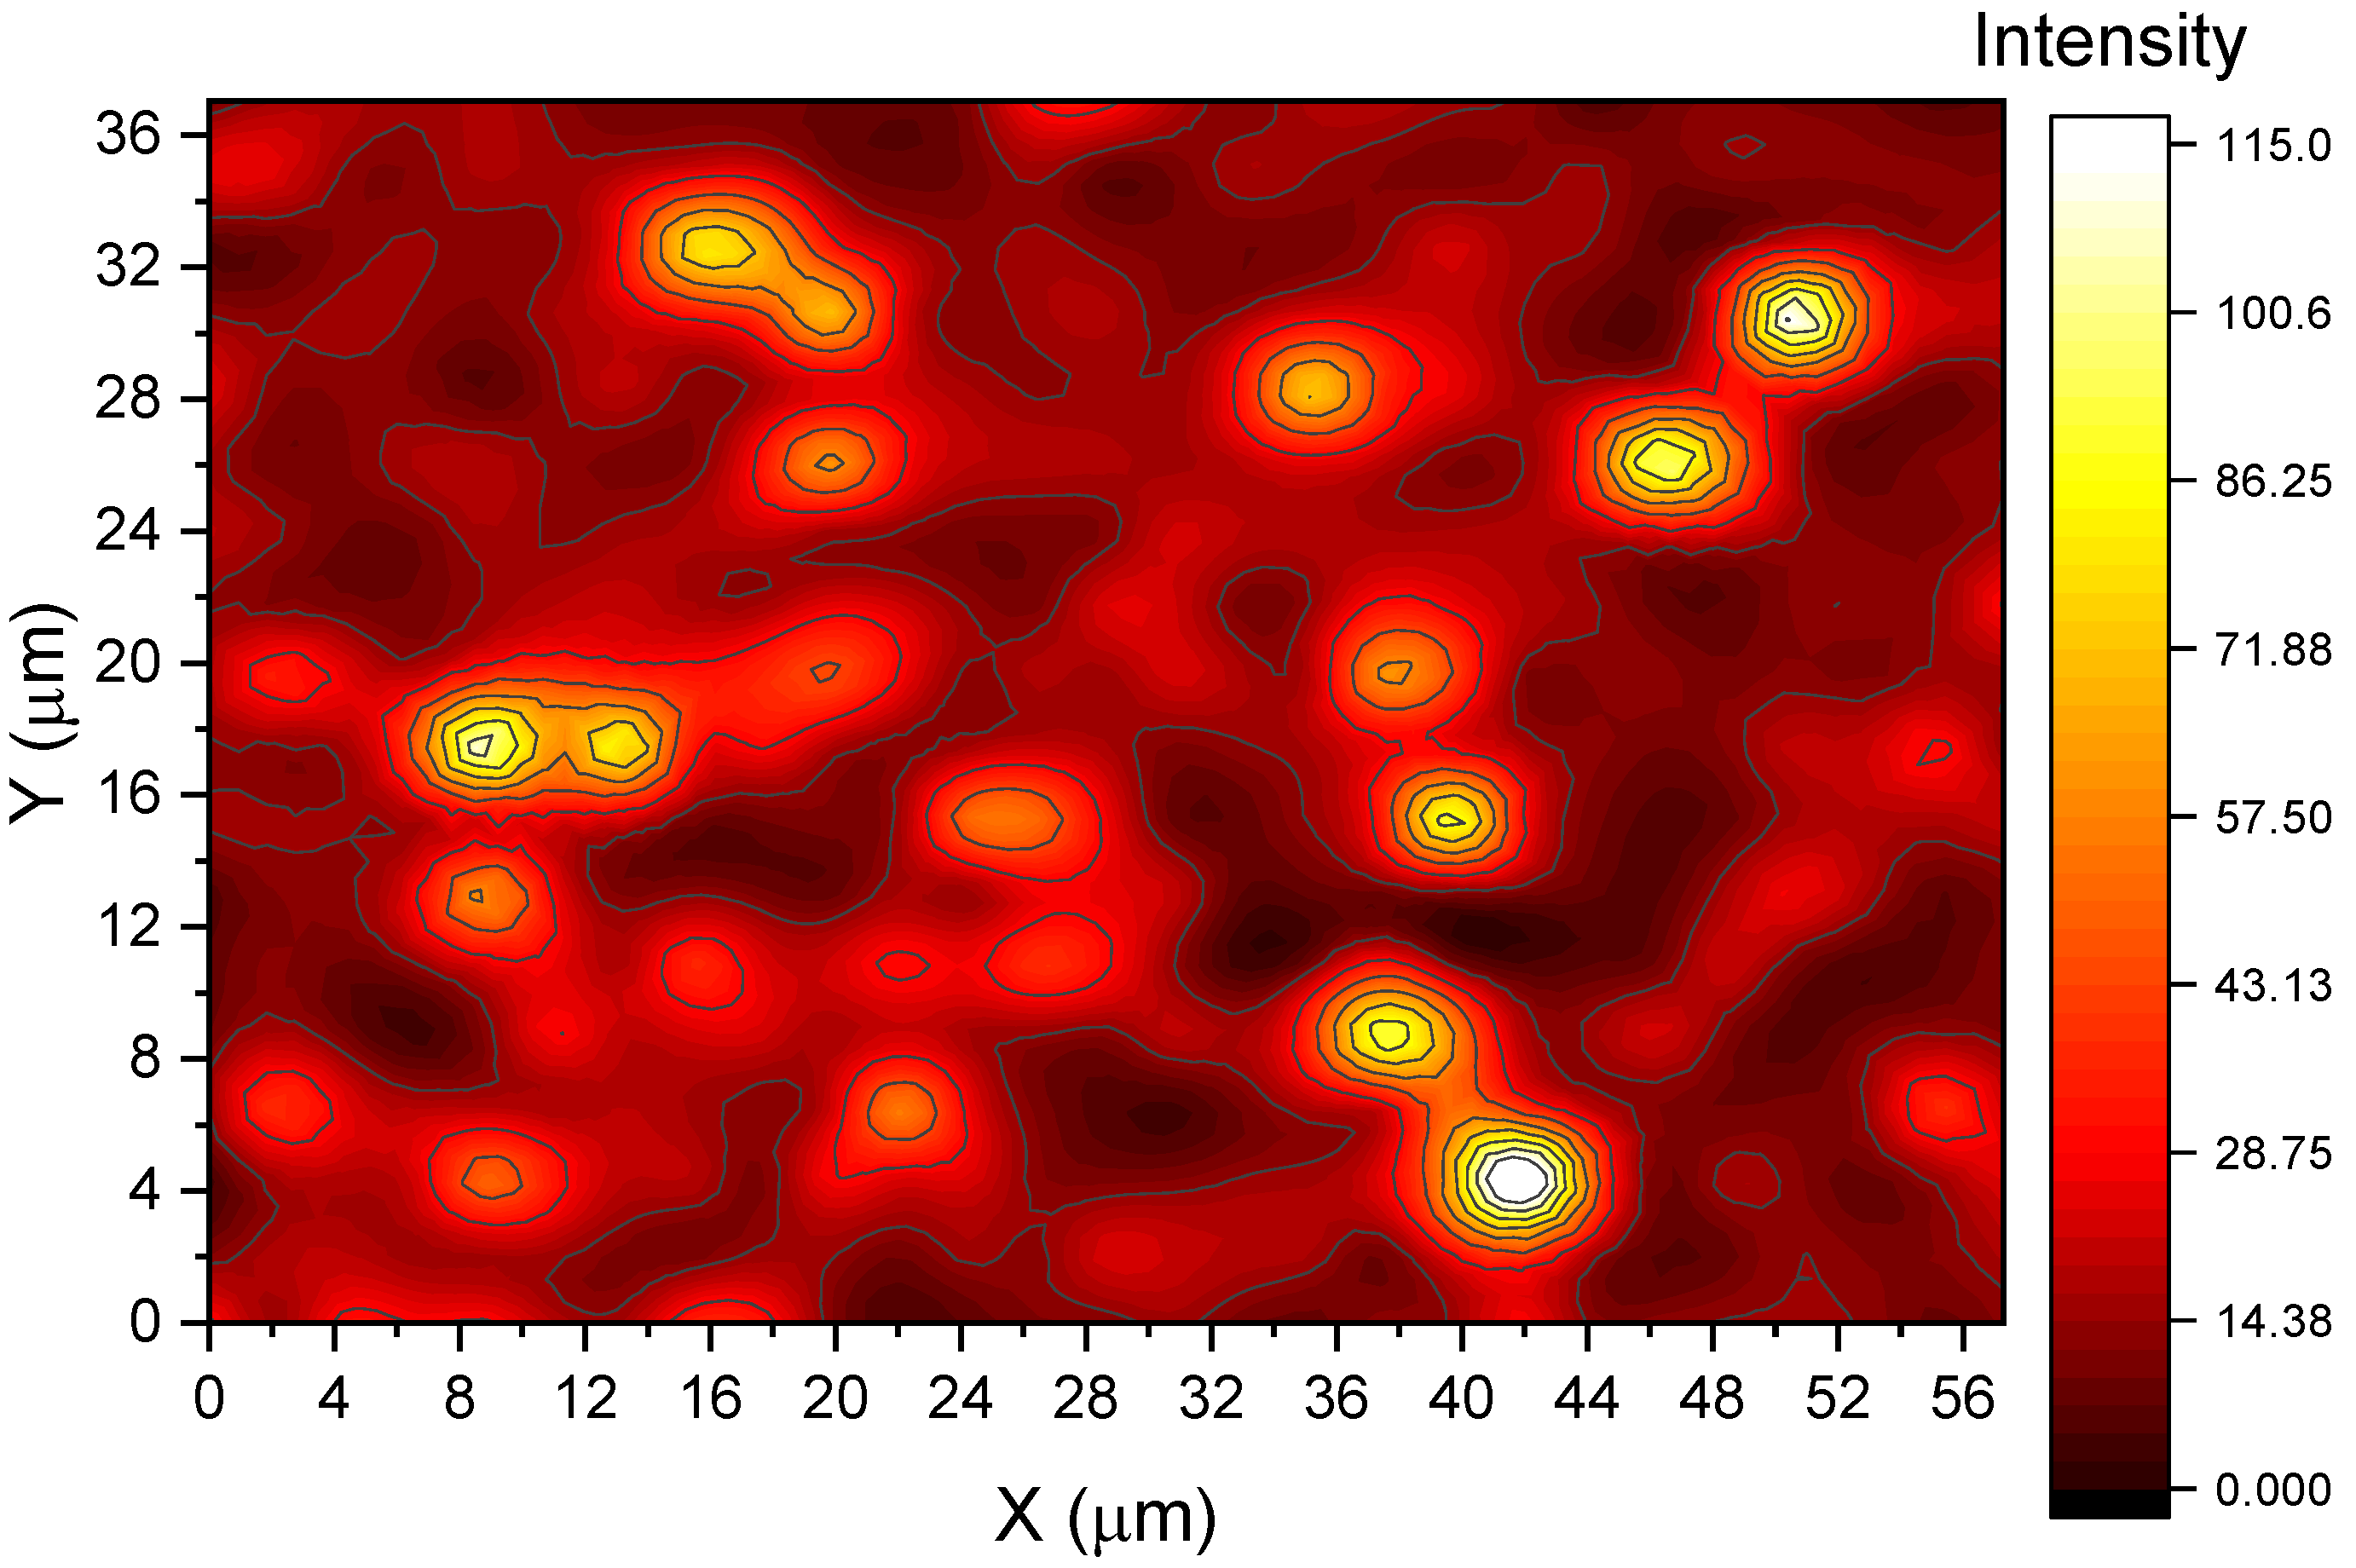
To confirm MB detection at the lowest tested concentration (1.5 × 10⁻¹⁶ M), Raman mapping was performed over a 57 × 37 µm area with a spatial resolution of 2.2 µm. At each point, spectra were collected using a 10 s acquisition time with three accumulations. After baseline correction, the 1626 cm−1 peak intensity was extracted for spatial analysis.
As shown in
Figure 5, only a few localized spots exhibited measurable Raman signals, corresponding to discrete SERS hot spots where individual or very few MB molecules were likely adsorbed. Based on the total number of MB molecules estimated to be present within the scanned area (approximately nine), the number of detected hot spots matches closely, confirming the system’s near-single-molecule detection capability.
It is worth noting that minor spectral shifts of the 1626 cm
−1 peak were observed across different MB concentrations. These shifts are commonly reported in SERS studies and are attributed to variations in the local chemical environment, analyte orientation on the AgNW surface, and hot spot-induced electromagnetic field effects [
33]. Additionally, an unexpected intensity inversion was observed—namely, the Raman signal at 1.5 × 10
−16 M was higher than that at 1.5 × 10
−13 M. This non-monotonic behavior is characteristic of the single-molecule detection regime and is attributed to stochastic analyte–hot spot interactions. At such ultralow concentrations, signal intensity is not linearly correlated with analyte quantity, but rather governed by the probability that individual MB molecules adsorb precisely at plasmonic junctions exhibiting maximal field enhancement. In this context, a favorable hot spot–analyte alignment at a lower concentration can yield stronger signals than a slightly higher concentration where analytes may not be optimally positioned. This phenomenon, consistent with the discrete high-intensity regions observed in the Raman mapping (
Figure 5), has been reported in prior SERS studies employing similar detection strategies [
33,
34,
35,
36].
Further validation of the system’s sensitivity is provided by the calculated EFs, summarized in
Table 2. These values, derived from the intensity of the 1626 cm
−1 Raman peak, increase markedly with decreasing MB concentration, reaching an EF of 1.90 × 10
12 at 1.5 × 10
−16 M. This dramatic rise underscores the effectiveness of localized electromagnetic field enhancement at AgNW-based SERS hot spots and confirms the platform’s capacity for time-dependent, ultra-trace analyte detection with high spatial resolution.
When compared to values reported in the literature, the EFs obtained in this study are significantly higher. For instance, Vu et al. (2020) achieved an EF of 1.6 × 10
6 using silver nanodecahedra [
37]. Xiao and Man (2007) demonstrated EFs up to 4.2 × 10
7 using silver nanocaps synthesized via combined chemical and physical methods [
38]. More recently, Ren et al. (2025) reported an EF of 5.81 × 10
8 using spherical, flower-like, magnetic Fe₃O₄@CoNi layered double hydroxide nanostructures decorated with silver nanoparticles (Fe₃O₄@CoNi LDH@Ag) hybrid nanostructures [
39]. These comparisons highlight the exceptional performance of the present SERS platform, which outperforms many existing nanostructured substrates in terms of both sensitivity and detection range.
3.4. SERS and UV–Vis Analysis of Plasma-Treated MB Samples
To evaluate the degradation efficiency of atmospheric pressure plasma treatment on MB, a combination of SERS and UV–Vis analysis was employed.
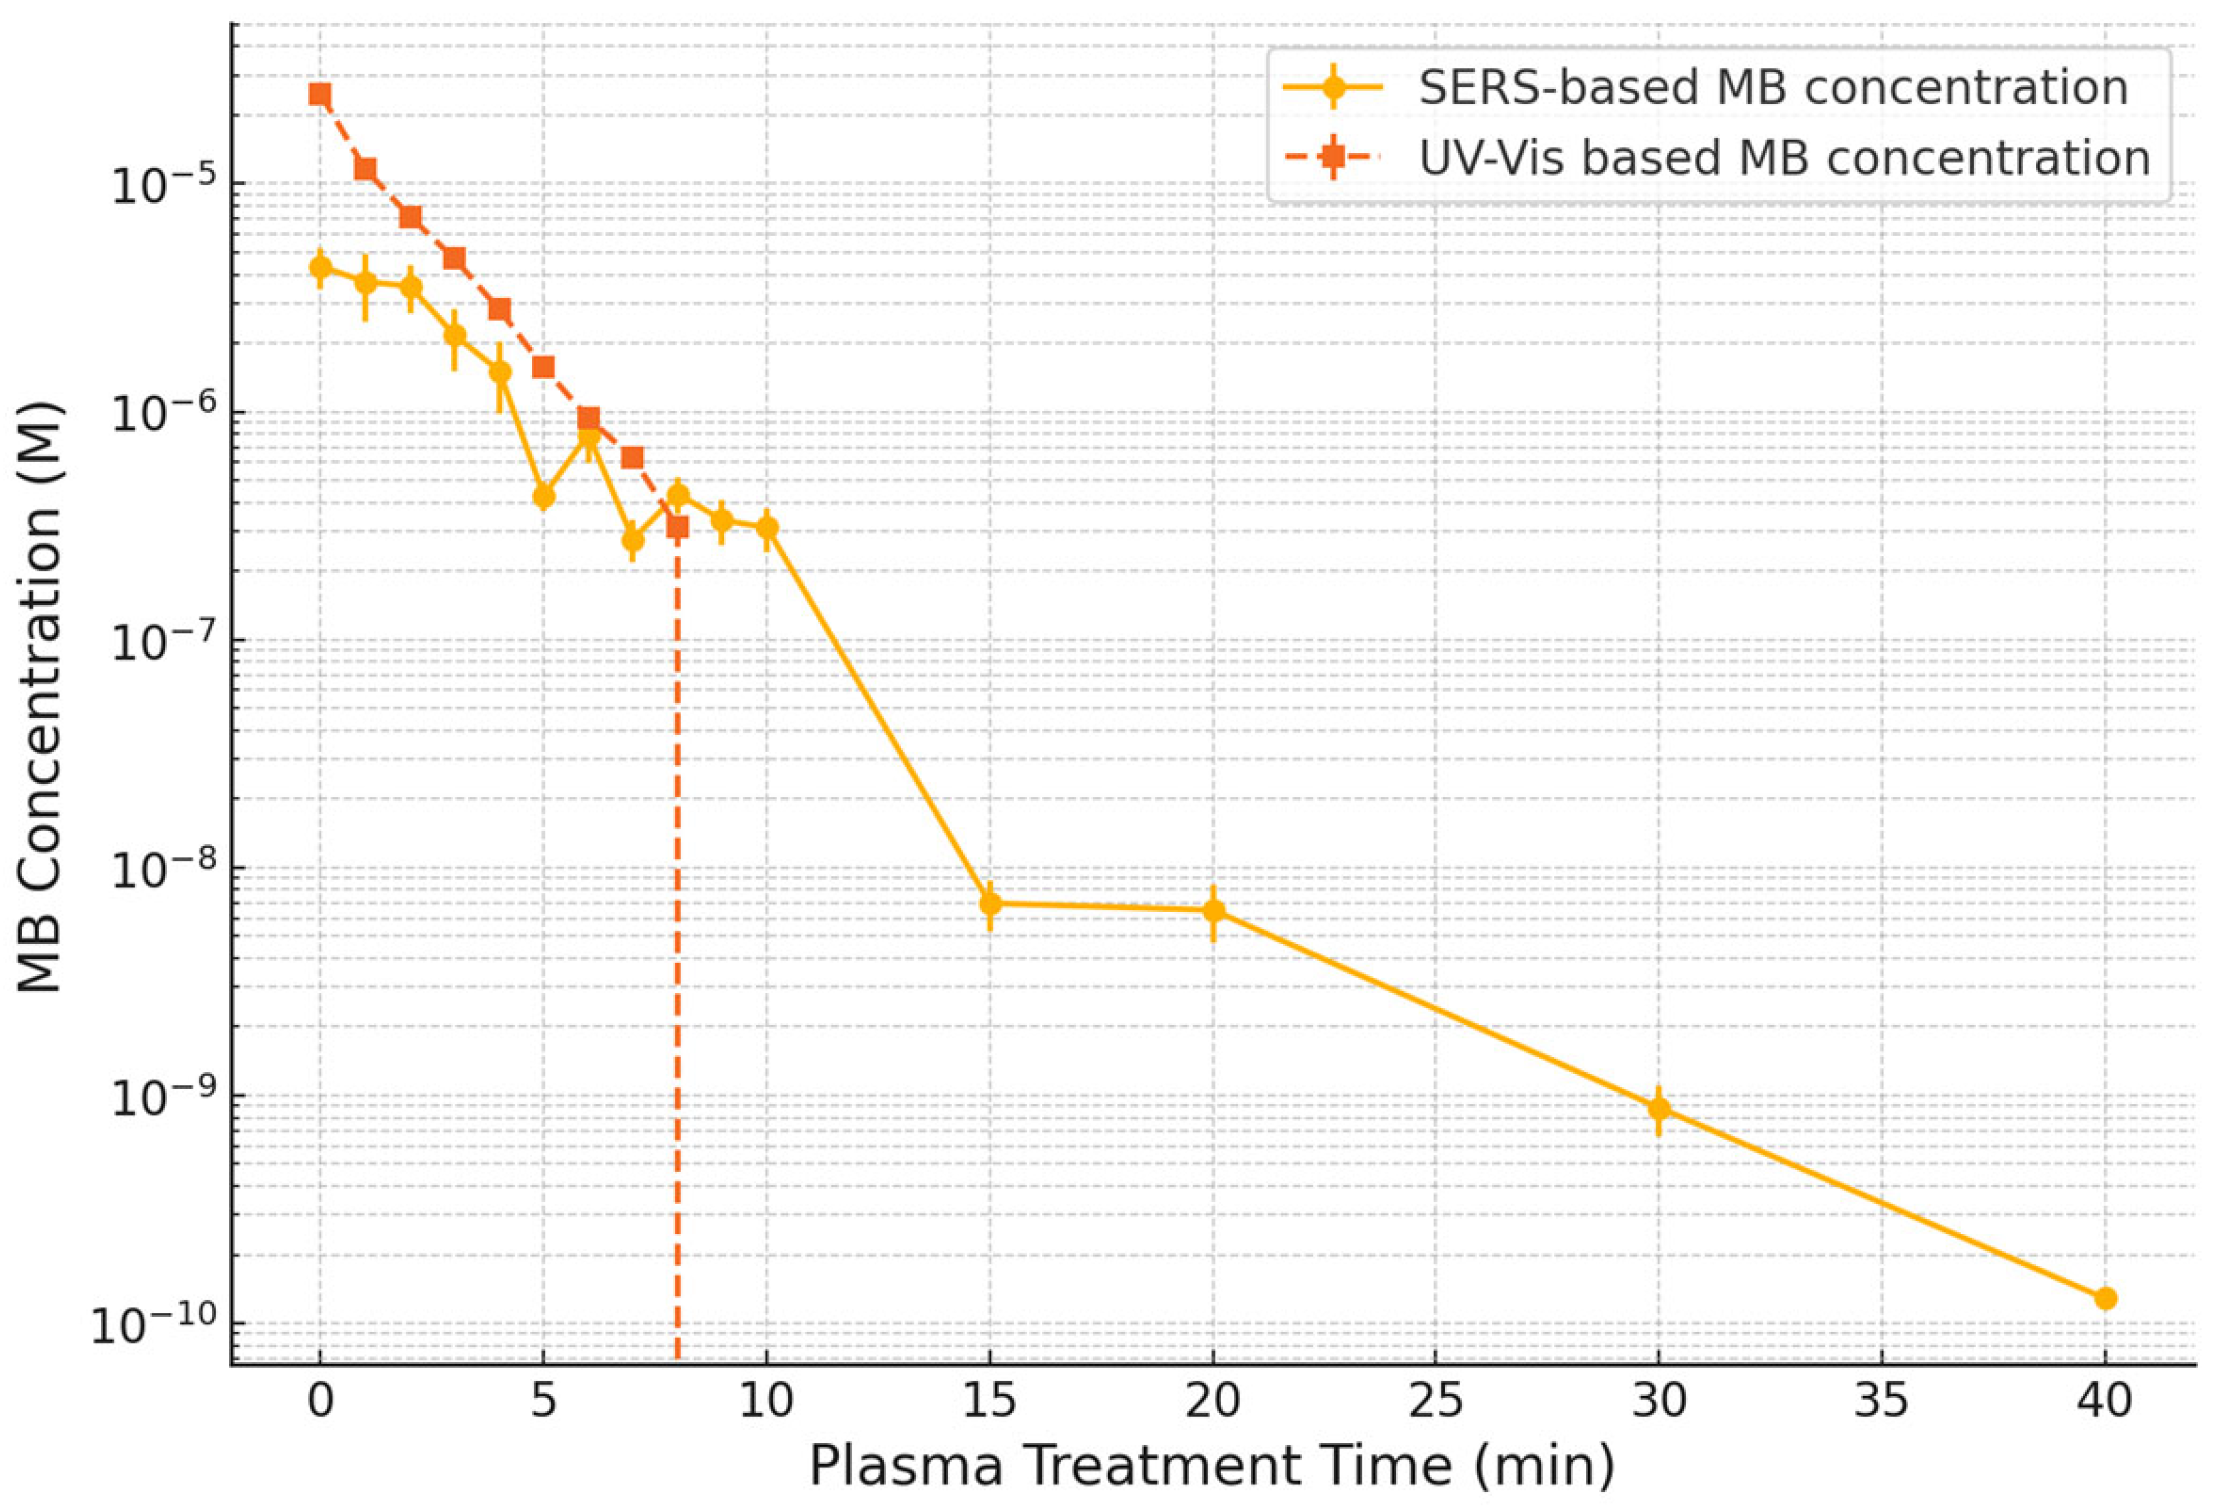
Figure 6 presents the temporal evolution of MB concentration as a function of plasma exposure time, derived from both UV–Vis and SERS data. The SERS-based concentration estimates were obtained by applying the calibration curve constructed in
Figure 4b to the spectral intensities of the 1626 cm
−1 peak extracted from the time-resolved spectra shown in
Figure S7b.
UV–Vis spectroscopy showed a rapid decrease in MB concentration, with the signal falling below the detection limit (~10
−7 M) after approximately 10 min of plasma treatment. This behavior is consistent with the visible decolorization observed in the treated samples (
Figure S8), indicating disruption of the chromophoric structure of MB. However, UV–Vis fails to provide information beyond this point, as no meaningful absorbance signal remains at lower concentrations.
In contrast, SERS analysis revealed continued detection of MB at concentrations well below the UV–Vis threshold. The characteristic Raman peak at ~1626 cm
−1 remained observable throughout the full 40 min plasma treatment (
Figure S7b), allowing for the estimation of MB concentration down to 10
−10 M using the dynamic response established in
Figure 4b. This extended sensitivity range highlights the superior capability of SERS for real-time monitoring of trace analyte levels, especially in advanced oxidation processes in which conventional optical techniques are insufficient.
The integration of the calibration curve with time-resolved spectral data allowed for a semi-quantitative assessment of the degradation kinetics. The non-linear decrease in MB concentration observed in
Figure 6 suggests that the degradation process does not follow simple first-order kinetics, but rather involves multiple concurrent pathways. This behavior is commonly reported in plasma-assisted advanced oxidation processes, in which the generation and interaction of RONS lead to both direct molecular fragmentation and stepwise oxidation through intermediate products [
40,
41].
The observed rapid initial decline in MB concentration during plasma treatment is likely due to the high reactivity of short-lived species such as hydroxyl radicals (•OH) and atomic oxygen (O), which are known to efficiently attack aromatic structures. This phenomenon has been documented in studies in which hydroxyl radicals play a significant role in the degradation of organic pollutants, including dyes like MB [
41,
42].
As the treatment progresses and MB concentration drops below micromolar levels, the reaction rate appears to plateau. This trend likely reflects limitations in the availability of target molecules at the plasma–liquid interface and possible accumulation of refractory intermediates that are less reactive or more resistant to further degradation. Similar observations have been reported in studies on plasma-based degradation processes, in which the formation of intermediate compounds can hinder complete mineralization [
42].
These observations suggest that while UV–Vis confirms the loss of visible chromophores, it may overlook non-chromophoric degradation intermediates. The continued presence of the ~1626 cm
−1 SERS peak indicates the existence of MB residues or aromatic by-products not fully mineralized. Such intermediates could include partially oxidized species (e.g., azure B, demethylated MB derivatives), as previously reported in degradation studies involving hydroxyl radicals or plasma-derived RONS [
17,
18,
40]. This highlights the multistep nature of plasma-induced degradation, in which complete mineralization requires sequential bond cleavage and oxidation steps. By retaining sensitivity to molecular structure even after decolorization, SERS proves valuable not only for detecting MB but also for tracking persistent or transformation products that would otherwise remain undetected by UV–Vis.
Additional investigations involving high-performance liquid chromatography (HPLC) or mass spectrometry could further clarify the identity of these intermediates in future studies. Nonetheless, the current SERS data already provides strong evidence for incomplete mineralization under the conditions tested and emphasizes the complementary role of SERS in revealing hidden degradation dynamics.
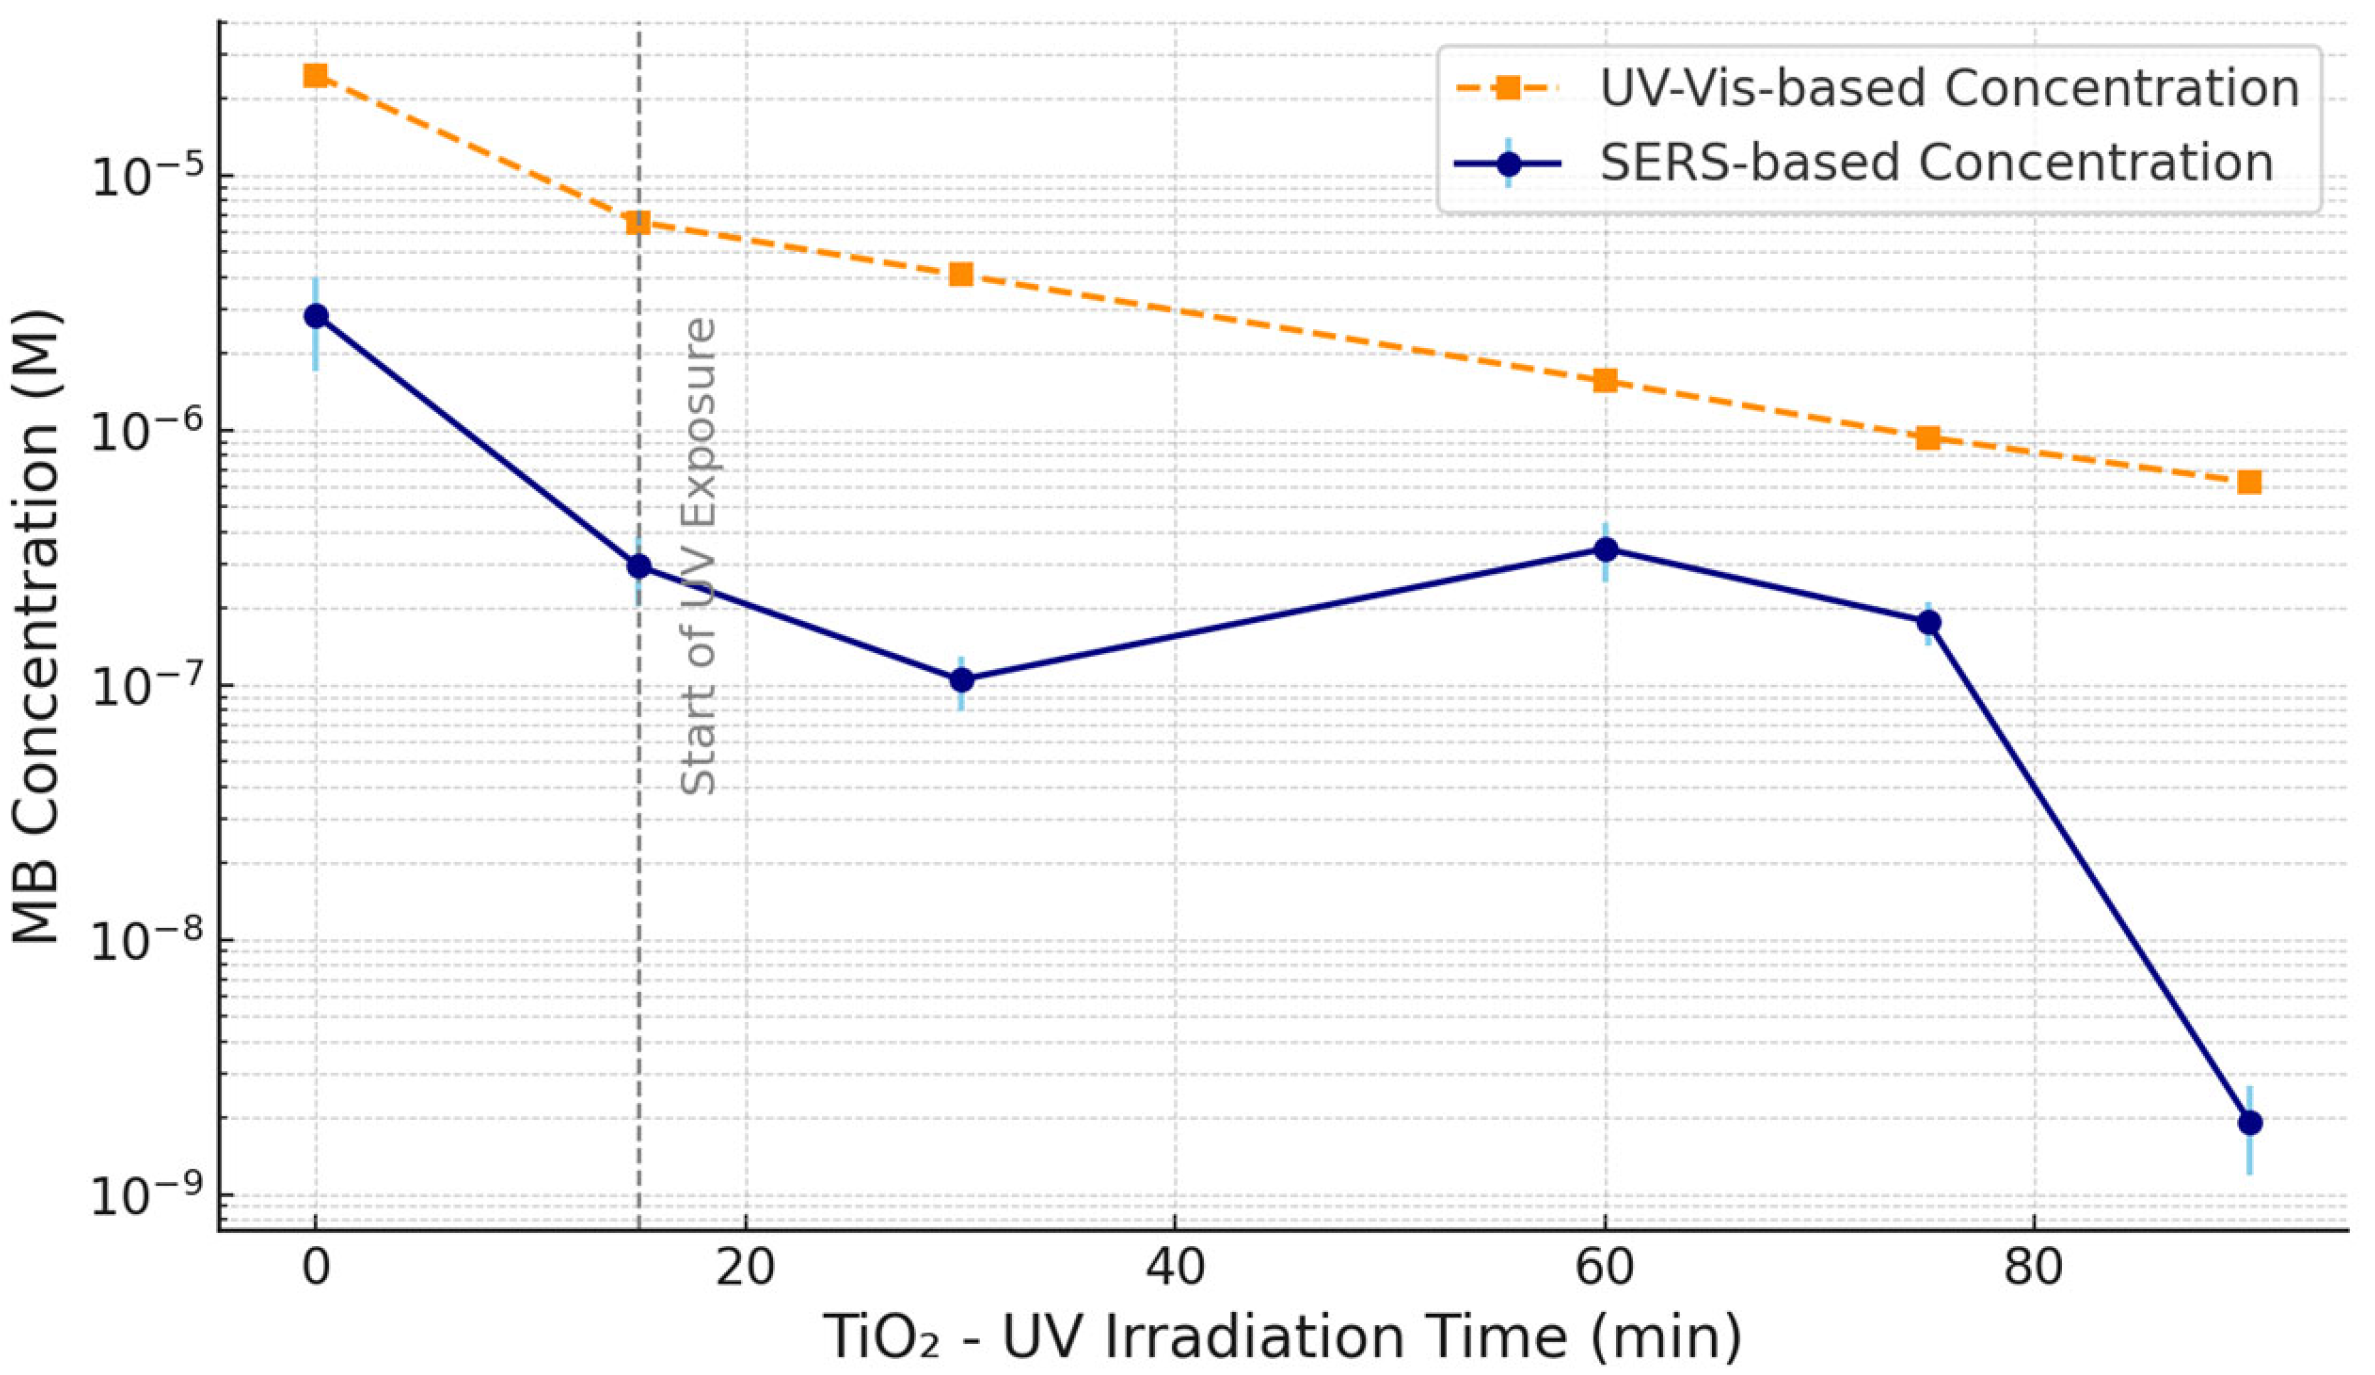
3.5. SERS and UV–Vis Analysis of MB Photodegradation Under TiO2–UV Treatment
The photodegradation of MB was further investigated using a combination of UV–Vis spectroscopy and SERS during TiO
2-assisted UV photocatalysis. Both techniques were applied to aliquots from the same set of samples collected at different time points following UV exposure. As shown in
Figure 7, MB concentrations were estimated using UV–Vis (orange) and SERS (blue), allowing a direct comparison of the spectroscopic responses under identical chemical conditions. Prior to UV exposure, all samples underwent a 15 min dark equilibration period (indicated by the dashed vertical line), ensuring adsorption–desorption equilibrium between MB molecules and the TiNT photocatalyst.
To isolate the contribution of TiNTs, a control test was conducted in which MB was exposed to UV irradiation without any photocatalyst. The results, shown in
Supplementary Figure S9, indicate only a slight decrease in MB concentration (~1 mg/L) after 2 h, confirming the limited efficiency of direct UV photolysis under these conditions. This highlights the essential role of TiNTs in promoting photodegradation by generating reactive species and improving charge carrier dynamics.
The MB concentrations obtained via SERS were derived by applying the calibration curve established in
Figure 4b to the intensity values of the 1626 cm
−1 Raman peak extracted from the time-resolved SERS spectra presented in
Figure S7a. This enabled semi-quantitative tracking of MB degradation well beyond the detection limits of UV–Vis spectroscopy.
Despite originating from the same samples, differences in concentration estimates between the two techniques were observed, particularly at later time points. While UV–Vis spectroscopy reported a continuous decline in absorbance, approaching its detection threshold (~10−7 M) by 90 min, SERS analysis revealed the persistent presence of MB—or structurally related aromatic intermediates—at submicromolar to nanomolar levels. This divergence arises from the inherent distinctions between the two techniques: UV–Vis measures the bulk absorbance of chromophoric species in solution, while SERS detects molecules adsorbed onto plasmonic hot spots, offering superior sensitivity and surface selectivity.
Interestingly, the SERS signal intensity showed a transient increase of around 60 min, suggesting either temporary accumulation of intermediates or enhanced adsorption of residual MB species onto the SERS substrate. Such behavior is consistent with multistep degradation pathways, in which partially oxidized products may momentarily dominate the population of Raman-active species [
43]. These observations correlate with the progressive discoloration seen in the corresponding visual inspection (
Figure S10), where complete decolorization was only evident after 90 min of irradiation.
In sum, the combination of SERS and UV–Vis spectroscopy provides a powerful complementary approach for evaluating the efficiency and dynamics of photocatalytic degradation. While UV–Vis captures the overall chromophore breakdown, SERS enables molecular-level monitoring of residual MB and its transformation intermediates, thus offering a more complete and more sensitive picture of the process.
4. Discussion
The present study demonstrates the successful implementation of silver nanowire (AgNW)-based substrates for ultra-sensitive detection of MB, achieving detection limits as low as 10
−16 M. This performance significantly surpasses conventional methods such as UV–Vis spectrophotometry, which exhibited a detection threshold near 10
−7 M (
Figure 1). The ability of SERS to operate in this ultra-trace regime highlights its relevance for environmental monitoring, particularly when addressing pollutants with known toxicity at low concentrations [
1,
2,
3,
4].
UV–Vis and fluorescence analyses confirmed the spectroscopic limitations encountered at dilute MB concentrations. As shown in
Figure 1b, the characteristic absorption band at 664 nm disappears below ~10
−7 M, while fluorescence intensity vanishes below 1.5 × 10
−10 M (
Figure 2b), confirming the inadequacy of these techniques for sub-nanomolar detection. By contrast, SERS measurements provided robust signal detection well beyond these limits (
Figure 4a), reinforced by a calibration curve spanning over twelve orders of magnitude (
Figure 4b). This broad dynamic range enabled not only qualitative detection but also semi-quantitative estimation of MB concentration at ultralow levels.
A key strength of the AgNW-based SERS platform lies in its ability to localize electromagnetic fields at nanowire junctions, forming plasmonic hot spots that facilitate significant Raman enhancement. Raman mapping of the 1.5 × 10
−16 M sample revealed discrete signal peaks (
Figure 5), attributed to individual or few MB molecules adsorbed at these hot spots. The detection of approximately nine such sites matched theoretical expectations based on molecular density, supporting the system’s near-single-molecule sensitivity.
Despite this exceptional performance at low concentrations, we observed greater signal variation in SERS measurements at higher MB concentrations. This variability is attributed to the widespread adsorption of MB molecules across the AgNW substrate surface, which reduces the influence of discrete plasmonic hot spots. As a result, random measurements across different regions may sample areas with slightly varying AgNW density or surface morphology, leading to signal fluctuations. In contrast, at ultra-low concentrations, analyte molecules tend to localize at hot spots, producing highly reproducible and intense signals—an effect clearly visualized in the Raman mapping shown in
Figure 5. These trends are consistent with the known behavior of surface-enhanced Raman substrates and underscore the sensitivity of the AgNW system to surface distribution and concentration-dependent adsorption effects.
The EFs derived from the 1626 cm
−1 peak further confirm the high sensitivity of the platform. A significant increase in EF was observed with decreasing concentration, attaining a value of 1.90 × 10
12 at 10
−16 M (
Table 2). These values are substantially higher than those reported in recent literature using comparable or more complex substrates [
37,
38,
39].
These SERS results contrast strongly with those obtained from UV–Vis and fluorescence spectroscopy. As shown in
Figure 1, UV–Vis detection was limited to concentrations down to 1.5 × 10
−7 M, with lower levels producing signals indistinguishable from the background. Fluorescence spectroscopy extended the detection limit to 1.5 × 10
−10 M (
Figure 2), which, while more sensitive than UV–Vis, remains six orders of magnitude above the detection threshold achieved by SERS.
Compared to other SERS-active nanostructures, AgNWs demonstrate distinct advantages in hot spot formation, substrate reproducibility, and enhancement factors. Silver nanospheres, nanodecahedra, and cap-shaped nanoparticles typically yield EFs in the range of 10
6 to 10
8 [
37,
38]. While some recent hybrid nanostructures have achieved higher EFs—such as 5.81 × 10
8 using Ag nanoparticle-decorated layered double hydroxides [
39]—they often involve complex synthesis and limited scalability. In contrast, the AgNW-based SERS substrates in this study attained EFs up to 1.90 × 10
12 via a straightforward drop-casting procedure. The elongated morphology of nanowires promotes anisotropic field localization and the formation of dense plasmonic junctions, which are critical for achieving near-single-molecule sensitivity. Prior work by Goh et al. [
9] and Pang et al. [
10] has demonstrated that junction density and nanowire alignment significantly boost SERS activity in AgNW films, which aligns with our findings and reinforces the suitability of AgNWs for scalable, high-performance sensing applications.
The drying of MB solutions prior to measurement was also found to improve SERS signal quality significantly (
Figure S6), owing to reduced fluorescence interference and enhanced analyte–substrate interaction. This finding is consistent with prior studies [
7,
11], in which drying facilitates stronger molecular adsorption onto the metallic surface, promoting more efficient excitation of the plasmonic field.
The comparative evaluation of different laser excitations (
Figure 3) indicated that 633 nm provided the optimal balance between fluorescence suppression and Raman signal enhancement. Excitation at 532 nm resulted in excessive fluorescence background, while 785 nm yielded weak Raman intensity due to reduced scattering efficiency and overlap with broad emission tails (
Figure 2).
When applied to degradation monitoring, the SERS method provided valuable insights beyond the detection capabilities of UV–Vis spectroscopy. As shown in
Figure 6, UV–Vis analysis of MB degradation under air-flow DBD plasma revealed a rapid decline in absorbance within the first 10 min, followed by complete signal loss. In contrast, SERS continued to detect the characteristic MB Raman peak at 1626 cm
−1 for the entire 40 min treatment (
Figure S7b), enabling estimation of concentrations below 10
−10 M using the previously established calibration curve (
Figure 4b). These results underscore the superior sensitivity and utility of SERS for kinetic studies and endpoint verification in AOPs.
The observed non-linear degradation trend suggests that MB breakdown during plasma treatment does not conform to simple first-order kinetics. Instead, it likely involves multistep mechanisms driven by various RONS, such as hydroxyl radicals and atomic oxygen [
17,
18]. The initial rapid decay phase was followed by a slower regime, possibly due to reduced availability of MB at the plasma–liquid interface or the formation of refractory intermediates [
39].
A similar analytical approach was employed to assess TiNT-mediated UV photodegradation of MB (
Figure 7). Although both SERS and UV–Vis analyses were performed on aliquots from the same samples, differences in sensitivity led to divergent results, particularly at longer exposure times. UV–Vis measurements reached the detection limit at 90 min, whereas SERS still detected MB or related aromatic species, confirming its applicability in monitoring residual traces (
Figure S7a). The transient increase in SERS signal around 60 min suggests possible intermediate accumulation or enhanced molecular adsorption, phenomena often observed in multistep degradation systems. These observations are further supported by the visual decolorization trends shown in
Figure S9.
Although this study focused on separate evaluations of the DBD plasma and TiNT-based photocatalytic treatments, we acknowledge that future optimization strategies should explore their integration. Plasma-enhanced photocatalysis, wherein TiO2 nanostructures are either incorporated into the plasma reactor or sequentially applied, may offer synergistic advantages such as improved charge carrier separation, expanded reactive species profiles, and enhanced degradation kinetics. Parameters such as TiO2 morphology, doping, UV intensity, and plasma discharge characteristics (e.g., frequency, power, and gas flow) could be co-optimized for catalytic enhancement. Future studies combining both modalities in a hybrid or tandem configuration will be critical to determining the most effective pathway for pollutant mineralization under real-world conditions.
Overall, this work illustrates the synergistic potential of combining AgNW-based SERS with conventional techniques to achieve comprehensive, time-resolved monitoring of pollutant degradation. SERS not only offers exceptional sensitivity and specificity but also enhances understanding of degradation mechanisms by detecting transient intermediates and residual molecules invisible to bulk measurement methods. Its integration into AOP workflows, including DBD plasma and TiO2 photocatalysis, represents a promising strategy for time-dependent evaluation and optimization of water treatment technologies.
Although the current study primarily aimed to demonstrate the sensitivity and semi-quantitative capabilities of the AgNW-SERS platform, we recognize that a more comprehensive mechanistic investigation of the degradation pathways would be further enhanced by complementary analyses. In particular, the identification of dominant reactive species (e.g., hydroxyl radicals, singlet oxygen, ozone) via quenching experiments or electron spin resonance (ESR), and the tracking of degradation intermediates using total organic carbon (TOC) measurements or liquid chromatography–mass spectrometry (LC–MS), are important next steps. These techniques could provide further confirmation of the oxidative pathways and mineralization efficiency underlying both the plasma and photocatalytic processes investigated here. Future works can incorporate these complementary methods to deepen the mechanistic understanding and validate the treatment performance from a chemical transformation perspective.
Finally, the AgNW-based SERS substrates used in this study were fabricated by drop-casting 10 μL of an aqueous AgNW dispersion onto glass slides, as detailed in
Figure S2. This simple and rapid process enables the preparation of multiple SERS-active regions on a single slide and is highly reproducible. Due to the nanoscale morphology and intrinsic fragility of the silver nanowires, these substrates were not reused. However, their low cost (estimated between USD 0.08 and 0.16 per substrate based on commercial AgNW solution pricing), ease of fabrication via drop-casting, and reproducible performance make them ideal candidates for disposable, single-use environmental sensing applications. In addition, the point-of-use capability of the AgNW–SERS platform supports decentralized water monitoring in low-resource settings, enabling rapid, on-site analysis without the need for centralized laboratories. Such portable sensing approaches are particularly relevant for advancing sustainable water management practices and align with emerging environmental policy frameworks, including ISO 14046 (water footprint standard) [
44], which emphasizes real-time discharge monitoring and the minimization of environmental impacts. While long-term durability testing was not the focus of this work, future efforts may explore strategies to enhance substrate robustness—such as encapsulation with ultrathin oxide coatings via atomic layer deposition [
45]—without compromising the plasmonic enhancement.
To further contextualize the analytical performance of our SERS platform,
Table 3 presents a comparative summary of reported nanostructured SERS substrates used for MB detection, detailing their respective detection limits and EF. The AgNW-based substrate developed in this work not only achieved the lowest detection limit reported to date (1.5 × 10
−16 M) but also maintained one of the highest EFs (1.90 × 10
12) among contemporary platforms. These results underscore the competitive advantage of our substrate, which combines high sensitivity with straightforward fabrication. For instance, even compared to advanced composite systems such as Au/Cu
2O microspheres [
46] or AgNP-decorated Co
3O
4 nanorods [
9], the AgNW-based substrate provides superior or comparable performance with reduced material and synthesis complexity. This broad benchmarking reinforces the platform’s value for real-world applications in ultra-trace pollutant sensing.
5. Conclusions
This work contributes a resource-efficient analytical–remediation toolkit that supports sustainable water management under SDG 6 by combining ultra-trace sensing with low-energy, reagent-free degradation processes. Silver nanowire (AgNW)-based surface-enhanced Raman spectroscopy (SERS) substrates were fabricated using a simple and reproducible drop-casting technique, enabling the detection of methylene blue (MB) at concentrations as low as 1.5 × 10⁻¹⁶ M—representing a sensitivity enhancement of over eight orders of magnitude compared to conventional UV–Vis spectroscopy. The high enhancement factors achieved (up to 1.90 × 10¹²), supported by Raman mapping of discrete hot spots, demonstrate the system’s near-single-molecule detection capability.
Beyond qualitative detection, the platform achieved a broad dynamic range spanning twelve orders of magnitude, enabling semi-quantitative calibration and allowing SERS to serve as a reliable analytical tool for kinetic studies and degradation pathway analysis. Importantly, the system maintained signal integrity and sensitivity at concentrations at which UV–Vis and fluorescence spectroscopy failed to provide measurable responses, highlighting its distinct advantage for trace-level monitoring.
The AgNW–SERS platform was successfully applied to evaluate MB degradation under two advanced oxidation processes—atmospheric-pressure dielectric barrier discharge (DBD) plasma and TiO2-assisted UV photocatalysis. In both systems, SERS detected persistent MB signals and aromatic intermediates long after UV–Vis analysis indicated complete degradation. These results underscore the value of SERS for tracking transformation products and assessing the true extent of pollutant mineralization, particularly in non-chromophoric or ultra-dilute regimes.
Overall, this study demonstrates the analytical power of AgNW-based SERS as a complementary technique for environmental sensing. Its integration with advanced oxidation processes provides unprecedented molecular-level insight into degradation dynamics and treatment efficacy. Future studies will focus on extending this methodology to other environmentally relevant contaminants, incorporating multivariate spectral analyses, and combining SERS with complementary techniques (e.g., LC–MS, ESR) to further elucidate degradation mechanisms and guide the development of optimized water purification strategies. Future integration of renewable-powered plasma reactors and solar-driven photocatalysis will further reduce energy intensity, aligning the technology with carbon-neutral treatment goals.


 ,
, 


