Article

Understanding User Perceptions of Food-Related Applications: Insights from Topic Modeling on Food Waste Reduction and Sustainability

by
Marcin Wyskwarski
1,
Anna Musioł-Urbańczyk
2,
Barbara Sorychta-Wojsczyk
2 and
Dariusz Zdonek
1,*
1
Department of Economy and Informatics, Faculty of Organization and Management, Silesian University of Technology, 2A Akademicka, 44-100 Gliwice, Poland
2
Department of Management, Faculty of Organization and Management, Silesian University of Technology, 2A Akademicka, 44-100 Gliwice, Poland
*
Author to whom correspondence should be addressed.
Sustainability 2025, 17(10), 4443; https://doi.org/10.3390/su17104443
Submission received: 2 April 2025 / Revised: 7 May 2025 / Accepted: 8 May 2025 / Published: 13 May 2025
(This article belongs to the Special Issue Open Innovation in Green Products and Performance Research)

Abstract

:
The article analyzes food rescue application reviews from around the world. The analysis was conducted using text mining methods, including LDA, which we used to extract the main topics in user-generated discussions of the applications. It identified eight main themes in user feedback on food rescue applications: (1) Application setup, features and general user experience, (2) User satisfaction and feedback, (3) Product management and organization, (4) Convenience, ease of use and time management, (5) Recipe discovery, product utilization and meal ideas, (6) Application updates and technical support, (7) Sustainability and environmental impact, and (8) Social interaction and sharing. All of them are indirectly related to factors derived from the unified theory of acceptance and use of technology (UTAUT). Our study aligns with a research trend concerning how digital technologies can support sustainable food consumption.

1. Introduction

Food waste has become a major civilizational problem today. It affects both developed and developing societies, their economies, the environment, and human well-being [1,2,3]. The Food and Agriculture Organization of the United Nations (FAO) estimates that more than one third of all food produced worldwide is wasted [4]. This multidimensional problem materializes in excessive consumer purchases, the incorrect storage of products, lack of knowledge of expiration date labels, preparing oversized portions and throwing away uneaten food, and problems in the supply chain that lead to significant waste. Food waste is particularly relevant in the context of a growing human population, climate change, and a growing awareness of the need for sustainability [5]. In response to this problem, several initiatives have emerged to reduce waste, increase consumer awareness, and foster the right social attitudes against throwing away edible food. In the era of modern technology and the information society, mobile applications and online platforms that can be used with a smartphone or tablet are an important part of the solution [6,7]. Mobile applications provide vital support for the concept of food rescue as they help users plan meals, process food, and share food.
Authors of publications on food rescue applications have raised questions about the development of digital platforms, their impact on preventing food waste [6,8] and simultaneously alleviating food insecurity [9]. Information and communications technology (ICT) promotes a digital sharing economy in which individuals can buy or share their unused assets with others [10,11,12], which brings environmental benefits through the more efficient use of the available inventory [7,13,14,15].
The literature on digital platforms countering food waste is relatively new [9,16]. Despite several attempts to study the behavioral intentions of users of digital food sharing platforms and their reactions [17,18,19,20], the knowledge about user behavior is still incomplete.
Pisoni and colleagues [8] attempted to compare the behavior of users from Germany and Italy in the context of a digital platform for food sharing. Their study aimed to investigate the prevalence of food sharing platforms in the two European countries to provide insights into how users navigate the platforms to obtain the expected benefits [8].
However, comprehensive research is missing in the literature that would investigate application user reviews to understand user behavior related to technology acceptance and use. Analysis of the opinions of users of such applications can become a valuable source of knowledge about their actual functionality, usability, and barriers to their use. The research to date focuses mainly on the technological aspects of the applications’ performance or their potential impact on reducing food waste [6,7,8,9]. However, it does not adequately address the actual user experience.
Therefore, the research gap calls for a broad analysis of the opinions of mobile application users in terms of the applications’ performance ease of use, barriers to daily use, and real impact on reducing food waste. This study will address the gap using the UTAUT model to deepen our understanding of the factors influencing the acceptance and use of this type of technology. Therefore, it will make a significant contribution to the growing literature on digital platforms aimed at reducing food waste. Qualitative and quantitative analysis of the data will identify the key barriers, motivations, and experiences related to application use. Unlike previous survey-based research, this approach allows for a deeper understanding of the actual user behavior, which is an important addition to the existing body of knowledge. It can provide valuable information for application developers, empowering them to improve their products and tailor them to the actual user needs.
Addressing this research gap could also contribute to a better understanding of what motivational and educational mechanisms are the most effective in changing consumer attitudes toward not wasting food. This objective was pursued with the following research questions:
RQ1: What themes can be extracted from the reviews of users of applications that support food rescue?
RQ2: Do the extracted themes fit the UTAUT construct?
Thus, the primary goal of this study was to analyze user reviews of mobile applications related to food sharing, shopping planning, and cooking to identify the key topics discussed by the users. We analyzed 189,541 reviews of these applications. Using Latent Dirichlet Allocation (LDA) for topic modeling, the study aimed to explore the main themes emerging from user feedback, focusing on perceptions related to food waste reduction. Then, by linking the topics to UTAUT, we aimed to apply the theory to a new domain, i.e., sustainable food consumption supported by mobile applications.
The Section 1 of the article provides the literature background of our study. Section 2 describes the methodological aspects of the study, and Section 3 presents the results of the study. A discussion of the results is included in Section 4, and the work is summarized in Section 5.

2. Literature Review

2.1. Digital Solutions to Reduce Food Waste

Food waste is an economic and social problem of great significance and scale. For many years, in an era of increasing globalization and informatization, initiatives have been taken to reduce food loss and waste at various stages of the supply chain.
The literature offers diverse definitions of the terms “food waste” and “food loss” [21,22,23,24]. Food losses occur mainly in the production, post-harvest, and processing phases of the food supply chain. In contrast, food waste occurs mainly at later stages of the chain and is related to the habits and behaviors of consumers and retailers [23].
In developing countries, food waste is generated mainly in the early stages of the food supply chain. This is due to technical and financial constraints. In developed countries, on the other hand, food waste is largely generated at later stages and is mainly due to consumer behavior [25]. For example, in the United States, the annual per capita production of food waste was about 120 kg [26,27], in Europe, the average is 179 kg of wasted food, while in African countries, it is only 10 kg per person [28]. Recognizing the enormity of food waste in Europe, the European Parliament stresses the urgent need to reduce food waste and improve resource efficiency in the EU at all stages of the food supply chain [29,30].
Reducing food waste, especially at the consumer level, is considered one of the most important measures to improve the quality of the environment as well as food security [12]. The problem has grown noticeably more pertinent in recent years, as have targeted measures to reduce it. As Romani et al. noted, consumers are becoming more aware of the problems associated with food waste, and they also see their part in preventing it [31]. Nevertheless, changing consumer attitudes and behavior is still a major challenge. It is, therefore, necessary to raise consumer awareness of the social and environmental consequences of food waste [2]. Studies so far indicate that the most common reasons for consumers throwing away food are missed expiration dates, the improper storage of food, and excessive shopping [32].
The answer to the problem of food waste is the Zero Waste concept and the idea of food sharing that follows from it. Zero Waste means the conservation of all resources through the responsible production, consumption, reuse, and recovery of all products, packaging, and materials without burning them or discharging them into the ground, water, or air that could endanger the environment or human health [1]. The food-sharing concept was launched in 2012 in Germany and has steadily spread to other countries, reaching Poland in 2016 [1]. Food sharing is aimed at preventing food waste by sharing surplus food with others. The initiative is part of the idea of the sharing economy and involves giving food products that might otherwise be thrown away to others who can use them. In practice, food sharing is implemented in various ways:
(1)
Online platforms and mobile applications that allow users to offer or receive surplus food.
(2)
Community refrigerators and food exchange points where food items can be left or taken. They make it easy to share food in local communities.
(3)
Community initiatives and events such as meetings, workshops, or shared meals involving rescued food promote the idea of reducing food waste and foster community integration.
The cooccurrence of both unmet food demand and food waste in the same geographic areas points to the possibility of transferring unwanted but edible food to those interested in consuming it. This approach offers potential environmental and social benefits and can help reduce food insecurity [9]. In this vein, digitally supported food-sharing platforms have emerged as a response to food waste. Not only do such platforms provide opportunities for individuals to exchange food, but they also facilitate the transfer of unsold food from businesses (such as restaurants, supermarkets, bars, etc.) to consumers to reduce food waste [33]. Such transfers can be monetary or non-monetary. Any monetary transfers are based on discount prices.
Platforms supporting food sharing and reducing food waste can be classified into the following groups [6,8,9]:
(1)
“Sharing for money”, referring to a business-to-consumer profit-driven business model aimed at reducing food waste and generating revenue at the same time;
(2)
“Sharing for charity”, a model in which food is collected and distributed to non-profit organizations;
(3)
“Sharing for the community”, referring to peer-to-peer business models in which consumers share food among themselves.
Reducing the problem of food waste must include large-scale educational efforts to spread awareness among consumers on how to prevent food waste and implement basic principles, such as (1) planning purchases in advance, (2) processing food to extend its shelf life, (3) storing products in appropriate conditions, (4) sharing unnecessary food with those in need [34].
Habits related to planning, shopping, and reusing leftovers are major factors in food waste. Planning meals and drafting a shopping list helps avoid over-purchasing due to marketing promotions, among other things. In addition, the development of cooking skills helps employ food preparation techniques that extend the product shelf life [35]. Another important aspect of the problem is proper storage practices. Improper food management in households affects the frequency of food waste. Cooking excessive amounts necessitates the storage of uneaten portions and often leads to discarding if improperly stored and/or not used in new meals [36,37].
There are three main stages when consumer behavior contributes to food waste: (1) the shopping stage (excessive purchases), (2) the product storage stage (unused and expired food), and (3) the food disposal stage.
For the purposes of this research, the applications were divided into three groups. The first one is applications focusing on shopping planning, which is referred to as “shopping”. Making a shopping list is a key element of effective household budget management and food waste reduction. Applications today make it possible to plan and organize shopping, easily create and share shopping lists, add groceries, and plan meals. Examples of such applications include Shopping List, Bring, and NoWaste. A comparative analysis of these applications is presented in Table 1.
All in all, the Shopping List application is ideal for those who want to create shopping lists quickly and easily without unnecessary features. Bring is for those who like to share lists with other users and use a nice-looking, intuitive interface. NoWaste, on the other hand, is best for those who want to control stocks, plan meals, and reduce food waste.
The second category consists of applications that support users in managing the food they already have in their homes, referred to as “cooking”, such as Cookpad Recipes and SuperCook. A comparative analysis is presented in Table 2.
In summary, the Cookpad Recipes application is ideal for cooking enthusiasts who want to share recipes, comment, and draw inspiration from other users. SuperCook, on the other hand, will work well for people who want to save and not waste food by cooking with ingredients available at home.
The third category is applications focused on food rescue, which is referred to as “sharing”. Examples of applications that fall into this category include: Too Good To Go, Olio, Karma, ResQ Club, and Foodsi. A comparative analysis of these applications is presented in Table 3.
In summary, the Too Good To Go or Foodsi applications are suitable for people who care about saving money and like surprises. The Karma or ResQ Club applications are ideal for people who like to control what they buy. Olio, on the other hand, is the best for people who want to share or receive free food.
The applications facilitate the real-time exchange of goods [58] in a cost-effective and efficient manner, making them ideal for food sharing and redistribution [7]. Digital technologies have reduced transaction costs, removed accessibility barriers, and lowered the risk of sharing with strangers by incorporating crowdsourced reputation data [11,59,60]. Furthermore, as the authors point out, sharing reduces environmental burdens [14,61]. However, some take a different view and indicate that sharing induces additional demand that ultimately increases rather than decreases the overall environmental burden [62]. According to a study by Meshulam et al., 68% of the predicted global warming benefits of food sharing are offset as users re-spend the money they have saved by collecting free food [26]. On the other hand, re-spending the money can bring important economic and social benefits, i.e., better meeting the basic needs of their households, increasing access to healthy and nutritious food, and helping to address food insecurity [13]. This is in line with research by Pisoni et al., which shows that users are more likely to use sharing for economic rather than environmental reasons [8].
It is worth noting that certain features of digital food-sharing applications have a detrimental effect on their use. The first is residential segregation by income (residential neighborhoods are relatively homogeneous in terms of income), which makes large-scale redistribution from higher-income areas potentially costly in terms of time and money. Residential income segregation inhibits the ability of platforms to facilitate transactions between income classes. Another factor is that some platforms are not anonymous, so users who are recipients rather than givers are identified on the platform, which can cause embarrassment or even shame [63].

2.2. Factors Affecting Application Acceptance

To understand technology acceptance and use behavior, researchers use the unified theory of acceptance and use of technology (UTAUT), which provides information supporting the design and implementation of information systems in various environments. UTAUT is a complex model developed to explain user intentions and behavior related to the use of information systems. In order to provide a unified framework, the UTAUT model integrates elements from eight previous models of technology acceptance such as TRA (theory of reasoned action), TPB (theory of planned behavior), TAM (technology acceptance model), TAM-TPB, MM (motivational model), MPCU (computer use model), IDT (innovation diffusion theory), and SCT (social cognitive theory) to propose a unified theory of technology acceptance and use (UTAUT) [64,65]. UTAUT provides a more comprehensive framework than the eight previous models because it (1) combines individual and social elements, (2) allows for the inclusion of demographic and contextual differences, and (3) provides greater predictive power in technology acceptance studies. This way, UTAUT is an effective framework for comparing different user groups, analyzing technology adoption in complex environments, and bridging cognitive gaps that previous models alone do not address.
The UTAUT model identifies four key constructs that influence user behavior [64]:
(1)
Performance expectations: the degree to which a person believes that using the system will help them achieve productivity gains.
(2)
Effort expectations: the ease associated with using the system.
(3)
Social influence: the degree to which individuals perceive that important people believe they should use the new system.
(4)
Facilitating conditions: the degree to which an individual believes that there is an organizational and technical infrastructure to support the use of the system.
UTAUT also takes into account four moderating variables that affect four key constructs: (1) gender, (2) age, (3) experience, and (4) goodness-of-use [64]. The UTAUT perspective has been used in research on the acceptance of technology that promotes sustainable consumption [66,67,68].
In the context of applications supporting food waste reduction, the key elements of UTAUT can be described as the following:
(1)
Performance Expectancy (PE) is the degree to which the user believes that using a given technology will improve their efficiency in performing certain activities. In the context of food waste reduction applications, PE refers to the belief that the application will help the user effectively manage food supplies that they have purchased and are afraid will spoil and have to be thrown away. Another benefit for the application user could be information about ways to reuse food or share excess food with others. An example would be an application that automatically reminds users about product expiration dates or suggests recipes based on the available ingredients.
(2)
Effort Expectancy (EE) is the expected ease of use. The idea refers to the level of difficulty of using the technology. Applications that help reduce food waste should be intuitive and easy to use so that users are willing to use them. An example would be an application that automatically reminds users of expiration dates on products or suggests recipes based on the available ingredients.
(3)
Social Influence (SI) refers to the degree to which the user perceives that people important to them (e.g., family, friends, or community) are endorsing the use of a particular technology. In the case of food waste reduction applications, if users see that their friends use and promote such applications, they are more likely to use them, too. This way, they accept not only the technology associated with the applications but also the idea of saving food, which supports sustainable consumption.
(4)
Facilitating Conditions (FCs) refer to the resources and technical support available that enable the user to use the technology. In the context of food waste reduction, these could include the integration of applications with other systems (e.g., shopping lists and smart refrigerators), the availability of tutorials, or technical support. Social media influencers can also play a significant role by showing how to use such applications on their profiles.
In summary, the acceptance of food waste reduction applications depends on whether users find them effective, easy to use, socially promoted, and supported by adequate technical resources.

3. Research Methodology

3.1. Research Process

Based on a review of scientific literature and additional keyword-based searches using Google, we compiled a list of mobile applications related to the reduction in food waste.
The motivation for selecting this specific group of applications stems from their direct relevance to consumer-level food waste prevention. The study focused on three key behavioral areas known to contribute to food waste in households: excessive purchasing, improper storage and food management, and the underutilization of surplus food. Accordingly, the selected applications were grouped into three functional categories: (1) shopping planning, (2) the cooking and management of available food, and (3) food sharing. By covering all three domains, we aimed to capture a comprehensive overview of how mobile technologies support sustainable consumption and behavior change.
The focus was placed on applications supporting three areas closely related to food waste prevention: shopping planning, food management, cooking, and food sharing. The applications were selected according to the following inclusion criteria:
  • Availability on both Google Play Store and Apple App Store at the time of data collection;
  • Active status (still available and functional);
  • Presence of user reviews enabling content analysis;
  • Alignment with the broader goals of reducing food waste or supporting the Zero Waste and food-sharing concepts.
Only applications that met all of the criteria were included in the study. Due to the high level of specificity of the topic and the strict selection prerequisites, it was not possible to identify more than ten relevant applications. These applications were grouped into three categories: “shopping”, “cooking”, and “sharing”, as detailed in the Section 2.
Next, user reviews posted under each of the 10 selected applications were downloaded on 12 February 2025, using the “google-play-scraper” [69] and “app-store-scraper” [70] packages for Python (https://www.python.org/, 4 February 2025). In total, 190,557 reviews were collected.
After collecting the reviews, we preprocessed and cleaned the data. As a result, the final number of analyzed reviews was 189,541. A visual summary of the entire research procedure is provided in Figure 1. The preprocessing process included the following activities (Figure 1).
(1)
All emojis were removed from the feedback text to ensure textual consistency.
(2)
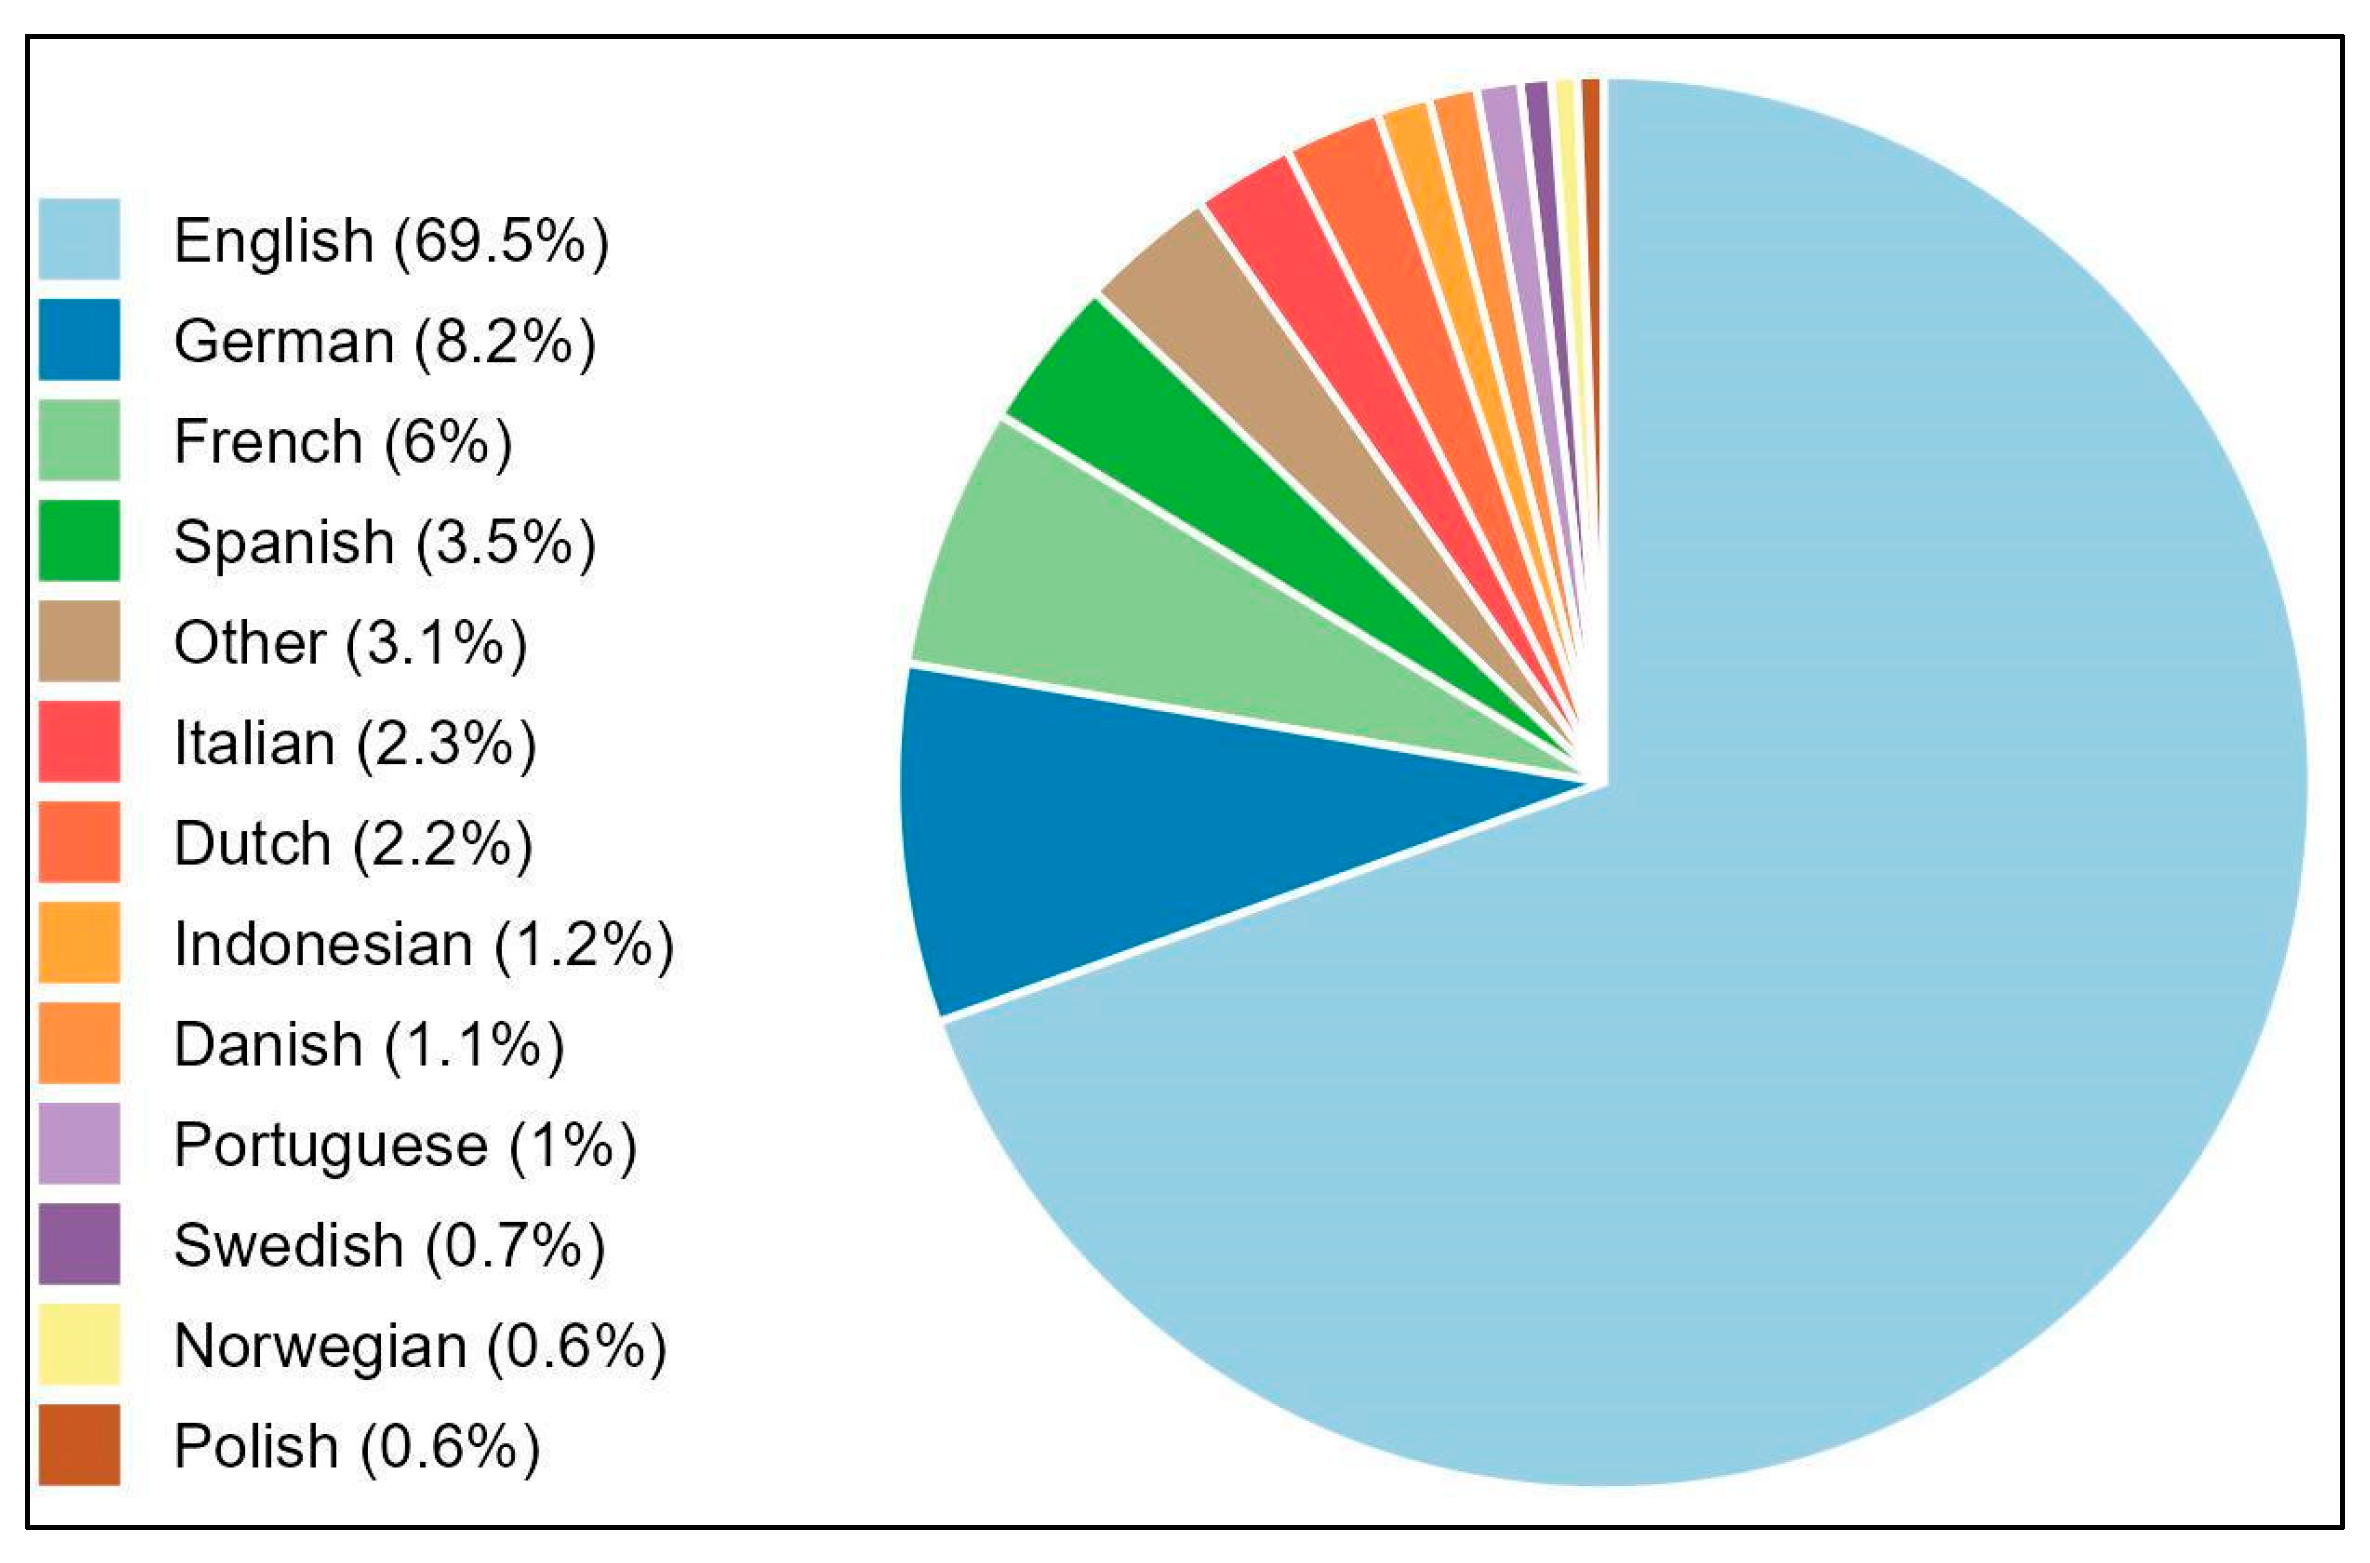
The language of each review was detected using the Langid [76] package.
(3)
Reviews that were identified as non-English by both Langdetect and Langid were translated into English using the “Helsinki-NLP/opus-mt-mul-en” model, which is publicly available on the Hugging Face platform [77].
(4)
Words were lemmatized to their base form using the Stanza [78] language model to standardize the text and improve the accuracy of the subsequent analysis.
(5)
All single-letter words were removed, as they typically do not contribute meaningful information.
(6)
Common stopwords were removed using the Snowball [79] and SMART [80] lexicons. However, words that the authors deemed contextually important for this specific analysis were retained, ensuring that relevant terms were not inadvertently excluded.
(7)
Any reviews that became empty strings as a result of the preprocessing steps were removed from the dataset.
In the next phase of the analysis, Latent Dirichlet Allocation (LDA) was applied. LDA is a widely recognized generative probabilistic model commonly used to analyze collections of discrete data, such as text corpora [81]. It was employed in this study to uncover latent thematic structures within user reviews, assuming that each document reflects a mixture of topics that are each characterized by a distribution of words. The analysis was performed using the topicmodels package for R [82], and Gibbs Sampling was used to estimate topic–word distributions [83]. For more detailed discussions on topic modeling, refer to [84,85,86].
One of the key challenges associated with using the LDA algorithm is determining the optimal number of topics (k) prior to the analysis. Several metrics are available to estimate k by evaluating a series of fitted LDA models. These methods involve repeatedly fitting the LDA model to the same dataset while testing different candidate values for k. Four metrics were used to determine the optimal number of topics (k), which were based on the following:
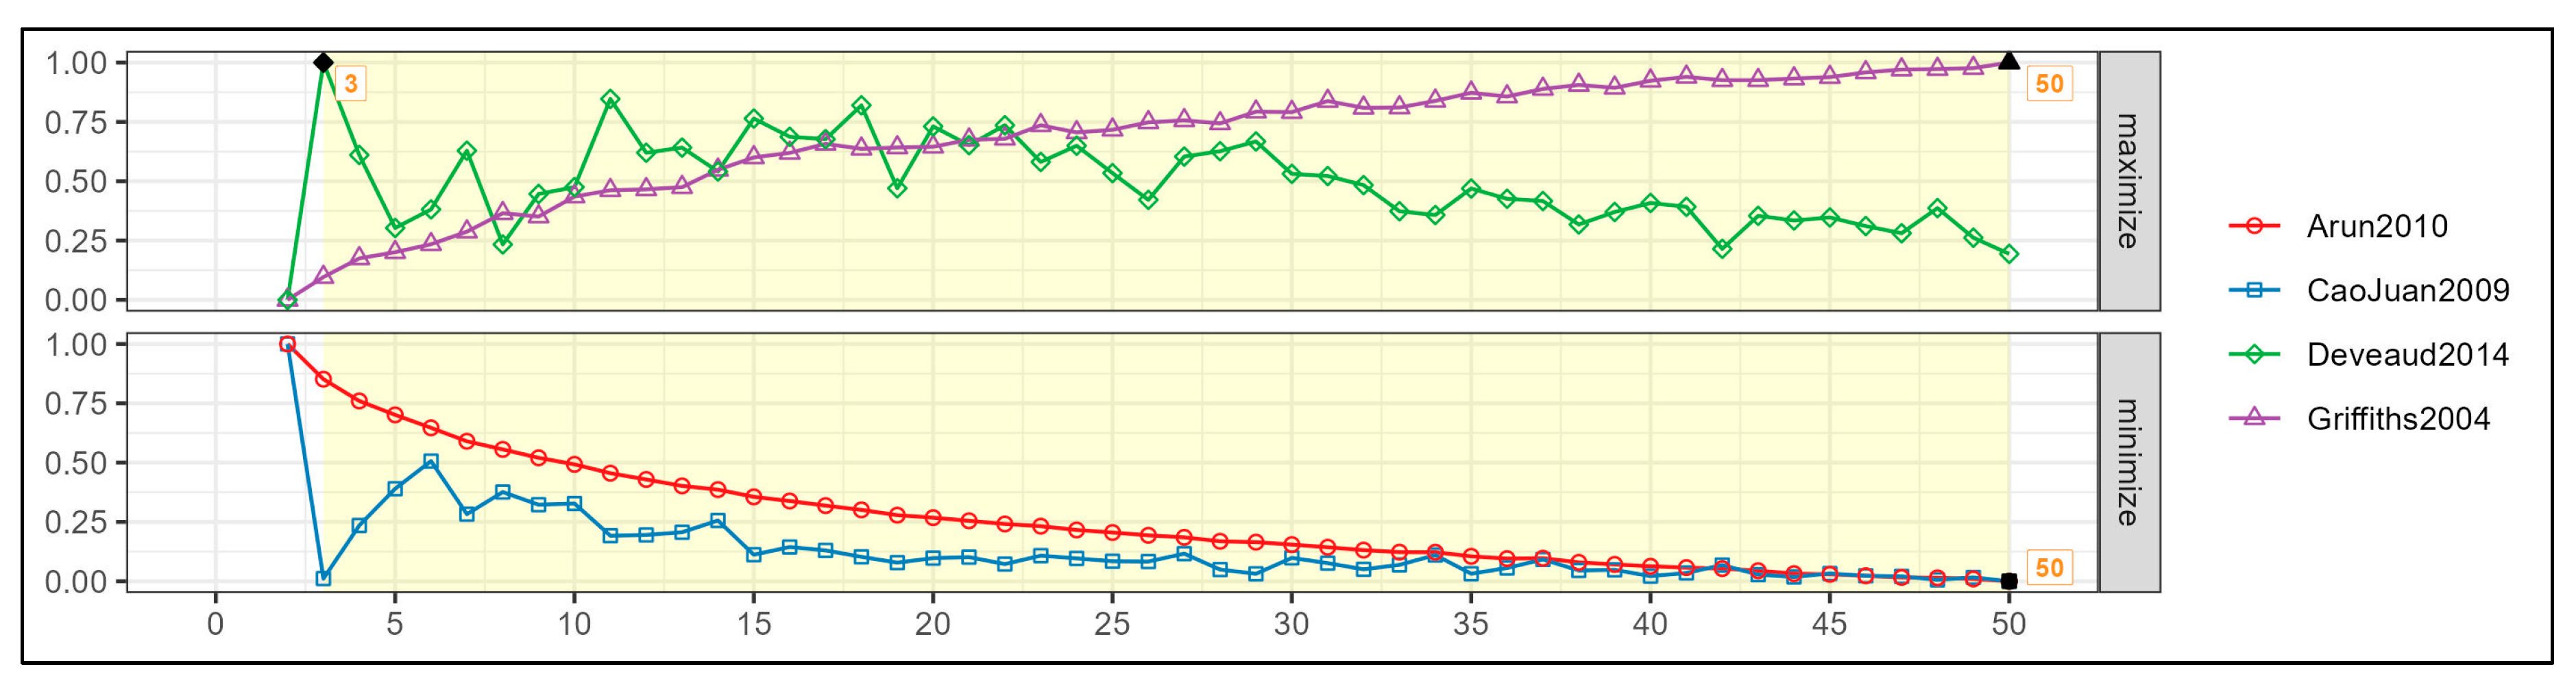
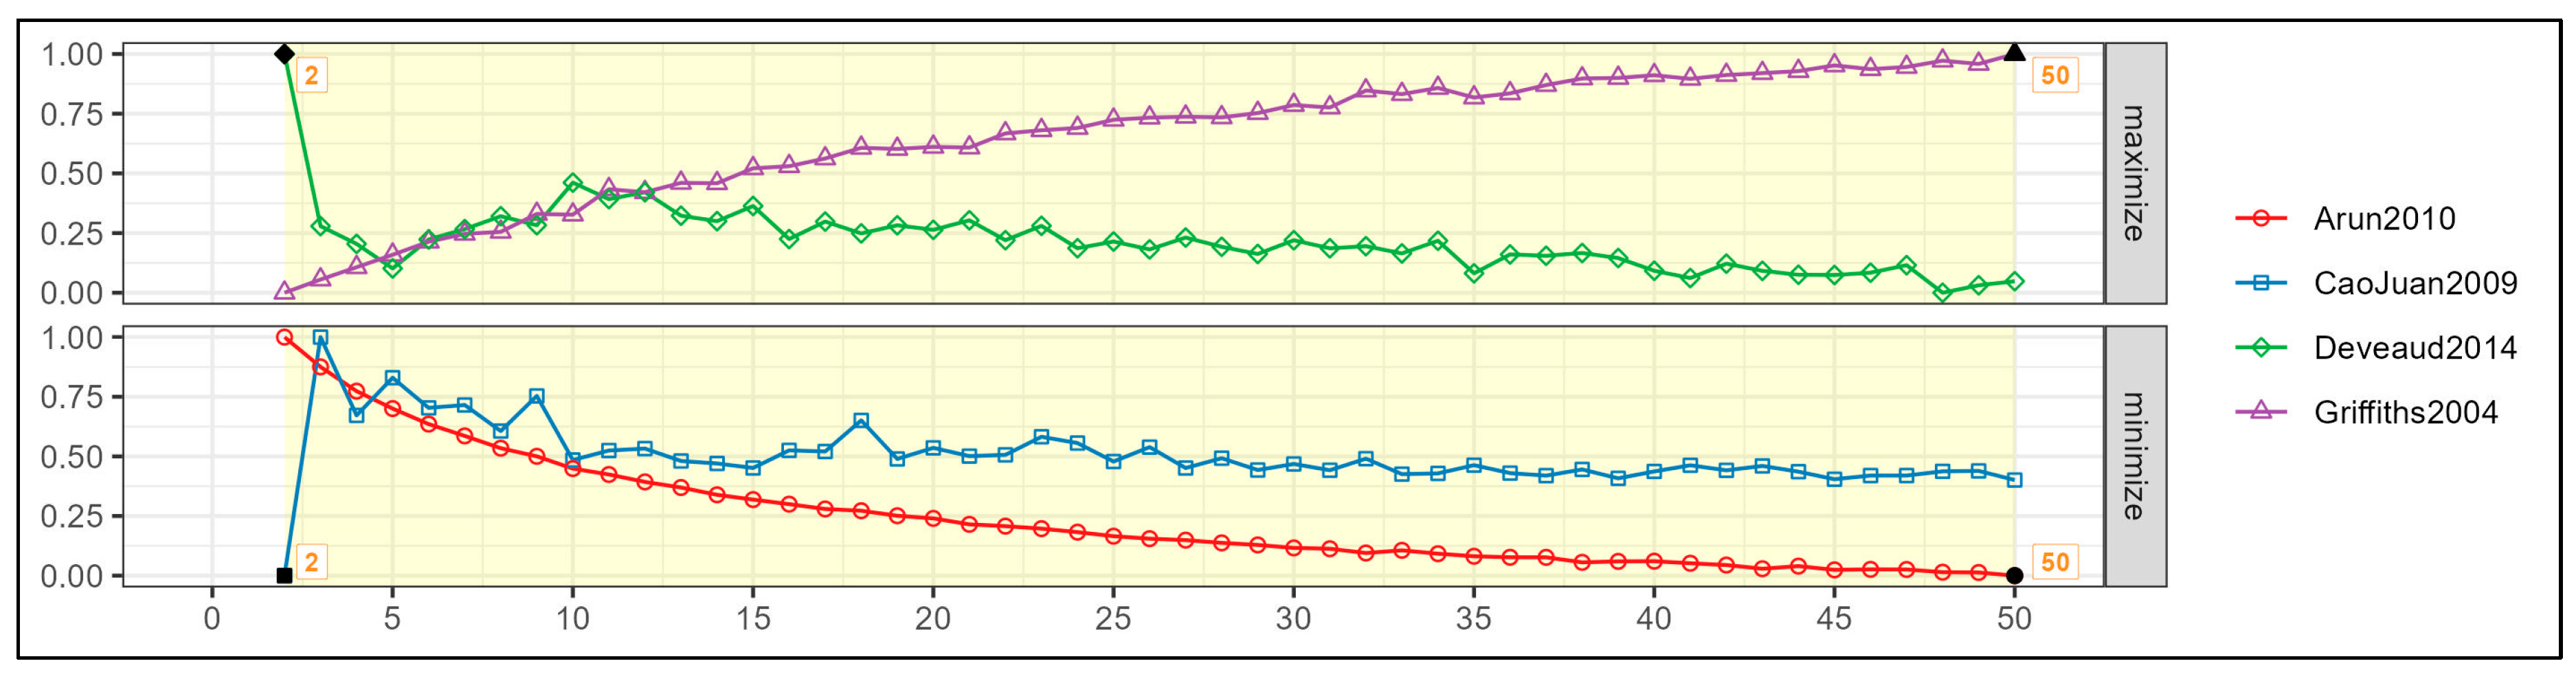
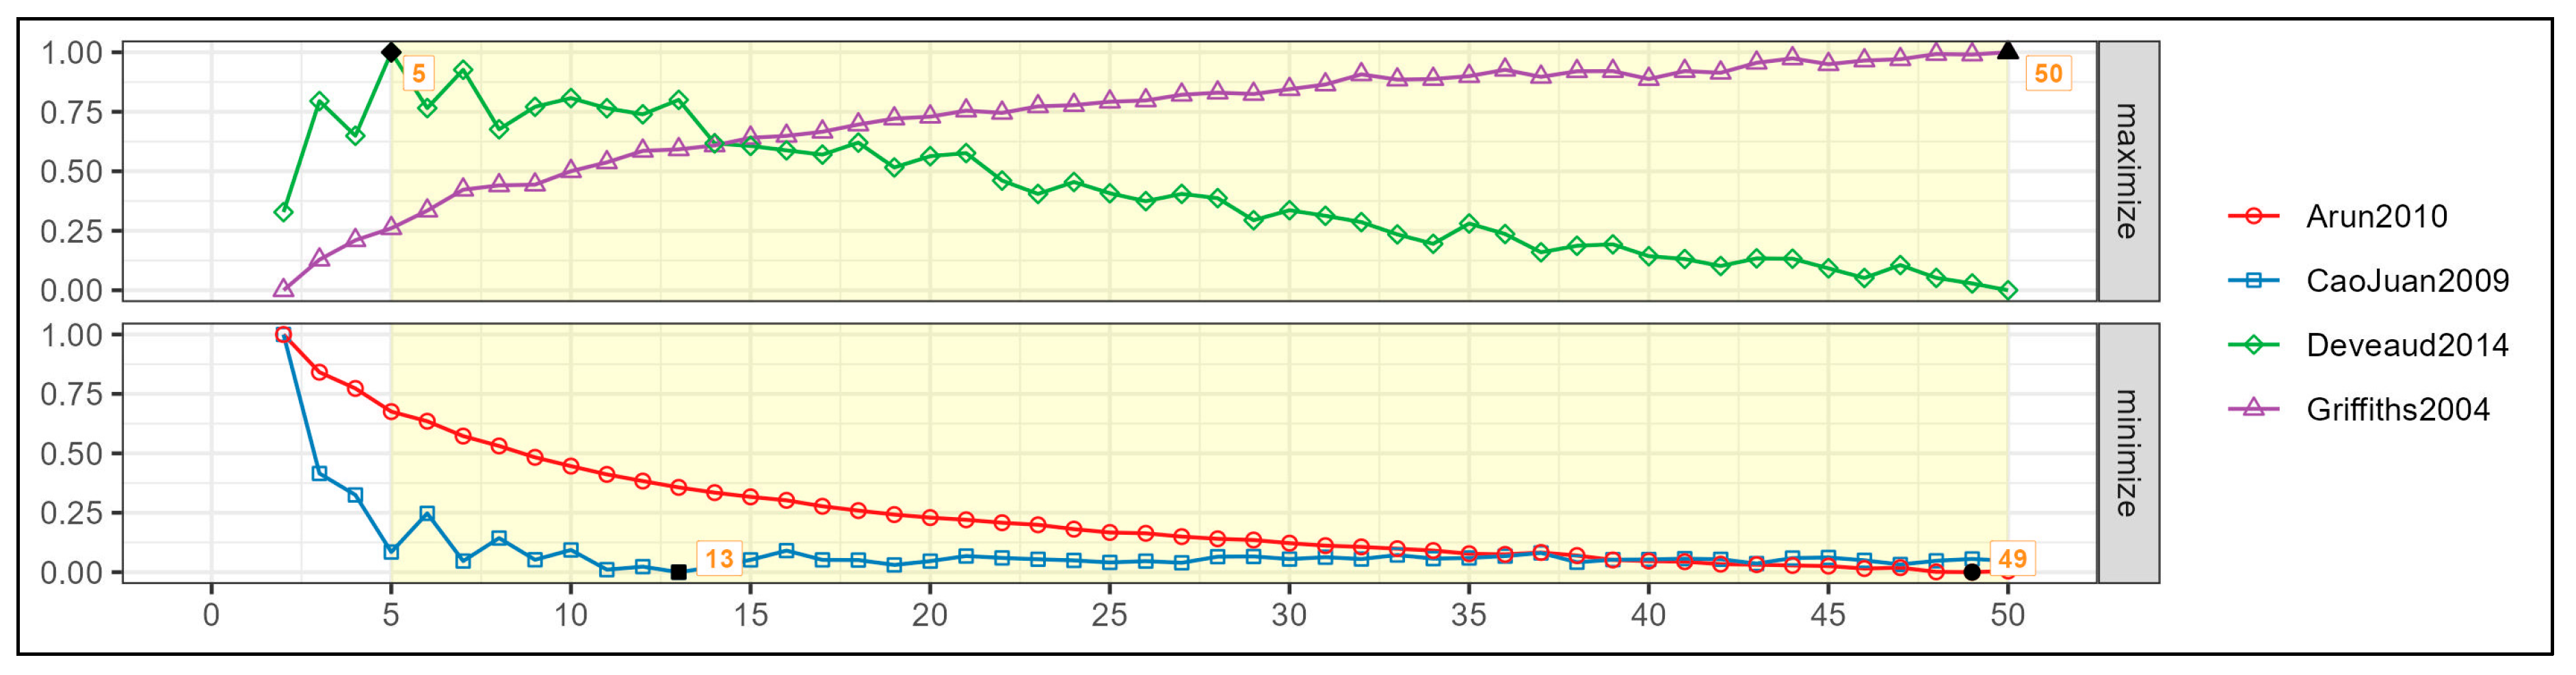
  • The divergence between the distribution of topics across documents and the distribution of words within topics. Lower values indicate a better-fitting and more optimal model [87].
  • The density of word co-occurrences within topics. Lower values signify higher-quality topics that are more distinct from one another [88].
  • The normalized pointwise mutual information (NPMI) of word pairs within topics. Higher values reflect more coherent and interpretable topics [89].
  • The likelihood of the data given the model with higher values indicating that the model provides a better explanation of the observed data [74,75].
In addition to determining the optimal number of topics, several analytical steps were conducted within the LDA framework to deepen the understanding of the identified topics and their relevance to user reviews.
Firstly, visualizations were generated to present the most probable words associated with each identified topic. These visualizations facilitated the interpretation of the thematic content of each topic. Subsequently, the authors assigned descriptive labels to each topic, reflecting the core themes emerging from the user reviews.
To ensure the reliability and consistency of the topic labeling process, two researchers independently reviewed the top keywords associated with each topic along with a small subset of representative user reviews (typically 5 to 10 per topic). These reviews were selected based on their dominant topic assignment and alignment with the most probable keywords. Each researcher proposed preliminary topic labels based on their interpretation. Differences in labeling were discussed and resolved through consensus. This approach helped validate and refine the thematic labels, minimized individual bias, and increased the transparency and reproducibility of the categorization process.
To enhance consistency across the three application groups, an attempt was made to establish unified labels, grouping similar topics under broader thematic categories. This approach aimed to identify shared patterns and thematic overlaps across the different types of applications.
Furthermore, the distribution of dominant topics across user reviews was analyzed. Each review was assigned to the topic with the highest probability (dominant topic), and the proportion of reviews associated to each topic was calculated. This allowed for a deeper understanding of which topics were most prevalent within the dataset and how user concerns and priorities varied across application groups.
These steps provided a comprehensive insight into the thematic landscape of user reviews and offered a structured approach to analyzing perceptions related to food sharing, shopping, cooking, and food waste reduction.

3.2. Research Sample

The research sample comprised 189,541 user reviews, which were collected automatically via Python-based scripts. The reviews originated from users worldwide and were posted on ten mobile applications.
As shown in Figure 2, the majority of reviews were written in English (69.5%), which was followed by German (8.2%), French (6%), and Spanish (3.5%). The pie chart includes 12 languages, each of which appeared in at least 1000 reviews. All remaining languages, each occurring fewer than 1000 times, were grouped into the Other category (3.2%).
Language detection was performed using the Langid library, which is optimized for short texts and well suited to social media content.
The temporal distribution of reviews is presented in Figure 3. A steady increase in user activity can be observed starting in 2017 with the highest number of reviews posted in 2020. Reviews were submitted throughout the year with some seasonal variation across months. The consistently high volume of reviews between 2020 and 2024 may suggest a stable level of user engagement with the selected applications during that period. It is important to note that the data for 2025 is incomplete, as the reviews were collected on 12 February 2025.
Given that all user reviews from all available and eligible applications were included in the dataset, data saturation was considered achieved. The narrow focus of the study, combined with the exhaustive approach to data collection, ensured that the dataset was both complete and sufficient for thematic analysis. No additional applications meeting the inclusion criteria were identified during the selection process, and the collected reviews provided a rich and diverse set of insights for analysis.

4. Results

Table 4 presents the distribution of user reviews across the analyzed applications, which were categorized by application type (sharing, shopping, and cooking) and by the platform (Google Play Store and Apple App Store).
Table 4 shows that the highest number of collected reviews concerned Too Good To Go, which is related to food sharing (type: sharing). The second most popular application was Shopping List, which is associated with shopping (type: shopping). The third one was Cookpad Recipes, which focuses on cooking (type: cooking). It is, therefore, evident that the three most popular applications belong to three different types of applications related to food waste prevention.
This higher level of engagement may be explained by the global popularity of Too Good To Go, its strong brand recognition, and its widespread adoption in multiple markets. Its well-established partnerships with local businesses and extensive user base likely contribute to the high volume of user feedback. In contrast, applications with fewer reviews may reflect more niche functionalities, local market limitations, or lower levels of user interaction.

4.1. Determining the Optimal Number of Topics

Figure 4, Figure 5 and Figure 6 illustrate the results of the coherence metrics for the three application groups (e.g., sharing, shopping, and cooking) used to determine the optimal number of LDA topics. Due to discrepancies between the metrics, we decided to define a range of optimal topic numbers, which were determined by the minimum and maximum values suggested by the four metrics. This approach aimed to balance the differing recommendations and avoid model overfitting or underfitting.
Subsequently, for each application group, we generated a series of LDA models with the number of topics ranging from the lower to the upper bounds of the identified range (e.g., for the sharing applications, as shown in Figure 4, from 3 to 50 topics). For each generated model, the 15 most probable words associated with each topic were extracted and analyzed.
The final selection of the optimal number of topics was made based on qualitative analysis. This interpretability assessment was conducted independently by two researchers to ensure thematic clarity and reduce potential bias. We assessed the interpretability of topics by examining whether the identified topics could be meaningfully labeled and assigned appropriate thematic categories. The selected model was the one with the highest number of topics that could still be clearly interpreted and meaningfully categorized.
This approach facilitated the development of coherent and interpretable LDA models tailored to each application group, ensuring both the reliability of topic extraction and the practicality of the results.

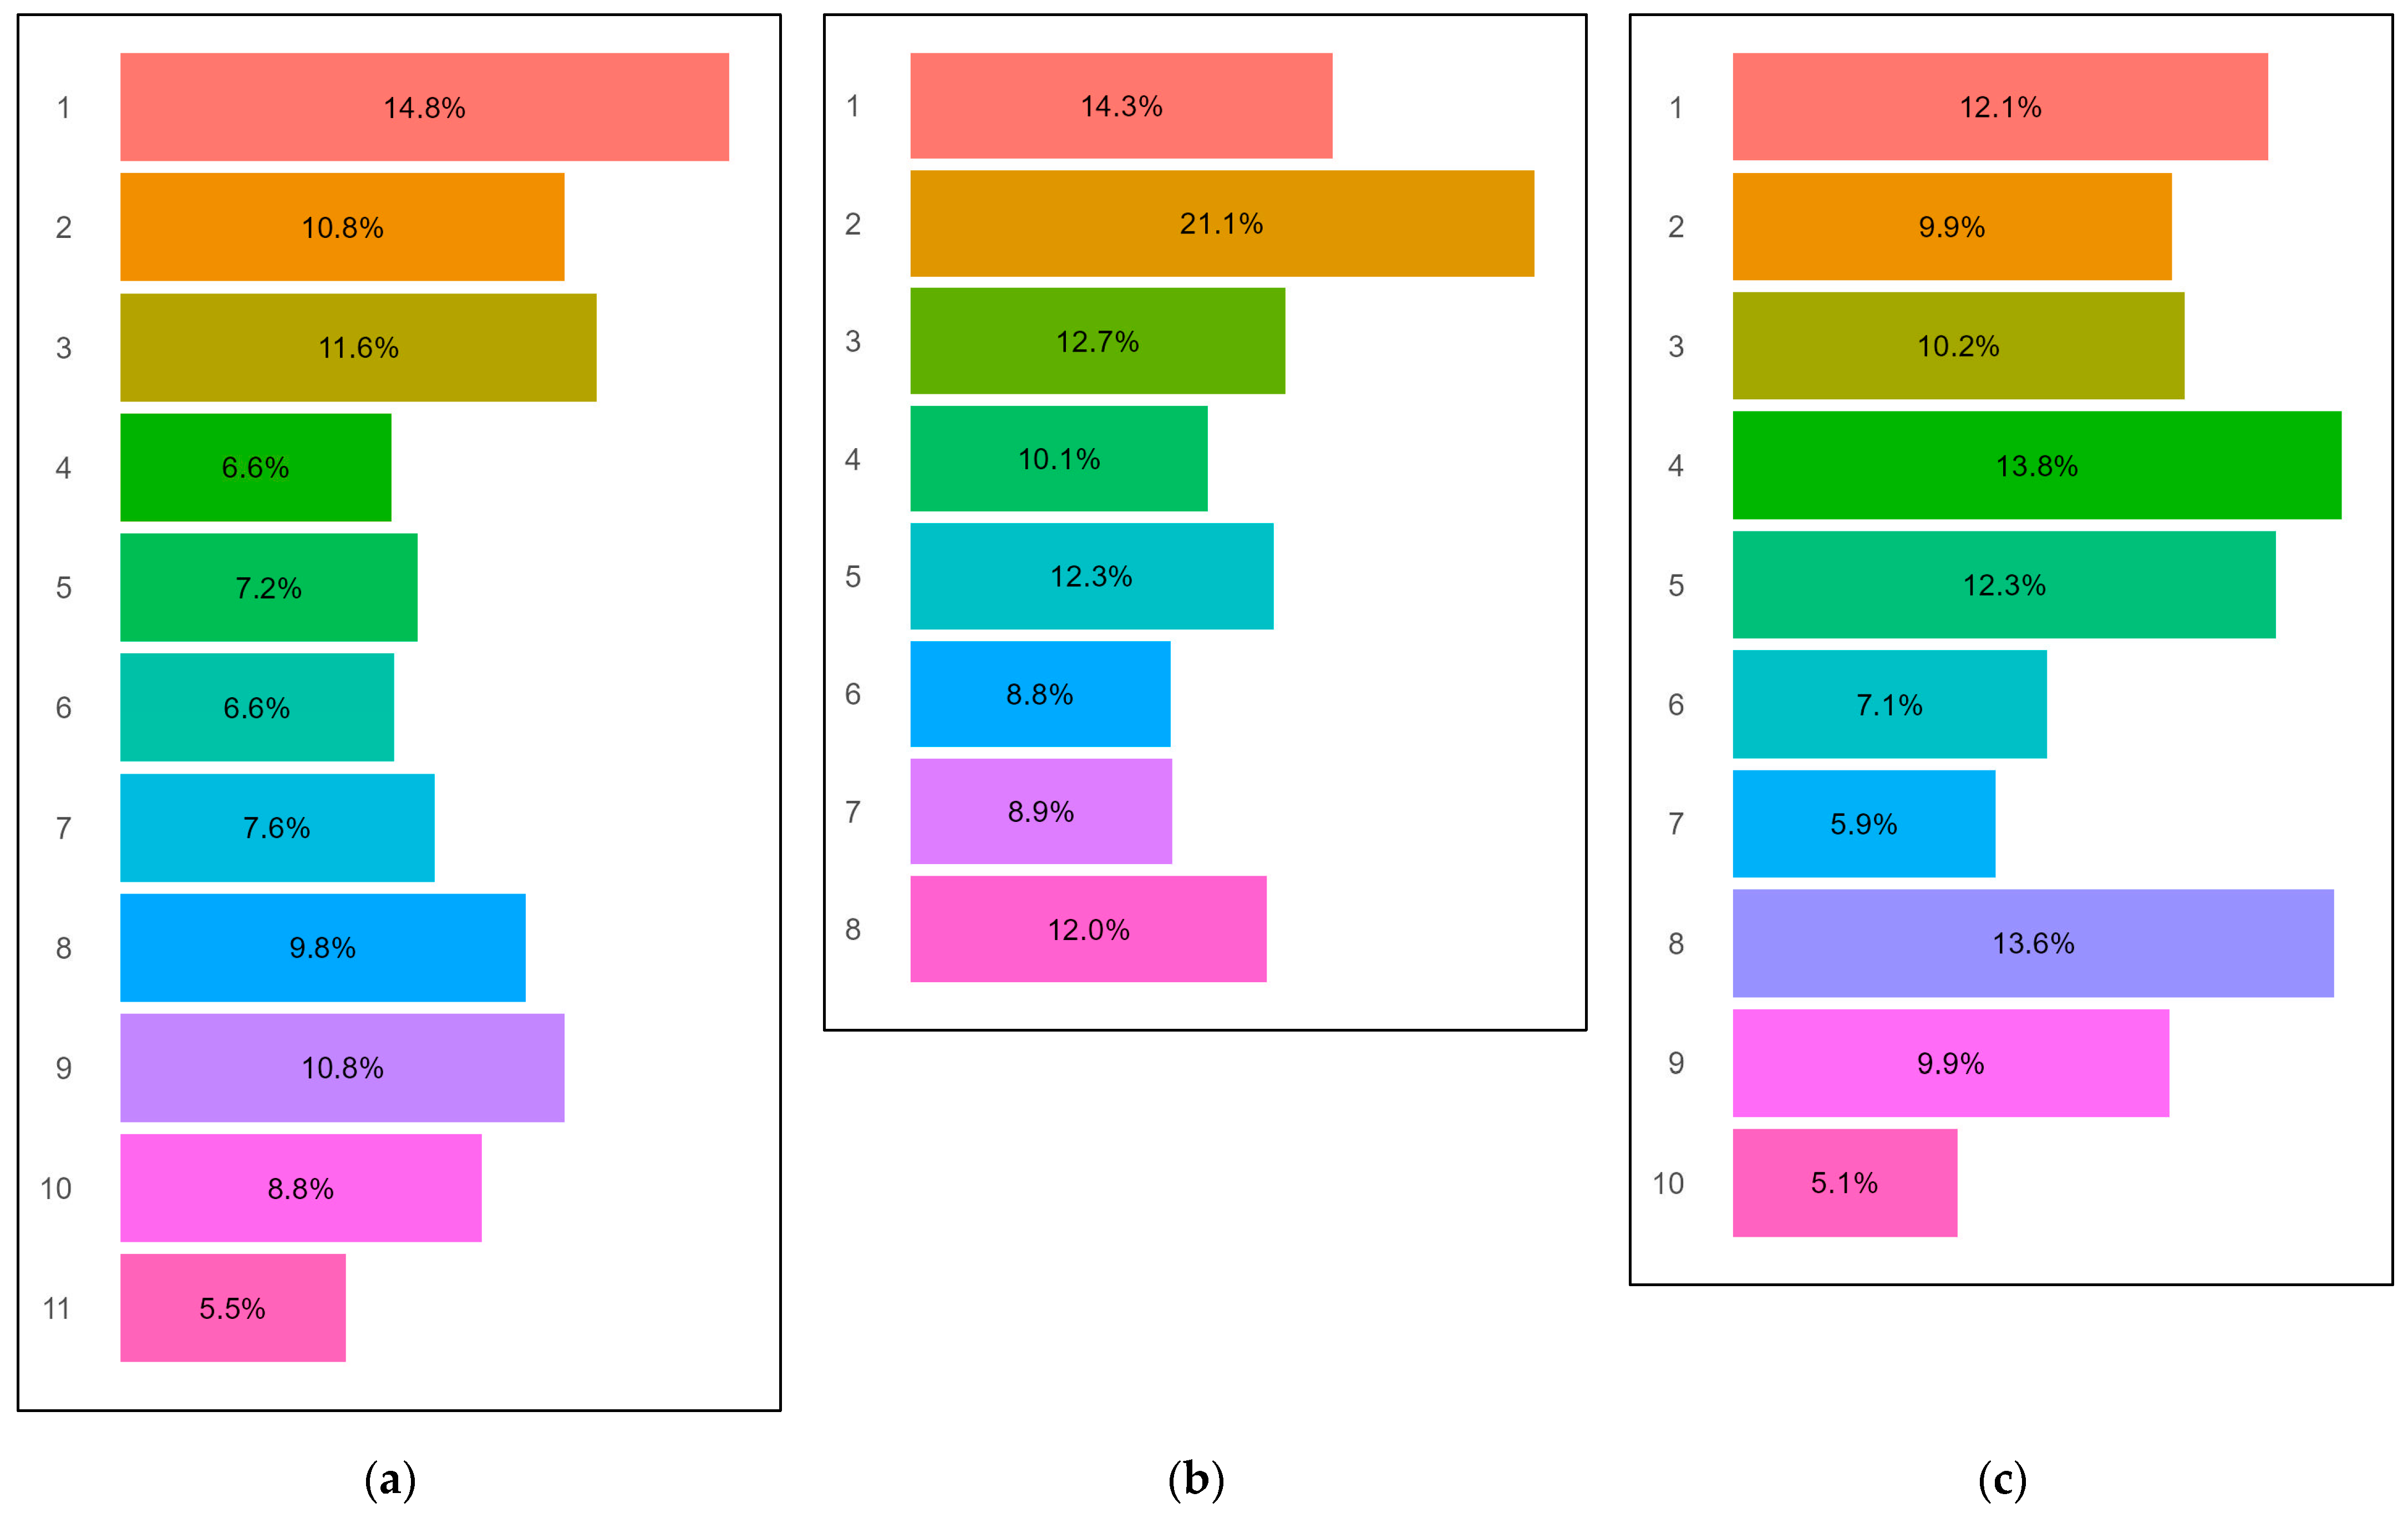
4.2. Determining the Number of LDA Topics for Each Type of Application

Subsequently, Figure 7, Figure 8 and Figure 9 and Table 5, Table 6 and Table 7 were prepared. Figure 6, Figure 7 and Figure 8 illustrate the most probable keywords associated with each topic identified in the Latent Dirichlet Allocation (LDA) models for the three distinct application groups: (a) sharing, (b) shopping, and (c) cooking. Each figure presents the distribution of the top 15 keywords that characterize the topics generated by the LDA models.
The x-axis represents the weight of each keyword within a given topic, indicating the relevance or importance of the word in defining the specific topic. The y-axis displays the keywords associated with each topic. The topics are numbered and visualized in separate panels for clarity.
For instance, Figure 7, which presents the most probable words for each topic in sharing applications, displays 11 identified topics. The most probable words for the first topic are good, application, super, product, make, well, price, thank, always, panel, top, initiative, much, package, and avoid.
The final number of topics for each group was identified as shown below:
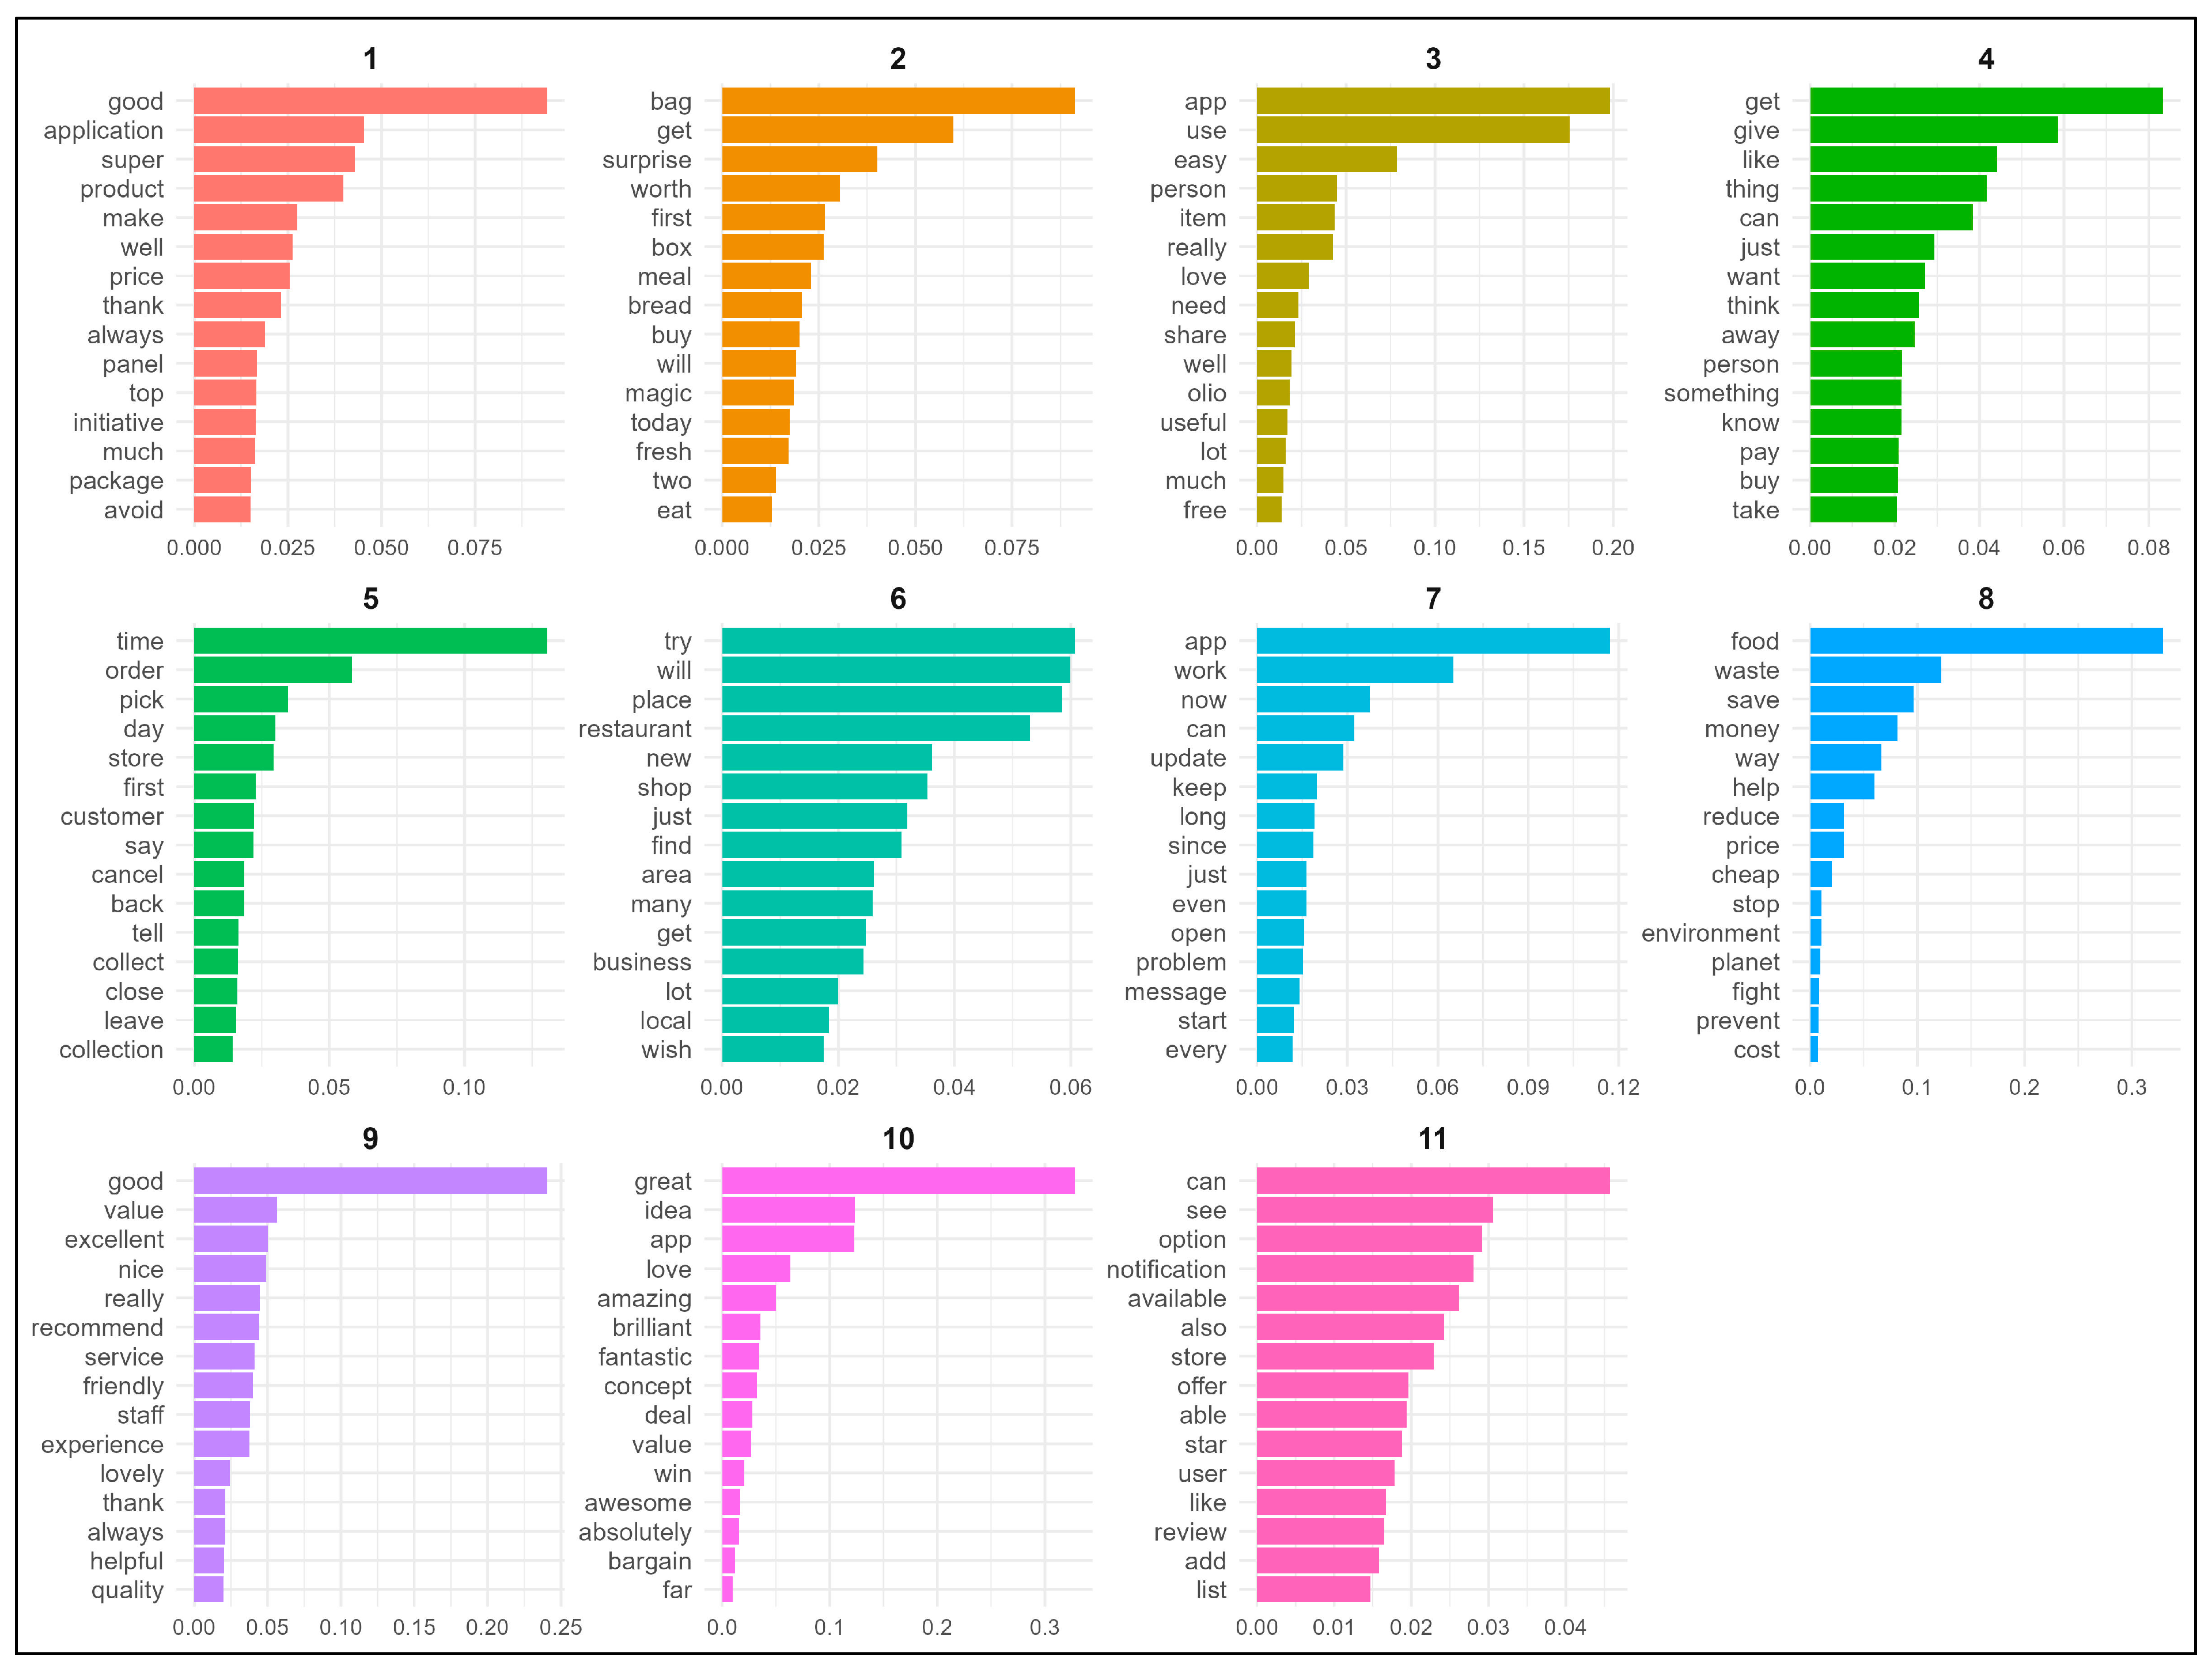
  • Sharing applications: 11 topics;
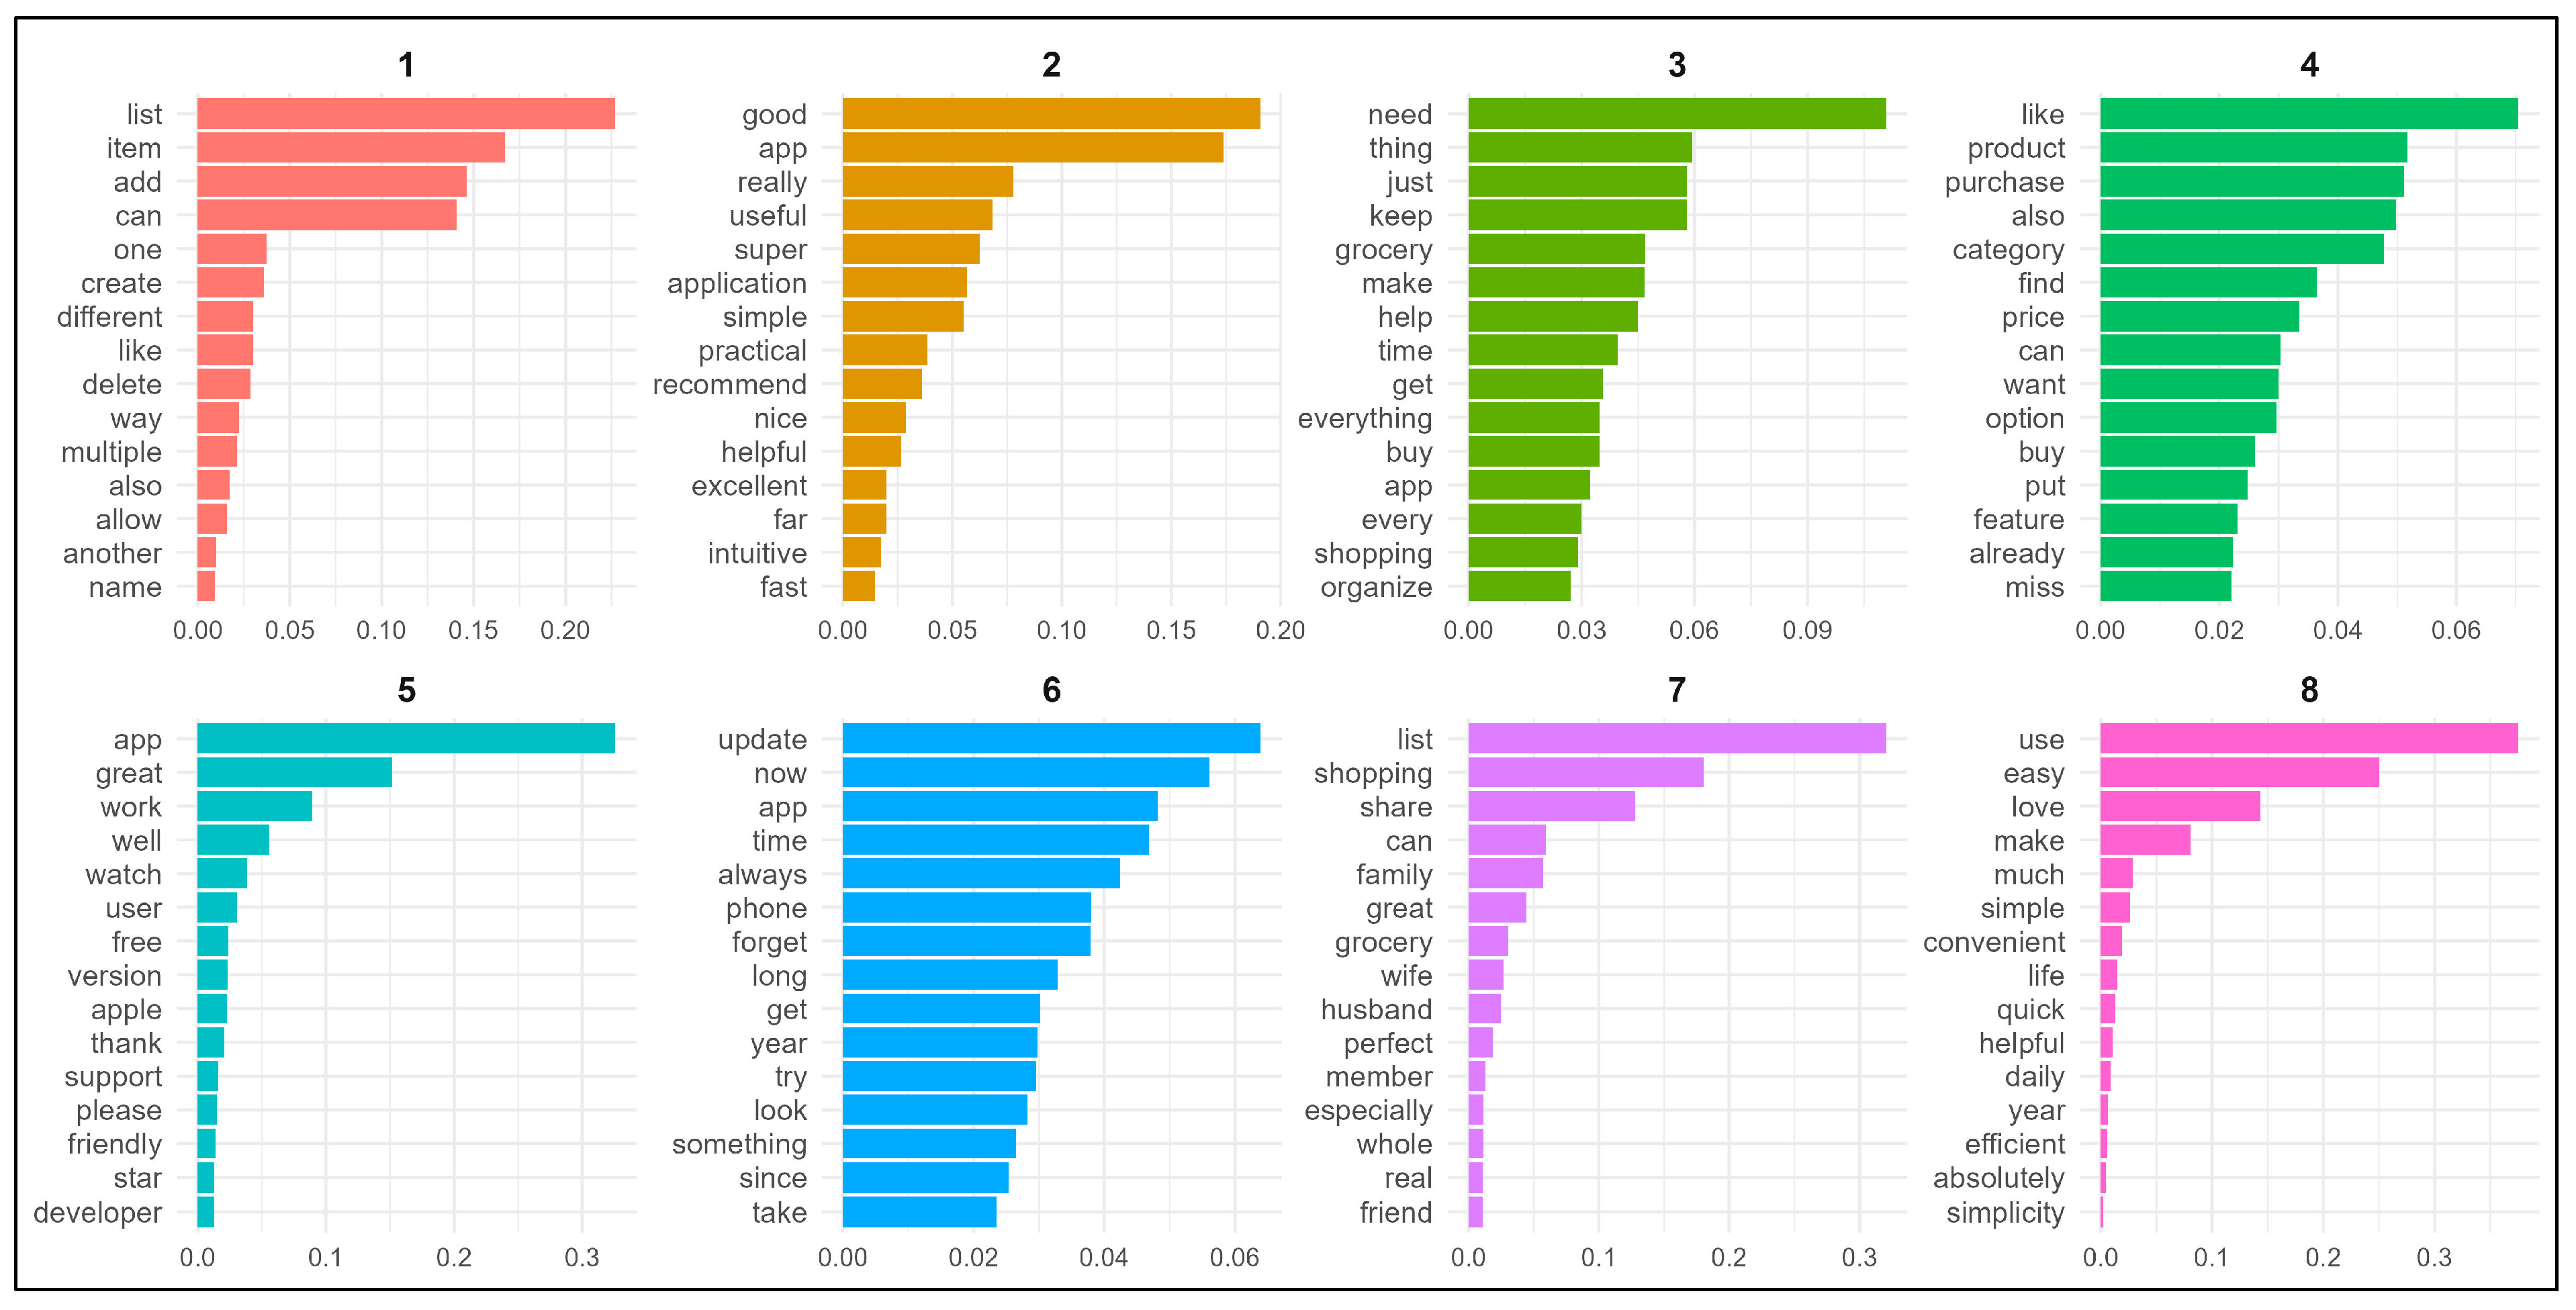
  • Shopping applications: 8 topics;
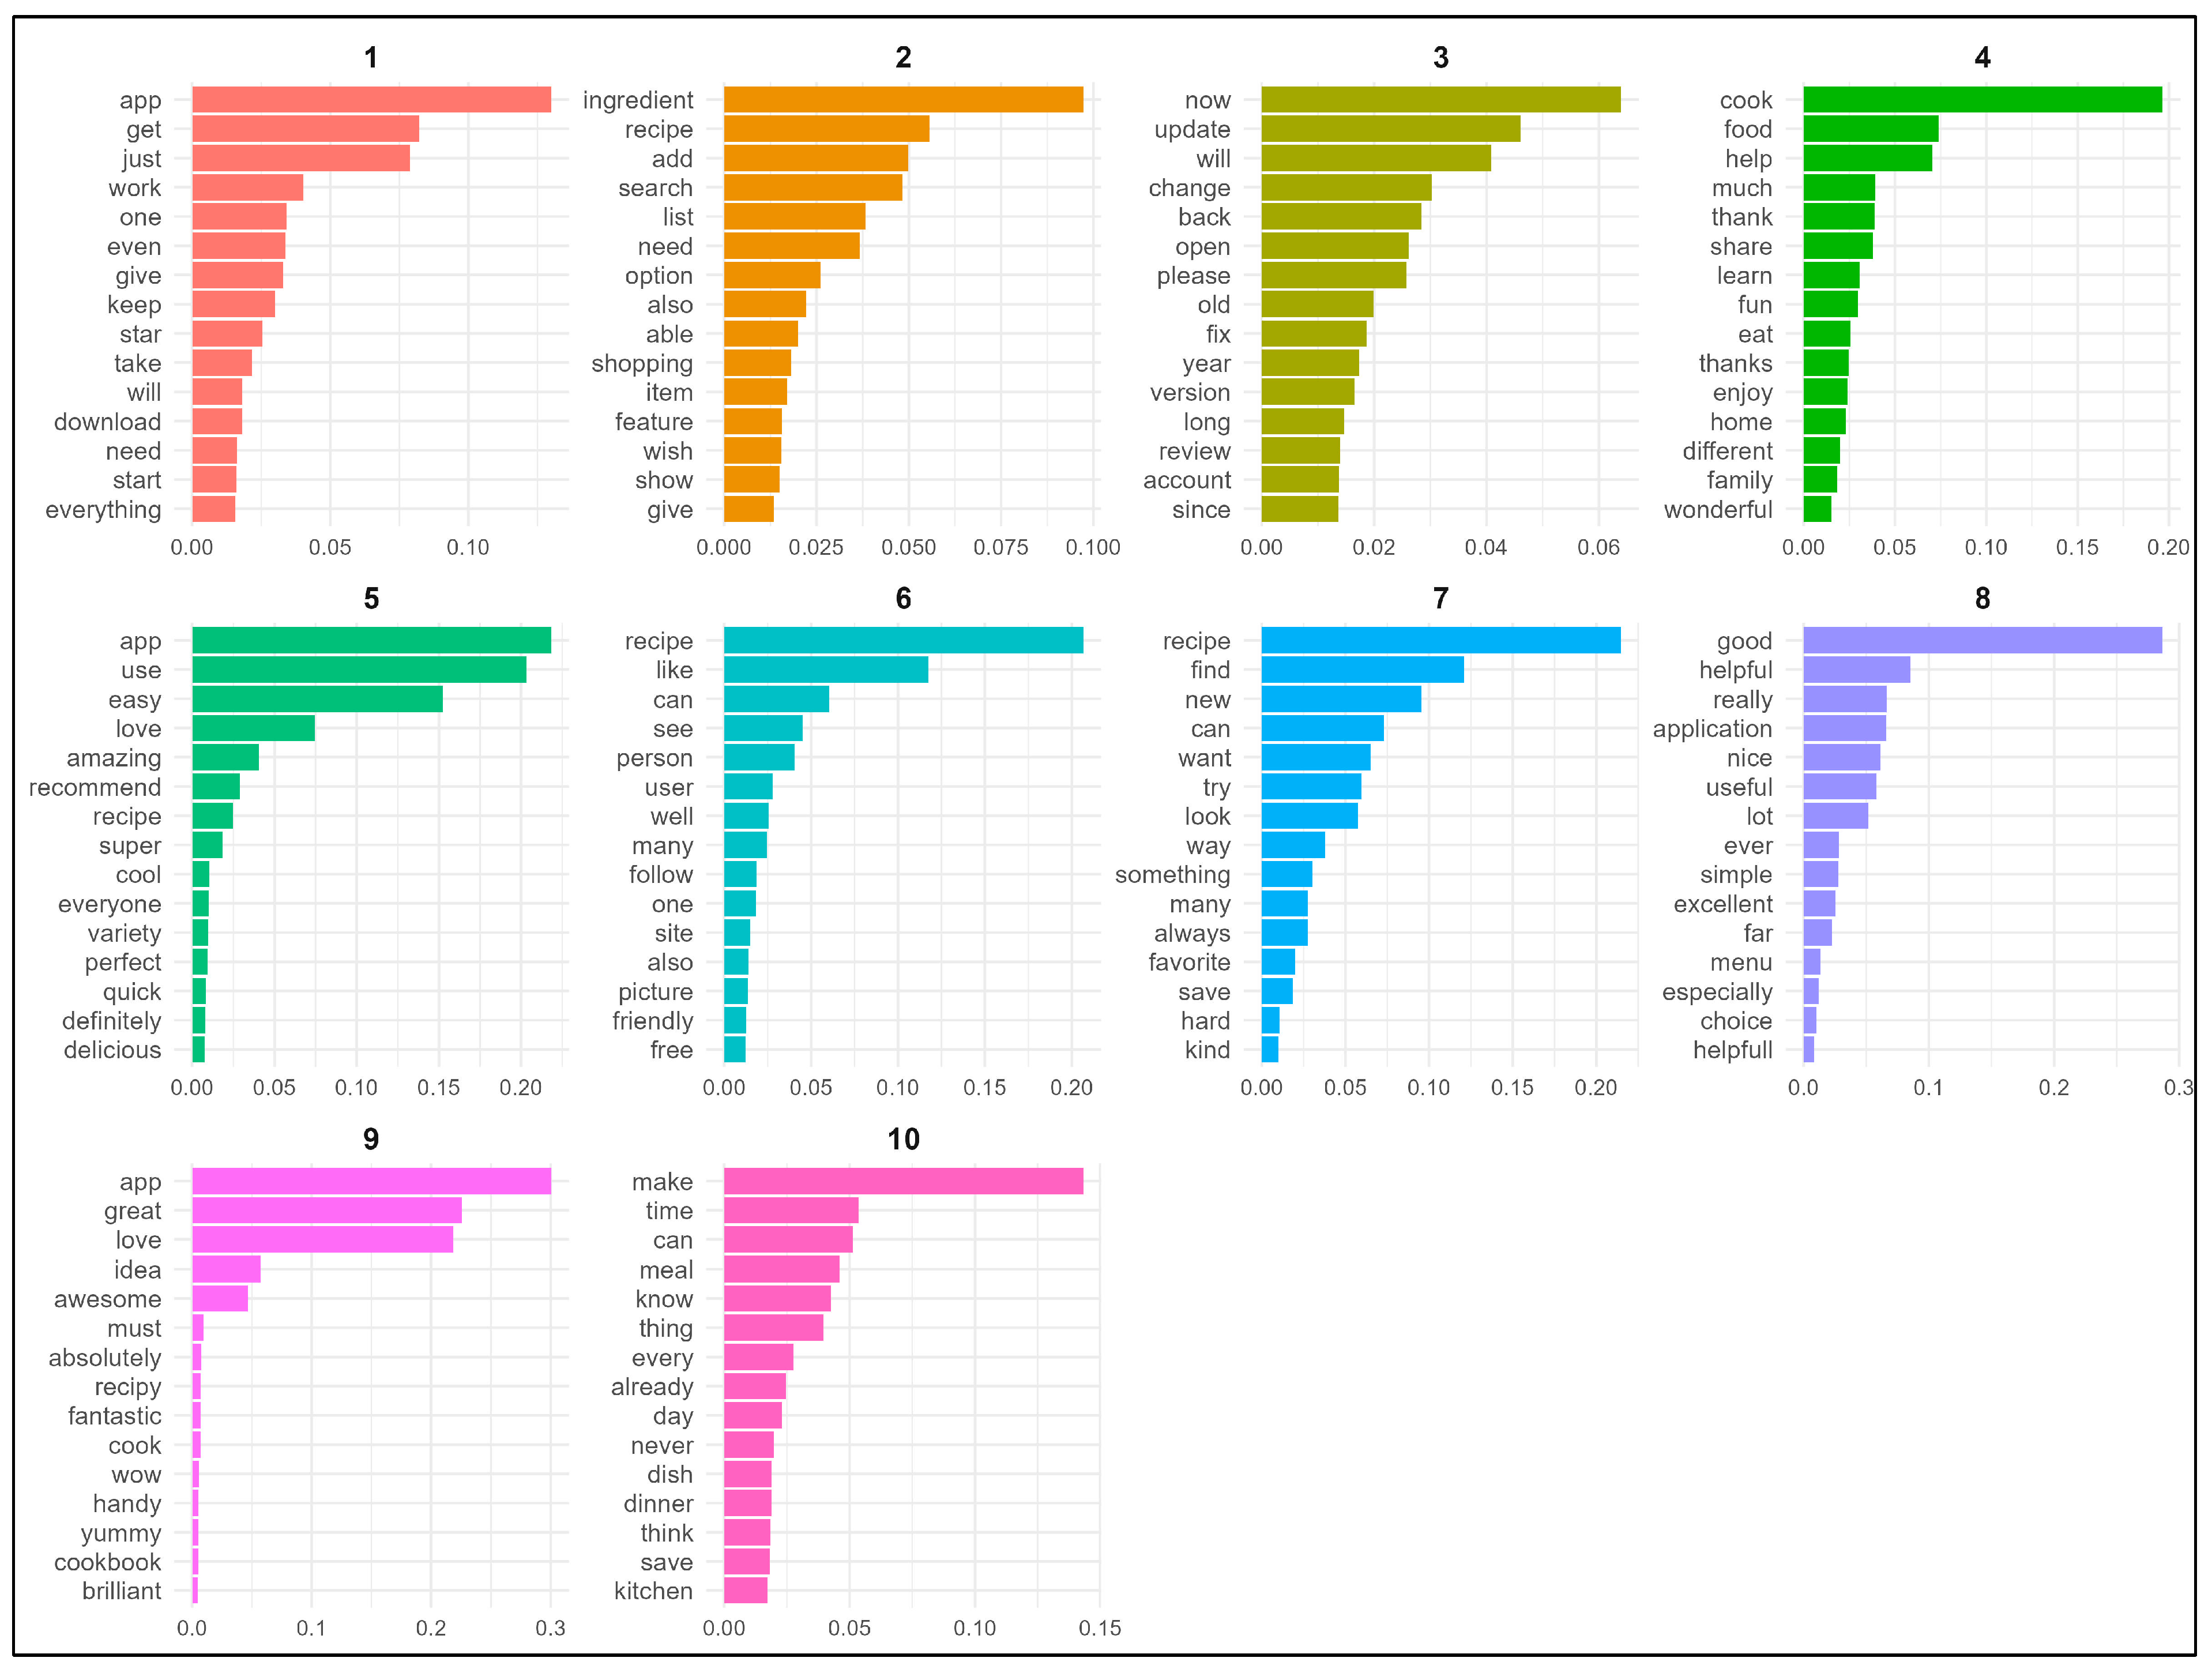
  • Cooking applications: 10 topics.
The assigned topic labels were validated by comparing the most probable keywords with representative user reviews. This process was independently performed by two researchers to ensure interpretive consistency and thematic accuracy.
Table 5, Table 6 and Table 7 present the labels assigned by the authors to the identified topics within the three distinct LDA models. Each table consists of two columns: “Topic with assigned label” and “Description”. The first column includes the topic number corresponding to the numbering used in the figures (Figure 7, Figure 8 and Figure 9), which was followed by the assigned label that encapsulates the core theme of the topic. The “Description” column provides a brief interpretation of each label we formulated to explain the thematic focus of the respective topic. For instance, the second row in Table 5 for sharing applications, which refers to Topic 1, is presented as follows: 1: Application features and user experience—Focuses on the overall application functionality, features, and user experience, including product selection, price, and general satisfaction with the application.
Figure 10a–c present the percentage distribution of dominant topics across the three application groups: (a) sharing applications, (b) shopping applications, and (c) cooking applications. Each figure illustrates the proportion of user reviews that were primarily associated with each identified topic in the respective LDA model.
For each review, the dominant topic was determined by selecting the topic with the highest weight from the topic distribution generated by the LDA model. This approach assumes that the topic with the highest assigned weight is the most representative of the content of a given review. The percentage distribution was then calculated by counting how many reviews were primarily associated with each topic and dividing this by the total number of reviews in the respective group. The results are presented as percentages to clearly illustrate the relative dominance of each topic within the review corpus. This method allows for a comprehensive understanding of which topics were the most prevalent in user reviews for each group of applications, offering insights into user concerns and priorities
In the figures, the x-axis shows the percentage of reviews associated with each topic, while the y-axis represents the dominant topics (numbered according to the topic labels used in earlier figures and tables). The values displayed on the bars indicate the exact percentage distribution, providing a clear comparison of topic dominance within each application group. For example, according to Figure 10a, the highest proportion of reviews was associated with Topic 1, accounting for 14.8% of all reviews. In contrast, the lowest proportion was linked to Topic 11 with only 5.5% of reviews related to this topic.
The dominance of Topic 1 in sharing applications—which focuses on features and user experience—may indicate that users value the application’s overall design, functionality, and usability. In contrast, the relatively lower proportion of reviews linked to Topic 11 (notifications and options) suggests these aspects are either less prominent in user experiences or less likely to generate feedback. Similar patterns in other groups suggest that users primarily engage with features directly linked to the application’s core purpose, such as shopping efficiency or meal planning.
While this study does not cover a formal sentiment analysis, some topics clearly reflected user sentiment. For example, topics such as “Positive reviews and recommendations” or “User experience and satisfaction” suggest favorable experiences, whereas topics like “Technical issues and updates” or “Transaction and payment process” often reveal critical or negative feedback.

4.3. Unified Topic Labels

We undertook an attempt to identify unified labels across the three application groups. The goal was to determine whether the identified topics could be meaningfully grouped into broader, cross-application categories. Following a qualitative analysis of the topic labels and their descriptions, we proposed a categorization into eight unified labels, considered the most coherent and representative of thematic patterns observed across all models. The results are presented in Table 8, which consists of two columns.
  • The first column (Unified Label) presents the name of each unified category.
  • The other column (Common Topics Across Applications) indicates which topic labels from the individual models (sharing, shopping, cooking applications) were assigned to each unified label.
For example, the first unified label, titled “Application setup, features and general experience”, includes the following:
  • Topics 1, 3, and 11 from the sharing applications model;
  • Topic 5 from the shopping applications model;
  • Topic 1 from the cooking applications model.
This approach highlights thematic overlaps and distinctions across the application types, offering a cohesive framework for understanding common patterns in user feedback.

5. Discussion

The standardized topic labels for the different types of applications that emerged in our study should be discussed in the context of UTAUT. This is because each label relates to particular constructs of the UTAUT model that influence the usage intentions of the investigated applications and, ultimately, their use. The Performance Expectancy construct includes labels such as “Product management and organization”, “Recipe discovery, product utilization and meal ideas”, and “Sustainability and environmental impact”. The label “Product management and organization” applies to content related to tangible economic benefits in the form of food management. In the scope of sharing, it is embodied in someone wanting to share food and organizing it into parcels. Then, the application helps manage these parcels. In terms of shopping, the applications allow users to share shopping lists and better organize joint shopping efforts. In the cooking domain, the applications help track supplies, expiration dates, and suggest recipes. The label “Recipe discovery, product utilization, and meal ideas” applies to content related to epistemic benefits for the user; i.e., it enriches their knowledge of how to save food and make a valuable and tasty meal out of it. The label “Sustainability and environmental impact” concerns reviews in which application users perceive it as a tool supporting environmental protection (by saving food). The Performance Expectancy construct is most widely represented among the extracted unified labels. Therefore, we argue that Performance Expectancy is a strong predictor of intention to use the applications we studied. This result is consistent with the research of Mularczyk et al. [68].
We assign the label “App setup, features, and general experience” to the Expectancy Effort construct. User reviews classified under this topic give other users an idea of the cognitive effort required to learn how to use the application. Users describe their experience of using the application—the interface, available functions, and layout. They praise the intuitiveness of the application or, on the contrary, point out the overly complex navigation and lack of clear instructions. Slow performance or lack of synchronization are aspects that are criticized.
We assign the labels “User satisfaction and feedback” and “Social interaction and sharing” to the Social Influence construct. This is because the reviews associated with them allow others to know whether the current users of the application are satisfied with it and whether they recommend it. In the reviews, application users emphasize the sense of community and the satisfaction of sharing food or recipes. Many reviews contain positive opinions, expressions of gratitude, and recommendations of the application. However, some users note that technical issues can weaken the positive impression.
The referral system is a very important decision-making mechanism for social media users. We assign the labels “Convenience, ease of use, and time management” and “Application updates and technical support” to Facilitating Conditions. This is because the reviews under these topics are related to the experience of current users of the application in terms of ease of use and technical support. Many reviews contain notes that after updates, applications hang, and errors cause confusion. Examples include problems with discount codes or synchronization not working.
The fact that we were able to assign all UTAUT constructs to the extracted unified labels indicates that our research is consistent with the general premise of UTAUT [64,65] and research of other authors in areas where technological innovations are also being introduced to transform our society toward sustainable consumption [66,67]. This also confirms the universality of the UTAUT perspective.
An interesting observation is that the unified label “Sustainability and environmental impact” was exclusively assigned to topics from the sharing applications group. This suggests that conscious pro-environmental behavior is particularly evident among users of these applications. Such a finding highlights the distinct eco-conscious motivations associated with food sharing and food rescue platforms, distinguishing them from other application types analyzed in this study. This is probably due to the fact that the problem of food waste is heavily publicized in the media. It highlights the waste of resources and the excess production of greenhouse gases resulting from food being sent to landfills. All this means that when there is an opportunity (thanks to applications) to share food and save it from being wasted, application users react with very positive emotions and refer in their reviews to environmental issues that they had previously heard about in the media [87,88]. This result is in line with studies [23,25,31], and we interpret it very optimistically as the formation of habits that favor sustainable consumption. It is also worth emphasizing that the label “Sustainability and environmental impact” was assigned to the Performance Expectancy construct not because of the personal benefits of using the application but because of environmental benefits. This indicates the altruistic attitudes of some application users and holistic thinking, which is necessary when solving complex sustainable development problems [89].

6. Conclusions

The aim of this study was to identify the key thematic areas addressed by users of mobile applications related to food sharing, shopping planning, and cooking. This objective was achieved through a combined approach using Latent Dirichlet Allocation (LDA) and the manual interpretation of representative user reviews. We identified eight unified themes spanning three distinct application categories. These themes were further discussed in the context of the unified theory of acceptance and use of technology (UTAUT), allowing us to interpret user behavior through established technology adoption frameworks.

6.1. Practical Implications

Our research may prove useful to developers of mobile applications that support responsible consumption. We would like to point out that priority should be given to features that increase the ease of use of these applications. A major problem reported in the reviews turned out to be updates detrimental to the functionality of the application. These are the problems that application developers should, in our opinion, focus on first. Secondly, we recommend introducing gamification elements into food rescue applications to promote sustainable behaviors. Many of the reviews we analyzed emphasized user satisfaction with the fact that thanks to the applications, they did something beneficial for themselves and the environment together with others. This could be associated with the rewards of doing something together, which suggests gamification as a potential path to pursue. We recommend gamification focused on cooperation, a sense of mission, and the discovery of surprises. Gamification elements can be (1) a points and level system, (2) badges and achievements, and (3) challenges. Rewards and benefits could also be an important element of a gamification scheme. This includes discounts from local partners or access to exclusive events or features in the application. We also recommend strengthening social interactions with food rescue applications. This could be accomplished through commendation systems or notice boards for activities such as the collective preparation of meals using rescued food.
Although we analyzed applications dedicated to the management of food purchased by consumers, juxtaposing them with the unified theory of acceptance and use of technology allowed us to identify general predictors that influence the willingness to use and actual use of applications that support sustainable consumption. Based on the predictors we identified, a survey questionnaire could be constructed to quantitatively examine the impact of these predictors on the actual use of the applications we studied.
Our research can also prove useful to organizations that support food rescue, as we show what topics are pertinent to the benefits generated by the investigated applications, which will help to promote these applications among new users. In this way, we support the transformation of our food consumption model into a more environmentally and socially sustainable one. Our research also showed that the analyzed applications were not free of performance errors and technical problems. These errors and problems may become a barrier and discourage the popularization of these applications in society. Therefore, we postulate the need for further research into the better design of such applications.
Furthermore, our concept of dividing application-related reviews into eight groups will allow people in charge of such applications to focus on specific problems when analyzing user feedback on the applications.
Our findings also provide theoretical contributions for future UTAUT-based research in the context of applications supporting sustainable consumption. Our observations related to assigning the label “Sustainability and environmental impact” to the construct Performance Expectancy indicate an altruistic motivation of some users to use food sharing applications. We recommend that the Performance Expectancy construct be divided into two sub-constructs, namely “Expected Personal Performance” and “Expected Performance for the Natural and Social Environment”. Many survey studies use the UTAUT theoretical framework. As a contribution to the framework development, our study provides evidence that the construct of Performance Expectancy, in the case of sustainable consumption research, should not be treated as a homogeneous construct. Instead, it should also include expected socio-environmental benefits. In this way, the UTAUT model can be considered in research on sustainable consumption in addition to Schwartz’s Theory of Basic Human Values [90].

6.2. Limitations and Future Research

This study focused on the existing and active mobile applications that were simultaneously available on both the App Store and Google Play Store. Applications that were discontinued or limited to a single platform were excluded. While this criterion ensured consistency and comparability across application ecosystems, it also limited the range of included applications and, consequently, the volume and diversity of user reviews. Despite extensive search efforts, no additional applications fulfilling all inclusion criteria were found. As a result, the findings are most representative of mainstream applications with a broader market reach, which may affect their generalizability to niche or regional tools.
Another limitation lies in the inherently subjective nature of topic interpretation in LDA-based content analysis. While the use of text mining techniques and most probable keywords helped structure the labeling process, the thematic categories were ultimately developed through human interpretation. To mitigate this subjectivity, two researchers independently reviewed representative user reviews and keywords, resolving any discrepancies through discussion and consensus. Nonetheless, full objectivity cannot be guaranteed.
Future research could benefit from a broader sample of applications, including lesser-known or region-specific tools, even if they are not cross-platform. In addition, the use of quantitative surveys based on the identified topic groups could serve to validate and extend the insights drawn from user-generated content. Particularly noteworthy is the topic group related to “Sustainability and environmental impact”, which appeared uniquely in food-sharing applications. This topic deserves deeper investigation to understand the motivations, values, and behavioral patterns associated with sustainable consumption. Furthermore, longitudinal analyses of user reviews over time could reveal evolving trends in public perception, functionality expectations, and engagement patterns.

Author Contributions

Conceptualization, M.W., A.M.-U., B.S.-W. and D.Z.; methodology, M.W., A.M.-U., B.S.-W. and D.Z.; formal analysis, M.W., D.Z.; investigation, M.W.; resources, M.W.; data curation, M.W.; writing—original draft preparation, M.W., A.M.-U., B.S.-W. and D.Z., writing—review and editing, M.W., A.M.-U., B.S.-W. and D.Z.; visualization, M.W.; supervision, M.W. and D.Z. All authors have read and agreed to the published version of the manuscript.

Funding

This research received no external funding.

Institutional Review Board Statement

Not applicable.

Informed Consent Statement

Not applicable.

Data Availability Statement

The original contributions presented in this study are included in the article. Further inquiries can be directed to the corresponding author.

Conflicts of Interest

The authors declare no conflicts of interest.

References

  1. Drozłowska, E.; Sobieraj, M. Food Sharing as Part of the Sharing Economy in the Context of Food Waste. Zesz. Nauk. Uniw. Szczec. Probl. Transp. Logistyki 2019, 48, 17–24. [Google Scholar] [CrossRef]
  2. Bilska, B.; Tomaszewska, M.; Kołożyn-Krajewska, D. Analysis of the Behaviors of Polish Consumers in Relation to Food Waste. Sustainability 2019, 12, 304. [Google Scholar] [CrossRef]
  3. Kopeć, M.; Gondek, K.; Mierzwa-Hersztek, M. Gospodarka o Obiegu Zamkniętym w Kontekście Strat i Marnowania Żywności. Pol. J. Sustain. Dev. 2019, 22, 51–58. [Google Scholar] [CrossRef]
  4. UNEP. Food Waste Index Report 2024. Available online: https://unstats.un.org/unsd/envstats/fdes/EGES11/9UNEP_Food%20Waste%20Index.pdf (accessed on 14 March 2025).
  5. Poças Ribeiro, A.; Rok, J.; Harmsen, R.; Rosales Carreón, J.; Worrell, E. Food Waste in an Alternative Food Network—A Case-Study. Resour. Conserv. Recycl. 2019, 149, 210–219. [Google Scholar] [CrossRef]
  6. Ranjbari, M.; Shams Esfandabadi, Z.; Siebers, P.-O.; Pisano, P.; Quatraro, F. Digitally Enabled Food Sharing Platforms towards Effective Waste Management in a Circular Economy: A System Dynamics Simulation Model. Technovation 2024, 130, 102939. [Google Scholar] [CrossRef]
  7. Makov, T.; Meshulam, T.; Cansoy, M.; Shepon, A.; Schor, J.B. Digital Food Sharing and Food Insecurity in the COVID-19 Era. Resour. Conserv. Recycl. 2023, 189, 106735. [Google Scholar] [CrossRef]
  8. Pisoni, A.; Canavesi, C.; Michelini, L. Food Sharing Platforms: Emerging Evidence from Italian and German Users. Transp. Res. Procedia 2022, 67, 137–146. [Google Scholar] [CrossRef]
  9. Ciulli, F.; Kolk, A.; Boe-Lillegraven, S. Circularity Brokers: Digital Platform Organizations and Waste Recovery in Food Supply Chains. J. Bus. Ethics 2020, 167, 299–331. [Google Scholar] [CrossRef]
  10. Michelini, L.; Principato, L.; Iasevoli, G. Understanding Food Sharing Models to Tackle Sustainability Challenges. Ecol. Econ. 2018, 145, 205–217. [Google Scholar] [CrossRef]
  11. Sundararajan, A. The Sharing Economy: The End of Employment and the Rise of Crowd-Based Capitalism; MIT Press: Cambridge, MA, USA, 2017. [Google Scholar]
  12. Schor, J.B.; Vallas, S.P. The Sharing Economy: Rhetoric and Reality. Annu. Rev. Sociol. 2021, 47, 369–389. [Google Scholar] [CrossRef]
  13. Davies, A.; Evans, D. Urban Food Sharing: Emerging Geographies of Production, Consumption and Exchange. Geoforum 2019, 99, 154–159. [Google Scholar] [CrossRef]
  14. Makov, T.; Shepon, A.; Krones, J.; Gupta, C.; Chertow, M. Social and Environmental Analysis of Food Waste Abatement via the Peer-to-Peer Sharing Economy. Nat. Commun. 2020, 11, 1156. [Google Scholar] [CrossRef]
  15. Storch, D.-M.; Timme, M.; Schröder, M. Incentive-Driven Transition to High Ride-Sharing Adoption. Nat. Commun. 2021, 12, 3003. [Google Scholar] [CrossRef]
  16. Michelini, L.; Grieco, C.; Ciulli, F.; Di Leo, A. Uncovering the Impact of Food Sharing Platform Business Models: A Theory of Change Approach. Br. Food J. 2020, 122, 1437–1462. [Google Scholar] [CrossRef]
  17. Närvänen, E.; Mattila, M.; Keränen, J.; Kaivonen, I.; Nurminen, M. Framing Value Propositions in the Food Waste Business: A Sociocultural Approach. Ind. Mark. Manag. 2022, 105, 211–222. [Google Scholar] [CrossRef]
  18. Schanes, K.; Stagl, S. Food Waste Fighters: What Motivates People to Engage in Food Sharing? J. Clean. Prod. 2019, 211, 1491–1501. [Google Scholar] [CrossRef]
  19. Mazzucchelli, A.; Gurioli, M.; Graziano, D.; Quacquarelli, B.; Aouina-Mejri, C. How to Fight against Food Waste in the Digital Era: Key Factors for a Successful Food Sharing Platform. J. Bus. Res. 2021, 124, 47–58. [Google Scholar] [CrossRef]
  20. Harvey, J.; Smith, A.; Goulding, J.; Branco Illodo, I. Food Sharing, Redistribution, and Waste Reduction via Mobile Applications: A Social Network Analysis. Ind. Mark. Manag. 2020, 88, 437–448. [Google Scholar] [CrossRef]
  21. Parfitt, J.; Barthel, M.; Macnaughton, S. Food Waste within Food Supply Chains: Quantification and Potential for Change to 2050. Philos. Trans. R. Soc. B Biol. Sci. 2010, 365, 3065–3081. [Google Scholar] [CrossRef]
  22. Abdelradi, F. Food Waste Behaviour at the Household Level: A Conceptual Framework. Waste Manag. 2018, 71, 485–493. [Google Scholar] [CrossRef]
  23. Morone, P.; Falcone, P.M.; Imbert, E.; Morone, A. Does Food Sharing Lead to Food Waste Reduction? An Experimental Analysis to Assess Challenges and Opportunities of a New Consumption Model. J. Clean. Prod. 2018, 185, 749–760. [Google Scholar] [CrossRef]
  24. Papargyropoulou, E.; Lozano, R.; Steinberger, J.K.; Wright, N.; Ujang, Z.B. The Food Waste Hierarchy as a Framework for the Management of Food Surplus and Food Waste. J. Clean. Prod. 2014, 76, 106–115. [Google Scholar] [CrossRef]
  25. Falcone, P.M.; Imbert, E. Bringing a Sharing Economy Approach into the Food Sector: The Potential of Food Sharing for Reducing Food Waste. In Food Waste Reduction and Valorisation; Morone, P., Papendiek, F., Tartiu, V.E., Eds.; Springer International Publishing: Cham, Switzerland, 2017; pp. 197–214. ISBN 978-3-319-50087-4. [Google Scholar]
  26. Meshulam, T.; Font-Vivanco, D.; Blass, V.; Makov, T. Sharing Economy Rebound: The Case of Peer-to-peer Sharing of Food Waste. J. Ind. Ecol. 2023, 27, 882–895. [Google Scholar] [CrossRef]
  27. WRAP EU. The Food Waste Reduction Roadmap Progress Report 2020. Available online: https://www.wrap.ngo/sites/default/files/2020-10/Food-Waste-Reduction-Roadmap-Progress-Report-2020.pdf (accessed on 13 March 2025).
  28. National Support Centre. for Agriculture (Krajowy Ośrodek Wsparcia Rolnictwa) Strategy for Rationalizing Losses and Reducing Food Waste (Strategia Racjonalizacji Strat i Ograniczania Marnotrawstwa Żywności). Available online: https://bankizywnosci.pl/wp-content/uploads/2022/04/STRATEGIA-PROM.pdf (accessed on 8 May 2025).
  29. Łaba, S.; Niedek, M.; Szczepański, K.; Łaba, R.; Kamińska-Dwórznicka, A. Regulation of the Food Waste Measuring in the EU in the Light of the Need of Counteracting the Food Wastage. Environ. Prot. Nat. Resour. 2019, 30, 1–7. [Google Scholar] [CrossRef]
  30. European Parliament. European Parliament Resolution of 16 May 2017 on the Initiative for Resource-Efficient Management: Reducing Food Waste and Improving Food Security (Rezolucja Parlamentu Europejskiego z Dnia 16 Maja 2017 r. w Sprawie Inicjatywy Dotyczącej Efektywnego Gospodarowania Zasobami: Ograniczenie Marnotrawienia i Zwiększenie Bezpieczeństwa Żywności (2016/2223(INI)). Available online: https://eur-lex.europa.eu/legal-content/PL/TXT/PDF/?uri=CELEX:52017IP0207 (accessed on 8 May 2025).
  31. Romani, S.; Grappi, S.; Bagozzi, R.P.; Barone, A.M. Domestic Food Practices: A Study of Food Management Behaviors and the Role of Food Preparation Planning in Reducing Waste. Appetite 2018, 121, 215–227. [Google Scholar] [CrossRef]
  32. Beata, B.; Grzesińska, W.; Tomaszewska, M.; Rudziński, M. Marnotrawstwo Żywności Jako Przykład Nieefektywnego Zarządzania w Gospodarstwach Domowych. Rocz. Nauk. Stowarzyszenia Ekon. Rol. Agrobiznesu 2015, 17, 39–43. [Google Scholar]
  33. Lucas, B.; Francu, R.E.; Goulding, J.; Harvey, J.; Nica-Avram, G.; Perrat, B. A Note on Data-Driven Actor-Differentiation and SDGs 2 and 12: Insights from a Food-Sharing App. Res. Policy 2021, 50, 104266. [Google Scholar] [CrossRef]
  34. European Circular Economy Stakeholder Platform. Roadmap for the Transition towards a Circular Economy (Mapa Drogowa Transformacji w Kierunku Gospodarki o Obiegu Zamkniętym). Available online: https://circulareconomy.europa.eu/platform/sites/default/files/2019_09_24_projekt_mapy_goz_po_dp_2409_czysty.pdf (accessed on 13 March 2025).
  35. Stancu, V.; Haugaard, P.; Lähteenmäki, L. Determinants of Consumer Food Waste Behaviour: Two Routes to Food Waste. Appetite 2016, 96, 7–17. [Google Scholar] [CrossRef]
  36. Farr-Wharton, G.; Foth, M.; Choi, J.H. Identifying Factors That Promote Consumer Behaviours Causing Expired Domestic Food Waste. J. Consum. Behav. 2014, 13, 393–402. [Google Scholar] [CrossRef]
  37. Aloysius, N.; Ananda, J.; Mitsis, A.; Pearson, D. The Last Bite: Exploring Behavioural and Situational Factors Influencing Leftover Food Waste in Households. Food Qual. Prefer. 2025, 123, 105327. [Google Scholar] [CrossRef]
  38. Shopping List—Listonic—App Store. Available online: https://apps.apple.com/pl/app/shopping-list-listonic/id331302745 (accessed on 4 February 2025).
  39. Shopping List—Listonic—Google Play. Available online: https://play.google.com/store/apps/details?id=com.l&pcampaignid=web_share (accessed on 4 February 2025).
  40. Bring! Grocery Shopping List—App Store. Available online: https://apps.apple.com/pl/app/bring-grocery-shopping-list/id580669177?l=pl (accessed on 4 February 2025).
  41. Bring—Google Play. Available online: https://play.google.com/store/apps/details?id=ch.publisheria.bring (accessed on 4 February 2025).
  42. NoWaste—Google Play. Available online: https://play.google.com/store/apps/details?id=com.khcreations.nowaste (accessed on 4 February 2025).
  43. NoWaste—Food Inventory List—App Store. Available online: https://apps.apple.com/pl/app/nowaste-food-inventory-list/id926211004?l=pl (accessed on 4 February 2025).
  44. Cookpad Recipes—Google Play. Available online: https://play.google.com/store/apps/details?id=com.mufumbo.android.recipe.search&pcampaignid=web_share (accessed on 4 February 2025).
  45. Cookpad Recipes—App Store. Available online: https://apps.apple.com/pl/app/cookpad-przepisy/id585332633?l=pl (accessed on 4 February 2025).
  46. SuperCook—Google Play. Available online: https://play.google.com/store/apps/details?id=com.supercook.app (accessed on 4 February 2025).
  47. SuperCook—App Store. Available online: https://apps.apple.com/pl/app/supercook-przepisy/id1477747816?l=pl (accessed on 4 February 2025).
  48. Too Good To Go—Google Play. Available online: https://play.google.com/store/search?q=too+good+to+go&c=apps (accessed on 4 February 2025).
  49. Too Good To Go—App Store. Available online: https://apps.apple.com/pl/app/too-good-to-go-ratuj-jedzenie/id1060683933?l=pl (accessed on 4 February 2025).
  50. Olio—Share More, Waste Less. Available online: https://play.google.com/store/search?q=olio&c=apps&hl=pl (accessed on 4 February 2025).
  51. Olio—App Store. Available online: https://apps.apple.com/pl/app/olio/id1008237086?l=pl (accessed on 4 February 2025).
  52. Karma-Save Food with a Tap—Google Play. Available online: https://play.google.com/store/apps/details?id=com.karma.life&hl=pl (accessed on 4 February 2025).
  53. Karma-Save Food with a Tap—App Store. Available online: https://apps.apple.com/us/app/karma-save-food-with-a-tap/id1087490062 (accessed on 4 February 2025).
  54. ResQ Club—Google Play. Available online: https://play.google.com/store/apps/details?id=club.resq.android&hl=pl (accessed on 4 February 2025).
  55. ResQ Club—App Store. Available online: https://apps.apple.com/pl/app/resq-club/id1069744707?l=pl (accessed on 4 February 2025).
  56. Foodsi—Google Play. Available online: https://play.google.com/store/apps/details?id=com.applover.foodsi&hl=pl (accessed on 4 February 2025).
  57. Foodsi—App Store. Available online: https://apps.apple.com/pl/app/foodsi-tu-si%C4%99-nie-marnuje/id1278873667?l=pl (accessed on 4 February 2025).
  58. Richards, T.J.; Hamilton, S.F. Food Waste in the Sharing Economy. Food Policy 2018, 75, 109–123. [Google Scholar] [CrossRef]
  59. Einav, L.; Farronato, C.; Levin, J. Peer-to-Peer Markets. Annu. Rev. Econ. 2016, 8, 615–635. [Google Scholar] [CrossRef]
  60. Curtis, S.K.; Mont, O. Sharing Economy Business Models for Sustainability. J. Clean. Prod. 2020, 266, 121519. [Google Scholar] [CrossRef]
  61. Martin, M.; Lazarevic, D.; Gullström, C. Assessing the Environmental Potential of Collaborative Consumption: Peer-to-Peer Product Sharing in Hammarby Sjöstad, Sweden. Sustainability 2019, 11, 190. [Google Scholar] [CrossRef]
  62. Warmington-Lundström, J.; Laurenti, R. Reviewing Circular Economy Rebound Effects: The Case of Online Peer-to-Peer Boat Sharing. Resour. Conserv. Recycl. X 2020, 5, 100028. [Google Scholar] [CrossRef]
  63. Nica-Avram, G.; Harvey, J.; Smith, G.; Smith, A.; Goulding, J. Identifying Food Insecurity in Food Sharing Networks via Machine Learning. J. Bus. Res. 2021, 131, 469–484. [Google Scholar] [CrossRef]
  64. Venkatesh, V.; Morris, M.G.; Davis, G.B.; Davis, F.D. User Acceptance of Information Technology: Toward a Unified View. MIS Q. 2003, 27, 425. [Google Scholar] [CrossRef]
  65. Venkatesh, V.; Thong, J.Y.; Xu, X. Consumer Acceptance and Use of Information Technology: Extending the Unified Theory of Acceptance and Use of Technology. MIS Q. 2012, 36, 157. [Google Scholar] [CrossRef]
  66. Zdonek, I.; Jaworska, A. Determinants of the Intention to Use Refills in the Cosmetic Industry. Sustainability 2024, 16, 10200. [Google Scholar] [CrossRef]
  67. Zdonek, I.; Mularczyk, A.; Turek, M.; Tokarski, S. Perception of Prosumer Photovoltaic Technology in Poland: Usability, Ease of Use, Attitudes, and Purchase Intentions. Energies 2023, 16, 4674. [Google Scholar] [CrossRef]
  68. Mularczyk, A.; Zdonek, I.; Turek, M.; Tokarski, S. Intentions to Use Prosumer Photovoltaic Technology in Poland. Energies 2022, 15, 6300. [Google Scholar] [CrossRef]
  69. JoMingyu. Google-Play-Scraper. Available online: https://pypi.org/project/google-play-scraper/ (accessed on 12 February 2025).
  70. Lim, E. App-Store-Scraper. Available online: https://pypi.org/project/app-store-scraper/ (accessed on 12 February 2025).
  71. Lui, M.; Baldwin, T. Langid. Py: An Off-the-Shelf Language Identification Tool. In Proceedings of the ACL 2012 System Demonstrations, Jeju Island, Republic of Korea, 10 July 2012; Zhang, M., Ed.; Association for Computational Linguistics: Jeju Island, Republic of Korea, 2012; pp. 25–30. [Google Scholar]
  72. Helsinki-NLP. Opus-Mt-Mul-En: Multilingual to English Translation Model. Hugging Face Model Repos. 2022. Available online: https://huggingface.co/Helsinki-NLP/opus-mt-mul-en (accessed on 12 February 2025).
  73. Qi, P.; Zhang, Y.; Zhang, Y.; Bolton, J.; Manning, C.D. Stanza: A Python Natural Language Processing Toolkit for Many Human Languages. In Proceedings of the 58th Annual Meeting of the Association for Computational Linguistics: System Demonstrations, Online, 5–10 July 2020; Association for Computational Linguistics: Stroudsburg, PA, USA, 2020; pp. 101–108. Available online: https://aclanthology.org/2020.acl-demos.14 (accessed on 12 February 2025).
  74. Initiative, Q. Snowball Stopword Lists. Available online: https://github.com/quanteda/stopwords (accessed on 13 March 2025).
  75. Lewis, D.D.; Yang, Y.; Rose, T.G.; Li, F. Rcv1: A New Benchmark Collection for Text Categorization Research. J. Mach. Learn. Res. 2004, 5, 361–397. [Google Scholar]
  76. Blei, D.M.; Ng, A.Y.; Jordan, M.I. Latent Dirichlet Allocation. J Mach Learn Res 2003, 3, 993–1022. [Google Scholar]
  77. Grün, B.; Hornik, K. Topicmodels: An R Package for Fitting Topic Models. J. Stat. Softw. 2011, 40, 1–30. [Google Scholar] [CrossRef]
  78. Anupriya, P.; Karpagavalli, S. LDA Based Topic Modeling of Journal Abstracts. In Proceedings of the 2015 International Conference on Advanced Computing and Communication Systems, Coimbatore, India, 5–7 January 2015; pp. 1–5. [Google Scholar]
  79. Abd-Alrazaq, A.; Alhuwail, D.; Househ, M.; Hamdi, M.; Shah, Z. Top Concerns of Tweeters During the COVID-19 Pandemic: Infoveillance Study. J. Med. Internet Res. 2020, 22, e19016. [Google Scholar] [CrossRef]
  80. Garcia, K.; Berton, L. Topic Detection and Sentiment Analysis in Twitter Content Related to COVID-19 from Brazil and the USA. Appl. Soft Comput. 2021, 101, 107057. [Google Scholar] [CrossRef]
  81. Mottaghinia, Z.; Feizi-Derakhshi, M.-R.; Farzinvash, L.; Salehpour, P. A Review of Approaches for Topic Detection in Twitter. J. Exp. Theor. Artif. Intell. 2021, 33, 747–773. [Google Scholar] [CrossRef]
  82. Arun, R.; Suresh, V.; Veni Madhavan, C.E.; Narasimha Murthy, M.N. On Finding the Natural Number of Topics with Latent Dirichlet Allocation: Some Observations. In Proceedings of the Advances in Knowledge Discovery and Data Mining, Hyderabat, India, 21–24 June 2010; Zaki, M.J., Yu, J.X., Ravindran, B., Pudi, V., Eds.; Springer: Berlin/Heidelberg, Germany, 2010; pp. 391–402. [Google Scholar]
  83. Cao, J.; Xia, T.; Li, J.; Zhang, Y.; Tang, S. A Density-Based Method for Adaptive LDA Model Selection. Neurocomputing 2009, 72, 1775–1781. [Google Scholar] [CrossRef]
  84. Deveaud, R.; SanJuan, E.; Bellot, P. Accurate and Effective Latent Concept Modeling for Ad Hoc Information Retrieval. Doc. Numer. 2014, 17, 61–84. [Google Scholar] [CrossRef]
  85. Ponweiser, M. Latent Dirichlet Allocation in R. Latent Dirichlet Alloc. R 2012. [Google Scholar] [CrossRef]
  86. Griffiths, T.L.; Steyvers, M. Finding Scientific Topics. Proc. Natl. Acad. Sci. USA 2004, 101, 5228–5235. [Google Scholar] [CrossRef] [PubMed]
  87. Jenkins, E.L.; Brennan, L.; Molenaar, A.; McCaffrey, T.A. Exploring the Application of Social Media in Food Waste Campaigns and Interventions: A Systematic Scoping Review of the Academic and Grey Literature. J. Clean. Prod. 2022, 360, 132068. [Google Scholar] [CrossRef]
  88. Chamcham, J.; Pakravan-Charvadeh, M.R.; Maleknia, R.; Flora, C. Media Literacy and Its Role in Promoting Sustainable Food Consumption Practices. Sci. Rep. 2024, 14, 18831. [Google Scholar] [CrossRef] [PubMed]
  89. Harwood, S.A. Systems Thinking and Sustainable Development. In Encyclopedia of Sustainability in Higher Education; Leal Filho, W., Ed.; Springer International Publishing: Cham, Switzerland, 2019; pp. 1892–1897. ISBN 978-3-030-11351-3. [Google Scholar]
  90. Schwartz, S.H.; Cieciuch, J.; Vecchione, M.; Davidov, E.; Fischer, R.; Beierlein, C.; Ramos, A.; Verkasalo, M.; Lönnqvist, J.-E.; Demirutku, K.; et al. Refining the Theory of Basic Individual Values. J. Pers. Soc. Psychol. 2012, 103, 663–688. [Google Scholar] [CrossRef]
Figure 1. Analytical workflow for user review analysis. Step 4 involves the application of established metrics to estimate the optimal number of topics (k), based on methods proposed in previous studies [71,72,73,74,75]. Source: original study.
Sustainability 17 04443 g001
Figure 2. Distribution of detected languages in user reviews. Source: original study.
Sustainability 17 04443 g002
Figure 3. Yearly and monthly distribution of user reviews. Source: original study.
Sustainability 17 04443 g003
Figure 4. Determining the optimal number of LDA topics: a metric comparison for sharing applications. Metrics used: Arun2010 [87], CaoJuan2009 [72], Deveaud2014 [89], and Griffiths2004 [74,75]. The upper panel presents metrics that should be maximized, and the lower panel those that should be minimized. Source: original study.
Sustainability 17 04443 g004
Figure 5. Determining the optimal number of LDA topics: a metric comparison for shopping applications. Metrics used: Arun2010 [87], CaoJuan2009 [72], Deveaud2014 [89], and Griffiths2004 [74,75]. The upper panel presents metrics that should be maximized, and the lower panel those that should be minimized. Source: original study.
Sustainability 17 04443 g005
Figure 6. Determining the optimal number of LDA topics: a metric comparison for cooking applications. Metrics used: Arun2010 [87], CaoJuan2009 [72], Deveaud2014 [89], and Griffiths2004 [74,75]. The upper panel presents metrics that should be maximized, and the lower panel those that should be minimized. Source: own study.
Sustainability 17 04443 g006
Figure 7. Most probable words for the 11 identified topic in sharing applications. Source: original study.
Sustainability 17 04443 g007
Figure 8. Most probable words for the 8 identified topic in shopping applications. Source: original study.
Sustainability 17 04443 g008
Figure 9. Most probable words for the 10 identified topic in cooking applications. Source: original study.
Sustainability 17 04443 g009
Figure 10. Percentage distribution of dominant topics across application groups: (a) sharing applications; (b) shopping applications; and (c) cooking applications. Source: original study.
Sustainability 17 04443 g010
Table 1. Comparative analysis of the applications in the “shopping” category.
ApplicationShopping ListBringNoWaste
Functioncreating simple shopping lists, making it easy to add products quicklyextensive, visual organization of shopping lists, with an emphasis on list sharing and meal planningmanaging food stocks and reducing food waste by tracking expiry dates and planning meals
Shopping list organization/Interfacetextual and minimalist shopping listan attractive, graphic interface with product icons and categoriesstock lists with expiry dates and marking used-up products
Meal planningno meal planning functionbasic meal planning functions, assigning products to recipesadvanced meal planning based on available products
Inventory managementnonoinventory monitoring, including items soon to expire
List sharinglimited or no sharing (depending on the version)easy sharing with family or friendsfocus on individual management, sharing less frequently used
Environmental objectivenoneindirect (through purchase planning)clearly defined: to reduce food waste
Target userthose seeking simplicityfamilies, couples, and people planning to shop togetherenvironmentally conscious people who care about stockpiling and not wasting
Source: [38,39,40,41,42,43].
Table 2. Comparative analysis of the applications in the “cooking” category.
ApplicationCookpad RecipesSuperCook
Functionsharing recipes and offering inspiration from user-submitted dishessearching for recipes based on ingredients in the refrigerator
Recipe databasea huge community of users sharing recipesan algorithm for matching recipes to ingredients
Interfacecolorful, with lots of pictures and commentssimple and functional, focused on the list of ingredients
Personalizationfollowing one’s favorite chefs and recipesrecipes selected depending on available ingredients
Communitystrong, users publish, comment, and save recipesno extended community
Meal planningfavorite lists and recipe planningautomatic suggestions based on the content of the refrigerator
Inventory managementnothe user adds ingredients, and the application monitors them
Target userthose seeking culinary inspiration and communitypeople who want to cook with what they have and not waste food
Source: [44,45,46,47].
Table 3. Comparative analysis of the applications in the “sharing” category.
ApplicationToo Good To GoOlioKarmaResQ ClubFoodsi
Functionbuying “magic packets” of unsold foodsharing free food with otherspurchase of surplus food from catering establishmentspurchase of unsold meals at a reduced pricebuying discounted unsold food products
Target usersall usersprivate individuals and companiesprivate customersprivate customersprivate customers
Type of offersurprise food setsproducts for freespecific dishes/productsready mealsfood parcels
Food sourcerestaurants, bakeries, cafés, and shopsmainly neighbors and local residentsrestaurants, bakeries, cafés, and shopsrestaurants, bakeries, cafés, and shopsrestaurants, bakeries, cafés, and shops
Means of food collectioncollection of surprise packages at a specific place and timeflexible collection from private individuals (e.g., neighbors), often following direct contactselection of specific dishes and pick-up at the premisescollection of surprise packages at a specific place and timecollection of surprise packages at a specific place and time
Source: [48,49,50,51,52,53,54,55,56,57].
Table 4. Number of reviews by application and platform.
Application NameTypePlay StoreApp StoreTotal
FoodsiSharing79 (25.2%)234 (74.8%)313
KarmaSharing572 (29.6%)1359 (70.4%)1931
OlioSharing12,436 (71.5%)4947 (28.5%)17,383
ResQ ClubSharing284 (45.4%)342 (54.6%)626
Too Good To GoSharing45,257 (55.0%)37,087 (45.0%)82,344
BringShopping5924 (29.6%)14,103 (70.4%)20,027
NoWasteShopping32 (5.5%)553 (94.5%)585
Shopping ListShopping29,668 (75.5%)9626 (24.5%)39,294
Cookpad RecipesCooking19,398 (88.4%)2537 (11.6%)21,935
SuperCook RecipesCooking4258 (83.4%)845 (16.6%)5103
Source: original study.
Table 5. Topic labels and descriptions—sharing applications.
Topic with Assigned LabelDescription
1. Application features and user experienceThe topic focuses on the overall application functionality, features, and user experience, including product selection, price, and general satisfaction with the app.
2. Food bag and product collectionThe topic highlights the process of purchasing and collecting food bags with emphasis on the surprise element, meal worth, and satisfaction with the products received.
3. Ease of use and application interfaceThe topic focuses on the ease of navigating the application, using its features, and sharing experiences within the application.
4. Transaction and payment processThe topic covers the transaction process, including how users place orders, make payments, and interact during the purchasing journey.
5. Ordering and collection processThe topic relates to placing orders, selecting pick-up times, customer experiences during collection, and handling issues like cancellations.
6. Restaurant experience and local dealsThe topic focuses on discovering new restaurants, finding deals in local areas, and the user’s overall experience with food outlets.
7. Technical issues and updatesThe topic highlights challenges users face with the application, including technical glitches, update issues, and problems with notifications.
8. Sustainability and reducing food wasteThe topic emphasizes the application’s contribution to sustainability by reducing food waste, promoting cost-effective purchases, and encouraging eco-friendly behaviors.
9. Quality and service experienceThe topic focuses on feedback related to food quality, value for money, service experiences, and interactions with restaurant staff.
10. Positive reviews and recommendationsThe topic captures positive user reviews, application recommendations, and praise for discounts, concepts, and experiences.
11. Application options and notificationsThe topic focuses on application-specific options, settings, notification preferences, and how users customize their application experience.
Source: own study.
Table 6. Topic labels and descriptions—shopping applications.
Topic with Assigned LabelDescription
1. List creation and managementThe topic focuses on creating and managing shopping lists, adding and organizing items, and customizing lists for efficient shopping.
2. Application features and user recommendationsThe topic emphasizes user opinions about application features, ease of use, and recommendations based on practical and intuitive usage.
3. Shopping needs and preferencesThe topic relates to users’ needs, their approach to grocery shopping, organization methods, and the importance of keeping track of purchases.
4. Product selection and purchase processThe topic highlights the process of selecting products and purchasing them, considering categories, prices, and available options.
5. Application quality and performance feedbackThe topic covers feedback about application performance, reliability, and additional features like synchronization, sharing, or integrations with devices.
6. Updates and technical aspectsThe topic focuses on updates, performance improvements, and technical issues that affect application usage.
7. Family and household shoppingThe topic relates to organizing shopping lists for families, ensuring that all household members are included in the shopping process.
8. Simplicity and efficiency of usageThe topic highlights the simplicity and convenience of using the application, emphasizing user-friendliness and efficient task management.
Source: original study.
Table 7. Topic labels and descriptions—cooking applications.
Topic with Assigned LabelDescription
1. Application usage and general experienceThe topic focuses on the general use of the application, including downloading, starting, and interacting with its core features.
2. Managing ingredients and shopping listsThe topic emphasizes adding and managing ingredients, creating shopping lists, and organizing meal planning based on available items.
3. App updates and technical supportThe topic focuses on the application’s technical functionality, including updates, changes, bug fixes, and general improvements to ensure smooth usage.
4. Cooking experience and enjoymentThe topic highlights the overall cooking process, including preparing meals, learning new techniques, and enjoying meals with family.
5. Easy recipe recommendations and convenienceThe topic relates to the application’s ability to recommend easy recipes based on what users have available, helping them make quick and efficient meal decisions.
6. Recipe browsing and explorationThe topic focuses on searching and browsing recipes, discovering new dishes, and saving favorite options for later.
7. Finding and saving recipesThe topic emphasizes the process of finding new recipes, saving them for future use, and searching for specific dish ideas.
8. User experience and satisfactionThe topic captures user satisfaction, positive feedback, and overall recommendations for the application’s functionality and ease of use.
9. App recommendations and feedbackThe topic concerns user recommendations and positive feedback about the application.
10. Meal planning and time managementThe topic focuses on efficient meal planning, organizing cooking routines, and managing time effectively when preparing meals.
Source: own study.
Table 8. Unified topic labels across application types in the UTAUT construct context.
Unified LabelCommon Topics (Across Applications)UTAUT Construct
1. Application setup, features, and general experienceSharing (1, 3, 11), shopping (5), cooking (1) (includes general application use, setup, and customization features)Effort Expectancy (EE)
2. User satisfaction and feedbackSharing (9, 10), shopping (2), cooking (8, 9) (captures user reviews, satisfaction, and overall recommendations)Social Influence (SI)
3. Product management and organizationSharing (2), shopping (4), cooking (2) (focuses on managing ingredients, products, and shopping lists)Performance Expectancy (PE)
4. Convenience, ease of use, and time managementSharing (3, 4, 5), shopping (8), cooking (5, 10) (covers ease of use, efficient processes, and time management across all applications)Facilitating
Conditions (FC)
5. Recipe discovery, product utilization, and meal ideasSharing (6), shopping (7), cooking (6, 7) (unifies traditional recipe discovery and creative product utilization for rescued food)Performance Expectancy (PE)
6. Application updates and technical supportSharing (7), shopping (6), cooking (3) (addresses technical functionality, updates, and support issues)Facilitating
Conditions (FC)
7. Sustainability and environmental impactSharing (8) (unique to food rescue applications, emphasizing eco-conscious behavior and reducing food waste)Performance Expectancy (PE)
8. Social interaction and sharingSharing (4), shopping (7), cooking (9) (includes social sharing, community engagement, and family/group coordination for shopping)Social Influence (SI)
Source: original study.
Disclaimer/Publisher’s Note: The statements, opinions and data contained in all publications are solely those of the individual author(s) and contributor(s) and not of MDPI and/or the editor(s). MDPI and/or the editor(s) disclaim responsibility for any injury to people or property resulting from any ideas, methods, instructions or products referred to in the content.

