Article

Introduction Experiment of Annual Oat Forage and Screening of Microbial Fertilizer in Qinghai–Tibet Plateau

1
Academy of Animal Husbandry and Veterinary Sciences, Qinghai University, Xining 810016, China
2
Key Laboratory of Adaptive Management of Alpine Grassland, Xining 810016, China
3
State Key Laboratory of Ecology and Plateau Agriculture and Animal Husbandry in Sanjiangyuan Jointly Established by the Ministry of Provincial Affairs, Qinghai University, Xining 810016, China
4
Animal Epidemic Disease Prevention and Control Center, Dari County, Guoluo 814000, China
*
Author to whom correspondence should be addressed.
Sustainability 2025, 17(10), 4444; https://doi.org/10.3390/su17104444
Submission received: 23 March 2025 / Revised: 28 April 2025 / Accepted: 30 April 2025 / Published: 13 May 2025

Abstract

:
We conducted experiments to screen annual forage oats suitable for cultivation at high altitude (4200 m), and to establish a green fertilization system with microbial fertilizers and manure organic fertilizers in order to provide technical support for a sustainable forage production system in the pastoral areas of the Qinghai–Tibetan Plateau. The experiment followed the principle of randomized block design to systematically analyze the agronomic traits, yield quality, and soil health of oats among different treatments, and to screen for adaptable oat varieties and the optimal application rate of microbial fertilizers with organic manure. The results showed that the following: (1) The results of the oat variety screening test showed that the yield and quality indexes of ‘Qing Yin No. 2’ and ‘Bai Yan No. 7’ introduced in high altitude areas were higher than those of other oat varieties, with high membership function values of 0.69 and 0.65, respectively. (2) The combined application of microbial fertilizer and organic fertilizer showed that the combined application could significantly improve the growth and photosynthetic characteristics of ‘Bai Yan No. 7’. The combination of the two also improved the yield quality of ‘Bai Yan No. 7’; the hay yield with the BHC3 treatment was 8508.00 kg·hm−2, significantly higher than the BCK treatment (p < 0.05). Regarding soil fertility, under the BHC3 treatment, compared with the BCK, soil nutrient contents and soil enzyme activities were also significantly improved (p < 0.05). At the same time, the combination of the two treatments also significantly improved the growth and photosynthetic characteristics of ‘Qing Yin No. 2’. The combination of the two also improved the yield quality of ‘Qing Yin No. 2’, and the hay yield with the QDY4 treatment was 8707.67 kg·hm−2, which was significantly increased by 25.37%, compared with that of QCK. Regarding soil fertility, under the QHC2 treatment, compared with the QCK treatment, soil nutrient contents and soil enzyme activities were also significantly improved. To sum up, ‘Qing Yin No. 2’ and ‘Bai Yan No. 7’ can better adapt to the ecological environment in high altitude areas, and are suitable for planting in areas with an altitude of 4200 m. The combined application of Trichoderma harzianum, Bacillus licheniformis, and organic fertilizer can improve the yield, nutritional quality, and soil fertility of ‘Qing Yin No. 2’ and ‘Bai Yan No. 7’. The best treatment for ‘Qing Yin No. 2’ is QDY4, that is, 15.00 kg of Bacillus licheniformis is applied per hectare, and 18,000 kg of cattle and sheep manure organic fertilizer is applied per hectare. The best treatment for ‘Bai Yan No. 7’ is BHC3, that is, 6.00 kg of Trichoderma harzianum is applied per hectare, and 18,000 kg of cattle and sheep manure organic fertilizer is applied per hectare. With the above treatment, the forage grass grows best, the soil nutrient content in the forage grass field is the highest, and the input–output ratio is the highest.

1. Introduction

The climatic conditions in high-altitude areas such as the Qinghai–Tibet Plateau in China are harsh, which is influenced by low temperatures and short plant production periods, resulting in low forage yield [1]. At the same time, excessive use of chemical fertilizers leads to the decrease of soil microbial and enzyme activities, soil hardening, and low nutrient conversion efficiency, resulting in poor forage quality [2,3]. The above-mentioned natural and human factors have become the main difficulties restricting forage production in areas more than 4000 m above sea level. Oat (Avena sativa L.) is an annual herbaceous plant of the grass family, Oataceae (Avena L.), which is highly adaptable and rich in nutritional value, and plays an important role in the development of animal husbandry [4]. At present, some researches are devoted to cultivating high-yield and high-quality oat varieties to meet the needs of animal husbandry development [5]. For example, Wang et al. [6] improved the yield and stress resistance of different oat varieties through improvement and breeding. At the same time, it was found that different oat varieties had different nutrient contents and obvious differences in palatability and digestibility [7]. Therefore, it is an urgent problem to select oat varieties suitable for the local climate and soil conditions in high altitude areas and add reasonable nutrients.
The combined application of microbial fertilizer and organic fertilizer is an effective method to improve crop production efficiency and soil quality [8]. A large amount of organic matter in organic fertilizer can be decomposed by microorganisms and release nutrients for plants to absorb and utilize. In agricultural production, the combined application of microbial fertilizer and organic fertilizer can significantly improve crop yield [8]. For example, applying rhizobia microbial fertilizer and organic fertilizer to the roots of leguminous crops (such as peas, soybeans, lentils, etc.) can increase the nitrogen fixation efficiency of rhizobia and improve plant growth and development [9]. Fang et al. [10] studied the effects of a combined application of microbial fertilizer and conventional fertilization on potatoes, and found that the combined application of microbial fertilizer could increase the potato plant height by 7.8% to 9.4%. In actual production, the combined application of microbial fertilizer and organic fertilizer has a complementary effect, which can significantly increase the crop yield and improve the soil environment [11]. Due to the different application rates, there are great differences in the oat yield and quality after the combined application of microbial fertilizer and organic fertilizer [12]. Yang et al. [13] found that different fertilization methods have different effects on the nutrient content and composition of oats. However, in the high altitude area (4000 m), such as in Dari County, the climatic environment is harsh and changeable, and the production of oats is faced with various problems, such as vague fertilizer application amount, unreasonable fertilizer structure, low fertilizer utilization rate, single fertilizer type, and the application blank of microbial fertilizer in this area, which seriously limits the sustainable development of the oat forage industry in this area.
Based on this, the experiment of oat introduction aims to explore the adaptability of different oat varieties in high altitude areas. By comparing the growth physiological indexes of different oat varieties and evaluating the differences of nutritional components, the suitable oat varieties were screened for forage production in high altitude areas. At the same time, through the screening tests of microbial fertilizer and organic fertilizer, the purpose is to enrich the fertilizer types, to improve fertilization methods, and to promote scientific, green, and sustainable fertilization measures, thereby improving oat yield and quality, and improving the soil properties in forage fields.

2. Materials and Methods

2.1. General Situation of Test Site

The experiment was conducted in 2023–2024. The experimental sites are located in Manzhang Township and Shanghongke Township, Dari County, Guoluo Tibetan Autonomous Prefecture, Qinghai Province. It is about 4200 m above sea level and belongs to the continental semi-humid climate on the plateau. The annual average temperature is −1.5 °C, the annual precipitation is 430 mm, there is no absolute first frost, the annual sunshine is 3320 h, and the forage growing season is about 130 d.
The tested soil is classified as Haplic Calcisol following the FAO classification system, the soil conductivity EC (water–soil ratio 1:5) is 705 us·cm−1, and the soil pH is 8.87. The soil nutrient contents include organic carbon 34.21 g·kg−1, total nitrogen 3.33 g·kg−1, total phosphorus 1.52 g·kg−1, total potassium 20.84 g·kg−1, alkali-hydrolyzable nitrogen 177.60 mg·kg−1, available phosphorus 34.11 mg·kg−1, and available potassium 395.55 mg·kg−1, respectively.

2.2. Test Materials

The oat varieties tested in the oat introduction test are ‘Qing Tian No. 1’, ‘Bai Yan No. 7’, ‘Jia Yan’, ‘Lin Na’, ‘Qing Tian No. 2’, and ‘Qing Yin No. 2’, all provided by Qinghai Academy of Animal Husbandry and Veterinary Sciences. See Table 1 for the information of the tested grass species.
For the experiment on the combined application of microbial fertilizer and organic fertilizer, the grass species tested were ‘Bai Yan No. 7’ and ‘Qing Yin No. 2’. The organic fertilizer for cattle and sheep manure (organic matter 15.0~25.0%, N + P2O5 + K2O ≥ 5%, water content 30.0~35.0%, pH = 7.95) was provided by Qinghai Runda Agriculture and Animal Husbandry Science and Technology Co., Ltd. (Xining, China). The tested microbial inoculum was provided by Hubei Qiming Bioengineering Co., Ltd. (Wuhan, China), and the effective viable count of Trichoderma harzianum inoculum was ≥500 million·g−1. The compound microbial inoculum was mainly composed of various highly active microbial bacteria, such as Trichoderma, Bacillus and their secondary metabolites, supplemented by various nutrient elements needed for plant growth, and the effective viable count was ≥100 million·g−1. In microbial fertilizer, cadmium (Cd) ≤ 0.07 mg·kg−1, chromium (Cr) ≤ 0.9 mg·kg−1, arsenic (As) ≤ 0.08 mg·kg−1, and the number of Escherichia coli in cattle and sheep manure ≤ 100·g−1.

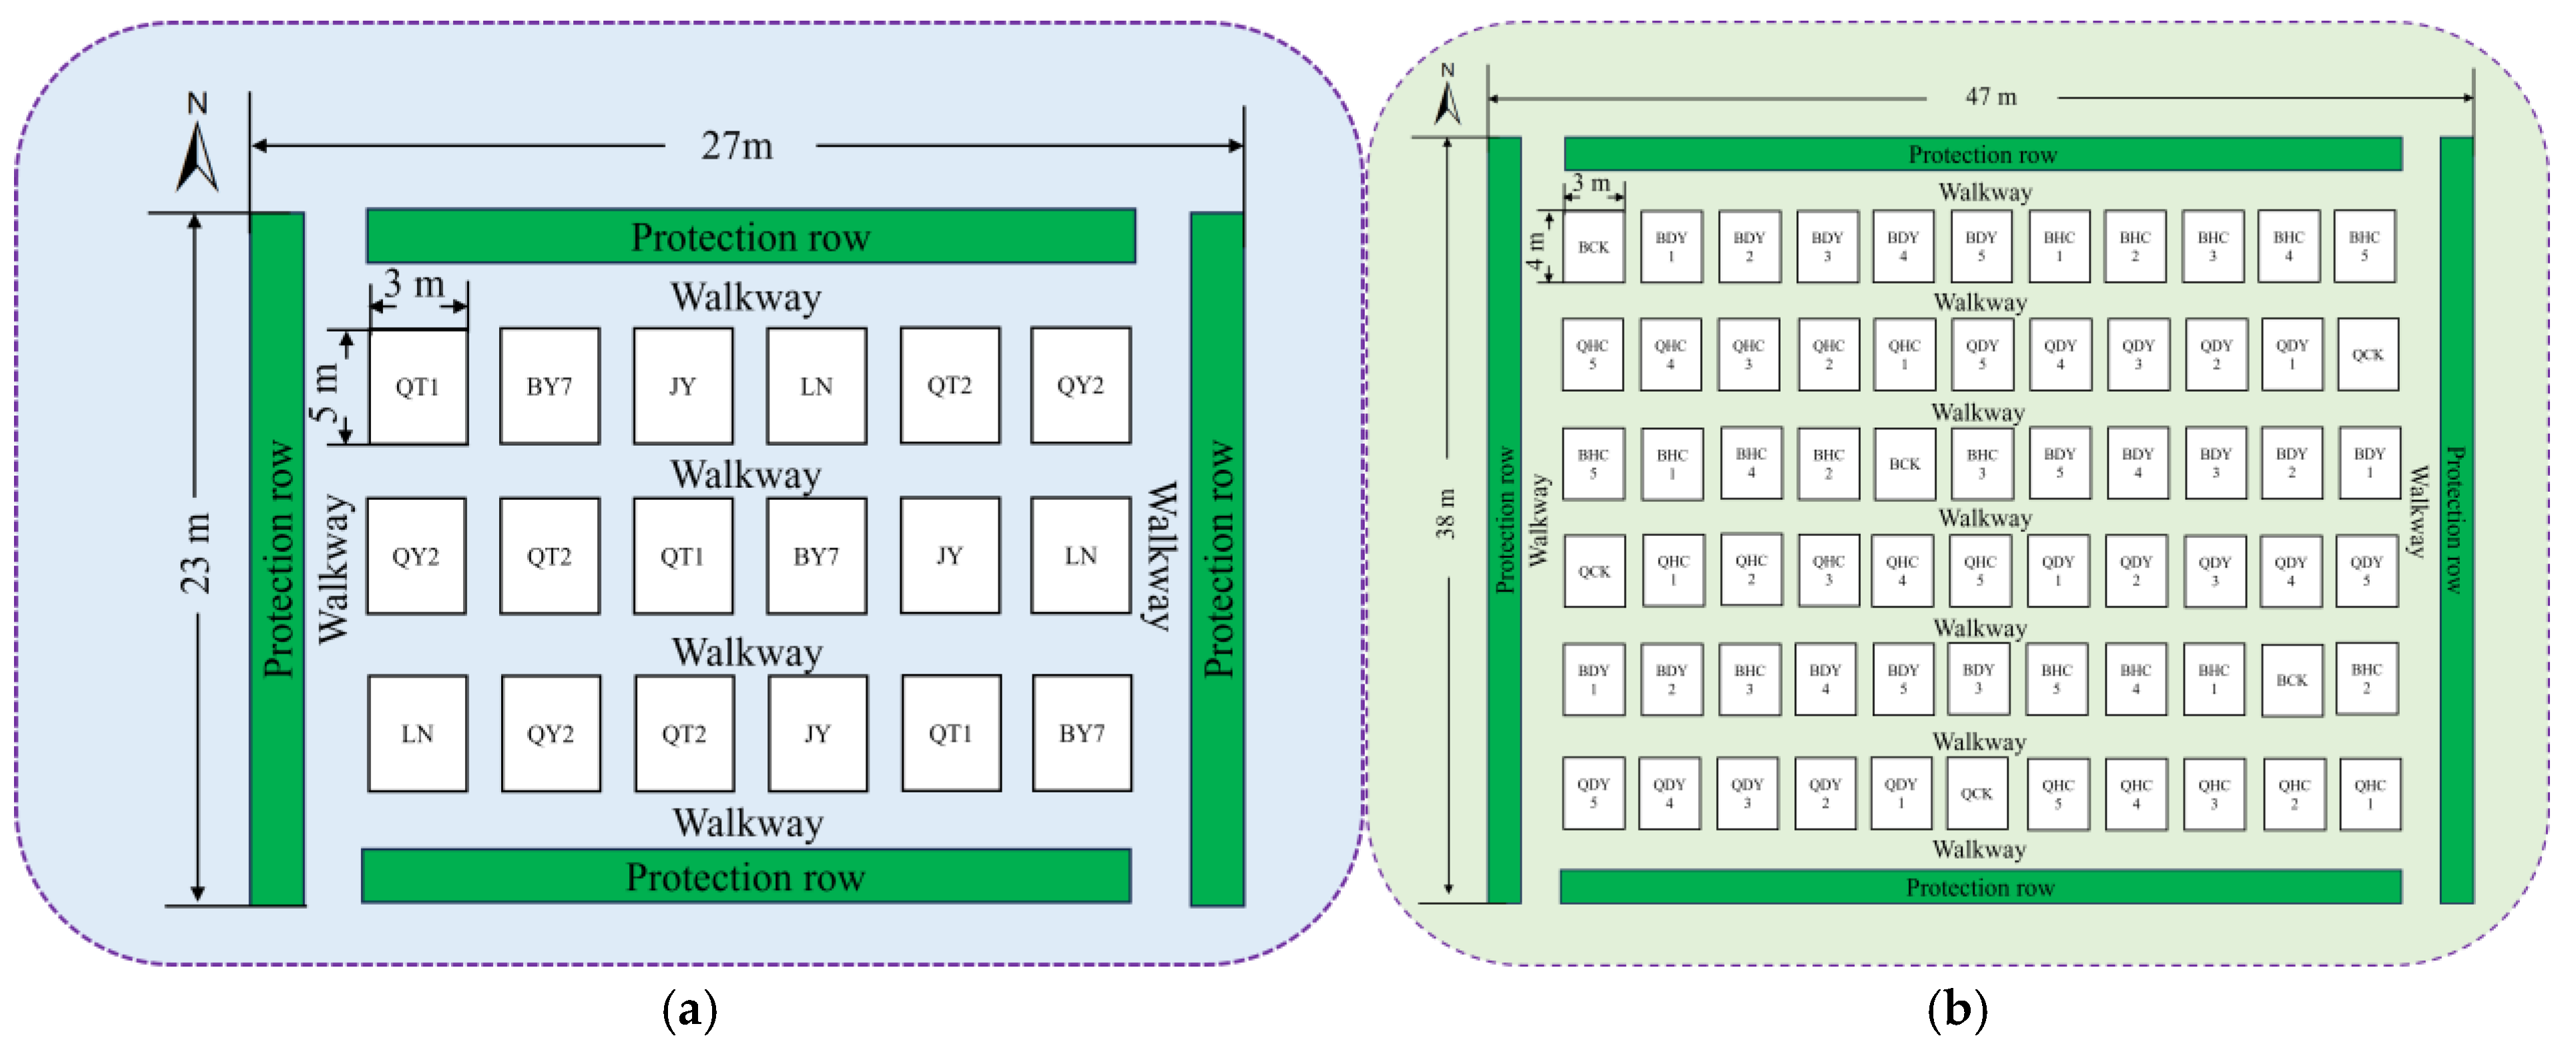
2.3. Experimental Design

2.3.1. Introduction Experiment of Oats

The experiment followed the principle of random block design, and the sowing amount of the six tested varieties was 225.0 kg·hm−2. There were three replications for each treatment, and the experiment consisted of 18 plots, each with an area of 15.0 m2 (3.0 m × 5.0 m), with a sowing rate of 337.5 g and a spacing of 1.0 m. The schematic diagram of the experimental plots is shown in Figure 1a. Sowing was performed by manual furrowing and strip sowing with a row spacing of 20.0 cm and a sowing depth of 3.0 to 4.0 cm, and compression was applied after sowing. Diammonium phosphate was applied as seed fertilizer, the application amount was 100 kg·hm−2, and the fertilizer and soil were evenly mixed before sowing. In order to protect the growth of the crops, fences were set up for the enclosure, and irrigation and other agronomic measures were not carried out.

2.3.2. Screening Test of Combined Application of Microbial Fertilizer and Organic Fertilizer

The experimental plots followed the principle of randomized block group design, with five different application rates of Bacillus licheniformis fertilizer treatments and five different application rates of Trichoderma harzianum fertilizer treatments set in the experimental site of the oat cultivar ‘Bai Yan No. 7’; the same fertilizer treatment was applied to ‘Qing Yin No. 2’. There were a total of 20 fertilizer treatments and 2 control treatments (BCK, QCK), for a total of 22 treatments; the fertilizer application rate for each treatment is shown in Table 2. There are 66 plots with 3 replicates per treatment, with a plot area of 12.0 m2 (3.0 m × 4.0 m), a plot seeding amount of 270.0 g, and a plot spacing of 1.0 m. See Figure 1b for the schematic diagram of the experimental plot. Sowing was performed by manual furrowing and strip sowing with a row spacing of 20.0 cm and a sowing depth of 3.0 to 4.0 cm, and compression was applied after sowing. The bottom fertilizer was cattle and sheep manure at a rate of 18,000 kg·hm−2, which was mixed with different application rates of microbial fertilizers and tilled into the soil. Irrigation and other agronomic measures are not carried out in the experimental site.

2.4. Sample Collection and Determination

2.4.1. Introduction Experiment of Oats

Plant height: The plant height of oat was measured with a tape measure. A total of 10 oat plants without disease were measured in each plot, and the average value was taken. Hay yield: Excluding the marginal range of 1 m in each plot, select five uniform 1 m sample sections, mow them flush with the ground, and weigh the fresh weight of forage grass. Bring the collected fresh grass samples back to the laboratory, deactivate them at 105 °C for 30 min, then dry them at 75 °C to constant weight, and weigh the dry weight of the forage grass. Nutritional determinations: crude protein (CP) content was determined by the Kjeldahl method; crude fat (EE) content was determined by the Soxhlet extraction method; soluble sugars (SS) and lignin (L) were determined by the near infrared method. Photosynthetic characteristics: A sunny and windless day was chosen to measure the photosynthetic characteristics, such as net photosynthetic rate (Pn), transpiration rate (Tr), leaf stomatal conductance (Gs), intercellular CO2 concentration (Ci), and water utilization (WUE), of the flag leaves of the sample plants using the Li-COR 6400 portable photosynthesizer.

2.4.2. Experiment on Combined Application of Microbial Fertilizer and Organic Fertilizer

Agronomic traits: A total of 10 disease-free oat plants were randomly selected from each plot to determine the conventional agronomic traits of the oats. Measure the oat plant height with a tape measure; measure the flag leaf area with a hand-held leaf area measuring instrument; measure the flag leaf length and width with a ruler; and measure the diameter of the oat stem base with a vernier caliper. A total of 10 oat plants were randomly dug in each plot, and their roots were washed clean. The total length of the roots was measured by EPSON Perfection V850 Pro root scanner.
Photosynthetic characteristics: The SPAD value of the flag leaf was measured by hand-held SPAD-502Plus chlorophyll meter. The flag leaf was measured three times at the tip, middle, and base of the leaf, and the average value was taken. The photosynthetic characteristics of the flag leaves Pn, Tr, Gs, and Ci were measured by Li-COR6400 portable photosynthetic analyzer.
Production performance: Excluding the marginal 1 m range in each plot, five uniform 1 m sample sections were selected, mowed on the ground, and the fresh weight of the forage was weighed. Bring the collected fresh grass samples back to the laboratory, deactivate them at 105 °C for 30 min, then dry them at 75 °C to constant weight, and weigh the dry weight of the forage grass.
Nutrition determination: CP content was determined by the Kjeldahl method, and the content of EE was determined by Soxhlet extraction. Soluble sugar was determined by near infrared method, while the contents of the neutral detergent fiber (NDF) and the acid detergent fiber (ADF) were determined by Fahrenheit’s washing-up of fibers method. The following calculation formulas were used to determine the total digestible nutrients (TDN), the relative feeding value (RFV), the relative forage quality (RFQ), the dry matter digestibility (DDM), and the dry matter intake (DMI).
The total digestible nutrients (TDN) calculation formula is as follows:
TDN = 82.38 ( 0.7515 × A D F )
The relative feeding value settlement (RFV) calculation formula is as follows:
RFV = D M I × D D M 1.29
The relative forage quality settlement (RFQ) calculation formula is as follows:
RFQ = T D N × D M I 1.23
The dry matter intake rate (DMI) calculation formula is as follows:
DMI = 120 N D F
The dry matter digestibility (DDM) calculation formula is as follows:
DDM = 88.90 ( 0.779 × A D F )
Soil quality: Five sampling points were set in the quadrat along the diagonal and central points. Five drills of soil in 0~20 cm soil layer [topsoil layer (layer A, cultivated layer of arable land with an average thickness of 19.5 cm)] were drilled with a soil drill with a diameter of 5 cm, which were evenly mixed into one soil sample. Gravel, litter, and plant residues were picked out and passed through a 2 mm sieve. With reference to Soil Agrochemical Analysis (3rd edition), soil organic carbon (SOC), total nitrogen (TN), total phosphorus (TP), total potassium (TK), alkaline dissolved nitrogen (AN), effective phosphorus (AP), quick-acting potassium (AK), and pH were measured, and soil enzyme activity was measured using the colorimetric method with p-nitrophenol substrate [14].

2.5. Data Analysis

GraphPad Prism 9.0 was used for data processing and graphing, and SPSS 25.0 was used for ANOVA. Based on the exact membership function method, principal component analysis was first performed to screen out the indicators that significantly affect the production performance, and the value of the affiliation function of each indicator was calculated. For the indicators positively related to the production performance, the calculation formula is as follows:
μ ( ij ) = X i j X j m i n X j m a x X j m i n
For indicators negatively related to the production performance, the calculation formula is as follows:
μ ( ij ) = 1 X i j X j m i n X j m a x X j m i n
In the above formula, Xij represents the measurement result of the i-th treatment item of the j index, Xjmax represents the maximum value among the measurement results of the item j index of all treatments, Xjmin represents its minimum value, and μ(Xij) represents the membership function value of the i-th processing of the j-th index. Accumulate the membership function values of each index and find the average membership function value. The greater the mean value, the more significant the effect of the yield increase of this fertilization treatment.

3. Results

3.1. Introduction Experiment of Oat Varieties

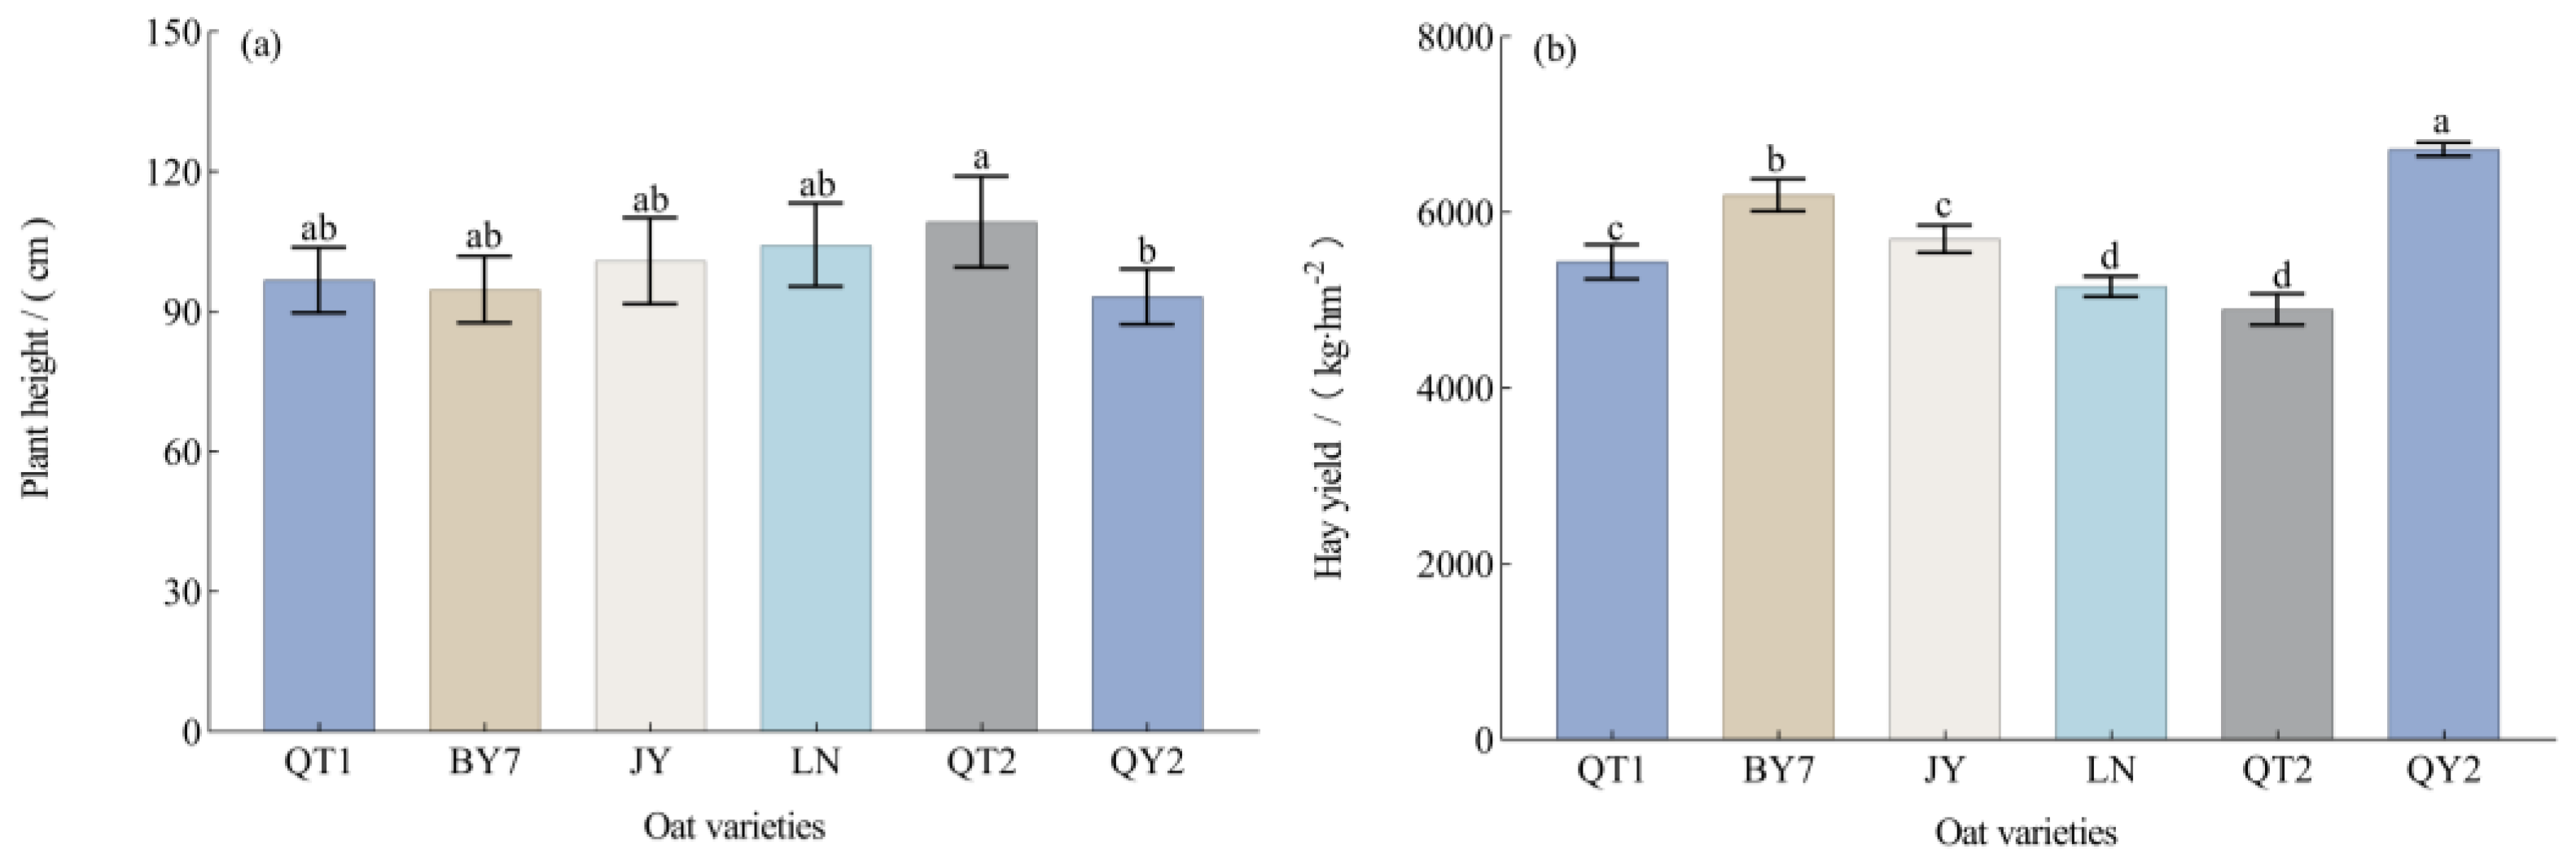
3.1.1. Plant Height and Yield

As can be seen from Figure 2a, the plant height of the six oat varieties tested ranged from 93.28 cm to 109.33 cm, among which QT2 was the highest and QY2 was the shortest, with a significant difference (p < 0.05). It can be seen from Figure 2b that the hay yield of the six oat varieties tested reached the maximum at QY2, which was 6720 kg·hm−2, which was significantly higher than other tested varieties (p < 0.05).

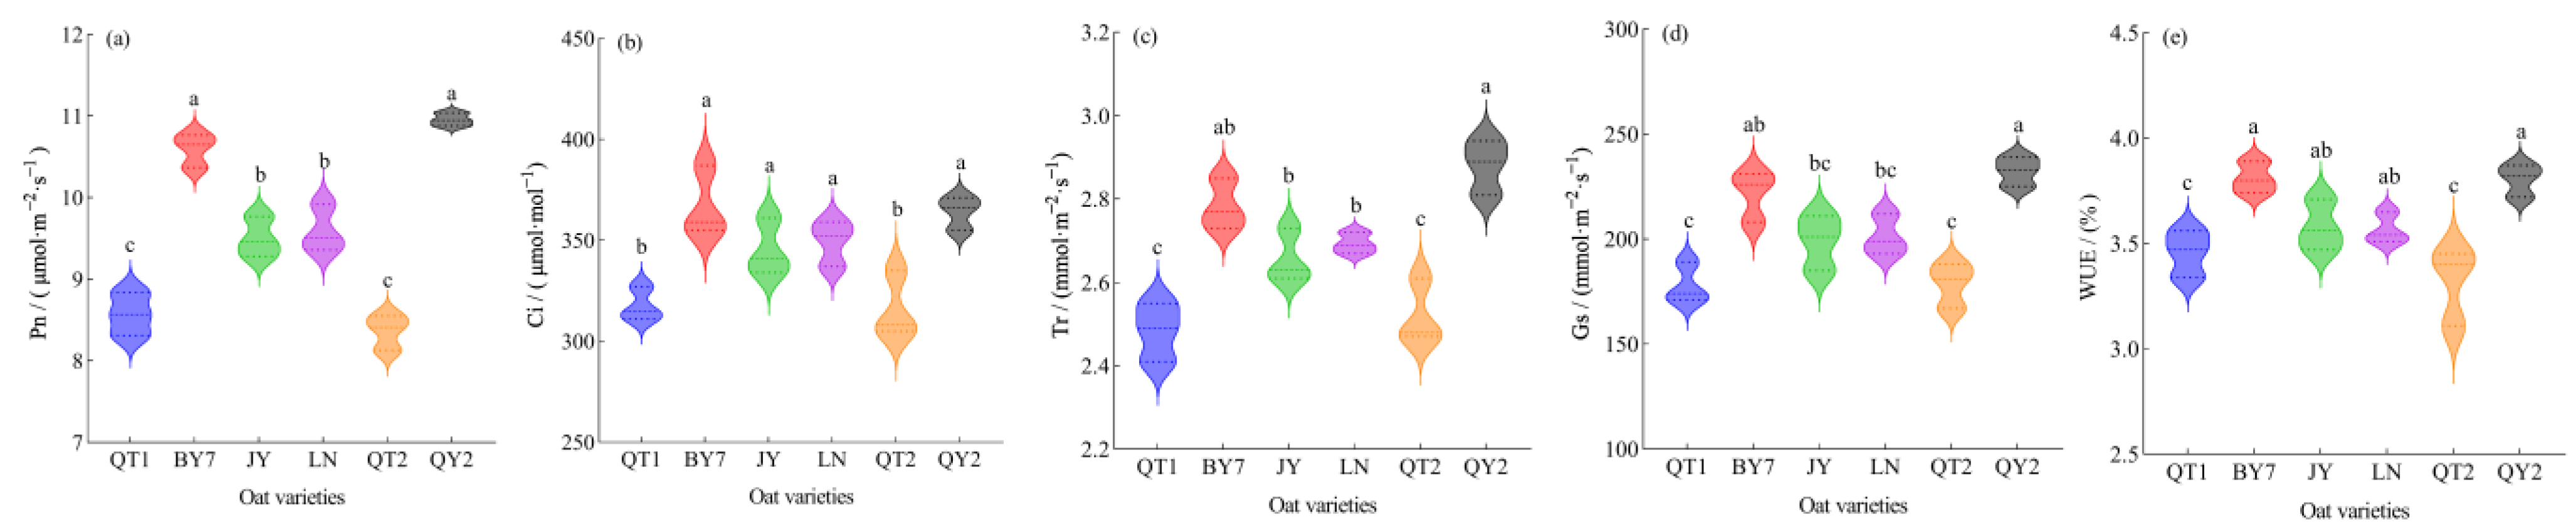
3.1.2. Photosynthetic Characteristics

As can be seen from Figure 3, most of the flag leaf photosynthetic characteristics of the oats introduced at high altitude differed significantly among the oat varieties. The Pn of the six participating oat varieties varied between 8.36 and 10.96 μmol·m−2·s−1; QY2 had the highest levels, followed by BY7. There was no significant difference between them, but they were significantly higher than the other oat varieties (p < 0.05). The Ci and WUE of BY7 were the highest; there was no significant difference between BY7 and JY, and LN and QY2, but they were significantly higher than the other oat varieties (p < 0.05). The Tr ranged from 2.48 to 2.88 mmol·m−2·s−1, and the Gs ranged from 178.00 to 232.33 mmol·m−2·s−1 for the six participating oat varieties. Both were highest in QY2 and lowest in QT1, with significant differences (p < 0.05). The WUE of the six participating oat varieties reached more than 3.00%, with BY7 and QY7 being the largest at 3.81%, which was significantly higher (p < 0.05) than QT1 and QT2.

3.1.3. Nutritional Quality

It can be seen from Table 3 that, among the six oat varieties tested, QY2 has the highest CP content, which is 14.59%, which is significantly higher than the other oat varieties. The EE reached the maximum value in BY7, and the minimum value of QT2, with significant difference (p < 0.05). Among the six oat varieties tested, the SS content of BY7, JY, LN, and QY2 reached more than 10%. There were significant differences in the SS content among each variety (p < 0.05). Lignin (L) varied from 5.91% to 7.83%, among which, for QT2 content was the lowest, and for LN content was the highest; there was a significant difference between them.

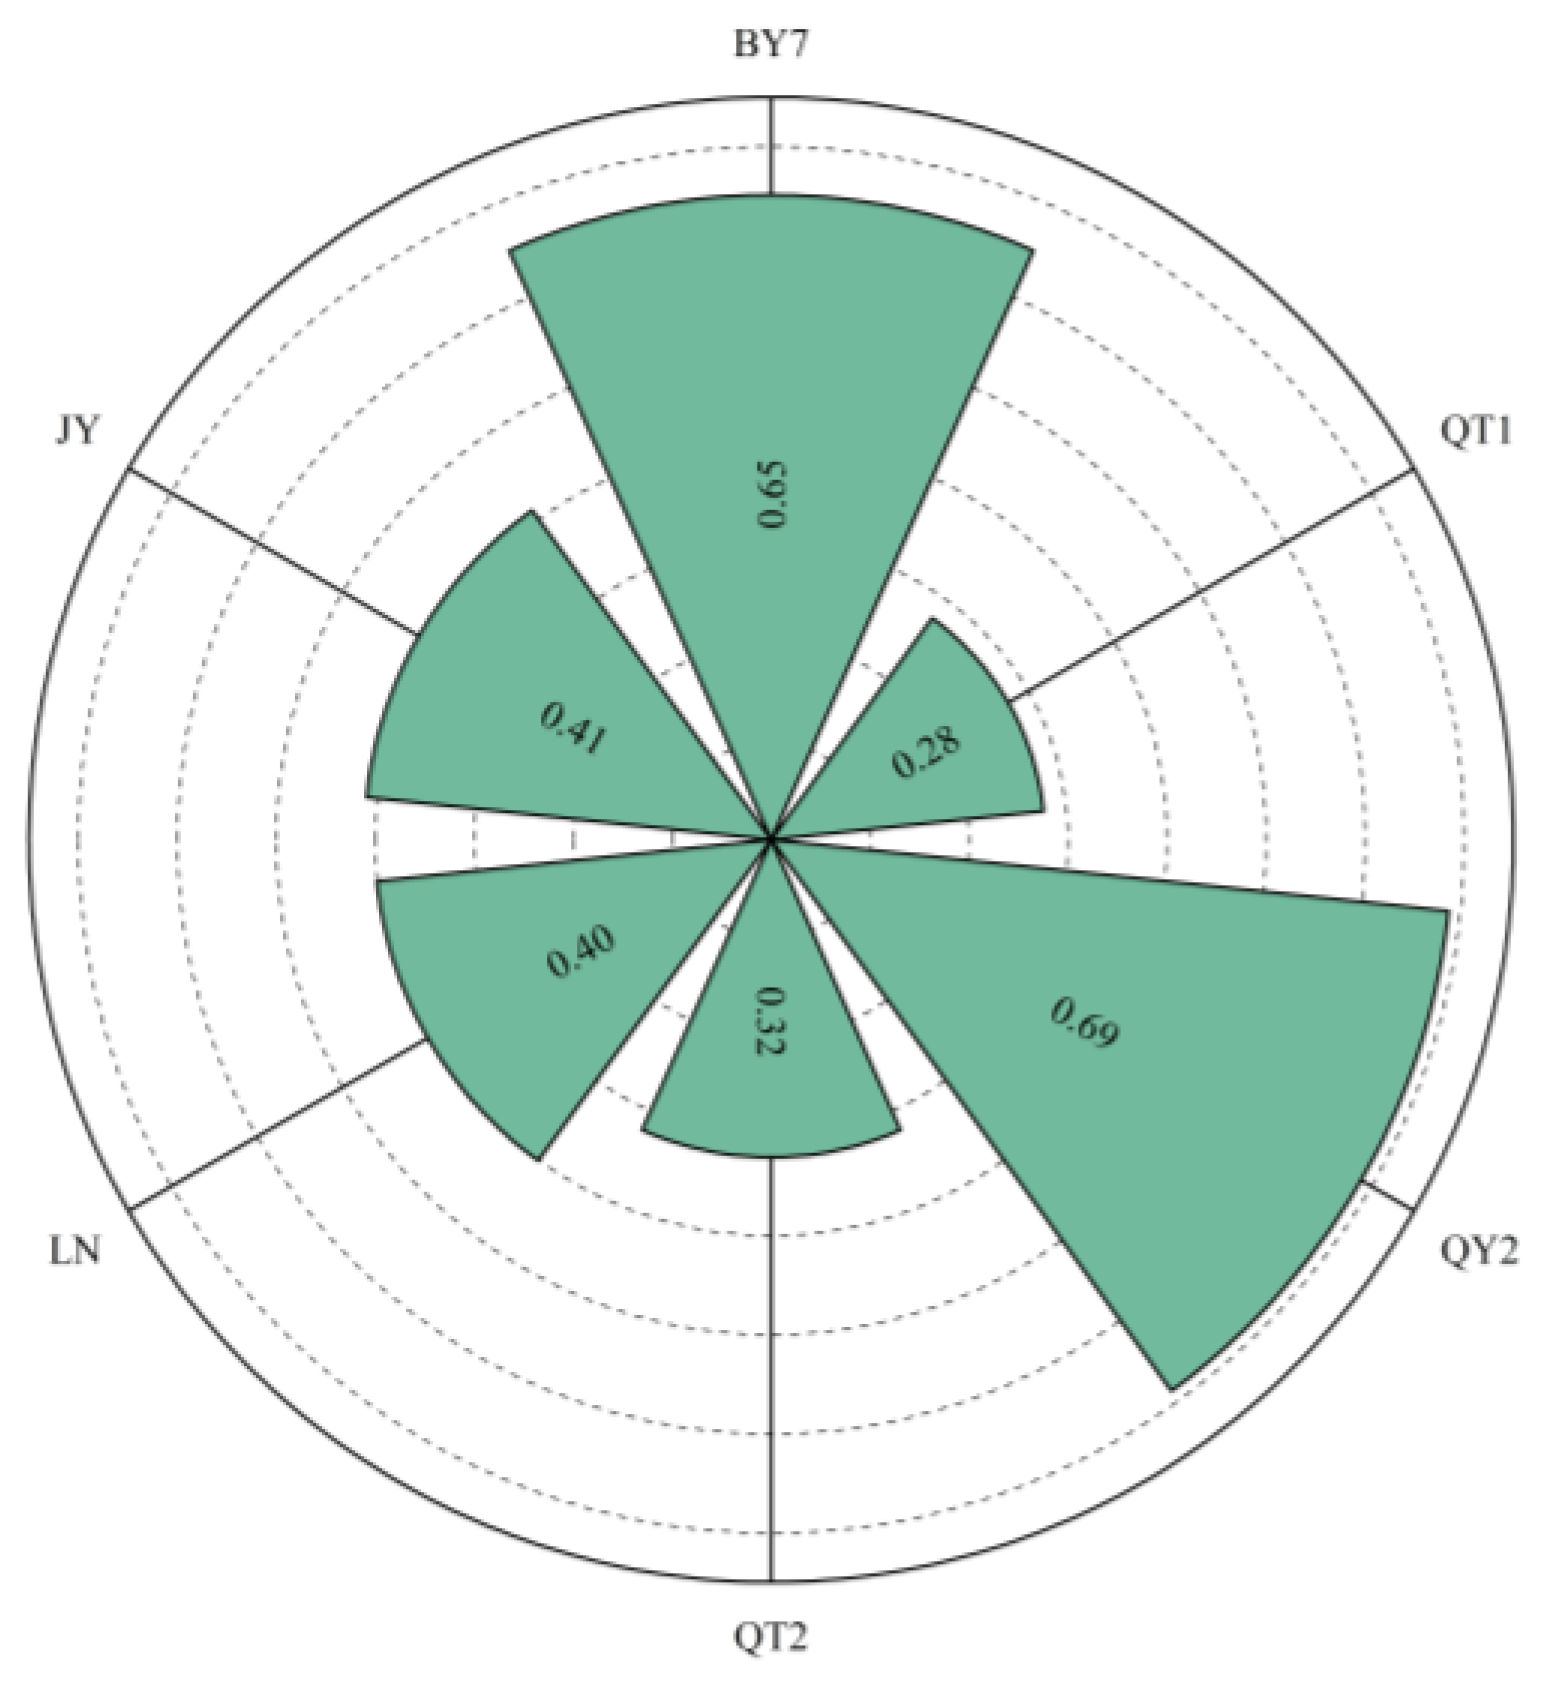
3.1.4. Principal Component Analysis and Comprehensive Evaluation of Membership Function

The eigenvalues and contribution rates of principal component analysis are the basis for selecting principal components. Eleven indexes related to oat growth and development are transformed into three principal components, and the eigenvalues and contribution rates of each principal component are shown in Table 4. The contribution rate of the first principal component is 68.95%, the second principal component is 10.59%, and the third principal component is 5.98%, which can be explained as a total variation of 85.52%. The characteristic value of the first principal component is 7.58, and the absolute values for hay yield, CP, EE, SS, L, Pn, Ci, Tr, Gs, and WUE are higher, all of them exceed 0.65, and they have a high load. The eigenvalue of the second principal component is 1.17, and only the absolute value of plant height is 0.72, which has a high load. The eigenvalue of the third principal component is only 5.98, and the absolute values for each index are low.
The membership function method was used to comprehensively evaluate the six oat varieties tested (Figure 4). The results showed that the productivity of the six oat varieties from strong to weak was QY2 > BY7 > JY > LN > QT2 > QT1. Oat varieties ‘Qing Yin No. 2’ and ‘Bai Yan No. 7’ were introduced in high altitude areas with high yield, good quality, and the best production performance, followed by ‘Jia Yan’ and ‘Lin Na’; ‘Qing Tian No. 2’ and ‘Qing Tian No. 1’ were the worst.

3.2. Experiment on Combined Application of Microbial Fertilizer and Organic Fertilizer

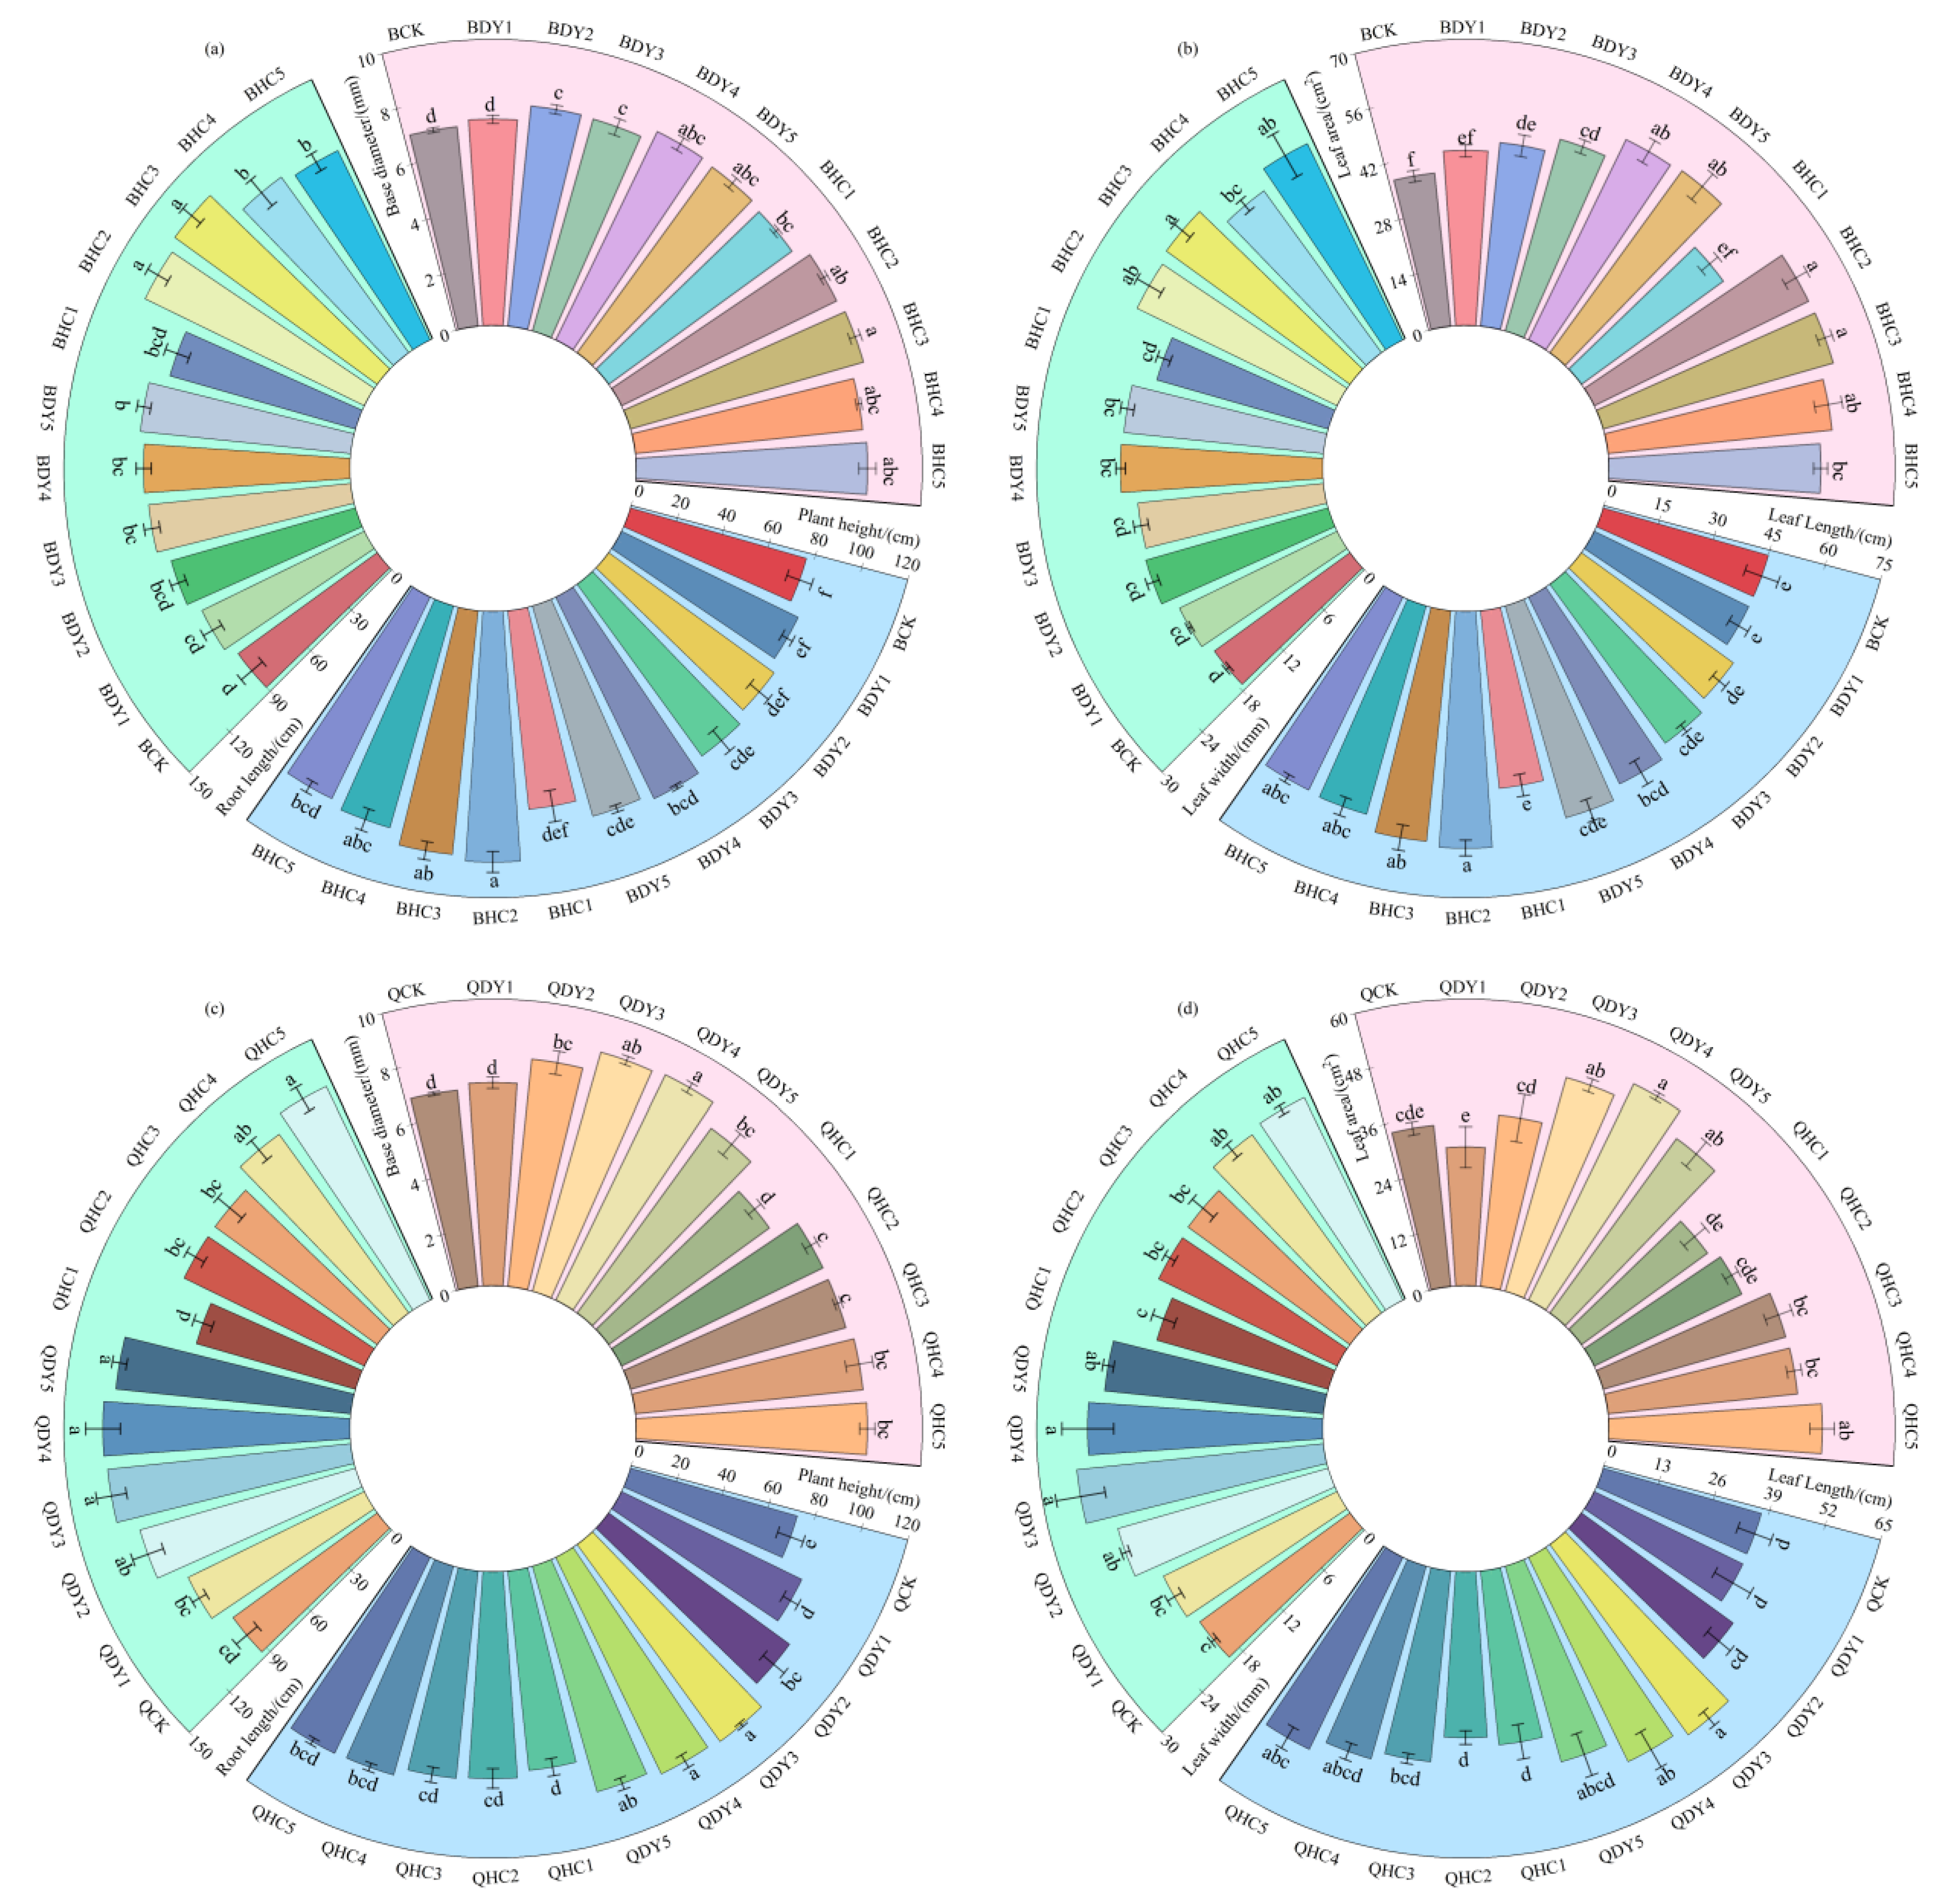
3.2.1. Phenotypic Traits

It can be seen from Figure 5a that the diameter of the stem base of ‘Bai Yan No. 7’ in 10 microbial fertilizer addition treatments is between 7.20 and 8.46 mm. Except for the BDY1 treatment, the other nine microbial fertilizer addition treatments are significantly higher than the BCK treatment. The plant height of ‘Bai Yan No. 7’ with 10 microbial fertilizers varied from 82.33~105.00 cm, and the highest plant height was 105.00 cm in the BHC2 treatment, which was 36.95% higher than the BCK treatment, with significant difference (p < 0.05). The root length of ‘Bai Yan No. 7’ reached the maximum in the BHC3 treatment, while the BCK treatment was the smallest, with significant difference (p < 0.05). It can be seen from Figure 5b that the leaf area and width of ‘Bai Yan No. 7’ treated by BHC3 are the highest among the 10 microbial fertilizer addition treatments, which are 58.47 cm2 and 23.77 cm, respectively, which are significantly higher than the BCK treatment (p < 0.05). Among the 10 microbial fertilizer treatments, the leaf length of the BHC2 treatment was the largest, at 61.97 cm, which was significantly increased by 37.71% compared with the BCK treatment (p < 0.05).
It can be seen from Figure 5c that the stem base diameter and root length of ‘Qing Yin No. 2’ with 10 microbial fertilizers were the highest in the QDY4 treatment, followed by the QDY3 treatment, and there was no significant difference between them, but they were significantly higher than those in the QCK treatment (p < 0.05). With the addition of 10 microbial fertilizers, the plant height of ‘Qing Yin No. 2’ reached the maximum value of 102.00 cm under the QDY3 treatment, which was significantly increased by 40.36% compared with the QCK treatment (p < 0.05). According to Figure 5d, the leaf area of ‘Qing Yin No. 2’ treated with 10 microbial fertilizers reached the maximum value of 50.33 cm2 under the QDY4 treatment, which was significantly increased by 48.47% compared with the QCK treatment (p < 0.05). Among the 10 microbial fertilizer addition treatments, the leaf length and width of the QDY3 treatment for ‘Qing Yin No. 2’ were the highest, they were significantly higher than the QCK treatment, with increases of 43.05% and 33.59%, respectively.

3.2.2. Photosynthetic Characteristics

From Table 5, after 10 microbial fertilizers were added, the SPAD value of ‘Bai Yan No. 7’ reached the maximum value of 59.80 under the BDY4 treatment, which was 42.96% higher than that under the BCK treatment (p < 0.05). The Pn and Tr of ‘Bai Yan No. 7’ treated with BHC3 were the highest, which were 14.27 μmol·m−2·s−1 and 3.54 mmol·m−2·s−1, respectively, which were significantly higher than those treated with BCK, with increases of 40.31% and 33.58%. The Ci of ‘Bai Yan No. 7’ ranged from 372.33 to 428.00 μmol·mol-1, and the Ci for the BDY5 treatment was the highest, 19.00% higher than the BCK treatment (p < 0.05). The Gs of ‘Bai Yan No. 7’ was approximately between 234.33 and 330.00 mmol·m−2·s−1, which was significantly higher than the BCK treatment, and the increment was between 9.84% and 54.84% (p < 0.05).
From Table 6, after 10 microbial fertilizers were added, the SPAD value of ‘Qing Yin No. 2’ reached the maximum value of 64.85 under the QDY3 treatment, which was significantly increased by 40.83% compared with the QCK treatment (p < 0.05). The Pn of ‘Qing Yin No. 2’ reached the maximum for the QDY4 treatment, reaching 14.91 μmol·m−2·s−1, significantly higher than the other treatments, the difference is significant (p < 0.05). The Ci was the highest for the QDY3 treatment, at 458.67 μmol·mol−1, which was significantly increased by 24.87% compared with the QCK treatment (p < 0.05). The Tr was higher for the QHC5 treatment, followed by the QDY3 treatment. There was no significant difference between the two treatments, but they were significantly higher than the QCK treatment (p < 0.05). The Gs for the QHC3 treatment was higher, at 376.00 mmol·m−2·s−1, which was significantly higher than that of the QCK treatment (p < 0.05), with an increase of 63.00%.

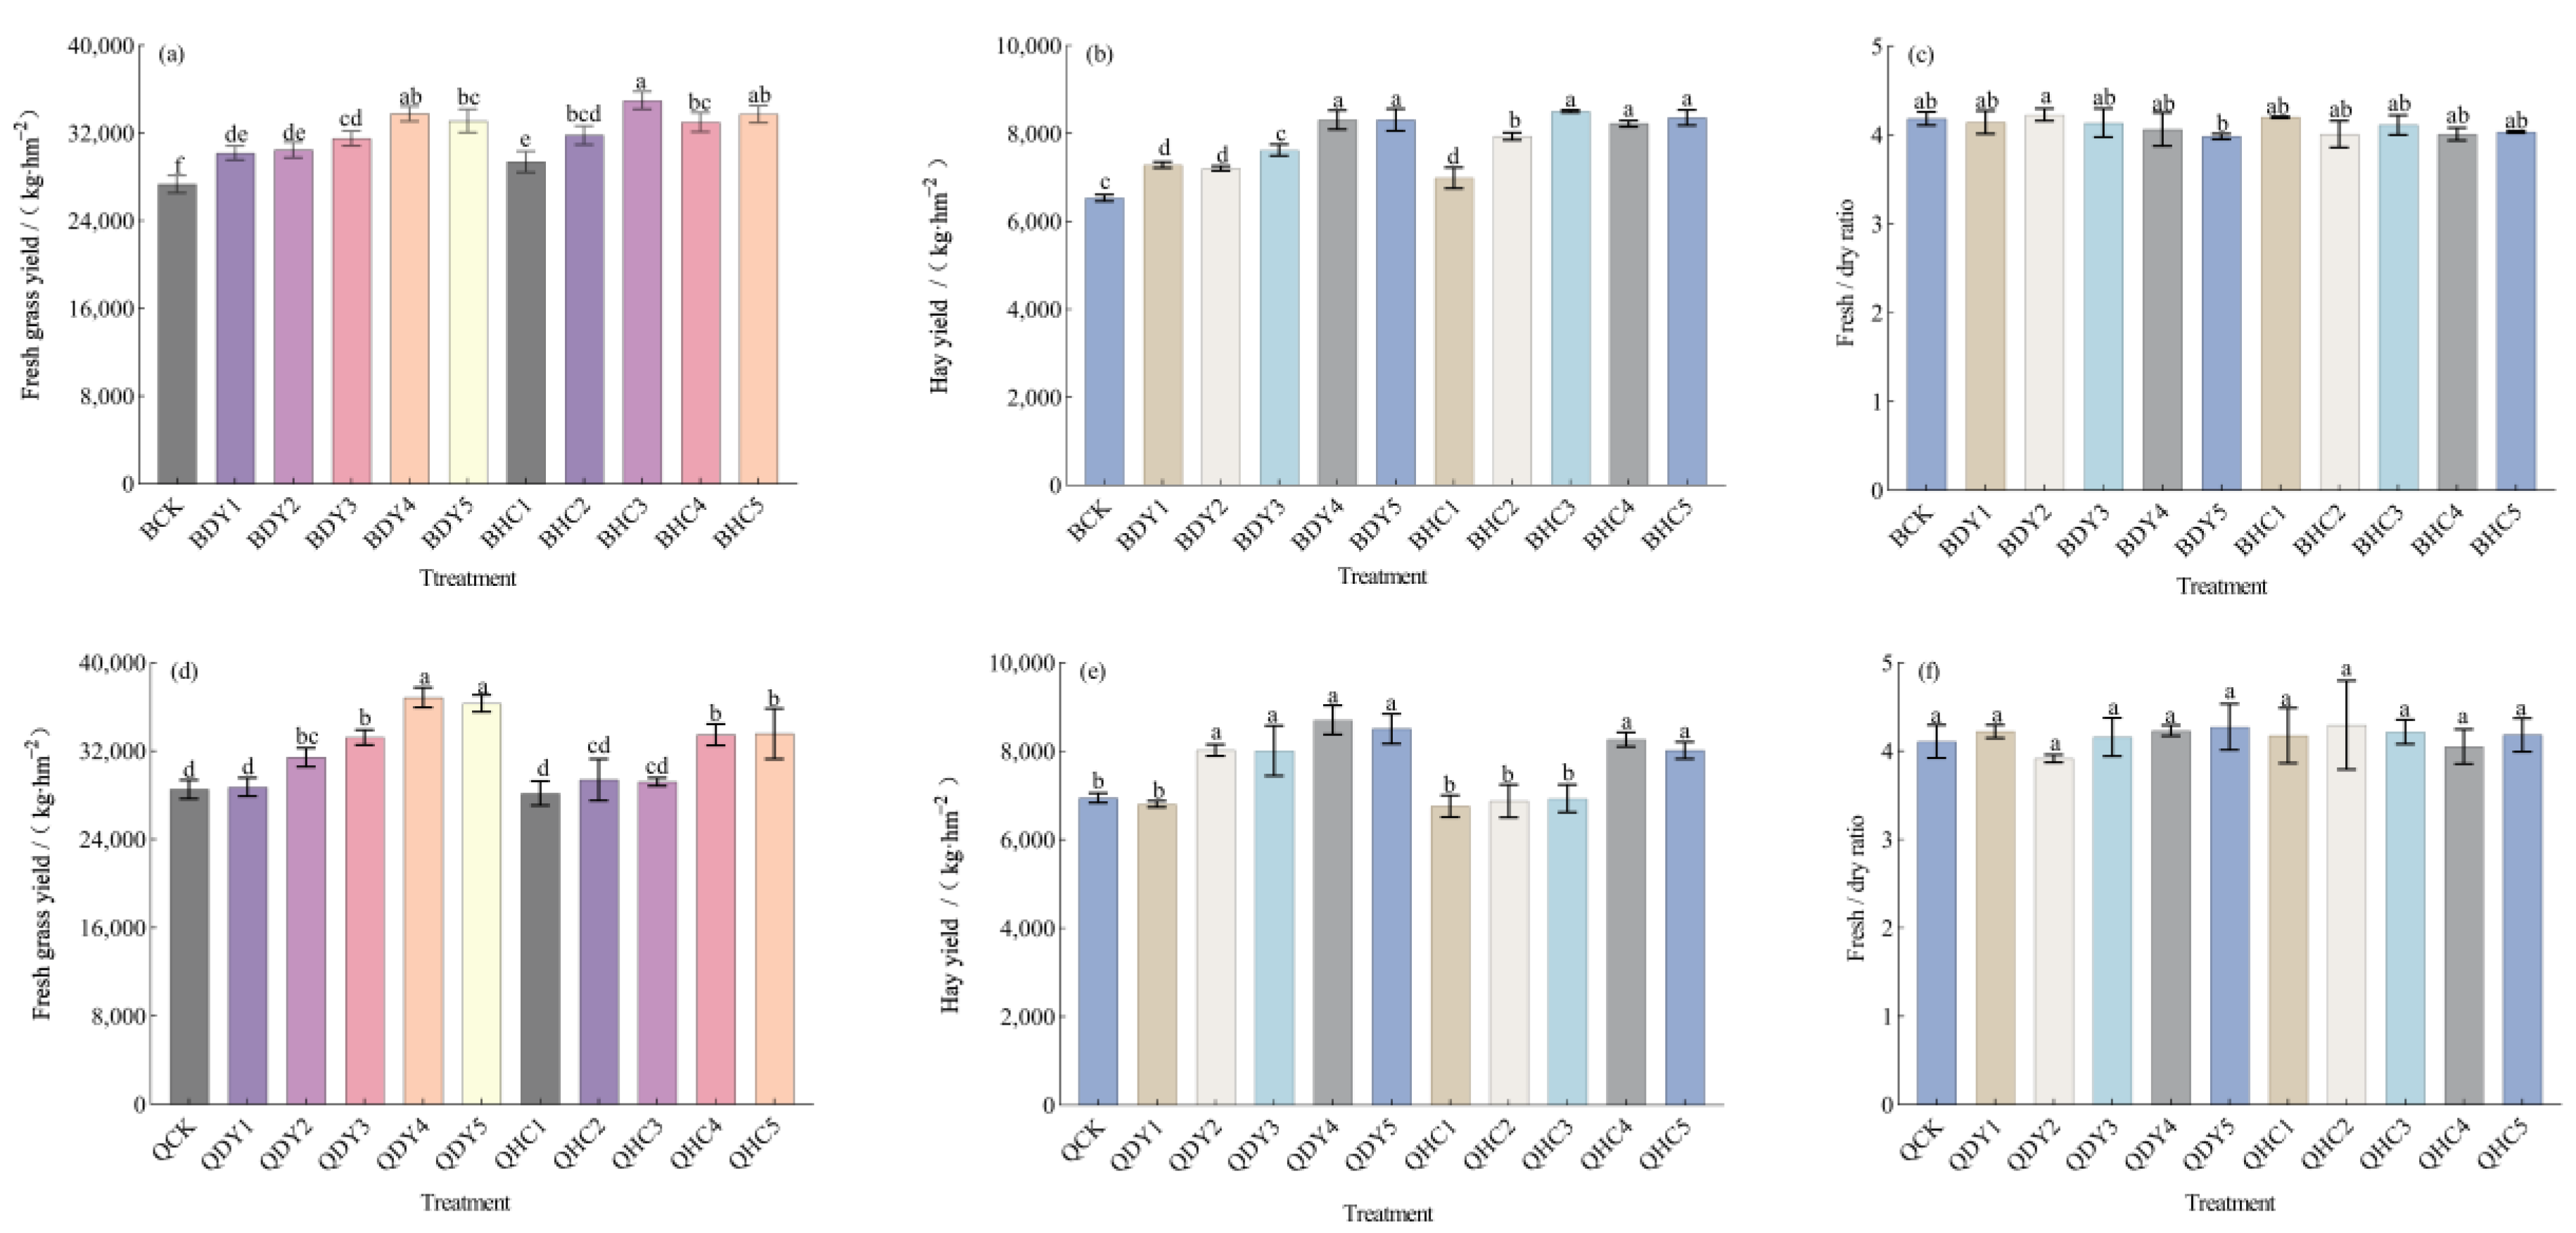
3.2.3. Production Performance

It can be seen from Figure 6a–c that the combined application of microbial fertilizer and organic fertilizer can improve the fresh grass yield and hay yield of ‘Bai Yan No. 7’, but it has no significant effect on the fresh–dry ratio. Fresh grass yield of ‘Bai Yan No. 7’ for the BHC3 treatment was as high as 34,999.33 kg·hm−2, which was significantly increased by 87.95% compared with the BCK treatment (p < 0.05) (Figure 6a). Hay yield of ‘Bai Yan No. 7’ was as high as 8508.00 kg·hm−2 under the BHC3 treatment, which was 30.17% higher than under the BCK treatment, with significant difference (p < 0.05) (Figure 6b). The fresh–dry ratio of the BDY5 treatment was the lowest, at only 3.98, which was 4.78% lower than the BCK treatment (p > 0.05) (Figure 6c).
It can be seen from Figure 6d–f that the combined application of microbial fertilizer and organic fertilizer can improve the fresh grass yield and hay yield of ‘Qing Yin No. 2’, but it has no significant effect on the fresh–dry ratio. After 10 microbial fertilizers were added, the fresh grass yield of ‘Qing Yin No. 2’ reached the maximum value in the QDY4 treatment, which was 36,847.33 kg·hm−2, significantly increased by 29.13% compared with the QCK treatment (p < 0.05). The oat hay yield of the QDY4 treatment was as high as 8707.67 kg·hm−2, which was significantly higher than that of the QCK treatment by 25.37% (p < 0.05) (Figure 6e). The fresh–dry ratio for the QDY2 treatment was the lowest, at 3.92, which was 4.62% lower than that of the QCK treatment (p > 0.05) (Figure 6f).

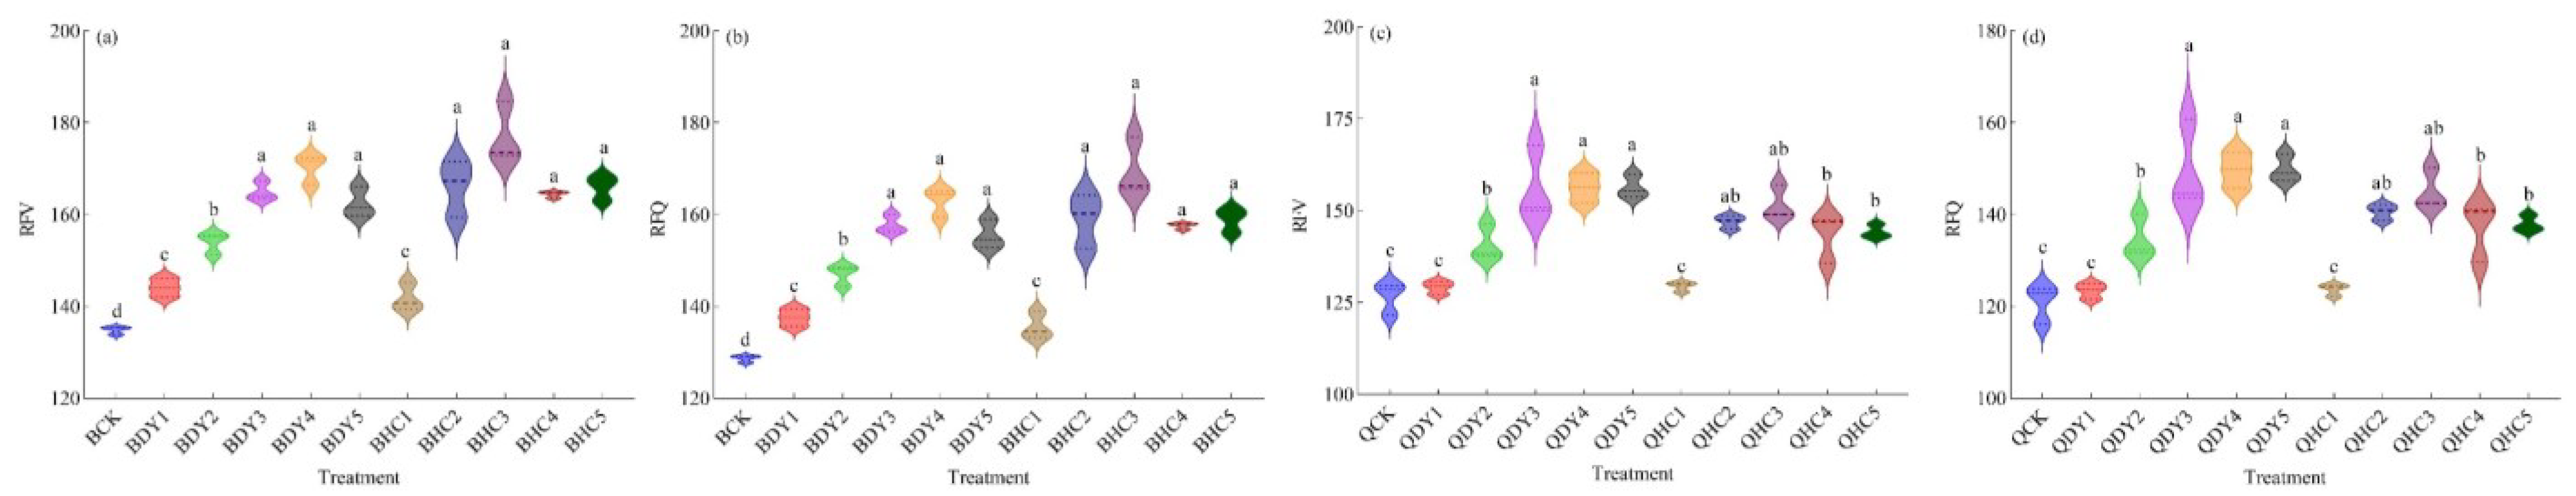
3.2.4. Nutritional Quality

It can be seen from Table 7 that the combined application of microbial fertilizer and organic fertilizer can increase the contents of the CP, EE, and SS, decrease the DF, and increase the TDN of ‘Bai Yan 7’. After 10 microbial fertilizers were added, the contents of the CP and SS of ‘Bai Yan No. 7’ were the highest for the BHC3 treatment, accounting for 11.68% and 15.48%, respectively, which was significantly higher than the BCK treatment (p < 0.05). The EE content of ‘Bai Yan No. 7’ ranged from 3.48% to 4.71%, with the highest content in the BHC5 treatment, which was 56.48% higher than the BCK treatment (p < 0.05). The contents of ADF for the BHC4 treatment were the lowest, which was 16.98% lower than the BCK treatment, with significant difference. The content of NDF for the BHC3 treatment was the lowest, which was significantly lower than the BCK treatment by 18.03% (p < 0.05). The TDN of ‘Bai Yan No. 7’ ranged from 56.43% to 58.15%, with the highest value for the BHC1 treatment, which was 4.17% higher than the BCK treatment (p < 0.05).
It can be seen from Table 8 that the combined application of microbial fertilizer and organic fertilizer can increase the contents of the CP, EE, and SS, decrease the DF, and increase the TDN of ‘Qing Yin No. 2’. After adding 10 microbial fertilizers, the contents of the CP and EE of ‘Qing Yin No. 2’ were the highest for the QDY4 treatment, which were significantly increased by 38.10% and 49.61%, respectively, compared with the QCK treatment (p < 0.05). The SS content of ‘Qing Yin No. 2’ was the highest for the QHC2 treatment, accounting for 15.35%, which was significantly higher than the QCK treatment. The content of ADF for the QDY5 treatment was the lowest, which was 28.78%, and the content of NDF for QDY3 treatment was the lowest, at 38.99%, which was significantly lower than the QCK treatment (p < 0.05). The TDN of ‘Qing Yin No. 2’ treated by QDY4 and QDY5 reached over 60%, which were 60.21% and 60.75% respectively, significantly higher than that of QCK (p < 0.05).
Figure 7a shows that the RFV of ‘Bai Yan No. 7’ was significantly improved after 10 microbial fertilizers were added. The RFV of BDY3, BDY4, BDY5, BHC2, BHC3, BHC4, and BHC5 were higher, which were 164.96, 170.21, 162.43, 166.12, 177.06, 164.45, and 166.02, respectively. There was no significant difference among the above treatments, but they were significantly higher than the BCK treatment (p < 0.05). The RFQ of ‘Bai Yan No. 7’ treated with BHC3 was the highest, at 169.62, which was 31.86% higher than that treated with BCK, with significant difference (p < 0.05) (Figure 7b). The RFV of ‘Qing Yin No. 2’ ranged from 129.14 to 156.37, and the RFV of the QDY5 treatment reached the highest value, which was 23.48% higher than the QCK treatment, with significant difference (p < 0.05) (Figure 7c). The RFQ of the QDY5 treatment for ‘Qing Yin No. 2’ was the highest, at 149.86, which was 23.87% higher than the QCK treatment, and the difference was significant (p < 0.05) (Figure 7d).

3.2.5. Soil Nutrients

It can be seen from Table 9 that the contents of SOC, AN, and AK in the forage field of ‘Bai Yan No. 7’ all reached the maximum values for the BHC3 treatment, which were 45.31 g·kg−1, 294.27 mg·kg−1, and 531.34 mg·kg−1, respectively. Compared with the BCK treatment, the BHC3 treatment significantly increased by 35.58%, 60.86%, and 31.30%, respectively (p < 0.05). The contents of TN and AP in the soil of the ‘Bai Yan No. 7’ forage field were the highest for the BHC2 treatment, and the lowest for the BCK treatment, with significant differences (p < 0.05). The contents of TP and TK in the soil were the highest for the BDY4 treatment, at 2.17 g·kg−1 and 30.05 g·kg−1, respectively, which were significantly higher than the BCK treatment (p < 0.05).
From Table 10, the content of the SOC was the highest for the QFH2 treatment, which was 39.32 g·kg−1, significantly higher than the QCK treatment (p < 0.05). The soil TN content for the QDY5 treatment was the highest, at 4.03 g·kg−1, which was significantly higher than the QCK treatment (p < 0.05). The contents of TP and AP in the soil treated by QDY4 were the highest, at 1.83 g·kg−1 and 43.37 mg·kg−1, respectively, where were significantly higher than the QCK treatment (p < 0.05). The contents of TK and AK in the soil were the highest for the QDY3 treatment and the lowest for the QCK treatment, with significant differences (p < 0.05). The content of the soil AN in the forage field ‘Qing Yin No. 2’ was the highest for the QHC4 treatment, at 244.62 mg·kg−1, which was significantly higher than the QCK treatments.

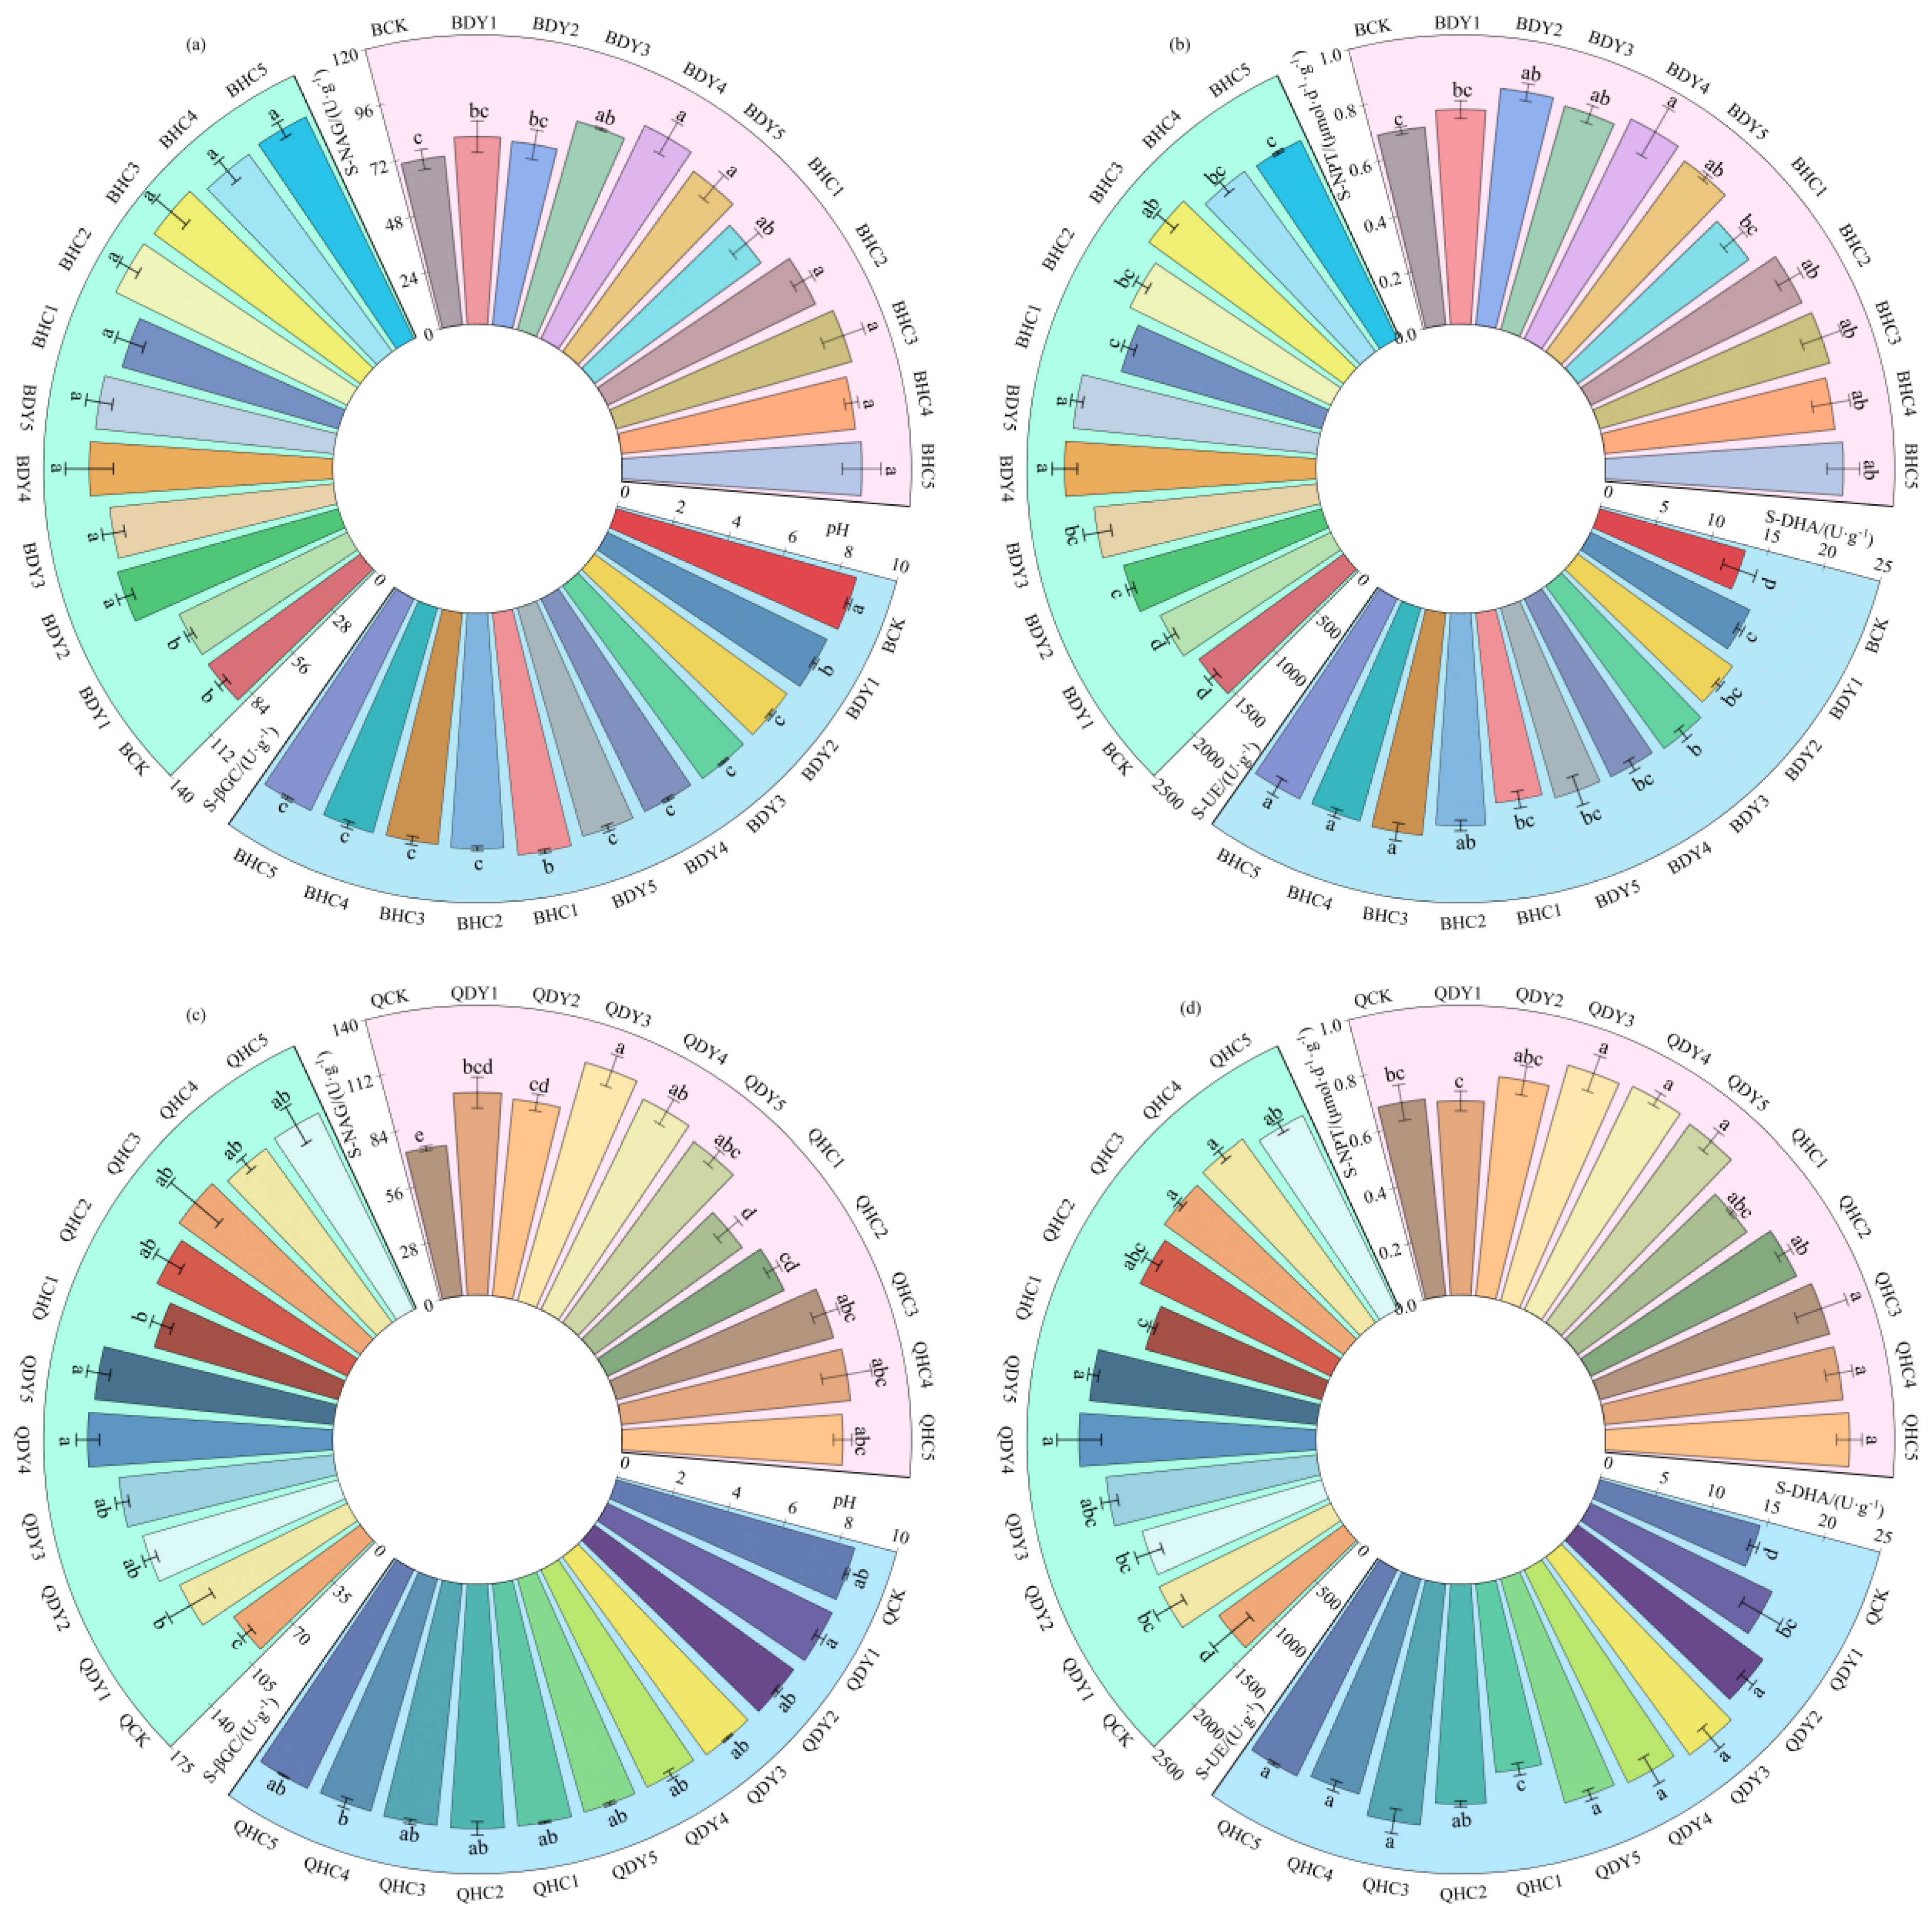
3.2.6. Soil Enzyme Activity and pH

It can be seen from Figure 8a with the addition of 10 microbial fertilizers, the soil pH of the ‘Bai Yan No. 7’ oat field was between 8.05 and 8.44, which was 2.20%~6.72% lower than the BCK treatment. The activity of soil S-βGC in ‘Bai Yan No. 7’ ranged from 90.55~124.61 U·g−1, and the activity of S-βGC for the BHC2 treatment was the highest, which was 37.01% higher than the BCK treatment, with significant difference (p < 0.05). The S-NAG in the forage field of ‘Bai Yan No. 7’ reached the maximum value of 101.39 U·g−1 for the BHC3 treatment, while the BCK treatment was the smallest, at only 70.27 U·g−1, with significant difference (p < 0.05). It can be seen from Figure 8b that the S-DHA activity of the ‘Bai Yan No. 7’ forage field for the BHC3 treatment was the highest, at 19.33 U·g−1, which was significantly increased by 47.90% compared with the BCK treatment (p < 0.05). The activities of S-UE and S-NPT in the forage field of ‘Bai Yan No. 7’ treated by BDY4 were the highest, at 2171.02 U·g−1 and 0.84 μmol·d−1·g−1, respectively, they were significantly higher than those treated by BCK; the growth rates are 40.35% and 21.74%.
It can be seen from Figure 8c that the soil pH of the ‘Qing Yin No. 2’ oat field was the smallest under the QHC4 treatment, at 8.35, which was 2.5% lower than the QCK treatment. The activity of S-βGC in the forage field of ‘Qing Yin No. 2’ treated by QDY4 was the highest, at 148.12 U·g−1, which was significantly higher than the QCK treatment, with an increase of 56.43%. The activity of S-NAG in the forage field of ‘Qing Yin No. 2’ treated by QDY3 was the highest, which was 119.61 U·g−1, with an increase of 63.58% compared with the QCK treatment. It can be seen from Figure 8d that the soil S-DHA activity of the ‘Qing Yin No. 2’ oat field reached the maximum value of 21.12 U·g−1 under the QDY3 treatment, which was significantly higher than the QCK treatment by 46.67% (p < 0.05). The activities of S-UE and S-NPT in the ‘Qing Yin No. 2’ oat field were the highest for the QDY4 treatment, followed by the QDY5 treatment. There was no significant difference between them, but they were significantly higher than the QCK treatment (p < 0.05).

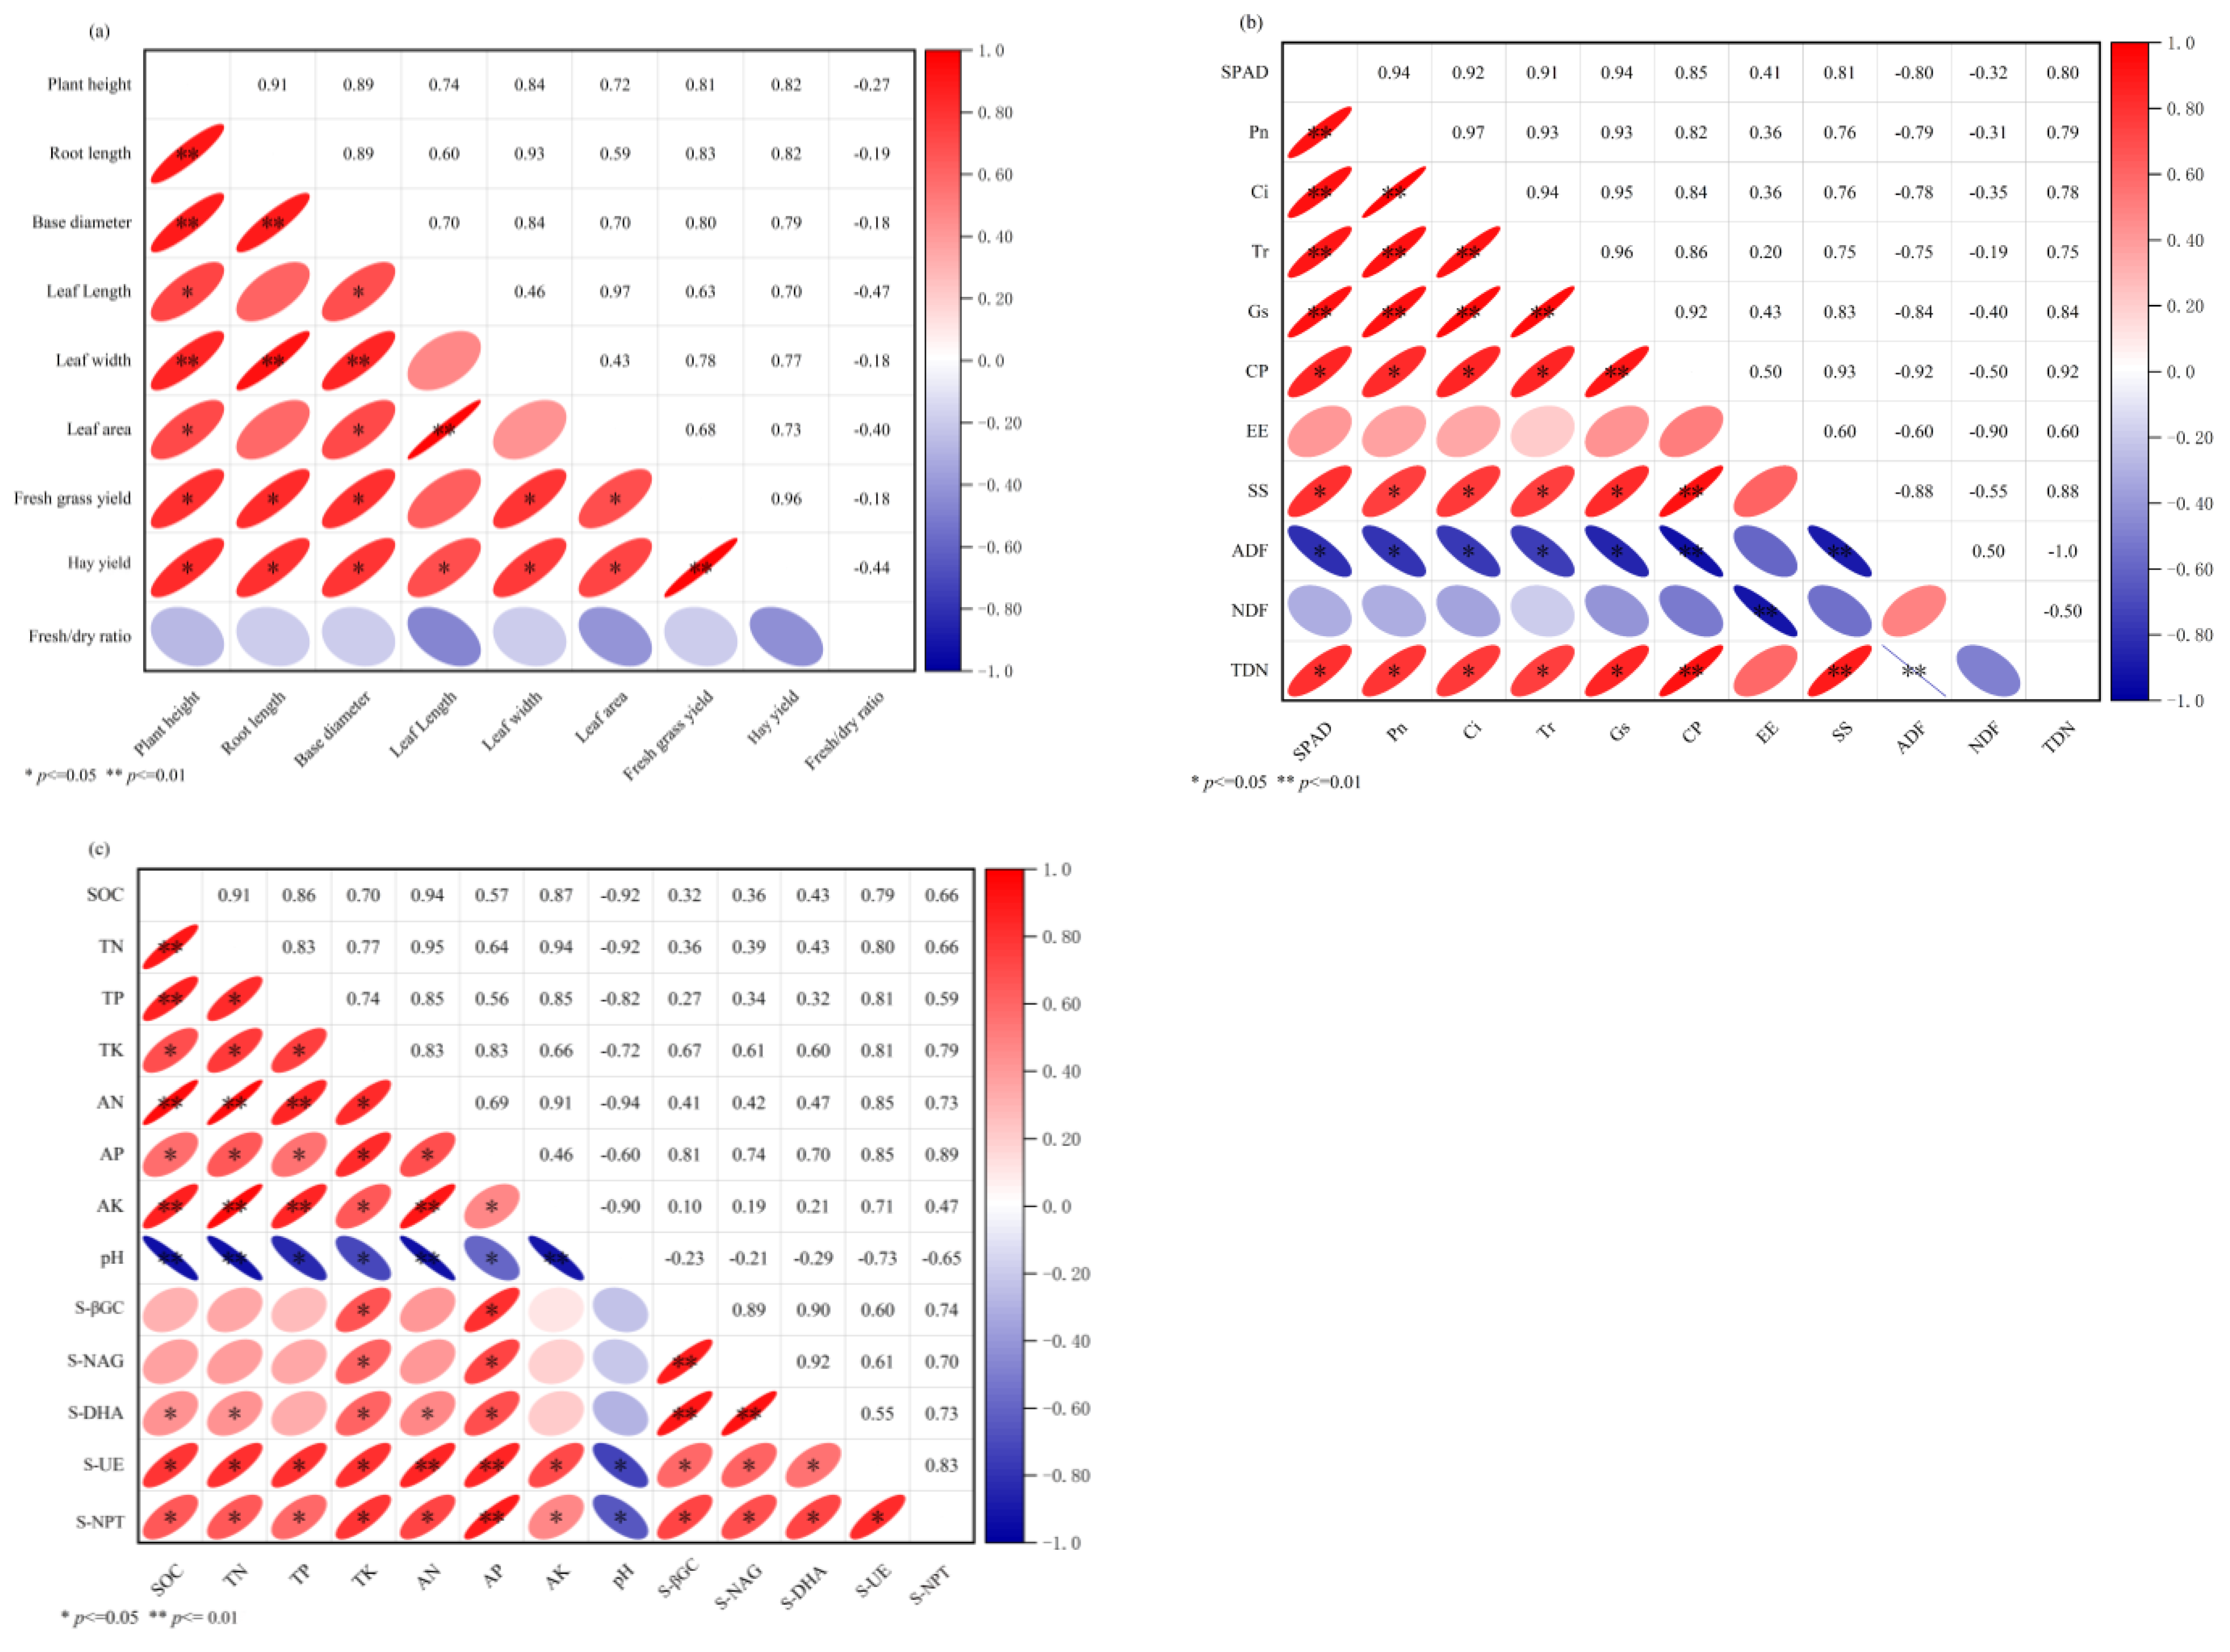
3.2.7. Correlation Analysis

As can be seen from Figure 9a, there are 23 pairs of significant or very significant correlations between nine agronomic traits and production performance related indicators when microbial fertilizer and organic fertilizer are applied together, all of which are positive correlations. There is a negative correlation between the fresh and dry ratio and other indicators, but they have not reached a significant level. All the other indicators are positively correlated. Among them, plant height is related to root length, stem base diameter, and leaf width; root length is related to stem base diameter and leaf width; stem base diameter is related to leaf width; leaf length is related to leaf area; the yield of fresh grass is related to hay. The above reached a very significant level.
As can be seen from Figure 9b, there are 37 pairs of significant or very significant correlations between 11 photosynthetic characteristics and nutritional quality related indexes when microbial bacterial manure and organic fertilizer are applied together. Among them, there are 28 positive correlations and 9 negative correlations. There is a positive correlation between NDF and ADF. But both of them are negatively correlated with their indexes. Among them, the ADF and CP, SS, TDN were very significant, while the NDF and EE reached very significant levels. The other photosynthetic characteristics are positively correlated with the related indexes of nutritional quality. Among them, SPAD value, Pn, Ci, Tr and Gs reached a very significant level. The CP and SS, Gs, TDN reached very significant levels. There is a very significant level between the SS and TDN.
It can be seen from Figure 9c that there are 63 pairs of significant or extremely significant correlations among the 13 kinds of soil physical and chemical properties related indexes when microbial fertilizer and organic fertilizer are applied together, of which 54 pairs are positive correlations and 9 pairs are negative correlations. The soil pH has a negative correlation with the other soil nutrients and soil enzyme activities. Among them, the soil pH reached a very significant level with SOC, TN, AN, and AK. The other indexes related to soil physical and chemical properties are positively correlated. Among which the SOC is related to TN, TP, AN, and AK; TN is related to AN and AK; TP is related to AN and AK; AN is related to AK and S-UE; AP is related to S-UE and S-NPT; S-βGC is related to S-NAG and S-DHA; S-NAG is related to S-DHA. All the above indicators reached a very significant level.

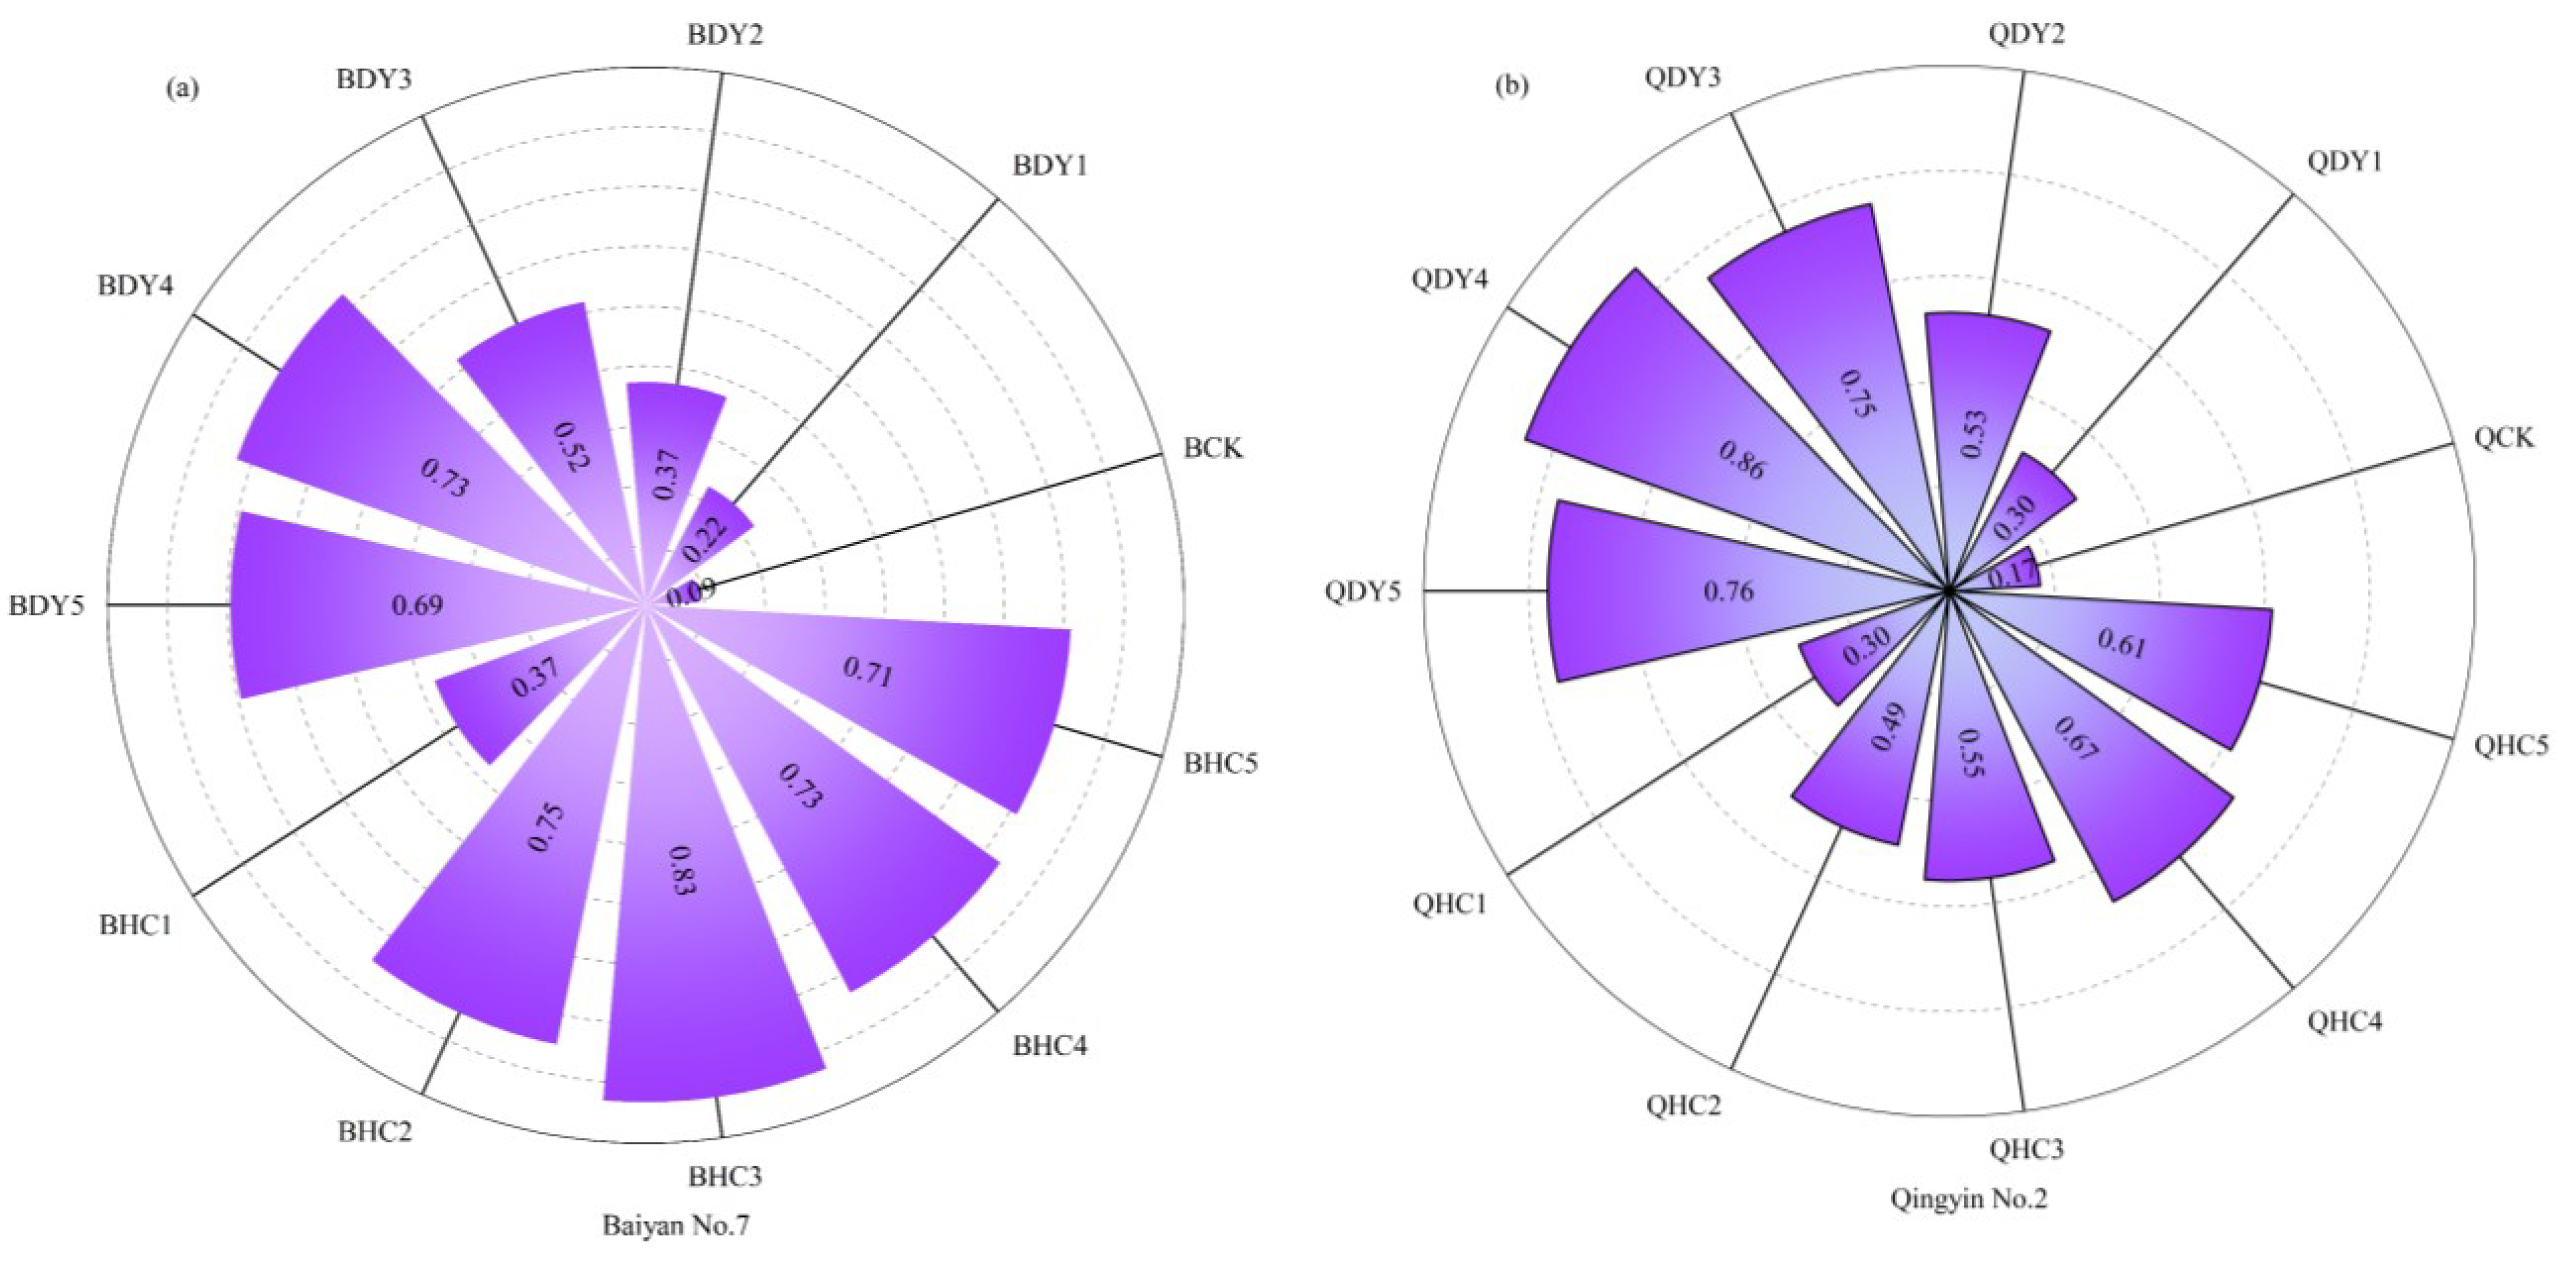
3.2.8. Principal Component Analysis, Comprehensive Evaluation of Membership Function, and Economic Benefit Analysis

Thirty-three indexes related to oat growth, yield quality, and soil quality were transformed into three principal components, and the characteristic values and contribution rates of each principal component are shown in Table 11. The contribution rate of the first principal component is 66.668%, the second principal component is 17.664%, and the third principal component is 4.196%, which can be explained as a total variation of 88.528%. The characteristic value of the first principal component is 22.000. Plant height, root length, stem base diameter, leaf length, leaf width, leaf area, fresh grass yield, hay yield, SPAD value, Pn, Ci, Tr, Gs, CP, EE, SS, ADF, NDE, TDN, SOC, TN, TP, TK, AN, AP, pH, S-βGC, S-NAG, S-DHA, S-UE, and S-NPT are higher, all exceeding 0.70, with a higher load. The eigenvalue of the second principal component is 5.829, and only the absolute value of AK is 0.71, which has a high load. The eigenvalue of the third principal component is only 1.385, and only the absolute value of the fresh–dry ratio is higher, which is 0.69.
The phenotypic characteristics, photosynthetic characteristics, yield quality, and soil quality of ‘Bai Yan No. 7’ under the combined application of microbial fertilizer and organic fertilizer were comprehensively evaluated by the membership function method (Figure 10a). The results showed that the productivity of ‘Bai Yan No. 7’ and its forage field nutrients were higher than the BCK treatment; the order from strong to weak was BHC3 > BHC2 > BDY4 > BHC4 > BHC5 > BDY5 > BDY3 > BDY2 > BHC1 > BDY1 > BCK. That is to say, the combined application of microbial fertilizer and organic fertilizer can promote the growth and development of ‘Bai Yan No. 7’, improve the yield and quality of ‘Bai Yan No. 7’, and improve the soil nutrient content of ‘Bai Yan No. 7’. The effect of the BHC3 treatment is the best, followed by BHC2, BDY4, and BHC4 treatment. The gap between the above treatments is small.
At the same time, the membership function method was used to comprehensively evaluate the phenotypic characteristics, photosynthetic characteristics, yield quality, and soil quality of ‘Qing Yin No. 2’ under the combined application of microbial fertilizer and organic fertilizer (Figure 10b). The results showed that the productivity of ‘Qing Yin No. 2’ and its forage field nutrients were higher than the QCK treatment; the order from strong to weak was QDY4 > QDY5 > QDY3 > QHC4 > QHC5 > QHC3 > QDY2 > QHC2 > QDY1 > QHC1 > QCK. That is to say, the combined application of microbial fertilizer and organic fertilizer can promote the growth and development of ‘Qing Yin No. 2’, improve the yield and quality of ‘Qing Yin No. 2’, and improve the soil nutrient content of the ‘Qing Yin No. 2’ forage field. The QDY4 treatment has the best effect, followed by the QDY5, QDY3, and QHC4 treatment, and the gap between the above treatments is small.
It can be seen from Table 12 that the output value of the forage field of’ Bai Yan No. 7’ treated with 10 kinds of microbial fertilizers is 19,576.67~23,822.40 yuan·hm−2, which is 6.97~30.17% higher than BCK. The economic benefit of the ‘Bai Yan No. 7’ forage field treated with 10 kinds of microbial fertilizers ranged from 17,001.67 to 21,112.40 yuan·hm−2, which was 7.19~33.11% higher than that of BCK. The input–output ratio of the BHC3 treatment was the highest, at 7.79, which was 19.85% higher than that of BCK. From Table 13, it can be seen that the output value of the forage field of ‘Qing Yin No. 2’ treated by adding 10 kinds of microbial fertilizers is 18,926.13~24,381.47 yuan·hm−2, and the economic benefit is 16,351.13~21,506.47 yuan·hm−2, all of which reach the maximum at QDY4, increasing by 25.37% and 26.47% compared with QCK. The input–output ratio of the QDY4 treatment was the highest, at 7.48, which was an increase of 7.32% compared with BCK.

4. Discussion

4.1. Evaluation on Adaptability of Oat Varieties Introduced

Plant height is widely used to evaluate the quality and introduction adaptability of the oat germplasm resources [15]. He et al. [16] found that the plant height of oats introduced in Xining was between 80 and 146 cm, and the plant height of the six oat varieties introduced in this study was between 93 and 109 cm, which was consistent with the research results. At the same time, it was found that the plant height of QT2 was the highest among the six oat varieties tested, which indicated that the growth rate of QT2 in high altitude area (4200 m) was significantly higher than the other varieties tested. A total of 90~95% of plant dry matter comes from photosynthesis, and the photosynthesis of oat leaves directly determines the yield. Different oat varieties have different photosynthetic efficiency, which further leads to different yields [17]. In this experiment, BY7 and QY2 have the highest values in Pn, Ci, Tr, Tr, and WUE, which shows that BY7 and QY2 have stronger adaptability and faster growth and development in high altitude areas. Forage yield is an important indicator for assessing the productive and economic performance of oats. Zhao et al. [18] found that different oat varieties differed in yield, which may be due to the different adaptations of different varieties to specific habitats. There were significant differences in hay yield among the participating oat varieties in this study, with QY2 having the highest hay yield of 6720.00 kg·hm−2, followed by BY7 with 6200.00 kg·hm−2, which was significantly higher than the other varieties, suggesting that QY2 and BY7 performed better in terms of hay yield, with strong photosynthesis and high dry matter accumulation capacity, which was in line with the above research results. The hay yield of the six oat varieties tested in this study ranged approximately from 4900 to 6720 kg·hm−2, while the oat introduction experiment made by Zhang et al. [19] in high altitude areas found that the hay yield of each oat variety tested ranged from 8000 to 10,000 kg·hm−2. The main reason for this difference in yield may be that the high altitude and low temperature in this experimental site shortened the growth period of the oats, resulting in low growth and development indexes of the oats and less sowing amount in each plot. However, the grass yield of QY2 and BY7 in this experiment was significantly higher than the average level of the county over the years.
The content of crude protein, crude fat, and soluble sugar is an important index to evaluate high-quality forage grass. High content of crude protein, crude fat and soluble sugar can provide rich nutrition for livestock, promote their development, and increase their milk yield [20,21]. In this study, it was found that the crude protein and soluble sugar content of QY2 were significantly higher than those of the other tested varieties, and the crude fat content of BY7 was significantly higher than those of the other tested varieties, indicating that QY2 and BY7 had high energy content and great feed value. The nutrient content of the different oat varieties is quite different, which may be related to the different genetic characteristics among the oat varieties or may be influenced by the natural environment [22]. To evaluate the adaptability and high yield of different varieties of forage oats introduced in high altitude areas, it is necessary to comprehensively consider multiple factors and, at the same time, comprehensively evaluate the production performance and nutritional quality [20]. Membership function is an effective method. Through a quantitative analysis and a comprehensive comparison of variety traits, the limitation of a single index is eliminated [23]. The calculation results of membership function show that QY2 and BY7 are superior in comprehensive evaluation, while QT1 is poor in overall performance. That is, ‘Qing Yin No. 2’ and ‘Bai Yan No. 7’ are two varieties with vigorous growth and high forage value, which are high-quality oat forage varieties suitable for planting in areas more than 4200 m above sea level in Dari County.

4.2. Study on Combined Application Technology of Microbial Fertilizer and Organic Fertilizer

It was found that the combined application of Trichoderma harzianum, Bacillus licheniformis and organic fertilizer could significantly promote the growth and development of the oats, especially for key indicators such as plant height, root length, and leaf area. With the increase of microbial fertilizer dosage, the plant height, root length, and leaf area of the oat were significantly improved. Under the BHC2 treatment, the plant height of ‘Bai Yan No. 7’ was significantly increased by 36.95% compared with the control treatment (BCK), and under the QDY3 treatment, the plant height of ‘Qing Yin No. 2’ was significantly increased by 40.36% compared with the control treatment (QCK). The reason for this phenomenon may be that microbial fertilizer can improve the decomposition rate of organic fertilizers, such as cattle and sheep manure, in high altitude areas, maintain the release of nutrients in forage fields, and provide sufficient nutrients for the growth and development of oats [14,24]. This is consistent with the research results of Miao Suping [25], the addition of microbial fertilizer can improve the growth and development speed of crops, and the promotion effect is different with different dosages. In addition, the combined application of microbial fertilizer and organic fertilizer can also enhance the photosynthetic efficiency and nutrient transport capacity of plants [26]. Flag leaf is the main organ of oat photosynthesis, and its area and photosynthetic characteristics directly affect the yield and quality of crops. The combined application of Trichoderma harzianum and Bacillus licheniformis microbial fertilizer and organic fertilizer can effectively improve the structure and function of leaves, improve their photosynthetic efficiency, and provide a stronger driving force for dry matter accumulation [27,28]. This is consistent with the research of Wildflush et al. [29], that is, microbial fertilizer can promote the absorption of nutrients, such as nitrogen, phosphorus and potassium, by improving soil microbial activity, thus enhancing leaf growth and improving leaf photosynthesis. In addition, the DY4 and HC3 treatments significantly promoted the photosynthetic characteristics of the oats, but the DY5 and HC5 treatments inhibited the net photosynthetic rate, indicating that there may be a “saturation value” or a “threshold effect” in the application amount of microbial fertilizer or the density of the flora [30]. This result is consistent with the observation that “high dose of microbial fertilizer occasionally leads to internal competition of microbial communities or the reduction of soil nutrient conversion efficiency” in the related research of maize [31].
The addition of organic fertilizer, such as cattle and sheep manure, can supplement nitrogen, phosphorus, and potassium elements in the forage fields, improve soil structure, further accelerate the decomposition of organic fertilizer, improve soil microbial community structure, and improve the oat yield and quality [32,33]. In this study, it was found that microbial fertilizer with organic fertilizers significantly increased oat fresh and hay yields, especially under the BHC3 treatment. The fresh and hay yields of ‘Bai Yan No. 7’ were significantly increased by 87.95% and 30.17%, respectively, compared with the control treatment (BCK). Under the QDY4 treatment, the fresh grass yield and hay yield of ‘Qing Yin No. 2’ were as high as 36,847.33 kg·hm−2 and 8707.67 kg·hm−2, which were significantly increased by 29.13% and 25.37%, respectively, compared with the QCK treatment. This result is consistent with Bao et al. [24], that is, the combination of microbial fertilizer and organic fertilizer can improve the soil microbial activity, promote the transformation and absorption of soil nutrients by plants, and then increase plant yield. It is worth noting that, although all the treatment groups showed a certain yield-increasing effect, the combination of different amounts of microbial fertilizer and organic fertilizer had different effects on yield synergy. The treatments of HC3 and DY4 significantly promoted the oat yield, but the treatments of HC5 and DY5 slightly inhibited the oat yield, which further showed that there might be a “saturation value” or a “threshold effect” in the application amount of microbial fertilizer or the density of flora [32]. Nutritional quality is the key to measure the feed value of oats, and the content of CP, EE, SS, and fiber directly affects the palatability and digestibility of the feed [21]. In this study, it was found that the combined application of microbial fertilizer and organic fertilizer could significantly increase the contents of CP and EE and decrease the fiber content of the oats. The CP content of ‘Bai Yan No. 7’ treated by BHC3 was as high as 11.68%, and the SS content was as high as 15.48%, while that of the control (BCK) was only 8.28% and 10.96%, respectively. The contents of CP and EE for the QDY4 treatment ‘Qing Yin No. 2’ were 12.47% and 3.80%, respectively, which were significantly higher than the QCK treatment by 38.10% and 49.61%. The fiber content decreased by 5%~40% with the addition of each microbial fertilizer. These results are similar to the existing studies on the feed quality of corn: when microbial flora and organic fertilizer work together, plants can absorb nitrogen, phosphorus, potassium, and some trace elements more efficiently, thus synthesizing protein and sugar in the body faster, while the fiber components in the cell wall are relatively reduced, thus improving the feed quality as a whole [34]. This change may also be related to the transformation of elements, such as nitrogen, phosphorus, and potassium, in the soil after the combination of microbial fertilizer and organic fertilizer. That is, fertilizer addition can promote soil microbial activities, improve soil properties, and increase the accumulation of nutrients in the oats [35].
Soil environment is one of the key factors affecting forage grass yield and quality. This study shows that the application of microbial fertilizer and organic fertilizer can effectively improve the soil nutrient content and, at the same time, regulate the pH and enzyme activity. Similar to the other scholars’ research conclusions, microbial fertilizer can promote the decomposition and transformation of soil organic matter, form more stable soil aggregates, improve soil aeration and water holding capacity, and then improve the soil nutrient status and enzyme activity, thus providing a better physical and chemical environment for crop root growth [32,33]. The experiment by Yu et al. [36] showed that the application of microbial fertilizer would increase the species and quantity of microorganisms in the soil, accelerate the decomposition of organic substances in the soil, and promote the absorption of nutrients by plant roots. In addition, the excessive or unbalanced application of microbial fertilizer would also lead to soil nutrient imbalance or pH fluctuation. In this study, the pH of the soil treated with HC1, HC5, DY1, and DY5 is high, indicating that the buffering capacity of the soil system is limited. If the amount of microbial fertilizer does not match the nutrient load, it may lead to stress on the soil ecological environment. In the experiment of Lyu et al. [37], the pH was decreased after the microbial fertilizer was applied, but when the mixed microbial fertilizer reached a certain concentration, with the increase of microbial fertilizer concentration, the pH no longer decreased but increased, which was consistent with the trend that the soil pH first decreased and then increased with the increase of microbial fertilizer concentration in this experiment. In high altitude areas, it is especially necessary to determine the best ratio of microbial fertilizer and organic fertilizer according to local conditions, so as to ensure the positive contribution to soil carbon and nitrogen cycle and avoid obvious impact on soil balance.
Based on the results of the principal component analysis and the membership function method, it can be seen that there are differences in promoting oat growth, enhancing forage quality, and improving soil quality with different microbial fertilizer types and different microbial fertilizer dosage. The treatments of BHC3 and QDY4 performed well on the whole, while the treatments of HC5 and DY5 were outstanding in some indexes, but they might show some limitations in photosynthetic efficiency or soil nutrient balance, and the input increased greatly, but the yield-increasing effect was not obvious. Similarly, in the application practice of high-yield crops, such as corn, it is often found that the input of “excessive microbial fertilizer” does not bring about a linear increase in yield or quality, but in some cases leads to an imbalance of soil microbial flora or a waste of resources [31]. Therefore, in view of the high altitude ecological environment and the cultivated land quality in different regions, it is necessary to scientifically formulate the combined application scheme of microbial fertilizer and organic fertilizer in combination with crop growth demand and ecological protection requirements. By regularly monitoring soil quality and crop growth indicators, the input strategy can be dynamically adjusted to maximize the synergistic effect of microbial fertilizer and organic fertilizer.

5. Conclusions and Prospect

5.1. Conclusions

(1) Six oat varieties planted in a high altitude area (4200 m) have obvious differences in plant height, hay yield, photosynthetic characteristics, and nutrient content. Among them, the hay yield of QY2 was as high as 6720 kg·hm−2, which was significantly increased by 37.14% compared with QT2, showing the advantage of high yield. In addition, the photosynthetic characteristics and nutrient contents of QY2 and BY7 were significantly higher than those of the other oat varieties, among which the net photosynthetic rate of QY2 was as high as 10.96 μmol·m−2·s−1, and the crude fat content of BY7 was as high as 8.05%. According to the comprehensive evaluation results of the membership function, the membership function values of QY2 and BY7 are 0.69 and 0.65, which are excellent and grade I. Comprehensive research and analysis show that QY2 and BY7 are two varieties with vigorous growth and high forage value, which are high-quality oat forage varieties suitable for planting in areas more than 4200 m above sea level in Dari County.
(2) The combined application of microbial fertilizer and organic fertilizer in high altitude areas significantly promoted the growth and development of oats and improved the soil nutrient content in the oat field. ‘Bai Yan No. 7’ had the best treatment effect in BHC3, and its hay yield was 8508.00 kg·hm−2, which was 30.17% higher than the control group. ‘Qing Yin No. 2’ had the best effect for the QDY4 treatment, and its hay yield was 8707.67 kg·hm−2, which was 25.37% higher than the control group. The BHC3 and QDY4 treatments not only significantly enhanced the yield of ‘Bai Yan No. 7’ and ‘Qing Yin No. 2’, but improved their forage nutritional value, optimized soil conditions in the forage fields, and achieved the highest input–output ratio among all treatments. To sum up, the application of Trichoderma harzianum microbial fertilizer of 6.00 kg per hectare and manure (cattle and sheep) organic fertilizer of 18,000 kg per hectare is suitable for the popularization and application of ‘Bai Yan No. 7’ in high altitude areas. Applying 15.00 kg of Bacillus licheniformis microbial fertilizer and 18,000 kg of organic fertilizer per hectare is suitable for popularization and application in planting ‘Qing Yin No. 2’ in high altitude area.

5.2. Prospect

For future research, on the one hand, multi-point experiments (for example, Nagqu City, Tibet Autonomous Region, and Yushu City, Qinghai Province) or long-term monitoring (2025a, 2026a) should be carried out in a larger geographical area to determine the optimal application amount of microbial fertilizer under different soil types, climatic conditions and farming systems. On the other hand, with the development of molecular biology and genomics, the functional mechanism of microbial fertilizer in rhizosphere ecosystem can be deeply analyzed by means of metagenomics, soil microbiology, and metabonomics, including how they compete or cooperate with endogenous microorganisms, how they participate in soil carbon and nitrogen cycle and how to promote the healthy growth of crops. Finally, we should focus on the study of mixed sowing of oats and leguminous forage, so as to diversify the nutritional quality of feed and further improve the soil health. These studies will provide a more solid theoretical basis for the precise regulation of the soil–plant system and help to build an efficient and sustainable forage production system in relatively fragile ecological areas such as high altitude.

Author Contributions

Formal analysis: J.S.; funding acquisition: J.S.; investigation: J.S., L.L., P.G., J.H. and C.L.; writing—original draft: L.L. and P.G.; writing—review and editing: L.L. and J.S. All authors have read and agreed to the published version of the manuscript.

Funding

The Special Project for Science and Technology Commissioners in Qinghai Province (2025-NK-P); The Qinghai Provincial Forestry and Grass Bureau Project–Tuotuo River Thoreau Grassland Breeding Technology Demonstration (Qing 2024TG02).

Institutional Review Board Statement

Not applicable.

Informed Consent Statement

Not applicable.

Data Availability Statement

The original contributions presented in this study are included in the article; further inquiries can be directed to the corresponding author.

Conflicts of Interest

The authors declare no conflicts of interest.

References

  1. Ma, Q.; You, Y.; Shen, Y.; Wang, Z. Adjusting sowing window to mitigate climate warming effects on forage oats production on the Tibetan Plateau. Agric. Water Manag. 2024, 293, 108712. [Google Scholar] [CrossRef]
  2. Tahir, M.; Wei, X.; Liu, H.; Li, J.; Zhou, J.; Kang, B.; Jiang, D.; Yan, Y. Mixed legume–grass seeding and nitrogen fertilizer input enhance forage yield and nutritional quality by improving the soil enzyme activities in Sichuan, China. Front. Plant Sci. 2023, 14, 1176150. [Google Scholar] [CrossRef] [PubMed]
  3. Yang, J.; Ren, Y.; Jia, M.; Huang, S.; Guo, T.; Liu, B.; Liu, H.; Zhao, P.; Wang, L.; Jie, X. Improving soil quality and crop yield of fluvo-aquic soils through long-term organic-inorganic fertilizer combination: Promoting microbial community optimization and nutrient utilization. Environ. Technol. Innov. 2025, 37, 104050. [Google Scholar] [CrossRef]
  4. Ramadhan, M.N. Assessment of the yield and yield attributing characters of oat (Avena sativa L.) grown under different tillage methods and NPK fertilizer rates in semi-arid conditions. All Life 2024, 17, 2304338. [Google Scholar] [CrossRef]
  5. Gadisa, B.; Debela, M.; Dinkale, T.; Tulu, A. Forage yield and quality parameters of eight oat (Avena sativa L.) genotypes at multilocation trials in Eastern Oromia, Ethiopia. Cogent Food Agric. 2023, 9, 2259521. [Google Scholar] [CrossRef]
  6. Wang, F.; Liang, G.; Liu, W. Genetic diversity analysis of phenotypic traits of vegetative organs in 590 oat germplasm resources. Acta Grassl. 2024, 32, 158–167. [Google Scholar] [CrossRef]
  7. Anjum, L.; Rehman, A.; Rizwan, M.; Hussain, S.; Waqas, M.S. Impact of Integrated Nutrient Management on Yield of Different Varieties of Oat. Environ. Sci. Proc. 2022, 23, 14. [Google Scholar] [CrossRef]
  8. Wu, Q.; Chen, Y.; Dou, X.; Liao, D.; Li, K.; An, C.; Li, G.; Dong, Z. Microbial fertilizers improve soil quality and crop yield in coastal saline soils by regulating soil bacterial and fungal community structure. Sci. Total Environ. 2024, 949, 175127. [Google Scholar] [CrossRef]
  9. Zhao, Y.A. Effect of Organic Fertilizers and Rhizobacterial Agents on the Growth and Inter-Root Microbial Diversity of Alfalfa. Master’s Thesis, Qinghai University, Xining, China, 2023. [Google Scholar]
  10. Fang, Y.; Lyu, J.; Zhang, Y.; Wang, K. Effect of bio-organic fertilizer on potato yield and quality. Guacai China 2019, 32, 50–53. [Google Scholar] [CrossRef]
  11. Rawat, H.; Singh, K.; Pant, S. Study on Growth, Yield and Quality of Pea under the Influence of Different Combinations of Biofertilizers and Organic Manures. Int. J. Plant Soil Sci. 2025, 37, 144–166. [Google Scholar] [CrossRef]
  12. Qiao, Q.; Wu, Y.; Li, Q.; Zhang, Y.; Kou, W.; He, X.; Li, X.; Kou, J.; Yang, W. Effects of commercial organic fertilizer and sheep manure on artificial grassland and soil characteristics in alpine mining areas. Acta Grassl. 2024, 32, 2659–2669. [Google Scholar] [CrossRef]
  13. Yang, J.; Li, L.; Zhang, Y.; Qu, J.; Han, D.; Zhao, X. Effects of oat intercropping with pea and fertilization on forage nutrient accumulation, yield and water use. J. Northwest Agric. 2024, 33, 121–132. [Google Scholar] [CrossRef]
  14. Gao, P.; Li, X.; Chai, Y.; Wang, C.; Li, C.; Yang, P. Effects of combined application of sheep manure and Bacillus subtilis on soil nutrients and enzyme activities in degraded alpine meadow. China Soil Fertil. 2024, 29–36. [Google Scholar] [CrossRef]
  15. Zimmer, C.M.; Ubert, I.P.; Pacheco, M.T.; Federizzi, L.C. Molecular and comparative mapping for heading date and plant height in oat. Euphytica 2018, 214, 101. [Google Scholar] [CrossRef]
  16. He, J.; Ma, X.; Ju, Z.; Liu, K.; Zhao, J.; Ma, X.; Jia, Z. The effect of intercropping oat and broad bean on crop growth and yield in alpine region. Acta Grassl. 2022, 30, 2514–2521. [Google Scholar] [CrossRef]
  17. Chatrath, A.; Mandal, P.K.; Anuradha, M. Effect of Secondary Salinization on Photosynthesis in Fodder Oat (Avena sativa L.) Genotypes. J. Agron. Crop. Sci. 2000, 184, 13–16. [Google Scholar] [CrossRef]
  18. Zhao, Y.; Liu, Y.; Hou, G.; Du, J. Evaluation of production performance of 10 forage oat varieties in different ecological regions of northern Xinjiang. Seeds 2022, 41, 111–116+131. [Google Scholar] [CrossRef]
  19. Zhang, M.; Shan, G.; Zhou, P.; Liao, X.; Gao, Y.; Xue, S. Adaptability evaluation of five oat varieties introduced in the alpine region of Diqing. Seeds 2016, 35, 111–114. [Google Scholar] [CrossRef]
  20. Cai, Z.; Lyu, L.; Liu, Q.; Wang, C.; Lei, S.; Shi, J. Evaluation on the adaptability of different oat varieties introduced in the source area of the Three Rivers. Feed Res. 2024, 47, 135–139. [Google Scholar] [CrossRef]
  21. Duan, L.; Ju, Z.; Ma, X.; Pan, J.; Mustafa, A.E.-Z.M.A.; Jia, Z. Research on Enhancing the Yield and Quality of Oat Forage: Optimization of Nitrogen and Organic Fertilizer Management Strategies. Agronomy 2024, 14, 1406. [Google Scholar] [CrossRef]
  22. Fomina, M.N.; Ivanova, Y.S.; Bragin, N.A.; Bragina, M.V. Grain Quality of Promising Oat Lines at the Final Stage of the Breeding Process in the Conditions of the Northern Trans-Urals. Russ. Agric. Sci. 2024, 49 (Suppl. S2), S307–S312. [Google Scholar] [CrossRef]
  23. Wang, Y.; Liu, K.; Liang, G.; Jia, Z.; Ju, Z.; Ma, X.; Zhou, Q. Comprehensive Evaluation of Low Nitrogen Tolerance in Oat (Avena sativa L.) Seedlings. Agronomy 2023, 13, 604. [Google Scholar] [CrossRef]
  24. Bao, S.; Fan, G.; Li, F. Effects of Bacillus amyloliquefaciens microbial agents on the growth and soil properties of Lycium barbarum. China Soil Fertil. 2023, 112–120. [Google Scholar] [CrossRef]
  25. Miao, S. Effects of different concentrations of Brevibacterium laterosporus on soil and crop growth. J. Jining Univ. 2016, 37, 38–42. [Google Scholar]
  26. Lyu, L.; Duan, G.; Li, F.; Su, C.; Fan, G. Effects of microbial agents on the growth of Lycium barbarum and soil nutrients. Jiangsu Agric. Sci. 2023, 51, 168–175. [Google Scholar] [CrossRef]
  27. Mthiyane, P.; Aycan, M.; Mitsui, T. Integrating Biofertilizers with Organic Fertilizers Enhances Photosynthetic Efficiency and Upregulates Chlorophyll-Related Gene Expression in Rice. Sustainability 2024, 16, 9297. [Google Scholar] [CrossRef]
  28. Wang, J.; Zhai, B.; Shi, D.; Chen, A.; Liu, C. How Does Bio-Organic Fertilizer Combined with Biochar Affect Chinese Small Cabbage’s Growth and Quality on Newly Reclaimed Land? Plants 2024, 13, 598. [Google Scholar] [CrossRef]
  29. Wildflush, I.R.; Tsyganov, A.R.; Barbasov, N.V. Effect of new forms of fertilizers and growth regulators on photosynthetic activities of crops, yield and barley grain quality of feed purpose varieties. Proc. Natl. Acad. Sci. Belarus. Agrar. Ser. 2019, 57, 297–307. [Google Scholar] [CrossRef]
  30. Tian, X.; Zhang, X.; Yang, G.; Wang, Y.; Liu, Q.; Song, J. Effects of Microbial Fertilizer Application on Soil Ecology in Saline–Alkali Fields. Agronomy 2024, 15, 14. [Google Scholar] [CrossRef]
  31. Wan, S.; Li, F.; Wang, J.; Guo, Z.; Yu, Y.; Jiang, G.; Wu, J. Effects of phosphate-solubilizing microbial agents on the growth of maize seedlings and the bacterial community structure and phosphorus forms in rhizosphere soil. China Soil Fertil. 2024, 80–88. [Google Scholar] [CrossRef]
  32. Zhu, S.; Wang, L.; Jin, S.; Zhou, J.; Lu, X. Effects of bio-organic fertilizers and microbial agents on soil fertility and strawberry growth quality. Chin. Agric. Sci. Bull. 2022, 38, 36–43. [Google Scholar] [CrossRef]
  33. Tian, L.; Wang, Y.; Jin, D.; Zhou, Y.; Mukhamed, B.; Liu, D.; Feng, B. The application of biochar and organic fertilizer substitution regulates the diversities of habitat specialist bacterial communities within soil aggregates in proso millet farmland. Biochar 2025, 7, 6. [Google Scholar] [CrossRef]
  34. Qiu, Y.; Wang, X.; Li, P.; Hou, X.; Wang, Y.; Wu, P.; Huo, W. Effects of different types and amounts of organic fertilizers on soil fertility and corn yield in dry land in the current season. China Soil Fertil. 2019, 182–189. [Google Scholar] [CrossRef]
  35. Jiao, J.; An, X.; Xu, C.; Li, T.; Meng, H.; Zhang, J.; Hao, X. Effect of organic fertilizer combined with Pseudomonas fluorescens fertilizer on maize yield and phosphorus availability in reclaimed soil. J. Agric. Eng. 2024, 40, 79–87. [Google Scholar] [CrossRef]
  36. Yu, H.; Xu, G.; Xu, B.; Yuan, Y.; Shao, W.; Wang, X.; Zhu, G.; Lu, Z.; Si, P. Effects of applying biological bacterial fertilizer on soil nutrients and microbial functional diversity in Taoyuan. Agric. Res. Arid Areas 2020, 38, 91–97. [Google Scholar]
  37. Lyu, L.; Fan, G.; Fu, Q.; Su, C.; Li, F. Effects of bio-organic fertilizer on growth and soil properties of Lycium barbarum L. Xinjiang Agric. Sci. 2023, 60, 2779–2789. [Google Scholar] [CrossRef]
Figure 1. (a) Schematic diagram of oat introduction test plot. (b) Schematic diagram of the experimental plot of microbial fertilizer combined with organic fertilizer.
Sustainability 17 04444 g001
Figure 2. Analysis of plant height and hay yield of different oat varieties. Note: (a) Plant height of Avena sativa L.; (b) Hay yield of Avena sativa L. Different lowercase letters indicate significant differences at the level of p < 0.05. The same applies for the below figure.
Sustainability 17 04444 g002
Figure 3. Analysis of photosynthetic performance of different oat varieties. Note: (a) Pn of Avena sativa L.; (b) Ci of Avena sativa L.; (c) Tr of Avena sativa L.; (d) Gs of Avena sativa L.; (e) WUE of Avena sativa L.
Sustainability 17 04444 g003
Figure 4. Comprehensive evaluation of the membership function of the different oat varieties.
Sustainability 17 04444 g004
Figure 5. Analysis of phenotypic characteristics of the oat under different microbial fertilizer treatments. Note: (a) Morphological parameters of Avena sativa L. ‘Baiyan No. 7’: plant height, basal diameter, and root length; (b) Leaf traits of Avena sativa L. ‘Baiyan No. 7’: leaf length, leaf width, and leaf area; (c) Morphological parameters of Avena sativa L. ‘Qingyin No. 2’: plant height, basal diameter, and root length; (d) Leaf traits of Avena sativa L. ‘Qingyin No. 2’: leaf length, leaf width, and leaf area. Different lowercase letters in the same treatment group showed significant differences at the level of p < 0.05. The same applies for the below figures.
Sustainability 17 04444 g005
Figure 6. Analysis of oat production performance under different microbial fertilizer treatments. Note: (a) Freshgrass yield of Avena sativa L. ‘Baiyan No. 7’; (b) Hay yield of Avena sativa L. ‘Baiyan No. 7’; (c) Fresh/dry ratio of Avena sativa L. ‘Baiyan No. 7’; (d) Fresh grass yield of Avena sativa L. ‘Qingyin No. 2’; (e) Hay yield of Avena sativa L. ‘Qingyin No. 2’; (f) Fresh/dry ratio of Avena sativa L. ‘Qingyin No. 2’.
Sustainability 17 04444 g006
Figure 7. Analysis of the relative feeding value (RFV) and the relative forage quality (RFQ) of the oats under different microbial fertilizer treatments. Note: (a) relative feeding value (RFV) of Avena sativa L. ‘Baiyan No. 7’; (b) relative forage quality (RFQ) of Avena sativa L. ‘Baiyan No. 7’; (c) relative feeding value (RFV) of Avena sativa L. ‘Baiyan No. 7’; (d) relative forage quality (RFQ) of Avena sativa L. ‘Baiyan No. 7”.
Sustainability 17 04444 g007
Figure 8. Analysis of soil enzyme activity and soil pH in oat rhizosphere under different microbial fertilizer treatments. Note: (a) Rhizosphere soil parameters of Avena sativa L. ‘Baiyan No. 7’: pH, β-glucosidase (S-βGC), and N-acetyl-β-D-glucosaminidase (S-NAG); (b) Rhizosphere soil enzyme activities of Avena sativa L. ‘Baiyan No. 7’: dehydrogenase (S-DHA), urease (S-UE), and neutral protease (S-NPT); (c) Rhizosphere soil parameters of Avena sativa L. ‘Qingyin No. 2’: pH, β-glucosidase (S-βGC), and N-acetyl-β-D-glucosaminidase (S-NAG); (d) Rhizosphere soil enzyme activities of Avena sativa L. ‘Qingyin No. 2’: dehydrogenase (S-DHA), urease (S-UE), and neutral protease (S-NPT).
Sustainability 17 04444 g008
Figure 9. Correlation analysis of the agronomic characters and forage yield, the photosynthetic performance and nutritional value, and the soil chemical properties and soil enzyme activities of the oats under different microbial bacterial fertilizer treatments. Note: (a) Correlation analysis between oat forage yield and agronomic traits; (b) correlation analysis betweenphysiological characteristics and nutritional quality of oat forage; (c) correlation analysis between soilproperties and enzymatic activities in oat rhizosphere.
Sustainability 17 04444 g009
Figure 10. Comprehensive evaluation chart of oat membership function under different microbial fertilizer treatments. Note: (a) Membership function-based comprehensive evaluaton ot key indicators for Avena sativa L. ‘Baiyan No. 7’ across fertilization regimes; (b) membership function-based comprehensive evaluation of key indicators for Avena sativa L. ‘Qingyin No. 2’ across fertilization regimes.
Sustainability 17 04444 g010
Table 1. Information for the oat varieties tested.
TreatmentLatinVariety CharacteristicsGermination Percentage/(%)Seed Purity/(%)Thousand Grain Weight/(g)Source
QT1A. sativa L. ‘Qingtian No. 1’Early-ripe91.00 93.68 46.43 Qinghai, China
BY7A. sativa L. ‘Bai Yan No. 7’Medium cooked81.11 90.21 36.60 Jilin, China
JYA. sativa L. ‘Jiayan’Medium cooked89.00 92.91 40.10 Ottawa, Canada
LNA. sativa L. ‘Linna’Late-maturing76.67 87.69 33.85 Oslo, Norway
QT2A. sativa L. ‘Qingtian No. 2’Early-ripe79.69 89.93 35.72 Qinghai, China
QY2A. sativa L. ‘Qing Yin No. 2’Early-ripe85.56 90.49 43.90 Qinghai, China
Table 2. Application amount of test microbial fertilizer and organic fertilizer.
TreatmentTypes of Microbial Agents
Microbial Bacterial
Fertilizer Types
Application Amount of
Microbial Fertilizer/(kg·hm−2)
Application Amount of
Microbial Fertilizer
in the Experimental Plot/(g)
Application Amount of
Cattle and Sheep Manure
in the Experimental Plot/(g)
BCK, QCK______21,600
BDY1, QDY1Bacillus licheniformis fertilizer3.754.5021,600
BDY2, QDY2Bacillus licheniformis fertilizer7.509.0021,600
BDY3, QDY3Bacillus licheniformis fertilizer11.2513.5021,600
BDY4, QDY4Bacillus licheniformis fertilizer15.0018.0021,600
BDY5, QDY5Bacillus licheniformis fertilizer18.7522.5021,600
BHC1, QHC1Trichoderma harzianum fertilizer3.003.6021,600
BHC2, QHC2Trichoderma harzianum fertilizer4.505.4021,600
BHC3, QHC3Trichoderma harzianum fertilizer6.007.2021,600
BHC4, QHC4Trichoderma harzianum fertilizer7.509.0021,600
BHC5, QHC5Trichoderma harzianum fertilizer9.0010.8021,600
Table 3. Analysis of nutritional quality of different oat varieties.
Oat VarietiesCP/(%)EE/(%)SS/(%)L/(%)
QT111.30 ± 1.11b6.15 ± 0.28b8.67 ± 0.15f6.80 ± 0.62c
BY711.80 ± 0.36b8.05 ± 0.34a10.00 ± 0.08d7.14 ± 0.08bc
JY10.10 ± 0.36c6.37 ± 0.50b11.03 ± 0.09b7.50 ± 0.17ab
LN7.65 ± 0.08d6.71 ± 0.21b10.57 ± 0.06c7.83 ± 0.13a
QT27.10 ± 0.72d5.36 ± 0.23c9.72 ± 0.13e5.91 ± 0.08d
QY214.59 ± 0.36a7.52 ± 0.19a13.02 ± 0.17a7.65 ± 0.12ab
Note: data are mean standard deviation; different lowercase letters between data in the same column indicate significant differences at the level of p < 0.05. This applies similarly for the tables hereinafter.
Table 4. Principal component analysis of the different oat varieties.
ItemPrincipal Component
PC1PC2PC3
Plant height−0.51 0.72 0.11
Hay yield0.92 −0.18 0.26
CP0.77 −0.45 0.29
EE0.90 −0.12 −0.29
SS0.75 0.37 0.38
L0.68 0.24 −0.42
Pn0.98 0.07 −0.03
Ci0.85 0.24 −0.20
Tr0.90 0.30 0.09
Gs0.90 0.17 0.13
WUE0.89 −0.17 −0.16
Eigenvalue7.58 1.17 0.66
Contribution rate/%68.95 10.59 5.98
Cumulative Contribution rate/%68.95 79.54 85.52
Table 5. Analysis of the photosynthetic characteristics of the oat ‘Bai Yan No. 7’ under different microbial fertilizer treatments.
TreatmentSPADPnCiTrGs
/(μmol·m−2·s−1)/(μmol·mol−1)/(mmol·m−2·s−1)/(mmol·m−2·s−1)
BCK41.83 ± 2.85b10.17 ± 0.09g359.67 ± 8.08c2.65 ± 0.06h213.33 ± 5.51e
BDY141.40 ± 3.26b10.29 ± 0.10fg372.33 ± 6.43c2.78 ± 0.09gh234.33 ± 8.33d
BDY244.68 ± 4.18b10.76 ± 0.16efg377.00 ± 7.21c2.98 ± 0.11ef256.00 ± 5.57c
BDY346.93 ± 3.83b11.05 ± 0.11e378.33 ± 5.51c2.99 ± 0.07ef268.67 ± 5.86c
BDY459.80 ± 1.28a11.62 ± 0.24d398.00 ± 15.39b3.17 ± 0.07cd292.00 ± 7.55b
BDY554.18 ± 2.96a12.16 ± 0.42c428.00 ± 7.00a3.11 ± 0.08de290.00 ± 5.57b
BHC146.50 ± 2.94b10.85 ± 0.34ef371.00 ± 7.00c2.87 ± 0.09fg261.33 ± 8.96c
BHC255.87 ± 0.75a13.61 ± 0.33b413.33 ± 9.87ab3.37 ± 0.09b330.33 ± 9.87a
BHC353.27 ± 3.08a14.27 ± 0.33a403.33 ± 10.97b3.54 ± 0.07a320.33 ± 11.37a
BHC457.57 ± 4.41a12.46 ± 0.31c396.67 ± 7.37b3.30 ± 0.06bc306.00 ± 4.58b
BHC558.86 ± 3.04a12.44 ± 0.44c404.33 ± 7.51b3.30 ± 0.08bc302.67 ± 8.02b
Table 6. Analysis of the photosynthetic characteristics of the oat ‘Qing Yin No. 2’ under different microbial fertilizer treatments.
TreatmentSPADPnCiTrGs
/(μmol·m−2·s−1)/(μmol·mol−1)/(mmol·m−2·s−1)/(mmol·m−2·s−1)
QCK46.05 ± 1.84f10.85 ± 0.15g367.33 ± 4.04f2.82 ± 0.07g230.67 ± 7.37g
QDY149.07 ± 1.06def11.27 ± 0.32fg378.00 ± 8.89ef3.03 ± 0.09f249.67 ± 8.08f
QDY254.77 ± 4.59cde13.07 ± 0.31d416.67 ± 4.73bc3.60 ± 0.06bc308.00 ± 11.79d
QDY364.85 ± 1.98a14.33 ± 0.44b458.67 ± 8.14a3.79 ± 0.06a350.00 ± 7.55b
QDY464.59 ± 2.94a14.91 ± 0.13a447.33 ± 8.50a3.62 ± 0.05bc327.33 ± 10.79c
QDY557.96 ± 4.18abc13.94 ± 0.25bc428.67 ± 13.43b3.66 ± 0.05b330.33 ± 7.02c
QHC147.65 ± 0.76ef11.29 ± 0.36fg380.33 ± 9.02ef3.28 ± 0.07e268.00 ± 9.54e
QHC250.44 ± 2.85def11.71 ± 0.29ef393.67 ± 5.03de3.39 ± 0.07de299.00 ± 10.58d
QHC355.77 ± 3.87bcd12.01 ± 0.12e401.67 ± 6.11cd3.47 ± 0.05cd376.00 ± 8.19a
QHC463.06 ± 0.46ab13.34 ± 0.45cd414.00 ± 6.25bc3.61 ± 0.06bc329.00 ± 9.17c
QHC562.52 ± 6.37ab13.86 ± 0.27bc423.00 ± 9.17b3.89 ± 0.10a323.67 ± 8.62c
Table 7. Analysis of nutritional quality of oats ‘Bai Yan No. 7’ under different microbial fertilizer treatments.
TreatmentCP/(%)EE/(%)SS/(%)ADF/(%)NDF/(%)TDN/(%)
BCK8.28 ± 0.07e3.01 ± 0.10e10.96 ± 0.10g35.34 ± 0.25a42.33 ± 0.38a55.82 ± 0.19f
BDY18.79 ± 0.24d3.52 ± 0.18d11.90 ± 0.14f34.53 ± 0.34b40.02 ± 0.66b56.43 ± 0.25e
BDY29.60 ± 0.32c3.48 ± 0.15d12.72 ± 0.25e34.39 ± 0.17b37.52 ± 0.50c56.54 ± 0.13e
BDY310.79 ± 0.28b3.79 ± 0.11c13.58 ± 0.25d32.17 ± 0.60c36.00 ± 0.62cde58.20 ± 0.45d
BDY411.37 ± 0.29ab4.17 ± 0.15b14.21 ± 0.10c30.33 ± 0.16e35.68 ± 0.68de59.59 ± 0.12b
BDY511.24 ± 0.33ab4.12 ± 0.10b14.10 ± 0.24c30.94 ± 0.55d37.12 ± 0.72cd59.13 ± 0.41c
BHC19.31 ± 0.23c3.70 ± 0.10cd12.02 ± 0.39f32.24 ± 0.22c41.87 ± 0.80a58.15 ± 0.17d
BHC211.41 ± 0.17ab4.30 ± 0.09b14.17 ± 0.19c30.40 ± 0.24e36.56 ± 1.48cd59.53 ± 0.18b
BHC311.68 ± 0.26a4.62 ± 0.15a15.48 ± 0.25a29.43 ± 0.37f34.70 ± 1.42e60.27 ± 0.28a
BHC411.55 ± 0.43a4.54 ± 0.21a15.01 ± 0.17b29.34 ± 0.25f37.36 ± 0.15c60.34 ± 0.18a
BHC511.44 ± 0.38ab4.71 ± 0.03a15.14 ± 0.14ab30.24 ± 0.22e36.62 ± 0.51cd59.66 ± 0.17b
Table 8. Analysis of nutritional quality of oats ‘Qing Yin No. 2’ under different microbial fertilizer treatments.
TreatmentCP/(%)EE/(%)SS/(%)ADF/(%)NDF/(%)TDN/(%)
QCK9.03 ± 0.23g2.54 ± 0.1d12.30 ± 0.16f33.48 ± 0.38a46.18 ± 1.61a57.21 ± 0.28e
QDY110.08 ± 0.31f2.40 ± 0.02d13.32 ± 0.32de32.88 ± 0.15a45.59 ± 0.62a57.67 ± 0.11e
QDY210.9 ± 0.14e3.00 ± 0.13c13.05 ± 0.08e31.15 ± 0.58bc42.73 ± 1.16b58.97 ± 0.44cd
QDY311.68 ± 0.13b3.52 ± 0.12b14.96 ± 0.23b30.24 ± 0.22cd38.99 ± 2.33c59.65 ± 0.17bc
QDY412.47 ± 0.09a3.80 ± 0.11a14.81 ± 0.20b29.37 ± 0.24de39.31 ± 0.93c60.31 ± 0.18ab
QDY512.29 ± 0.09a3.42 ± 0.14b14.35 ± 0.20c28.78 ± 0.40e39.56 ± 0.98c60.75 ± 0.30a
QHC110.10 ± 0.24f2.4 ± 0.01d13.03 ± 0.20e32.83 ± 0.11a45.52 ± 0.49a57.71 ± 0.08e
QHC211.59 ± 0.12bc3.42 ± 0.12b15.35 ± 0.09a31.45 ± 0.16bc40.76 ± 0.57bc58.74 ± 0.12cd
QHC311.36 ± 0.28bcd3.28 ± 0.13b13.65 ± 0.27d31.32 ± 0.24bc39.59 ± 1.27c58.85 ± 0.18cd
QHC411.22 ± 0.15cde3.52 ± 0.11b14.20 ± 0.10c31.23 ± 1.70bc41.94 ± 1.10bc58.91 ± 1.28cd
QHC511.01 ± 0.14de3.32 ± 0.21b13.52 ± 0.30d32.42 ± 0.21ab41.03 ± 0.55bc58.01 ± 0.16de
Table 9. Nutrient analysis of oat rhizosphere soil under different microbial fertilizer treatments ‘Bai Yan No. 7’.
TreatmentSOC/(g·kg−1)TN/(g·kg−1)TP/(g·kg−1)TK/(g·kg−1)AN/(mg·kg−1)AP/(mg·kg−1)AK/(mg·kg−1)
BCK33.42 ± 1.41e3.35 ± 0.17d1.49 ± 0.07c21.51 ± 1.4d182.94 ± 9.71d33.83 ± 0.76e404.67 ± 17.54e
BDY137.03 ± 1.33d3.59 ± 0.08cd1.63 ± 0.08bc20.46 ± 1.46d201.44 ± 9.52c35.11 ± 0.56e419.34 ± 8.21e
BDY240.26 ± 0.71b3.83 ± 0.08c1.72 ± 0.05abc26.54 ± 1.90bc248.29 ± 7.79b39.28 ± 0.57bcd445.43 ± 9.35d
BDY340.19 ± 0.81b4.18 ± 0.05b2.04 ± 0.06ab25.10 ± 0.53c244.15 ± 4.48b40.36 ± 0.8abc492.01 ± 7.91b
BDY442.08 ± 0.96bc4.41 ± 0.22ab2.17 ± 0.07a30.05 ± 2.05a274.15 ± 18.54a41.91 ± 0.45ab514.56 ± 16.67ab
BDY541.88 ± 0.77bc4.35 ± 0.13ab2.17 ± 0.06a29.44 ± 0.61ab272.15 ± 6.03a40.81 ± 1.85abc507.97 ± 4.57ab
BHC136.62 ± 3.18d3.70 ± 0.27c1.84 ± 0.09abc25.09 ± 0.43c229.85 ± 3.56b37.44 ± 1.96d470.73 ± 7.49c
BHC240.86 ± 0.77b4.62 ± 0.20a1.75 ± 0.57abc28.50 ± 1.45ab278.11 ± 7.05a42.56 ± 1.54a520.06 ± 24.00ab
BHC345.31 ± 0.69a4.56 ± 0.08a2.14 ± 0.08a28.00 ± 0.33abc294.27 ± 9.92a40.33 ± 0.60abc531.34 ± 6.22a
BHC444.48 ± 1.39ab4.54 ± 0.05ab2.05 ± 0.12ab27.37 ± 0.46abc276.11 ± 7.03a39.83 ± 0.74abcd526.17 ± 4.43a
BHC544.90 ± 0.82ab4.50 ± 0.12ab2.12 ± 0.08ab27.91 ± 0.39abc280.77 ± 6.98a38.53 ± 0.87cd509.84 ± 8.24ab
Table 10. Nutrient analysis of oat rhizosphere soil under different microbial fertilizer treatments ‘Qing Yin No. 2’.
TreatmentSOC/(g·kg−1)TN/(g·kg−1)TP/(g·kg−1)TK/(g·kg−1)AN/(mg·kg−1)AP/(mg·kg−1)AK/(mg·kg−1)
QCK32.89 ± 2.11b3.26 ± 0.22c1.55 ± 0.08c23.02 ± 0.7b173.11 ± 4.51e34.90 ± 2.23f398.12 ± 16.96c
QDY136.48 ± 2.98ab3.57 ± 0.05b1.62 ± 0.03bc22.97 ± 2.47b197.05 ± 11.5d36.03 ± 0.73ef421.44 ± 5.97ab
QDY235.27 ± 1.85ab3.75 ± 0.18ab1.64 ± 0.12abc25.46 ± 1.44a217.53 ± 6.29bc36.21 ± 0.71ef423.06 ± 10.69ab
QDY338.41 ± 0.11a3.82 ± 0.07ab1.77 ± 0.04ab27.37 ± 0.13a231.41 ± 17.83ab40.22 ± 0.45bc441.88 ± 13.79a
QDY438.96 ± 1.68a3.96 ± 0.09a1.83 ± 0.10a27.35 ± 1.02a232.34 ± 3.57ab43.37 ± 0.47a432.79 ± 5.40ab
QDY538.45 ± 2.87a4.03 ± 0.14a1.79 ± 0.02ab27.26 ± 0.55a235.63 ± 5.07ab42.06 ± 1.05ab435.81 ± 3.16ab
QHC135.84 ± 0.68ab3.56 ± 0.07b1.79 ± 0.04ab25.95 ± 0.55a204.36 ± 7.69cd37.60 ± 0.46de411.06 ± 4.51bc
QHC239.32 ± 0.69a3.62 ± 0.09b1.75 ± 0.14ab25.62 ± 0.78a230.14 ± 9.02ab39.15 ± 1.15cd416.34 ± 10.62abc
QHC338.56 ± 1.54a3.86 ± 0.05ab1.81 ± 0.03ab27.06 ± 0.60a236.43 ± 8.00ab41.29 ± 1.25abc437.95 ± 6.64a
QHC438.07 ± 1.03a3.89 ± 0.13ab1.80 ± 0.02ab27.08 ± 1.29a244.62 ± 3.65a42.12 ± 0.23ab432.94 ± 5.64ab
QHC537.72 ± 1.57a3.82 ± 0.17ab1.79 ± 0.01ab26.85 ± 0.58a232.37 ± 2.92ab41.77 ± 1.39ab430.40 ± 8.08ab
Table 11. Principal component analysis of oats treated with different microbial fertilizer.
ItemPrincipal Component
PC1PC2PC3
Plant height0.940.06−0.16
Root length0.880.26−0.25
Base diameter0.920.09−0.07
Leaf length0.74−0.55−0.22
Leaf width0.830.43−0.25
Leaf area0.76−0.56−0.13
Fresh grass yield0.880.08−0.11
Hay yield0.88−0.03−0.28
Fresh/dry ratio−0.270.400.69
SPAD0.860.41−0.14
Pn0.840.46−0.23
Ci0.840.48−0.16
Tr0.770.61−0.02
Gs0.890.430.03
CP0.920.260.16
EE0.74−0.59−0.05
SS0.890.110.13
ADF−0.90−0.120.01
NDF−0.720.57−0.12
TDN0.900.12−0.01
SOC0.77−0.530.17
TN0.83−0.52−0.04
TP0.70−0.530.22
TK0.86−0.120.16
AN0.84−0.490.09
AP0.860.100.31
AK0.66−0.71−0.05
pH−0.720.63−0.08
S-βGC0.770.560.25
S-NAG0.780.520.10
S-DHA0.790.480.11
S-UE0.86−0.240.30
S-NPT0.880.030.22
Eigenvalue22.0005.8291.385
Contribution rate/%66.66817.6644.196
Cumulative Contribution rate/%66.66884.33188.528
Table 12. Economic benefit analysis of oat ‘Bai Yan No. 7’ under different microbial fertilizer treatments.
TreatmentApplication Amount of Organic Fertilizer/(kg·hm−2)Organic Fertilizer Cost/(yuan·hm−2)Application Amount of
Microbial Fertilizer/(kg·hm−2)
Microbial Fertilizer Cost/(yuan·hm−2)Fertilizer Cost/(yuan·hm−2)Yield/
(kg·hm−2)
Output Value/
(yuan·hm−2)
Economic Benefits/
(yuan·hm−2)
Input–Output Ratio
BCK18,0002440____2440.00 6536.13 18,301.17 15,861.17 6.50
BDY118,00024403.75 108.75 2548.75 7287.33 20,404.53 17,855.78 7.01
BDY218,00024407.50 217.50 2657.50 7206.00 20,176.80 17,519.30 6.59
BDY318,000244011.25 326.25 2766.25 7623.67 21,346.27 18,580.02 6.72
BDY418,000244015.00 435.00 2875.00 8314.00 23,279.20 20,404.20 7.10
BDY518,000244018.75 543.75 2983.75 8311.33 23,271.73 20,287.98 6.80
BHC118,00024403.00 135.00 2575.00 6991.67 19,576.67 17,001.67 6.60
BHC218,00024404.50 202.50 2642.50 7936.67 22,222.67 19,580.17 7.41
BHC318,00024406.00 270.00 2710.00 8508.00 23,822.40 21,112.40 7.79
BHC418,00024407.50 337.50 2777.50 8228.33 23,039.33 20,261.83 7.29
BHC518,00024409.00 405.00 2845.00 8361.33 23,411.73 20,566.73 7.23
Table 13. Economic benefit analysis of oat ‘ Qing Yin No. 2’ under different microbial fertilizer treatments.
TreatmentApplication Amount of Organic Fertilizer/(kg·hm−2)Organic Fertilizer Cost/(yuan·hm−2)Application Amount of
Microbial Fertilizer/(kg·hm−2)
Microbial Fertilizer Cost/(yuan·hm−2)Fertilizer Cost/(yuan·hm−2)Yield/(kg·hm−2)Output Value/(yuan·hm−2)Economic Benefits/(yuan·hm−2)Input–Output Ratio
QCK18,0002440____2440.00 6945.40 19,447.12 17,007.12 6.97
QDY118,00024403.75 108.75 2548.75 6807.67 19,061.47 16,512.72 6.48
QDY218,00024407.50 217.50 2657.50 8025.67 22,471.87 19,814.37 7.46
QDY318,000244011.25 326.25 2766.25 8011.00 22,430.80 19,664.55 7.11
QDY418,000244015.00 435.00 2875.00 8707.67 24,381.47 21,506.47 7.48
QDY518,000244018.75 543.75 2983.75 8509.67 23,827.07 20,843.32 6.99
QHC118,00024403.00 135.00 2575.00 6759.33 18,926.13 16,351.13 6.35
QHC218,00024404.50 202.50 2642.50 6875.67 19,251.87 16,609.37 6.29
QHC318,00024406.00 270.00 2710.00 6932.00 19,409.60 16,699.60 6.16
QHC418,00024407.50 337.50 2777.50 8267.67 23,149.47 20,371.97 7.33
QHC518,00024409.00 405.00 2845.00 8018.67 22,452.27 19,607.27 6.89
Disclaimer/Publisher’s Note: The statements, opinions and data contained in all publications are solely those of the individual author(s) and contributor(s) and not of MDPI and/or the editor(s). MDPI and/or the editor(s) disclaim responsibility for any injury to people or property resulting from any ideas, methods, instructions or products referred to in the content.

