
Assessing the Economic Sustainability of the EU and Romanian Farming Sectors

 ,
,  and
and
Abstract
1. Introduction
- -
- Identify the structural strengths and vulnerabilities of farming sectors in Romania compared to the EU average;
- -
- Provide a solid empirical basis for the formulation of sustainable agricultural policies adapted to the national context;
- -
- Highlight the degree of convergence or divergence in terms of economic sustainability over an extended time frame (2013–2022).
2. Literature Approach to Assessing the Economic Sustainability of the Farming Sectors
2.1. Tools and Methodologies for Assessing the Sustainable Development of the Farming Sectors
2.2. Economic Indicators and Determinants of Farming Sectors’ Sustainability in the EU
3. Materials and Methods
3.1. Methodological Foundations of the Economic Sustainability Assessment of the Farming Sectors
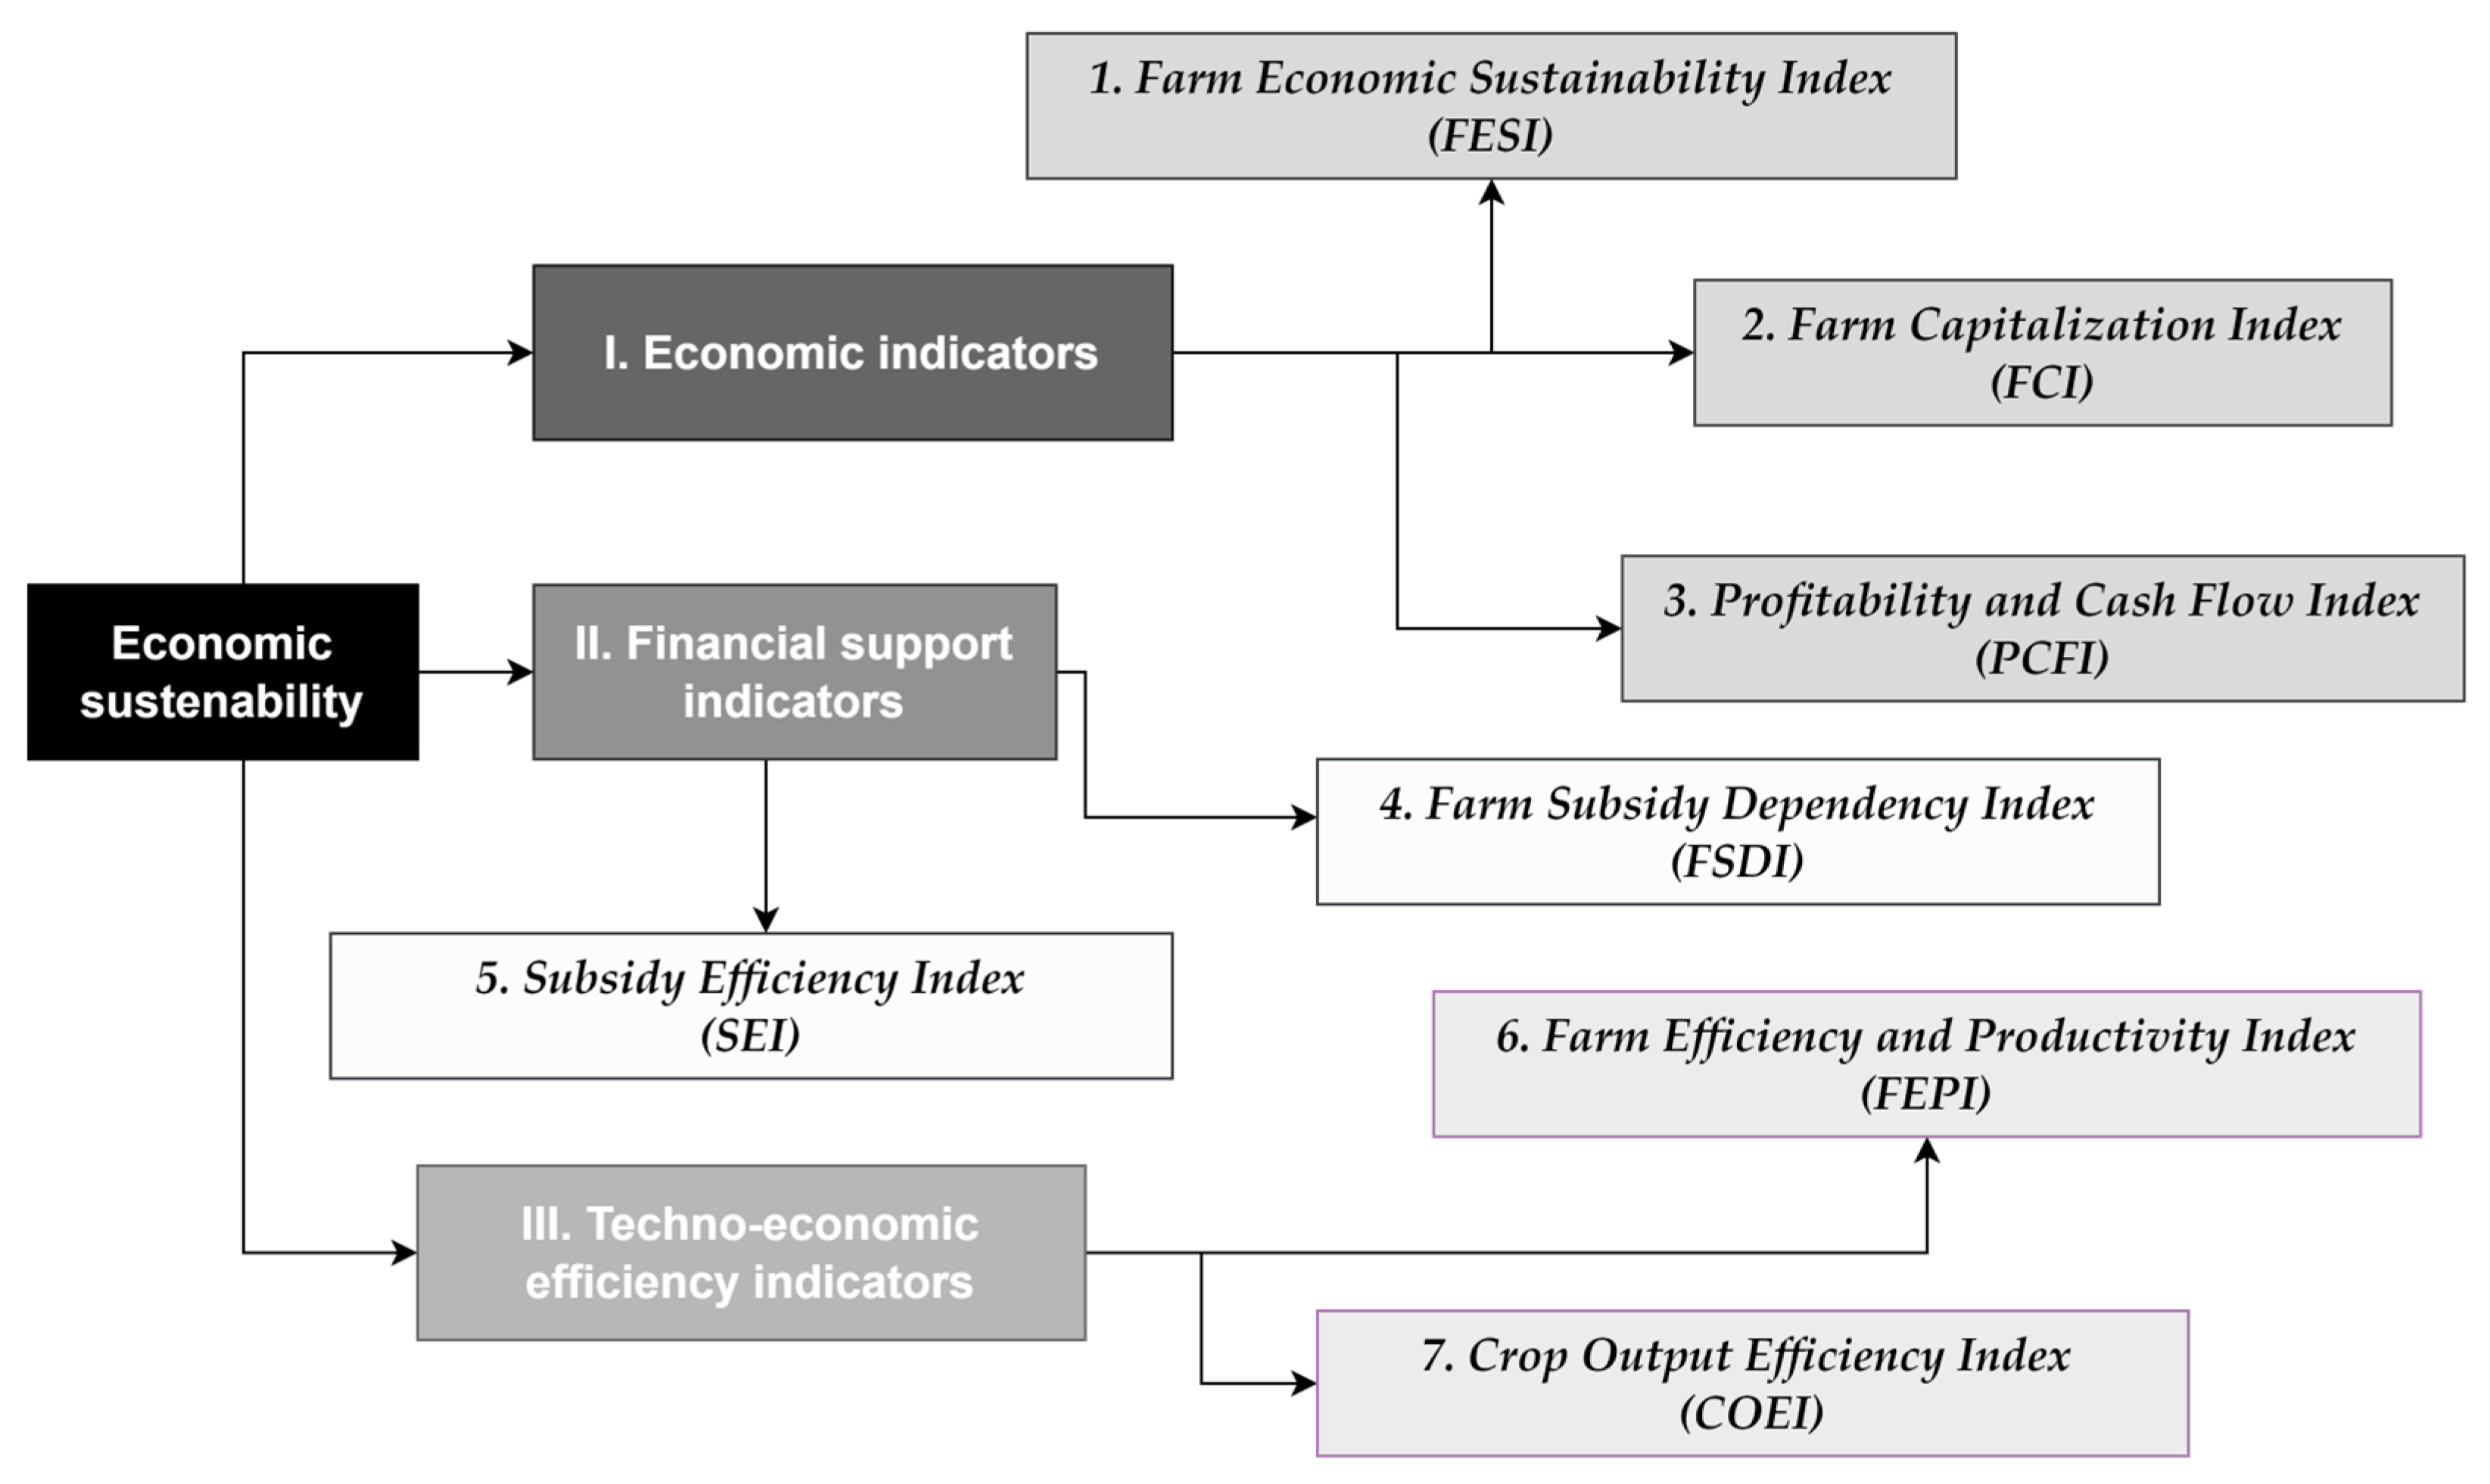
3.2. Analytical Model Based on Indicators for Assessing the Economic Sustainability of Farming Sectors
- Farm Economic Sustainability Index (FESI), reflecting the net income, value added, and profitability of farming sectors, calculated on the basis of the formula
- -
- FFI/FWU—Family Farm Income is expressed per family labor unit and reflects differences in the amount of family labor to be remunerated at the level of each holding;
- -
- FNVA—Farm Net Value Added in agriculture represents the remuneration of fixed factors of production (labor, land, and capital), whether they are family or external. Thus, holdings can be compared regardless of the origin (family or non-family) of the resources used;
- -
- FNI—Farm Net Income includes the payment of family-type factors of production (labor, land, capital), but also the compensation for the risks assumed by the entrepreneur (profit or loss) during an accounting year.
- 2.
- The Farm Capitalization Index (FCI) measures the capacity of farming sectors to accumulate and use capital for investment, with the following formula:
- -
- AFC—Average Farm Capital is the average amount of capital used on the farm, calculated as the arithmetic average between the opening and closing values of the year. This capital includes livestock, permanent crops, land improvements, buildings, machinery and equipment, and circulating capital. Quotas and other regulated rights are not taken into account as their value cannot always be separated from that of the land;
- -
- GIFA—Gross Investment in Fixed Assets is determined by the following formula: purchases of fixed assets minus sales of fixed assets plus change in value of breeding livestock.
- 3.
- Profitability and Cash Flow Index (PCFI) assesses liquidity management and financial risks, calculated according to the following formula:
- -
- Cash Flow (1) operating reflects the farm’s ability to economize and self-finance. It is calculated as the difference between receipts and payments during the accounting year, excluding capital transactions or loans and debts. The indicator is similar to the one used by Eurostat [41] in macroeconomic accounts. The detailed formula is as follows:
- -
- Cash Flow (2) total also expresses the farm’s ability to save and self-finance, but also includes capital and debt transactions. The extended formula is
- 4.
- Farm Subsidy Dependency Index (FSDI), calculated according to the following formula:
- -
- TS(exc1.inv) = Total Subsidies, excluding investment subsidies, represents subsidies granted for current operations related to production, excluding support for investment, also not including payments for cessation of farming activity;
- -
- TDP = Total Direct Payments include EU and national subsidies, both decoupled (not directly linked to production) and coupled (linked to production), excluding those for rural development, cost coverage, or livestock purchase.
- 5.
- Subsidy Efficiency Index (SEI) measures how efficiently subsidies are used to generate value added in farming sectors and is calculated according to the following formula:
- -
- TDP = Total Direct Payments, represents subsidies granted by both the European Union and national authorities, including decoupled (not linked to production) and coupled (linked to production) support. It does not include payments related to rural development, overheads, or animal purchase;
- -
- FNVA = Farm Net Value Added, reflects the remuneration of the fixed factors of production—labor, land, and capital, whether they are owned by the household or external. This indicator makes it possible to compare agricultural holdings irrespective of the family or non-family structure of the resources used.
- 6.
- The Farm Efficiency and Productivity Index (FEPI) shows how efficiently resources are used for agricultural production, with the following calculation formula:
- -
- TOC = Total Output—Crops and Crop Production is calculated as the sum of: realized sales, on-farm internal consumption, and household consumption, plus the difference between the value of stocks at the end and beginning of the accounting year;
- -
- TSC = Total Specific Costs include costs directly related to crop production (seeds and planting material, fertilizers, plant protection products, other crop-specific costs), costs specific to animal husbandry (fodder for grazing livestock and monogastric livestock, other animal-specific costs), and costs specific to secondary agricultural activities.
- 7.
- Crop Output Efficiency Index (COEI) measures the economic efficiency of agricultural land use in crop production, expressing the economic value generated per unit of agricultural area used, with the following calculation formula:
- -
- TCO = Total Crop Output = sales + on-farm consumption + household consumption + (closing value − opening value);
- -
- UAA = Utilized Agricultural Area, in hectares
4. Results
4.1. The Economic Dimension of Sustainability: Analysis of Profitability, Investment Capacity, and Liquidity of Farming Sectors
4.2. The Role of Public Support in Enhancing Sustainability: Economic Dependence on Subsidies and the Efficiency of Their Use
4.3. Technical–Economic Efficiency as a Determinant of Sustainability: Performance Analysis in the Use of Productive Resources
5. Discussion
6. Conclusions
Author Contributions
Funding
Institutional Review Board Statement
Informed Consent Statement
Data Availability Statement
Conflicts of Interest
Abbreviations
| FESI | Farm Economic Sustainability Index |
| FCI | Farm Capitalization Index |
| PCFI | Profitability and Cash Flow Index |
| FSDI | Farm Subsidy Dependency Index |
| SEI | Subsidy Efficiency Index |
| FEPI | Farm Efficiency and Productivity Index |
| COEI | Crop Output Efficiency Index |
Appendix A

| Code | Label | Unit | Description |
|---|---|---|---|
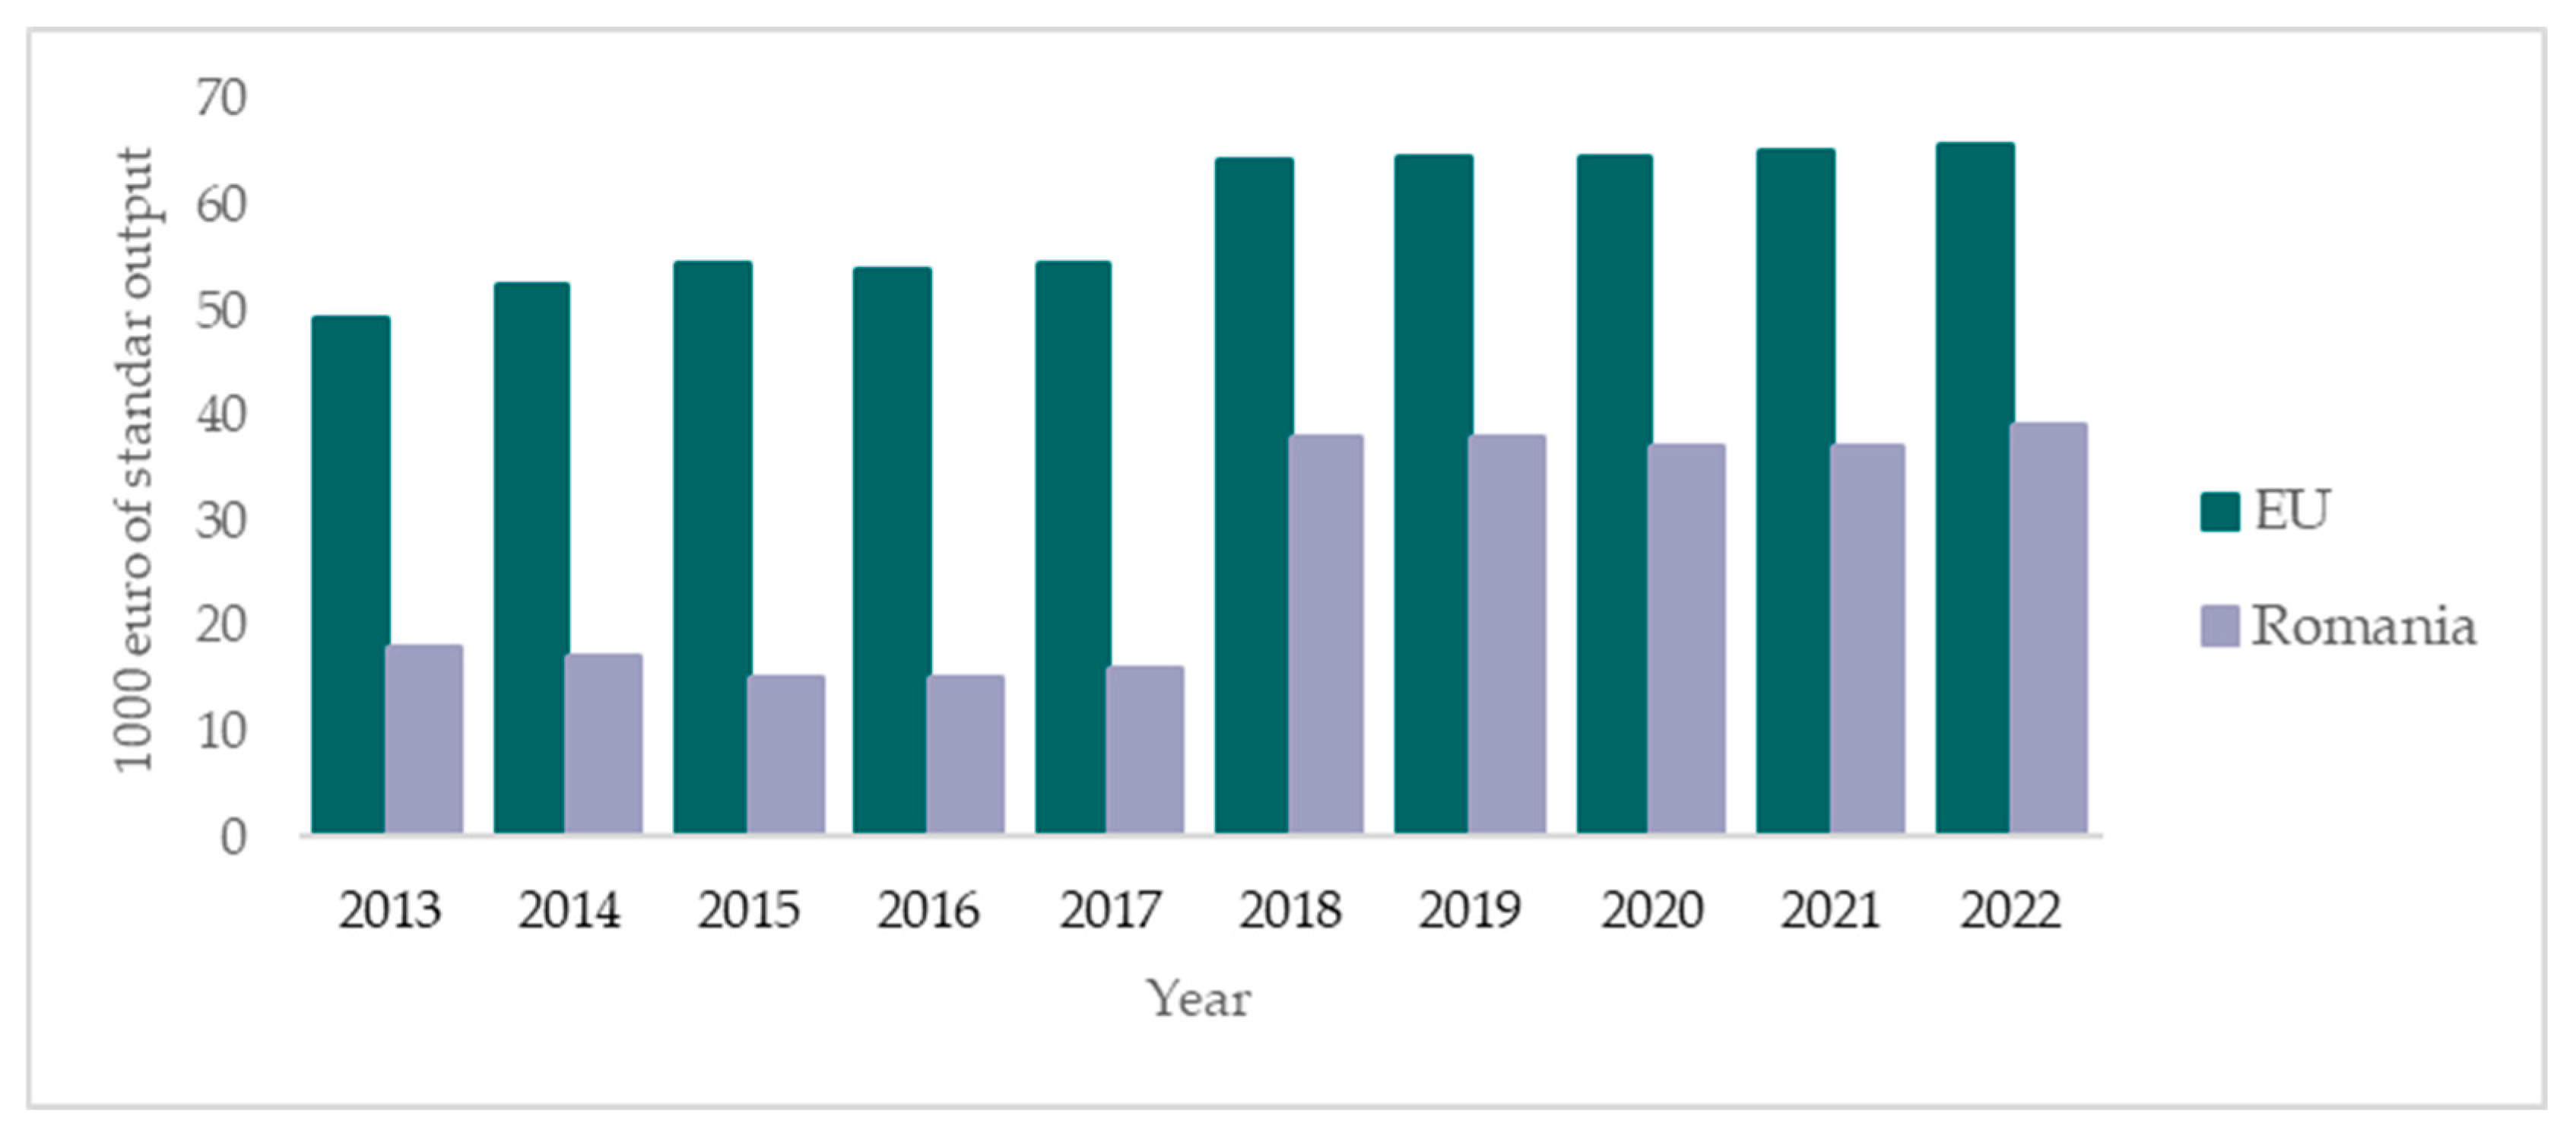
| SE005 | Economic size | EUR’000 | Economic size of holding expressed in 1000 euro of standard output (on the basis of the Community typology). |
| SE415 | Farm Net Value Added | EUR | Remuneration to the fixed factors of production (work, land and capital), whether they be external or family factors. As a result, holdings can be compared irrespective of their family/non-family nature of the factors of production employed. |
| SE420 | Farm Net Income | EUR | Remuneration to fixed factors of production of the family (work, land and capital) and remuneration to the entrepreneur’s risks (loss/profit) in the accounting year. |
| SE425 | Farm Net Value Added/AWU | EUR/AWU | Farm Net Value Added expressed per agricultural work unit (AWU). It takes into account differences in the labor force to be remunerated per holding. SE425 is a weighted mean (average) calculated as a [sum of sample farm incomes × sample farm weights]/[sum of sample farm AWU × sample farm weights]. |
| SE510 | Average Farm Capital | EUR | Average value (=[opening + closing]/2) of farm capital except land and quotas = Livestock + Permanent crops + Land improvements + Buildings + Machinery and equipment + Circulating capital. Not included is the value of quotas and other prescribed rights as it cannot always be dissociated from the value of land. It is calculated only if land capital is recorded separately from the value of buildings. |
| SE516 | Gross Investment on fixed assets | EUR | =Purchases − Sales of fixed assets + breeding livestock change in valuation. |
| SE526 | Cash Flow (1) | EUR | =The holding’s capacity for saving and self-financing. =Receipts − Expenditure for the accounting year, not taking into account operations on capital and on debts and loans. This indicator is close to that used by Eurostat on the basis of macroeconomic accounts. =Net Receipts of Agricultural activity and other Receipts + Balance farm subsidies and taxes + Balance subsidies and taxes on investments =Sales of products + other Receipts + Sales of livestock − All costs paid − Purchases of livestock =Receipts − Expenditure for the accounting year =Net Receipts of Agricultural activity and other Receipts + Balance farm subsidies and taxes + Balance subsidies and taxes on investments =Sales of products + other Receipts + Sales of livestock − All costs paid − Purchases of livestock + Farm subsidies − Farm Taxes + VAT balance + Subsidies on investments − Taxes on investments |
| SE530 | Cash Flow (2) | EUR | =The holding’s capacity for saving and self-financing =Receipts − Expenditure for the accounting year =Net Receipts of Agricultural activity and other Receipts + Balance farm subsidies and taxes + Balance subsidies and taxes on investments + Balance of operations on capital + Balance of operations on debts and loans =Sales of products + other Receipts + Sales of livestock − All costs paid − Purchases of livestock + Farm subsidies − Farm taxes + VAT balance + Subsidies on investments − Taxes on investments + Sales of capital − Investments + Closing valuation of debts − Opening valuation of debts. |
| Code | Label | Unit | Description |
|---|---|---|---|
| SE605 | Total subsidies—excluding on investments | EUR | Subsidies on current operations linked to production (not investments), in EUR. Payments for cessation of farming activities are therefore not included. Entry in the accounts is generally on the basis of entitlement and not receipt of payment, with a view to obtain coherent results (production/costs/subsidies) for a given accounting year. |
| SE606 | Total Direct Payments | EUR | EU and national decoupled and coupled subsidies, except on rural development, costs and purchase of animals. |
| SE610 | Total subsidies on crops | EUR | All farm subsidies on crops, including compensatory payments/area payments, set-aside premiums, aid under Art 68 and other coupled support. |
| Code | Label | Unit | Description |
|---|---|---|---|
| SE135 | Total Output—Crops and Crop Production | EUR | =Sales + farm use + farmhouse consumption + (closing valuation − opening valuation). |
| SE136 | Total crop output/ha | EUR/ha | =[Sales + farm use + farmhouse consumption + (closing valuation − opening valuation)]/ha (excluding area leased out for short period and area out of production). |
| SE281 | Total specific costs | EUR | =Crop-specific inputs (seeds and seedlings, fertilizers, crop protection products, other specific crop costs), livestock-specific inputs (feed for grazing stock and granivores, other specific livestock costs) and specific OGA costs. |
| SE284 | Specific crop costs/ha | EUR/ha | Total specific crop costs i.e., seeds and plants (both, purchased and home-grown), fertilizers, crop protection products and other specific costs related to crop production/Total utilized agricultural area of holding. |
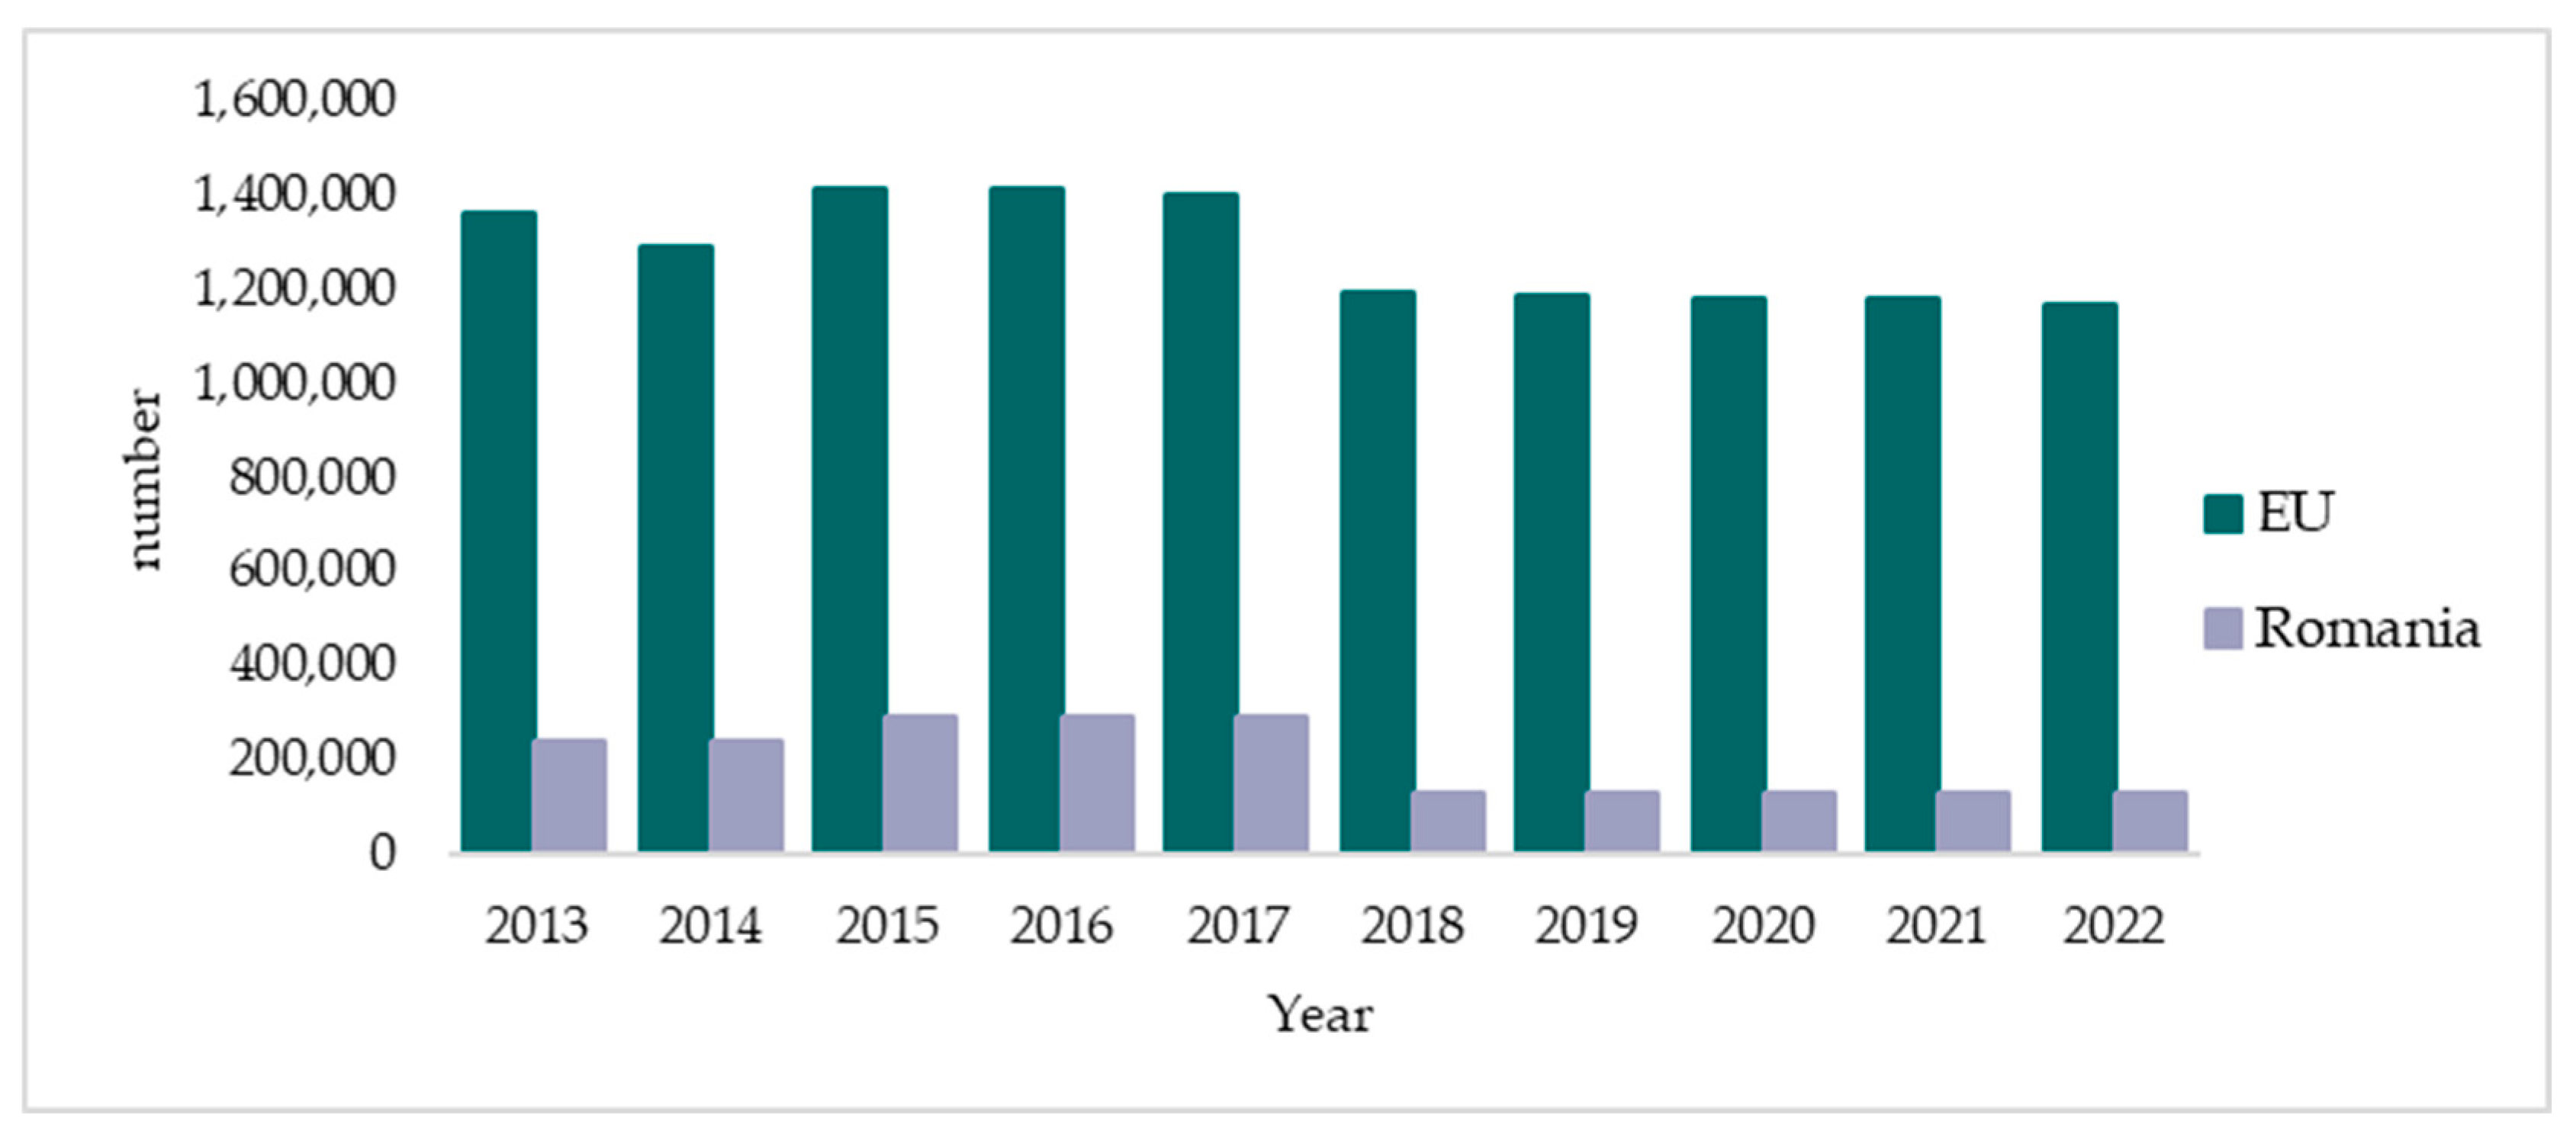
| Year | Types of Farming | Member State | (SYS02) Farms Represented (nb) | (SYS03) Sample Farming Sector |
|---|---|---|---|---|
| 2013 | Fieldcrops | EU | 1,360,834 | 20,000 ≤ 30,000 |
| Romania | 234,582 | 2000 ≤ 3000 | ||
| 2014 | Fieldcrops | EU | 1,289,279 | 20,000 ≤ 30,000 |
| Romania | 234,274 | 1000 ≤ 2000 | ||
| 2015 | Fieldcrops | EU | 1,414,166 | 20,000 ≤ 30,000 |
| Romania | 288,136 | 2000 ≤ 3000 | ||
| 2016 | Fieldcrops | EU | 1,411,357 | 20,000 ≤ 30,000 |
| Romania | 288,158 | 2000 ≤ 3000 | ||
| 2017 | Fieldcrops | EU | 1,398,721 | 20,000 ≤ 30,000 |
| Romania | 288,164 | 3000 ≤ 4000 | ||
| 2018 | Fieldcrops | EU | 1,187,976 | 20,000 ≤ 30,000 |
| Romania | 124,160 | 2000 ≤ 3000 | ||
| 2019 | Fieldcrops | EU | 1,186,122 | 20,000 ≤ 30,000 |
| Romania | 125,898 | 2000 ≤ 3000 | ||
| 2020 | Fieldcrops | EU | 1,178,332 | 20,000 ≤ 30,000 |
| Romania | 127,030 | 2000 ≤ 3000 | ||
| 2021 | Fieldcrops | EU | 1,179,745 | 20,000 ≤ 30,000 |
| Romania | 127,311 | 2000 ≤ 3000 | ||
| 2022 | Fieldcrops | EU | 1,161,684 | 20,000 ≤ 30,000 |
| Romania | 127,886 | 2000 ≤ 3000 |
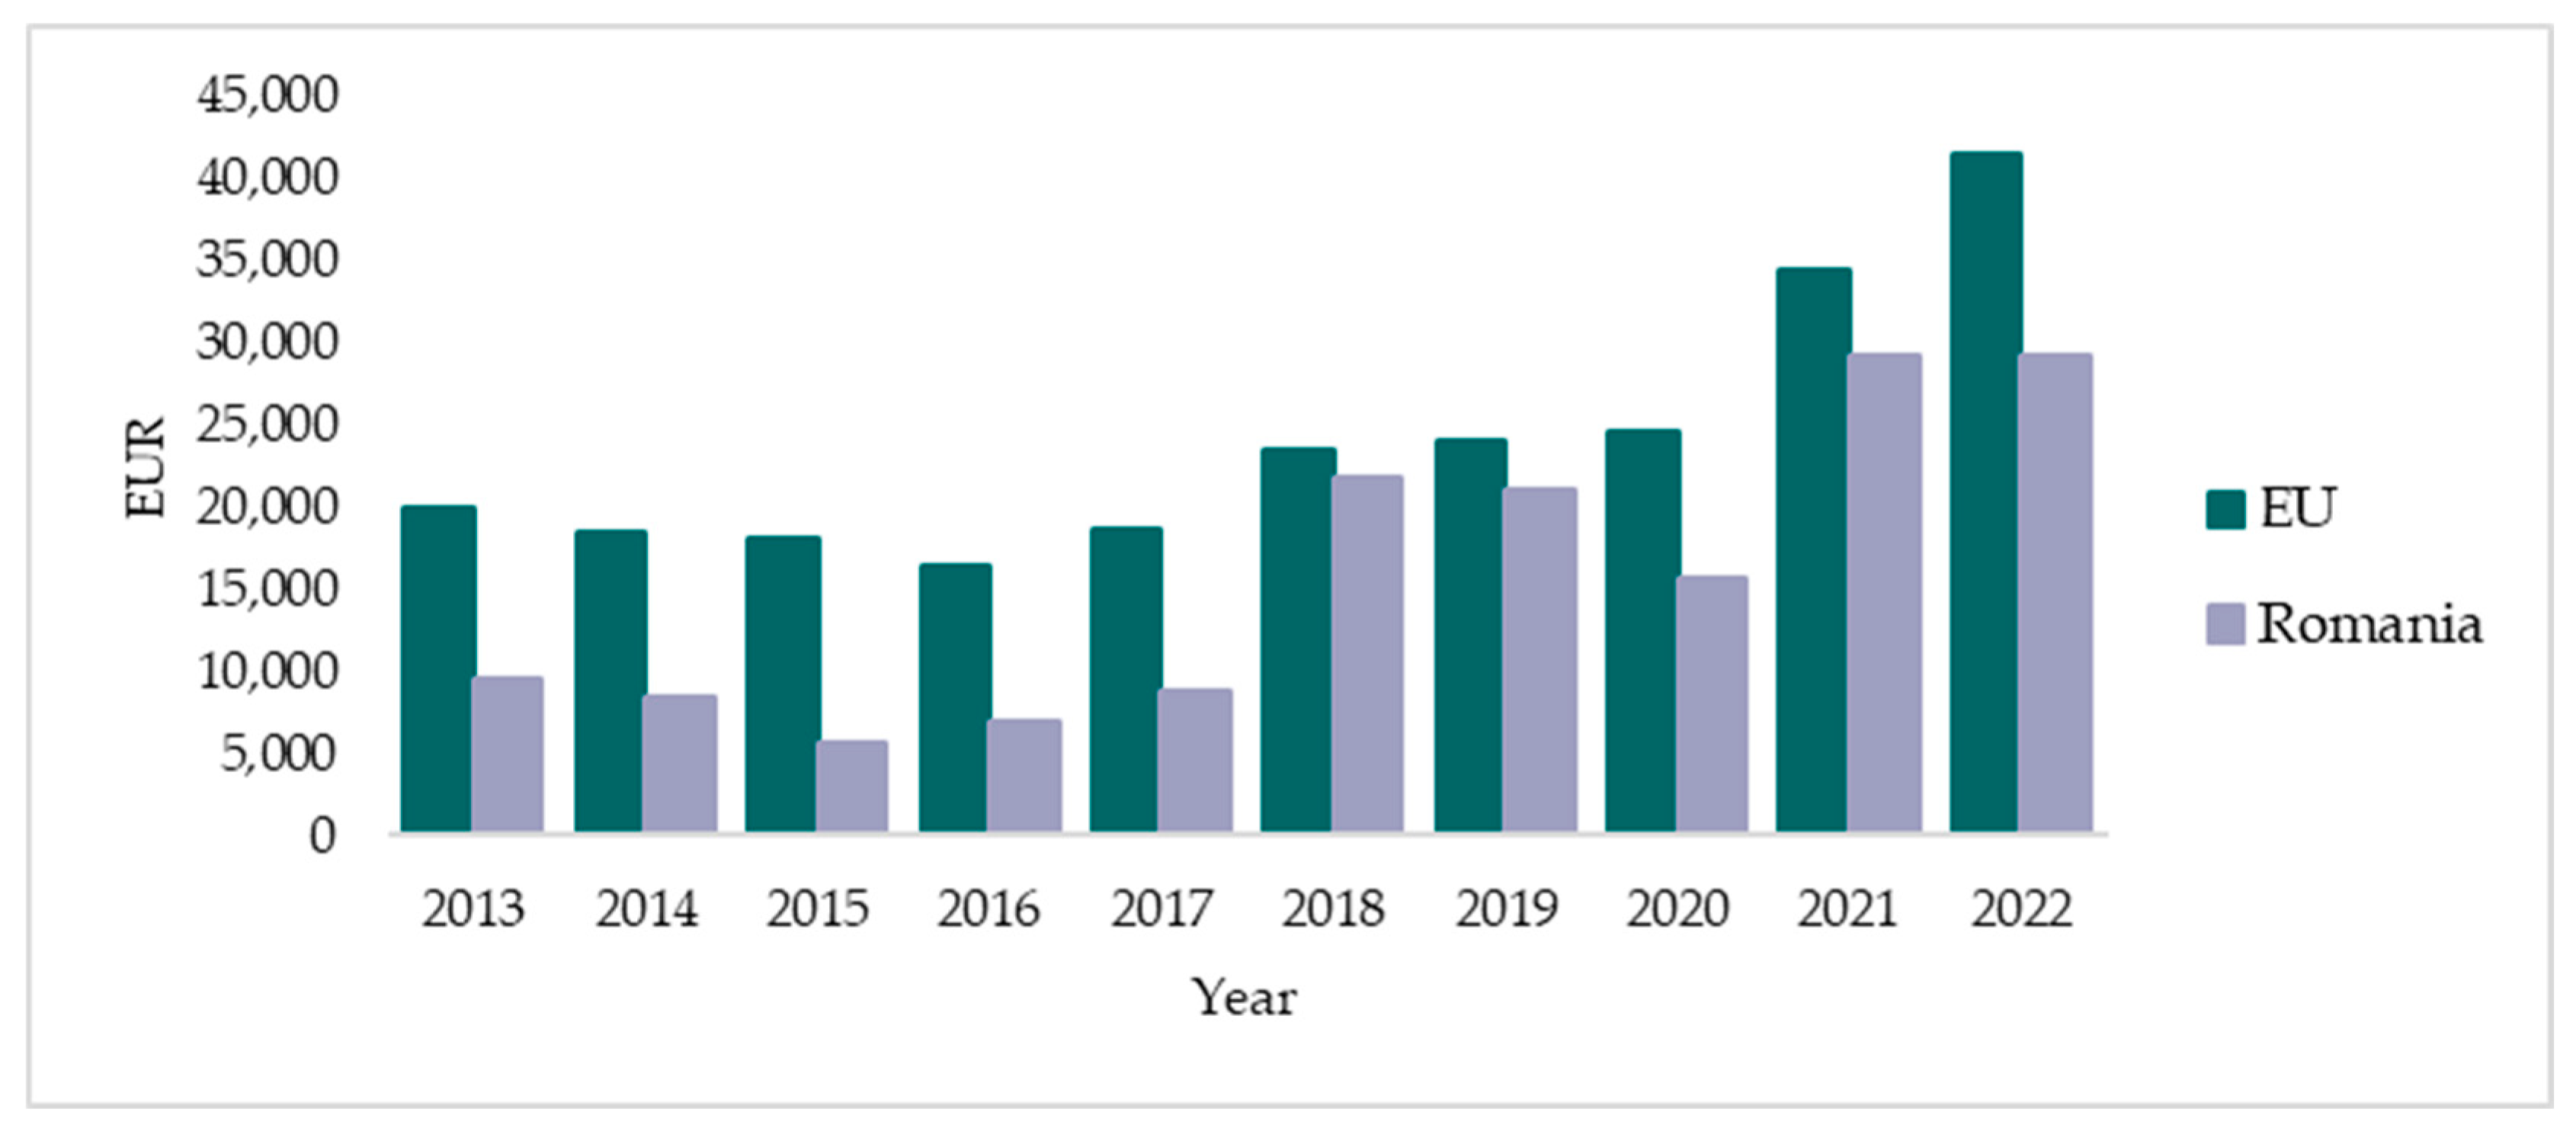
| Year | Member State | (SE005) Economic Size EUR’000 | (SE410) Gross Farm Income (EUR) | (SE415) Farm Net Value Added (EUR) | (SE420) Farm Net Income (EUR) | (SE425) Farm Net Value Added (EUR/AWU) | (SE510) Average Farm Capital (EUR) | (SE516) Gross Investment on Fixed Assets (EUR) | (SE526) Cash Flow 1 (EUR) | (SE530) Cash Flow 2 (EUR) |
|---|---|---|---|---|---|---|---|---|---|---|
| 2013 | EU | 49 | 36,071 | 27,227 | 17,242 | 19,822 | 130,730 | 9440 | 26,347 | 17,946 |
| Romania | 18 | 15,035 | 12,884 | 9549 | 10,255 | 41,460 | 1544 | 11,224 | 9647 | |
| 2014 | EU | 52 | 35,186 | 26,138 | 15,427 | 18,878 | 126,912 | 9012 | 24,350 | 15,472 |
| Romania | 17 | 13,092 | 10,919 | 8010 | 9397 | 39,348 | 1939 | 9553 | 8865 | |
| 2015 | EU | 54 | 33,831 | 25,193 | 14,977 | 18,590 | 120,588 | 9198 | 22,650 | 15,040 |
| Romania | 15 | 9318 | 7187 | 4797 | 6776 | 37,411 | 1555 | 6368 | 5307 | |
| 2016 | EU | 54 | 32,009 | 23,445 | 13,284 | 17,784 | 121,149 | 7722 | 22,306 | 15,969 |
| Romania | 15 | 11,175 | 8726 | 6166 | 8337 | 40,080 | 2399 | 8514 | 7030 | |
| 2017 | EU | 54 | 34,329 | 25,911 | 15,464 | 19,546 | 120,422 | 8205 | 23,020 | 15,915 |
| Romania | 16 | 13,042 | 10,789 | 8177 | 10,086 | 38,329 | 2104 | 10,283 | 8140 | |
| 2018 | EU | 64 | 42,490 | 32,766 | 19,770 | 22,962 | 143,396 | 10,714 | 29,020 | 19,406 |
| Romania | 38 | 32,520 | 28,401 | 20,565 | 20,159 | 80,044 | 4307 | 24,267 | 19,266 | |
| 2019 | EU | 64 | 42,974 | 33,347 | 20,235 | 23,637 | 146,093 | 9390 | 29,227 | 20,307 |
| Romania | 38 | 31,944 | 27,723 | 19,572 | 18,350 | 82,583 | 1338 | 24,096 | 22,753 | |
| 2020 | EU | 65 | 43,431 | 33,811 | 20,748 | 24,278 | 149,716 | 10,327 | 30,334 | 20,848 |
| Romania | 37 | 25,660 | 21,574 | 13,763 | 14,337 | 74,331 | 4899 | 17,563 | 12,857 | |
| 2021 | EU | 65 | 54,302 | 44,578 | 31,003 | 32,002 | 159,755 | 11,702 | 38,173 | 27,863 |
| Romania | 37 | 41,187 | 37,125 | 28,964 | 23,647 | 75,383 | 4265 | 32,657 | 28,940 | |
| 2022 | EU | 66 | 63,152 | 52,761 | 37,792 | 37,894 | 178,464 | 13,798 | 43,246 | 31,144 |
| Romania | 39 | 42,401 | 38,206 | 27,666 | 23,818 | 81,830 | 7871 | 30,472 | 26,864 |
| Year | Member State | (SE135) Total Output—Crops and Crop Production (EUR/Farm) | (SE136) Total Crops Output (EUR/ha) | (SE281) Total Specific Costs (EUR) | (SE284) Specific Crop Costs (EUR/ha) |
|---|---|---|---|---|---|
| 2013 | EU | 50,956 | 1194 | 18,685 | 381 |
| Romania | 21,581 | 794 | 6568 | 234 | |
| 2014 | EU | 51,791 | 1160 | 19,866 | 381 |
| Romania | 20,236 | 761 | 6359 | 233 | |
| 2015 | EU | 49,497 | 1188 | 18,947 | 383 |
| Romania | 15,658 | 729 | 5380 | 242 | |
| 2016 | EU | 46,842 | 1117 | 18,635 | 377 |
| Romania | 16,673 | 757 | 5617 | 246 | |
| 2017 | EU | 48,782 | 1151 | 18,057 | 361 |
| Romania | 18,524 | 814 | 5537 | 235 | |
| 2018 | EU | 59,273 | 1177 | 21,747 | 362 |
| Romania | 44,153 | 817 | 13,598 | 244 | |
| 2019 | EU | 61,141 | 1214 | 22,557 | 376 |
| Romania | 43,104 | 820 | 13,544 | 249 | |
| 2020 | EU | 60,975 | 1208 | 22,195 | 374 |
| Romania | 35,724 | 690 | 13,318 | 251 | |
| 2021 | EU | 75,368 | 1490 | 24,249 | 409 |
| Romania | 54,104 | 1047 | 14,958 | 283 | |
| 2022 | EU | 92,670 | 1781 | 30,957 | 514 |
| Romania | 61,742 | 1134 | 19,857 | 359 |
| Year | Member State | (SE605) Total Subsidies—Excluding on Investments (EUR) | (SE606) Total Direct Payments (EUR) | (SE610) Total Subsidies on Crops (EUR) |
|---|---|---|---|---|
| 2013 | EU | 13,925 | 11,890 | 541 |
| Romania | 4728 | 4431 | 8 | |
| 2014 | EU | 14,120 | 12,053 | 483 |
| Romania | 3899 | 3667 | 14 | |
| 2015 | EU | 12,497 | 10,667 | 658 |
| Romania | 2883 | 2588 | 5 | |
| 2016 | EU | 12,908 | 10,898 | 653 |
| Romania | 3860 | 3514 | 53 | |
| 2017 | EU | 13,152 | 11,014 | 741 |
| Romania | 3939 | 3625 | 236 | |
| 2018 | EU | 15,793 | 12,879 | 799 |
| Romania | 10,649 | 10,271 | 360 | |
| 2019 | EU | 15,804 | 12,914 | 883 |
| Romania | 10,527 | 10,082 | 588 | |
| 2020 | EU | 16,012 | 12,829 | 854 |
| Romania | 10,569 | 9538 | 301 | |
| 2021 | EU | 16,065 | 12,744 | 837 |
| Romania | 10,033 | 9408 | 238 | |
| 2022 | EU | 16,970 | 13,284 | 899 |
| Romania | 10,412 | 9781 | 329 |
| Year | Member State | (SE425) Farm Net Value Added (EUR/AWU) | (SE430) Family Farm Income (EUR/FWU) |
|---|---|---|---|
| 2013 | EU | 19,822 | 15,353 |
| Romania | 10,255 | 6215 | |
| 2014 | EU | 18,878 | 13,844 |
| Romania | 9397 | 6050 | |
| 2015 | EU | 18,590 | 14,238 |
| Romania | 6776 | 4879 | |
| 2016 | EU | 17,784 | 12,567 |
| Romania | 8337 | 5661 | |
| 2017 | EU | 19,546 | 14,622 |
| Romania | 10,086 | 7387 | |
| 2018 | EU | 22,962 | 17,982 |
| Romania | 20,159 | 16,401 | |
| 2019 | EU | 23,637 | 18,628 |
| Romania | 18,350 | 15,565 | |
| 2020 | EU | 24,278 | 19,155 |
| Romania | 14,337 | 11,627 | |
| 2021 | EU | 32,002 | 27,656 |
| Romania | 23,647 | 21,482 | |
| 2022 | EU | 37,894 | 34,033 |
| Romania | 23,818 | 21,914 |
References
- Diogo, V.; Helfenstein, J.; Mohr, F.; Varghese, V.; Debonne, N.; Levers, C.; Swart, R.; Sonderegger, G.; Nemecek, T.; Schader, C.; et al. Developing context-specific frameworks for integrated sustainability assessment of agricultural intensity change: An application for Europe. Environ. Sci. Policy 2022, 137, 128–142. [Google Scholar] [CrossRef]
- Marchand, F.; Debruyne, L.; Triste, L.; Gerrard, C.; Padel, S.; Lauwers, L. Key characteristics for tool choice in indicator-based sustainability assessment at farm level. Ecol. Soc. 2014, 19, 46. [Google Scholar] [CrossRef]
- Slätmo, E.; Fischer, K.; Röös, E. The Framing of Sustainability in Sustainability Assessment Frameworks for Agriculture. Sociol. Ruralis 2017, 57, 378–395. [Google Scholar] [CrossRef]
- Talukder, B.; Blay-Palmer, A. Comparison of Methods to Assess Agricultural Sustainability. In Sustainable Agriculture Reviews; Springer: Berlin/Heidelberg, Germany, 2017. [Google Scholar]
- De Olde, E.; Bokkers, E.A.M.; Boer, I.J.M. The Choice of the Sustainability Assessment Tool Matters: Differences in Thematic Scope and Assessment Results. Ecol. Econ. 2017, 136, 77–85. [Google Scholar] [CrossRef]
- Pretty, J. Participatory Learning for Sustainable Agriculture. World Dev. 1995, 23, 1247–1263. [Google Scholar] [CrossRef]
- Hayati, D.; Ranjbar, Z.; Karami, E. Measuring Agricultural Sustainability. In Biodiversity, Biofuels, Agroforestry and Conservation Agriculture, Sustainable Agriculture Reviews 5; Lichtfouse, E., Ed.; Springer: Berlin/Heidelberg, Germany, 2010. [Google Scholar]
- Hubeau, M.; Marchand, F.; Coteur, I.; Mondelaers, K.; Debruyne, L.; Van Huylenbroeck, G. A new agri-food systems sustainability approach to identify shared transformation pathways towards sustainability. Ecol. Econ. 2017, 131, 52–63. [Google Scholar] [CrossRef]
- Frater, P.; Franks, J. Measuring agricultural sustainability at the farm-level: A pragmatic approach. Int. J. Agric. Manag. 2013, 2, 207. [Google Scholar] [CrossRef]
- Smith, C.S.; McDonald, G.T. Assessing the sustainability of agriculture at the planning stage. J. Environ. Manag. 1998, 52, 15–37. [Google Scholar] [CrossRef]
- Rigby, D.; Woodhouse, P.; Young, T.; Burton, M. Constructing a Farm Level Indicator of Sustainable Agricultural Practice. Ecol. Econ. 2001, 39, 463–478. [Google Scholar] [CrossRef]
- von Wirén-Lehr, S. Sustainability in Agriculture—An Evaluation of Principal Goal-Oriented Concepts to Close the Gap between Theory and Practice. Agric. Ecosyst. Environ. 2001, 84, 115–129. [Google Scholar] [CrossRef]
- Lopez-Ridaura, S.; Masera, O.; Astier, M. Evaluating the sustainability of complex socio-environmental systems: The MESMIS framework. Ecol. Indic. 2002, 2, 135–148. [Google Scholar] [CrossRef]
- Zhen, L.; Routray, J. Operational Indicators for Measuring Agricultural Sustainability in Developing Countries. Environ. Manag. 2003, 32, 34–46. [Google Scholar] [CrossRef] [PubMed]
- Dale, V.; Beyeler, S. Challenges in the development and use of ecological indicators. Ecol. Indic. 2001, 1, 3–10. [Google Scholar] [CrossRef]
- Binder, C.R.; Feola, G.; Steinberger, J.K. Considering the normative, systemic and procedural dimensions in indicator-based sustainability assessments in agriculture. Environ. Impact Assess. Rev. 2010, 30, 71–81. [Google Scholar] [CrossRef]
- Sala, S.; Farioli, F.; Zamagni, A. Progress in sustainability science: Lessons learnt from current methodologies for sustainability assessment: Part 1. Int. J. Life Cycle Assess. 2013, 18, 1653–1672. [Google Scholar] [CrossRef]
- Meulen, H.; Asseldonk, M.; Ge, L. The state of innovation in European agriculture: Innovators are few and far between. Stud. Agric. Econ. 2016, 118, 172–174. [Google Scholar] [CrossRef]
- Asseldonk, M.; Tzouramani, I.; Ge, L.; Vrolijk, H. Adoption of risk management strategies in European agriculture. Stud. Agric. Econ. 2016, 118, 154–162. [Google Scholar] [CrossRef]
- De Olde, E.; Moller, H.; Marchand, F.; McDowell, R.W.; MacLeod, C.; Sautier, M.; Halloy, S.; Barber, A.; Benge, J.; Bockstaller, C.; et al. When experts disagree: The need to rethink indicator selection for assessing sustainability of agriculture. Environ. Dev. Sustain. 2017, 19, 1327–1342. [Google Scholar] [CrossRef]
- Kelly, E.; Latruffe, L.; Desjeux, Y.; Ryan, M.; Uthes, S.; Diazabakana, A.; Dillon, E.; Finn, J. Sustainability indicators for improved assessment of the effects of agricultural policy across the EU: Is FADN the answer? Ecol. Indic. 2018, 89, 903–911. [Google Scholar] [CrossRef]
- Roesch, A.; Nyfeler-Brunner, A.; Gaillard, G. Sustainability Assessment of Farms Using SALCAsustain Methodology. Sustain. Prod. Consum. 2021, 27, 1392–1405. [Google Scholar] [CrossRef]
- Kryszak, Ł.; Guth, M.; Czyżewski, B. Determinants of Farm Profitability in the EU Regions: Does Farm Size Matter? Agric. Econ. 2021, 67, 90–100. [Google Scholar] [CrossRef]
- Vrolijk, H.; Poppe, K. Cost of Extending the Farm Accountancy Data Network to the Farm Sustainability Data Network: Empirical Evidence. Sustainability 2021, 13, 8181. [Google Scholar] [CrossRef]
- Andrejovská, A.; Glova, J. Sustainability of Farms in EU Countries in the Context of Income Indicators: Regression Analysis Based on a New Classification. Agriculture 2022, 12, 1884. [Google Scholar] [CrossRef]
- Domingues Martinho, V.J.P. Profitability and Financial Performance of European Union Farms: An Analysis at Both Regional and National Levels. Open Agric. 2022, 7, 529–540. [Google Scholar] [CrossRef]
- Hloušková, Z.; Lekešová, M.; Prajerová, A.; Doucha, T. Assessing the Economic Viability of Agricultural Holdings with the Inclusion of Opportunity Costs. Sustainability 2022, 14, 15087. [Google Scholar] [CrossRef]
- Xavier, A.; Costa Freitas, M.d.B.; Fragoso, R.; Rosário, M.d.S. Analysing the Recent Dynamics of Agricultural Sustainability in Portugal Using a Compromise Programming Approach. Sustainability 2022, 14, 12512. [Google Scholar] [CrossRef]
- Staniszewski, J.; Guth, M.; Smędzik-Ambroży, K. Structural conditions of the sustainable intensification of agriculture in the regions of the European Union. J. Clean. Prod. 2023, 389, 136109. [Google Scholar] [CrossRef]
- Robling, H.; Abu Hatab, A.; Säll, S.; Hansson, H. Measuring Sustainability at Farm Level—A Critical View on Data and Indicators. Environ. Sustain. Indic. 2023, 18, 100258. [Google Scholar] [CrossRef]
- Bathaei, A.; Štreimikienė, D. A Systematic Review of Agricultural Sustainability Indicators. Agriculture 2023, 13, 241. [Google Scholar] [CrossRef]
- Organisation for Economic Cooperation and Development (OECD). Reconciling New Economies and Societies: The Role of Human and Social Capital (DEELSA/ELSA/ED/CERI/CD(2000)3/REV1). 2001. Available online: https://one.oecd.org/document/DEELSA/ELSA/ED/CERI/CD(2000)3/REV1/en/pdf (accessed on 18 March 2025).
- Cruz, J.F.; Mena, Y.; Rodríguez-Estévez, V. Methodologies for Assessing Sustainability in Farming Systems. In Sustainability Assessment and Reporting; InTech: Houston, TX, USA, 2018. [Google Scholar]
- Scholz, R.W.; Tietje, O. Embedded Case Study Methods: Integrating Quantitative and Qualitative Knowledge; Sage Publications: Thousand Oaks, CA, USA, 2002. [Google Scholar]
- Binder, C.R.; Feola, G. Normative, Systemic and Procedural Aspects: A Review of Indicator-Based Sustainability Assessments in Agriculture. In Building Sustainable Rural Futures: The Added Value of Systems Approaches in Times of Change and Uncertainty; Proceedings of the 9th European IFSA Symposium, Vienna, Austria, 4–7 July 2010; Darnhofer, I., Ed.; Universität für Bodenkultur Wien: Wien, Austria, 2010; pp. 801–811. [Google Scholar] [CrossRef]
- Trigo, A.; Marta-Costa, A.; Fragoso, R. Principles of Sustainable Agriculture: Defining Standardized Reference Points. Sustainability 2021, 13, 4086. [Google Scholar] [CrossRef]
- European Commission. Farm Accountancy Data Network (FADN) Public Database. Available online: https://agridata.ec.europa.eu/extensions/FADNPublicDatabase/FADNPublicDatabase.html (accessed on 20 December 2024).
- European Commission. Description of the Farm Accountancy Data Network (FADN) Public Database. Available online: https://agridata.ec.europa.eu/extensions/FADNPublicDatabase/description.html (accessed on 20 December 2024).
- Manta, A.G.; Doran, N.M.; Bădîrcea, R.M.; Badareu, G.; Gherțescu, C.; Lăpădat, C.V.M. Does Common Agricultural Policy Influence Regional Disparities and Environmental Sustainability in European Union Countries? Agriculture 2024, 14, 2242. [Google Scholar] [CrossRef]
- Kravčáková Vozárová, I.; Kotulič, R.; Vavrek, R. Assessing Impacts of CAP Subsidies on Financial Performance of Enterprises in Slovak Republic. Sustainability 2020, 12, 948. [Google Scholar] [CrossRef]
- Eurostat. EURONA—Eurostat Review on National Accounts and Macroeconomic Indicators 1/2019. Publications Office of the European Union: Luxembourg. 2019. Available online: https://ec.europa.eu/eurostat/documents/3217494/9943511/KS-GP-19-001-EN-N.pdf (accessed on 18 March 2025).
- Ionitescu, S. The role of agriculture in Romania’s economy in the period 2013–2022. Sci. Pap. Ser. Manag. Econ. Eng. Agric. Rural Dev. 2023, 23, 407–418. [Google Scholar]
- Popescu, A.; Tindeche, C.; Marcuta, A.; Marcuta, L.; Hontus, A. Concentration of standard output and number of farms in the European Union based on the economic dimension. Sci. Pap. Ser. Manag. Econ. Eng. Agric. Rural Dev. 2023, 23, 619–626. [Google Scholar]
- Florea, N.V.; Duică, M.C.; Ionescu, C.A.; Duică, A.; Ibinceanu, M.C.O.; Stanescu, S.G. An Analysis of the Influencing Factors of the Romanian Agricultural Output within the Context of Green Economy. Sustainability 2021, 13, 9649. [Google Scholar] [CrossRef]
- Ursu, A.; Petre, I.L. Forecasting the Optimal Sustainable Development of the Romanian Ecological Agriculture. Sustainability 2022, 14, 14192. [Google Scholar] [CrossRef]
- Nowak, A.; Krukowski, A.; Różańska-Boczula, M. Assessment of Sustainability in Agriculture of the European Union Countries. Agronomy 2019, 9, 890. [Google Scholar] [CrossRef]
- Aceleanu, M.I. Sustainability and Competitiveness of Romanian Farms through Organic Agriculture. Sustainability 2016, 8, 245. [Google Scholar] [CrossRef]
- Guth, M.; Smędzik-Ambroży, K.; Czyżewski, B.; Stępień, S. The Economic Sustainability of Farms under Common Agricultural Policy in the European Union Countries. Agriculture 2020, 10, 34. [Google Scholar] [CrossRef]
- Hurduzeu, G.; Pânzaru, R.L.; Medelete, D.M.; Ciobanu, A.; Enea, C. The Development of Sustainable Agriculture in EU Countries and the Potential Achievement of Sustainable Development Goals Specific Targets (SDG 2). Sustainability 2022, 14, 15798. [Google Scholar] [CrossRef]
- Kravčáková Vozárová, I.; Kotulič, R. Exploring the Role of EU Subsidies in Enhancing the Competitiveness of Slovak Farms. Agriculture 2025, 15, 678. [Google Scholar] [CrossRef]
- Barbosa, M.W. Government Support Mechanisms for Sustainable Agriculture: A Systematic Literature Review and Future Research Agenda. Sustainability 2024, 16, 2185. [Google Scholar] [CrossRef]
- Volkov, A.; Morkunas, M.; Balezentis, T.; Šapolaitė, V. Economic and Environmental Performance of the Agricultural Sectors of the Selected EU Countries. Sustainability 2020, 12, 1210. [Google Scholar] [CrossRef]
- Heyl, K.; Ekardt, F.; Sund, L.; Roos, P. Potentials and Limitations of Subsidies in Sustainability Governance: The Example of Agriculture. Sustainability 2022, 14, 15859. [Google Scholar] [CrossRef]
- Boros, A.; Szólik, E.; Desalegn, G.; Tőzsér, D. A Systematic Review of Opportunities and Limitations of Innovative Practices in Sustainable Agriculture. Agronomy 2025, 15, 76. [Google Scholar] [CrossRef]
- Bumbescu, S.S. Assessing sustainable performance in agriculture. Ann. Constantin Brâncuşi Univ. Târgu Jiu 2019, 3, 245–252. [Google Scholar]
- García-Cornejo, B.; Pérez-Méndez, J.A.; Roibás, D.; Wall, A. Efficiency and Sustainability in Farm Diversification Initiatives in Northern Spain. Sustainability 2020, 12, 3983. [Google Scholar] [CrossRef]
- Bobitan, N.; Dumitrescu, D.; Burca, V. Agriculture’s Efficiency in the Context of Sustainable Agriculture—A Benchmarking Analysis of Financial Performance with Data Envelopment Analysis and Malmquist Index. Sustainability 2023, 15, 12169. [Google Scholar] [CrossRef]
- Radlińska, K. Some Theoretical and Practical Aspects of Technical Efficiency—The Example of European Union Agriculture. Sustainability 2023, 15, 13509. [Google Scholar] [CrossRef]
- Leghari, S.J.; Han, W.; Hu, K.; Laghari, Y.; Wei, Y.; Cui, L. What should we do for water security? A technical review on more yield per water drop. J. Environ. Manag. 2024, 370, 122832. [Google Scholar] [CrossRef]
- Spicka, J.; Hlavsa, T.; Soukupova, K.; Stolbova, M. Approaches to Estimation of the Farm-Level Economic Viability and Sustainability in Agriculture: A Literature Review. Agric. Econ. 2019, 65, 289–297. [Google Scholar] [CrossRef]
| Authors | Year | Study Area | Research Methods | Research Data |
|---|---|---|---|---|
| Rigby et al. [11]; Hayati et al. [7] | 2001 | on-farm studies | development of sustainability indices | constructed indices based on yield, profit, crop failure, soil depth, certification, and soil cover |
| von Wirén-Lehr [12] | 2001 | conceptual/theoretical | evaluation of goal-oriented sustainability concepts | assessed 7 goal-oriented concepts using theoretical frameworks; emphasized practical transfer of sustainability paradigms |
| López-Ridaura et al. [13] | 2002 | natural resource systems | attribute-based framework | defined sustainability through attributes like productivity, stability, adaptability, equity, self-empowerment |
| Zhen and Routray [14]; Dale and Beyeler [15] | 2003 | theoretical framework | literature synthesis | proposed criteria for effective sustainability indicators |
| Binder et al. [16] | 2010 | multiple regions | conceptual framework | indicator selection influenced by system characteristics and farm level context |
| Sala et al. [17] | 2013 | sustainability assessment theory | philosophical-methodological analysis | criteria based on ontology, epistemology, methodology; use of CBAs, risk analysis, indicator systems |
| Meulen et al. [18] | 2016 | innovation in agriculture | qualitative assessment | studied innovation as an indicator of competitiveness and sustainability |
| Asseldonk et al. [19] | 2016 | EU agriculture | empirical study using FLINT and FADN | analyzed risk management indicators and integrated FADN and FLINT data |
| De Olde et al. [20] | 2017 | tool development context | indicator evaluation | identified factors influencing indicator choice including user beliefs and institutional compatibility |
| Kelly et al. [21] | 2017 | EU farm level | FADN data analysis | assessed sustainability using FADN data; identified gaps in environmental and social indicators |
| Roesch et al. [22] | 2021 | general farm context | SALCAsustain methodology | developed indicators for profitability, liquidity, and stability using multiple metrics |
| Kryszak et al. [23] | 2021 | EU regions | ROA-based profitability analysis | FADN 2007–2018 data; analyzed equity turnover, debt, specialization and subsidy effect |
| Vrolijk and Poppe [24] | 2021 | EU FADN extension | cost–benefit analysis | analyzed FADN to FSDN cost implications; proposed sample size adjustments for sustainability data |
| Andrejovská and Glova [25] | 2022 | EU countries | linear regression analysis | used FADN 2009–2018 data; analyzed economic/environmental factors on farm income indicators |
| Martinho [26] | 2022 | EU regional/national | descriptive, spatial autocorrelation, regression | FADN 2004–2018 data; examined financial indicators affecting ROA and ROE |
| Hloušková et al. [27] | 2022 | Czech Republic | economic viability index analysis | FADN 2016–2020 data; integrated opportunity costs into economic viability assessment |
| Xavier et al. [28] | 2022 | Portugal | trade-off programming, multivariate analysis | used 2009–2019 census data with HJ-Biplot and cluster analysis to create composite indicators |
| Staniszewski et al. [29] | 2023 | EU regions | cluster analysis | EU agricultural data 2005–2018, structured by 4 clusters based on farming characteristics |
| Robling et al. [30] | 2023 | Sweden (dairy farms) | five-step indicator evaluation | identified 20 indicators across 12 themes; major measurement issues from lack of secondary data |
| Bathaei and Štreimikienė [31] | 2023 | systematic literature review | SALSA and PRISMA methodologies | reviewed 2010–2022 literature; identified 31 economic indicators including productivity and profitability |
Disclaimer/Publisher’s Note: The statements, opinions and data contained in all publications are solely those of the individual author(s) and contributor(s) and not of MDPI and/or the editor(s). MDPI and/or the editor(s) disclaim responsibility for any injury to people or property resulting from any ideas, methods, instructions or products referred to in the content. |
© 2025 by the authors. Licensee MDPI, Basel, Switzerland. This article is an open access article distributed under the terms and conditions of the Creative Commons Attribution (CC BY) license (https://creativecommons.org/licenses/by/4.0/).
Share and Cite
Prigoreanu, I.; Radu, G.; Grigore-Sava, A.; Costuleanu, C.L.; Ungureanu, G.; Ignat, G. Assessing the Economic Sustainability of the EU and Romanian Farming Sectors. Sustainability 2025, 17, 4440. https://doi.org/10.3390/su17104440
Prigoreanu I, Radu G, Grigore-Sava A, Costuleanu CL, Ungureanu G, Ignat G. Assessing the Economic Sustainability of the EU and Romanian Farming Sectors. Sustainability. 2025; 17(10):4440. https://doi.org/10.3390/su17104440
Chicago/Turabian StylePrigoreanu, Ioan, Gabriela Radu, Andreea Grigore-Sava, Carmen Luiza Costuleanu, George Ungureanu, and Gabriela Ignat. 2025. "Assessing the Economic Sustainability of the EU and Romanian Farming Sectors" Sustainability 17, no. 10: 4440. https://doi.org/10.3390/su17104440
APA StylePrigoreanu, I., Radu, G., Grigore-Sava, A., Costuleanu, C. L., Ungureanu, G., & Ignat, G. (2025). Assessing the Economic Sustainability of the EU and Romanian Farming Sectors. Sustainability, 17(10), 4440. https://doi.org/10.3390/su17104440