Article

Key Drivers of Sustainable Marketing in the Chinese Hotel Industry: The Mediating Role of Big Data Applications and Marketing Innovation

1
School of Management and Economics, University of Electronic Science and Technology of China, Chengdu 611731, China
2
Sustainability Competence Centre, Széchenyi Istvàn University, 9026 Győr, Hungary
*
Author to whom correspondence should be addressed.
Sustainability 2025, 17(10), 4425; https://doi.org/10.3390/su17104425
Submission received: 30 January 2025 / Revised: 21 March 2025 / Accepted: 7 April 2025 / Published: 13 May 2025

Abstract

:
The service industry in China faces significant challenges in achieving environmental sustainability, with sustainable marketing emerging as a critical solution. This study aims to develop a comprehensive model combining the Stimulus–Organism–Response (SOR) theory and the Technology Acceptance Model (TAM) theory to analyze the mediating roles of big data applications and marketing innovation in fostering sustainable marketing practices. Using Partial Least Squares Structural Equation Modeling (PLS-SEM) on a sample of 319 service industry professionals in China, this study examines key factors such as environmental responsibility, consumer engagement, and organizational capabilities. The findings reveal that environmental responsibility and consumer engagement have a significant positive impact on sustainable marketing practices, with big data applications and marketing innovation serving as crucial mediators. This research provides valuable insights for service managers in China to align technological advancements and innovative approaches with sustainability objectives. Future research is encouraged to explore other industry-specific factors and extend the findings to different regions.

1. Introduction

Currently, the restaurant and services industry are grappling with significant challenges, including intensified global competition, escalating operational costs, evolving consumer preferences, and volatile market conditions. These challenges have been exacerbated by the emergence of the COVID-19 pandemic. The pandemic has had a profound and far-reaching impact on the global economy, with over 246 million confirmed cases and nearly 5 million fatalities reported worldwide. The restaurant sector, in particular, has incurred substantial financial losses due to uncertain crises, such as COVID-19 [1]. Professional analyses highlight the severe consequences of the pandemic on the restaurant industry, drawing parallels to earlier outbreaks, such as SARS (2002–2003) and H1N1 (2009–2010). However, the magnitude of COVID-19’s impact on the global services sector is unparalleled, with its duration, geographic reach, and economic ramifications surpassing those of previous crises [2,3]. In response to the pandemic, the restaurant industry experienced a sharp decline in revenue, forcing many establishments to implement cost-cutting measures, such as layoffs and reduced working hours [4]. Moreover, recent research underscores that the nature, scale, and intensity of the economic crisis induced by COVID-19 differ significantly from those associated with past global disruptions [1].
Despite the growing importance of sustainability in the restaurant industry, there remains a notable gap in understanding how sustainable marketing practices influence business performance, particularly in the context of big data applications (BDAs). Existing research primarily focuses on the general adoption of sustainable strategies without delving into the specific mechanisms through which BDAs enable sustainability-driven decision-making. In addition, while previous studies have explored the environmental and economic benefits of sustainable marketing, there is limited empirical evidence on its direct impact on consumer preferences and restaurant competitiveness. Unlike prior research that broadly examines sustainability and digital transformation in the service sector, this study uniquely integrates the perspectives of sustainable marketing, big data analytics, and marketing innovation (MI) to propose a novel conceptual framework. By doing so, it offers new insights into how technology-driven sustainable marketing strategies can enhance restaurant competitiveness and customer engagement. Addressing this gap is crucial as it provides insights into how restaurants can leverage BDAs to enhance sustainable practices, align with consumer expectations, and gain a competitive edge in a rapidly evolving market.
Shifting consumer preferences challenge restaurant operators in designing distinctive products and services. From a marketing perspective, sustainable operations are crucial for competitiveness [5]. Studies suggest that consumers are increasingly inclined to choose restaurants that offer sustainable products with minimal environmental impacts [1,6,7]. In addition, reducing waste and offering sustainable products can increase customer approval [1]. Research indicates that adopting sustainable marketing practices in the restaurant industry can not only lower operational costs but also enhance the corporate image and generate positive customer feedback [6,8]. Consequently, sustainability should be leveraged as a competitive advantage to help restaurants stand out in the market.
When stakeholders commit to sustainability and adopt a sustainable marketing approach, they attract environmentally conscious consumers by offering eco-friendly products that help minimize environmental harm [7]. Consumers are increasingly recognizing their role in promoting social and environmental sustainability [5]. Prakash, Sharma [9] notes that sustainability entails reducing resource consumption while maximizing the efficient utilization of available resources. In the restaurant industry, green practices emphasize minimizing natural resource use while delivering goods with a reduced environmental impact [4,7]. Market-oriented businesses are better at identifying and adapting to shifts in customer preferences [1], and with the rising demand for sustainable products and services [9], sustainable marketing companies prioritize the environmental benefits of their offerings to deliver sustainable value to customers [4]. Yet, while research has largely examined the market orientation’s effect on firm performance and decision-making [10,11], there is a noticeable gap in understanding how sustainable marketing influences enterprise behavior in implementing a sustainable marketing mix (SMm), including products, green channels, and promotional strategies.
To meet the growing demand for green-valued goods and services, companies innovate in product design, packaging, and distribution to gain a competitive edge [12]. In the restaurant industry, creative product design can significantly enhance customers’ emotional engagement and subjective experiences [13]. For instance, many eco-friendly restaurants have eliminated the use of disposable cups and takeout containers, appealing to customers with sustainable and environmentally conscious packaging [1]. Esthetic designs also elevate the perceived value and satisfaction [14]. However, operational uncertainties can hinder design innovation [15], and excessive marketing innovations (MIs), such as over-packaging or overdesign, may increase environmental burdens, compromising sustainability [13]. Despite this, little research has explored the effect of MI on big data analytics (BDA) and a company’s willingness to offer sustainable products and services, raising the question: are companies with high levels of MI more inclined to offer sustainable products and services compared to those with lower levels? Exploring the moderating role of MI in this context is both relevant and necessary.
In today’s era of big data, technologies like the internet of things, cloud computing, and online social media platforms have transformed BDA into a central component of the corporate strategy for numerous businesses [16,17]. Within the restaurant industry, known for its extensive and diverse customer base, there is a pressing need for sophisticated systems capable of processing and analyzing consumer preferences and demands effectively [18]. The integration of artificial intelligence has further enabled restaurant managers to harness AI-powered big data analytics (BDA) for improving customer relationship management and gathering detailed customer insights, thereby enabling them to better understand and fulfill customer needs. Despite these advancements, there has been limited research on how restaurant operators utilize big data from an employee-centric perspective to develop sustainable products that serve environmentally conscious consumers while gaining a competitive advantage. This study makes a significant contribution by incorporating the employee perspective, an aspect often neglected in sustainable marketing research. By investigating how employees’ engagement with BDA influences the implementation of sustainable practices, this study provides a more holistic view of the technology’s role in the restaurant industry.
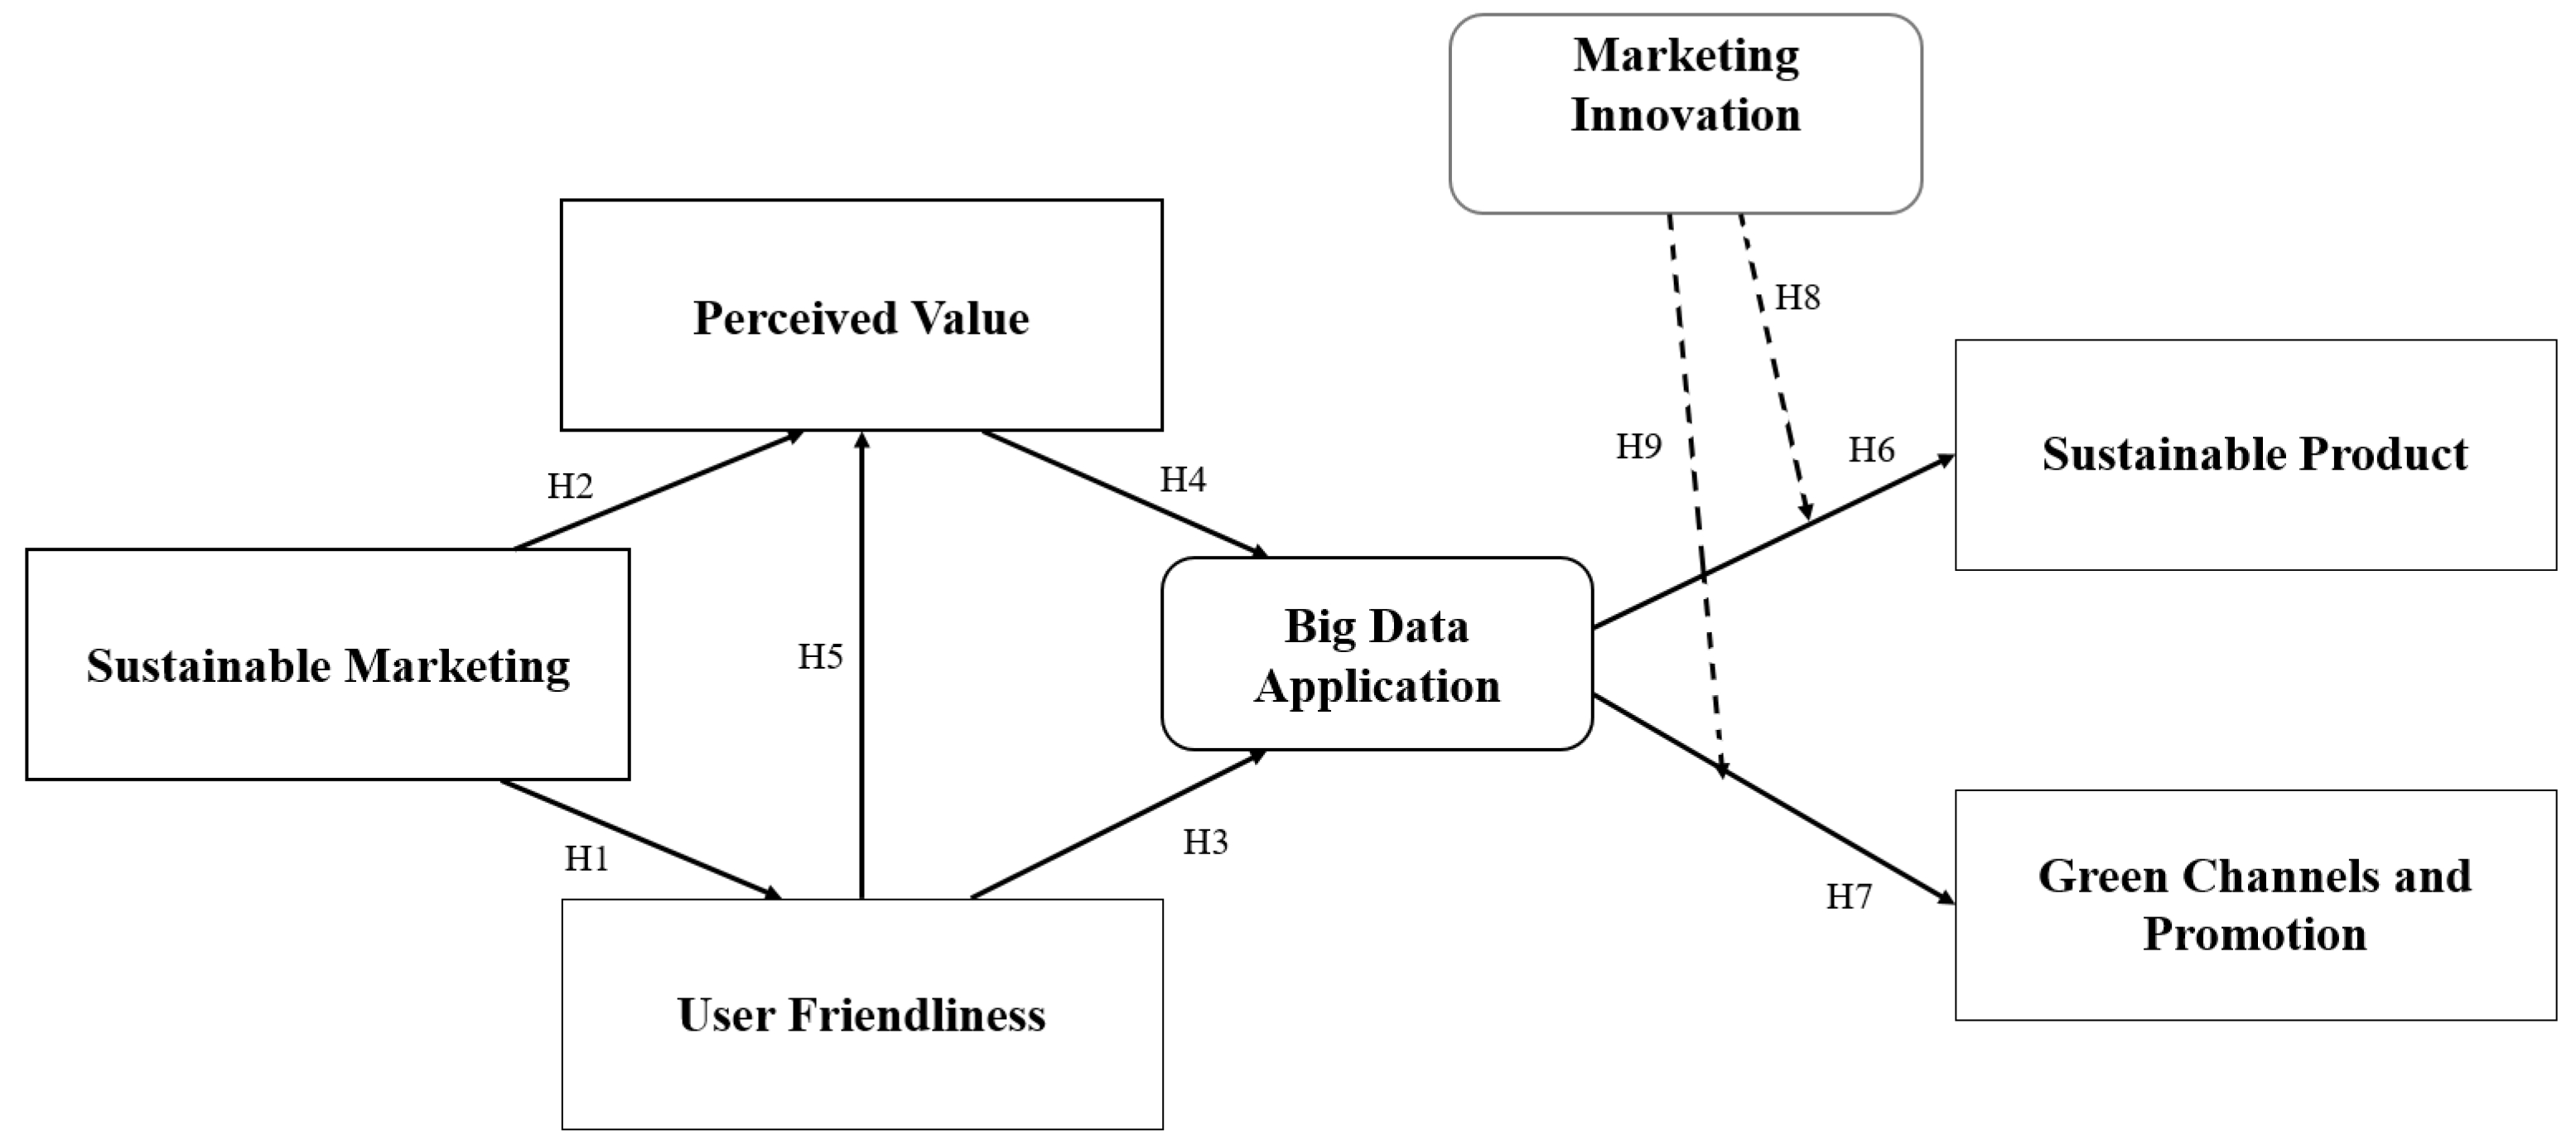
Grounded on the previous discussion, this study proposes the following research objectives. (i) It aims to integrate the perspectives of the Stimulus–Organism–Response (SOR) theory and the Technology Acceptance Model (TAM) theory to investigate the current state of the sustainable marketing. (ii) This study will develop a conceptual framework to guide future research in the restaurant industry, exploring how sustainable marketing drives the adoption of big data technology to meet customer demands and create a SMm. (iii) This study will examine whether the user friendliness and perceived value of BDA serve as intermediary factors influencing the causal relationships between sustainable marketing and the SMm within the restaurant sector. (iv) This research will identify the moderating role of MI in shaping the relationship between the application of big data technologies and the development of a SMm. Finally, this study aims to provide restaurant managers and industry practitioners with a framework to structure and develop the key dimensions necessary for successfully implementing a SMm.

2. Conceptual Framework and Hypotheses Development

2.1. The Stimulus–Organism–Response (SOR) Paradigm

This study used the Stimulus–Organism–Response (SOR) framework. The SOR model posits that environmental stimuli (Ss) trigger internal emotional responses (Os), which subsequently lead to behavioral outcomes (Rs) [19]. Within the services industry, numerous studies have validated the application of the SOR model, particularly in examining the link between environmental factors and customer behavior [20,21]. The SOR theory has also been widely utilized in the service industry to explore various interactions, such as customer–employee relationships, and environmental influences and the interplay between the services and the physical environment [20]. In the wake of the coronavirus outbreak, the adoption of technologies, like the internet, apps, and automated food ordering systems, has significantly increased, driving a higher demand for delivery services. This technological shift has also created opportunities for businesses to leverage big data to examine customer attitudes and behaviors [22]. Studies on SOR-based consumption behaviors indicate that technological advancements enhance consumers’ green trust and promote environmentally responsible behaviors in the restaurant industry [19]. This study leverages the SOR paradigm to examine how sustainable marketing facilitates a marketing mix through the application of big data technology in the restaurant industry. Here, “stimuli” are defined as business attributes, such as green marketing, which influence the “organism” (firms’ state of big data technology usage). These technological states, in turn, lead to “responses”, such as approach or avoidance behaviors, related to sustainable product offerings, pricing strategies, and distribution channels. Notably, this research is among the first to apply the SOR framework to investigate the SMm. Furthermore, it integrates the Technology Acceptance Model (TAM) to highlight the critical role of firms’ big data technology usage in shaping sustainable marketing practices. This dual theoretical perspective underscores the importance of big data as a key enabler for implementing a SMm. Figure 1 represents the conceptual model used for this study.

2.2. Sustainable Marketing, User Friendliness, and Perceived Value (Stimulus)

Environmental concerns are increasingly significant for companies striving to remain competitive in the global market. To achieve better a business performance, organizations are focusing on sustainable business strategies by adopting green marketing practices as a crucial tool [23]. Sustainable marketing serves as a strategic approach that integrates environmental responsibility into business operations, ensuring the alignment with sustainability principles while enhancing the competitive advantage [24]. In recent years, numerous businesses have embraced sustainable development initiatives that not only reduce costs but also demonstrate their commitment to environmental responsibility. This “win–win” approach supports ecological stewardship without compromising human survival or broader societal activities [25]. By adopting a sustainable marketing approach, businesses establish environmental responsibility as a foundation for competitive advantage [24]. Essentially, sustainable marketing fosters a green organizational culture that disseminates environmental values throughout the company [22].
A crucial aspect of sustainable marketing is its ability to enhance the user experience by improving user friendliness and the perceived value. User friendliness refers to the ease with which users can interact with a product, service, or system, ensuring accessibility and simplicity in usage [26]. Sustainable marketing initiatives, such as digitalized green services, environmentally friendly product designs, and a transparent communication about sustainability efforts, can improve user friendliness by making eco-friendly options more intuitive and convenient for customers [27]. Similarly, perceived value refers to the overall assessment of a product or service based on what is received versus what is given [28]. Hong, Choi [28] reported that when companies integrate sustainability into their marketing strategies, they not only fulfill environmental responsibilities but also enhance customer perceptions of value. Consumers increasingly associate green practices with superior quality, ethical responsibility, and long-term benefits, all of which contribute to a higher perceived value of products and services [29].
Through the lens of sustainable marketing, companies can assess the willingness of staff to leverage digital technologies to mitigate environmental impacts. Examples include digital systems that eliminate paper usage, the use of recycled or reusable materials, and adhering to company green policies [23]. Furthermore, companies increasingly integrate their social performance objectives with marketing strategies under the concept of enviropreneurial marketing [24]. Enviropreneurial marketing emphasizes entrepreneurial, environmentally beneficial activities that align with sustainability goals while addressing both economic and social performance objectives [22]. To meet sustainability targets and fulfill customer expectations for sustainable consumption, companies require not only a green marketing orientation but also a spirit of entrepreneurial experimentation within their organizational processes [23]. This is supported by Prakash, Sharma [9], who found that the service industry often adopts innovative practices, ranging from products and management to marketing and manufacturing processes, stemming from environmental stimuli such as sustainable marketing. These innovative actions ultimately enhance competitive strategies and promote sustainability in business operations.
In today’s knowledge-driven society, the successful implementation of sustainable marketing strategies requires leveraging advanced data analytics to enhance decision-making and strategic adaptability [30,31]. The TAM offers a framework for understanding organizations’ willingness to adopt innovative technologies, such as BDA, to enhance their sustainability efforts and achieve a competitive advantage [32]. The TAM suggests that organizations are more likely to adopt new technologies when they perceive them as useful and easy to use [33]. In the context of sustainable marketing, the adoption of BDA can be seen as an organizational response to environmental stimuli, such as green initiatives and eco-friendly marketing strategies [32]. This perception of ease and utility facilitates the integration of BDA into sustainability-driven business models.
In addition, the SOR theory provides a behavioral lens for understanding how external stimuli, like sustainable marketing practices, influence internal cognitive responses (such as attitudes towards sustainability) that lead to specific behavioral outcomes (e.g., technology adoption, improved user friendliness, and perceived value) [20]. According to the SOR model, sustainable marketing initiatives act as stimuli that shape consumer and organizational perceptions, prompting them to engage with and adopt environmentally responsible technologies [29]. These positive perceptions ultimately drive organizational decisions that promote eco-friendly practices and enhance the competitive advantage. Therefore, we propose the following hypotheses:
H1. 
Sustainable marketing is positively linked to user friendliness.
H2. 
Sustainable marketing is positively linked to perceived value.

2.3. BDA and the Technology Acceptance Model (Organism)

Davis [34] claims that the TAM has been widely applied across various fields, including business, information technology, transportation, education, healthcare, and tourism and hospitality. According to this model, employees who are committed to their work performance are more likely to adopt technological systems that enhance their decision-making and improve efficiency. Specifically, if employees observe big data-related technologies as useful and easy to use, they are more inclined to adopt and utilize these systems [35]. Though big data is characterized by its high volume, velocity, and variety—requiring employees to invest additional time in learning its applications—it offers significant advantages for organizations [1]. By improving decision-making efficiency, BDA aligns with the TAM constructs of user friendliness and perceived value [36]. These two factors are foundational antecedents that shape employees’ perceptions of technology adoption [37]. Moreover, research highlights that the influence of perceived value and user friendliness on behavioral intentions varies depending on the nature of the task [38,39]. Given that BDA is integral to the daily responsibilities of employees, these perceptions are critical to shaping their intention to adopt big data technologies. In addition, studies conducted during the COVID-19 pandemic underscore that the simplicity and ease of use of technological applications enhance user acceptance, particularly as these technologies minimize human-to-human contact [40,41]. Therefore, we posit that perceived value and user friendliness significantly contribute to employees’ intention to adopt BDA, ultimately facilitating their integration into organizational processes. Hence, we can propose the following hypotheses:
H3. 
User friendliness is positively associated with BDA.
H4. 
Perceived value is positively associated with BDA.
H5. 
User friendliness is positively related to perceived value.

2.4. Sustainable Marketing Mix (Responses)

To address growing concerns about environmental degradation, businesses are increasingly leveraging big data technologies to innovate and respond effectively to consumer behavior patterns, such as what they purchase, where and how they shop, the quantity they buy, and the motivations behind their purchases [9,42]. In the restaurant industry, for instance, green promotion initiatives are employed to align with sustainability principles and attract environmentally conscious consumers [43]. Sustainable marketing focuses on delivering products and services that embody sustainable value, utilizing key marketing mix elements, such as sustainable products and green channels and promotion [44]. Firms that adopt sustainable marketing strategies gain a competitive edge, particularly by offering unique value to specific market segments [43]. This approach integrates sustainability into the core of marketing processes and business practices, driving the creation and promotion of environmentally friendly products and services. As companies embrace green marketing principles, they are more inclined to implement comprehensive sustainable marketing strategies [44]. In addition, the adoption of BDA enables firms to proactively address environmental challenges and advance sustainable marketing concepts [9]. When business minimize packaging waste and opt for recycled materials that align with sustainable consumption practices, consumers are more likely to pay premium prices for environmentally friendly products [43]. Notably, this study consolidates green channels and promotion and places them into a single dimension; as in practical scenarios, promotional activities are often integrated with distribution channels rather than treated as separate elements. Unlike product and price, which possess distinct characteristics in the marketing mix, promotion and place frequently overlap, especially in the service industries [44]. Thus, this study combines these two variables to reflect the practical business operations of companies. In summary, leveraging BDA, we hypothesize that companies will adopt a SMm, encompassing sustainable products and green channels and promotions, to cater to the interests of key stakeholders. Based on this, we propose the following hypotheses:
H6. 
Big data applications are positively associated with the development of sustainable products.
H7. 
Big data applications are positively associated with green channels and promotion efforts.

2.5. Moderating Role of Marketing Innovation

A company’s level of innovation plays a crucial role in its willingness to adopt big data technologies to address the demands of a sustainable environment [1]. Numerous studies in the services industry highlight the significance of innovative technologies [45,46,47]. For instance, companies can develop new online ordering platforms to deliver cutting-edge sustainable products, thereby gaining a competitive edge [48]. Highly innovative firms are better equipped to adapt to globalization and shifting consumption trends, allowing restaurant businesses to leverage big data to analyze customer consumption patterns. This enables them to innovate and enhance their offerings, including dishes, packaging, and production processes [47]. Moreover, companies can employ various innovative approaches to promote sustainability. For example, social media and digital tools can be used to share information with consumers about new green product combinations, discounts, or sustainable designs [47], as well as environmentally friendly gift ideas [24]. Research on green practices in the restaurant industry further suggests that the perceived innovation by owners or managers has a direct positive impact on their attitudes and encourages the adoption of sustainable practices [22,40]. Based on this, we propose that the degree of innovation within a company moderates the relationship between BDA and the SMm, including sustainable products and green channels and promotions. Therefore, we hypothesize the following:
H8. 
MI plays a moderating role in the relationships between BDA and sustainable products.
H9. 
MI plays a moderating role in the relationships between big data applications and green channels and promotions.

3. Methodology

3.1. Sample Size and Data Collection Procedure

This research aims to investigate a conceptual model for applying big data in sustainable marketing within the restaurant industry. Given that the use of big data in the restaurant industry is still in its early stages, particularly during the pandemic, conducting probability sampling presents significant challenges. Henseler, Ringle [49] recommended the use of nonprobability convenience sampling, which has been adopted in this study. The sampling process follows the methodologies suggested by Iqbal, Moleiro Martins [50], whose research focuses on practices in the service industry. Initially, this study targets chain restaurant businesses, including fast food outlets, and beverage shops, which have been featured in media reports for their BDA and sustainability initiatives. The respondents were employees working in various roles within chain restaurants, including managerial staff, marketing personnel, and frontline service workers. Their direct involvement in restaurant operations and sustainability initiatives made them well positioned to provide relevant insights for this study. To collect data, questionnaire links with QR codes were distributed to employees of these firms, inviting them to complete the survey online. Respondents who successfully submitted the survey were rewarded with a gift voucher worth RMB 20, and participation was entirely voluntary. The required sample size was determined based on guidelines from Henseler, Ringle [49], which suggest a minimum sample size of 10 times the number of parameters in the study. Since the questionnaire includes over 20 items, the sample size was calculated to ensure that this minimum threshold was met. To minimize the impact of invalid responses on the results, approximately 350 questionnaires were distributed. Before distribution, an online ethics review discussion was conducted with one professor, one associate professor, and three doctoral-level scholars. This review ensured that the research plan posed no unexpected issues. Moreover, a pre-test was conducted with 50 students from a hospitality management department at a university in Shanghai, China. These students, all of whom had at least one year of internship experience, were asked to complete the questionnaire to confirm the clarity and comprehensibility of its semantics and content. Data for this study were collected over a three month period, from September to November 2024, using a nonprobability convenience sampling method.
A total of 350 questionnaires were distributed, all of which were returned. After excluding incomplete or blank questionnaires, 319 valid responses were retained for analysis, yielding a response rate of 91.1%. To assess whether the sample represents the broader population of restaurant employees engaged in sustainable marketing, demographic characteristics were analyzed using a sample of responses collected through the questionnaire survey from different locations. This analysis helped identify potential biases in the sample composition and ensured that key demographic attributes, such as gender, age, education, and work experience, aligned reasonably with industry trends. In terms of participant demographics, 147 respondents (46.1%) were male, and 172 (54%) were female. The majority of participants were between 20 and 30 years old (65%). The academic qualifications of the respondents were as follows: 49 (15%) held an undergraduate degree, 112 (35%) held a bachelor’s degree, and 158 (50%) held a postgraduate degree, predominantly in business-, hospitality-, or marketing-related fields. Furthermore, 45 respondents (14%) had less than 2 years of work experience, 183 (57%) had 3–5 years of experience, and 91 (29%) had more than 5 years of experience in the restaurant industry (see Table 1), indicating a level of familiarity with big data applications and marketing innovation.

3.2. Measurement

This study employed reflective measures to operationalize the key constructs. To ensure construct validity, item scales that were well established in the literature were utilized. Responses were measured on a 5-point Likert scale, ranging from 1 (strongly disagree) to 5 (strongly agree). Sustainable marketing was adapted from the scale developed by Chung [23]. It measures sustainable practices focused on three primary groups: employees, customers, and society. The constructs of perceived value and user friendliness were derived from the TAM developed by Davis [34] and were measured using four items, respectively. The construct of BDA was adapted from the study by Chou, Horng [1] and was measured using four items. The SMm consisted of two components: sustainable products, assessed with four items, and green channels and promotions, evaluated by five items. MI evaluated the extent to which companies implemented innovations across various domains, including product appearance and esthetics, packaging, distribution or placement methods, pricing strategies, communication techniques for promotion, and new sales channels. The five items were adapted from [51] to assess this construct.
The core variables in this research are developed from the previous literature to ensure theoretical and empirical validity. Sustainable marketing represents a company’s dedication to environment-friendly measures, while perceived value and user friendliness shape customer preferences. Big data application enhances decision-making by leveraging consumer insights, directly impacting sustainable product development and green channel and promotion strategies. Marketing innovation moderates these relationships by determining how novel marketing approaches amplify or hinder sustainability efforts. These variables are crucial in testing the suggested hypotheses since they fit with the Stimulus–Organism–Response (SOR) and Technology Acceptance Model (TAM) theories, allowing for simultaneous assessment of direct and indirect effects via PLS-SEM.

4. Data Analysis

In order to provide evidence of the robustness of the results, several procedures were followed to mitigate endogeneity concerns. The common method bias (CMB) was addressed, given that the data collection relied on a questionnaire. Harman’s single-factor test was performed, and the variance inflation factors (VIFs) were assessed, confirming that the CMB did not significantly impact the findings. Omitted variable bias is recognized as a limitation, as explicit control variables were not included. However, this study is built on a strong theoretical foundation and employs validated measurement scales, enhancing the reliability of the model. While this study does not explicitly address reverse causality, the theoretical framework supports the proposed causal relationships. Overall, the methodological measures implemented in this study effectively mitigate endogeneity concerns, ensuring the validity and reliability of the findings.

4.1. Common Method Bias (CMB)

Common method bias can arise when data are collected using a cross-sectional technique [52]. To detect potential CMB, two commonly used statistical methods were employed: Harman’s single-factor test [53] and the collinearity detection test [54]. First, Harman’s single-factor test was conducted, revealing that the seven factors extracted explained 43.40% of the total variance, which is below the acceptable threshold of 50%. Next, in line with Kock’s [54] suggestion, the CMB was further assessed through collinearity using the variance inflation factor (VIF), a widely used approach in social science research [55]. The results showed that all VIF values were below the 3.3 threshold [56], indicating that CMB is not a significant issue in the dataset.

4.2. Measurement Model

To evaluate convergent validity, the measurement model was first analyzed. This involved examining factor loadings, Composite Reliability, and Average Variance Extracted. As shown in Table 2, all item loadings were above the recommended threshold of 0.6 [57]. The Composite Reliability values, which represent the extent to which the construct’s indicators measure the underlying latent construct, exceeded the recommended benchmark of 0.7. Similarly, the AVE, which indicates the proportion of variance in the indicators explained by the latent construct, surpassed the recommended threshold of 0.5 [58].
The subsequent step involved evaluating discriminant validity, which assesses the degree to which a construct is distinct from other constructs by exhibiting low correlations with measures of unrelated constructs. Table 3 demonstrates that the square root of the AVE (diagonal values) for each construct exceeds its corresponding correlation coefficients, indicating a sufficient discriminant validity [59].
However, recent critiques of the Fornell and Larcker [59] criterion argue that it may not consistently identify issues with discriminant validity in typical research scenarios [60]. To address these concerns, Henseler and Fassott [60] proposed the heterotrait–monotrait (HTMT) ratio of correlations, based on the multitrait–multimethod matrix, as a more robust alternative. The discriminant validity was reassessed using this approach (see Table 4). According to the first criterion, an HTMT value exceeding 0.85 indicates a potential issue with discriminant validity [61]. As given in Table 4, all HTMT values were below the threshold, confirming an adequate discriminant validity.

4.3. Structural Model

Hair, Ringle [58] recommended evaluating the structural model by examining the R2, beta coefficients, and their corresponding t-values using bootstrapping with 5000 resamples. They also advised reporting the predictive relevance (Q2) and effect sizes (f2) in addition to these basic measures.

Direct Relationships

Initially, the direct relationships between variables were examined. As given in Table 5, the analysis confirms that sustainable marketing exerts a substantial and statistically significant influence on key outcome variables. Specifically, sustainable marketing has a significant and positive impact on user friendliness (b = 0.549; p < 0.00) and perceived value (b = 0.141; p < 0.03). This suggests that organizations adopting sustainable marketing strategies can enhance user perceptions of ease of use and the overall value of their offerings. Furthermore, both user friendliness and perceived value significantly and positively influenced BDA (β = 0.178 and p < 0.01; β = 0.168 and p = 0.01, respectively). These findings indicate that when users perceive a system as user-friendly and valuable, they are more likely to engage with BDA tools, leading to improved data-driven decision-making processes. The relationship between user friendliness and perceived value also showed a significant and positive effect (β = 0.593; p < 0.01). This emphasizes the importance of designing intuitive and accessible platforms to maximize user engagement and satisfaction. Additionally, BDA demonstrated a significant positive impact on sustainable products (β = 0.510; p < 0.01) and on green channels and promotional strategies (β = 0.568; p < 0.01). These results suggest that organizations leveraging BDA not only improve their sustainable product offerings but also optimize their green marketing efforts, reinforcing their commitment to environmental responsibility. Figure 2 represents the value of R2 in our research model.
Next, we evaluated the effect sizes (f2). While p-values indicate the statistical significance of relationships, they do not provide information about the magnitude of an effect, which can make it difficult for readers to interpret the findings. Therefore, it is essential to report both statistical significance (p) and substantive significance (f2). Hair, Ringle [58] also recommended examining changes in R2 values to understand the effect size. To measure effect sizes, Cohen’s [25] guidelines were applied, where values of 0.02, 0.15, and 0.35 indicate small, medium, and large effects, respectively. As shown in Table 5, all relationships in this study demonstrated a medium effect size, suggesting that the predictor variables have a meaningful influence on their respective dependent variables. This medium effect size aligns with prior research in sustainable business and marketing, reinforcing the practical significance of the findings.
In addition to R2 and f2, the predictive sample reuse technique (Q2) was used to assess predictive relevance [57]. The Q2 value, derived through the blindfolding procedure, indicates the model’s ability to empirically reconstruct data using its parameters. For this study, the Q2 was calculated using cross-validated redundancy procedures. A Q2 value greater than 0 indicates that the model has predictive relevance, while a Q2 value less than 0 suggests a lack of predictive relevance. As shown in Figure 2, the Q2 values for both endogenous variables demonstrate an acceptable predictive relevance. This suggests that the proposed model effectively predicts sustainability outcomes, supporting its robustness and applicability in guiding future decision-making in sustainable marketing strategies.

4.4. Control Variables

To further reinforce the validity of our model and mitigate a potential omitted variable bias, we included several demographic control variables in our analysis: age, gender, experience, and academic qualification. These variables were included in the structural model to assess whether they had any statistically significant influence on the key endogenous constructs. The results show that none of the control variables had a statistically significant effect on the model’s dependent variables. This suggests that the relationships posited in our conceptual framework are not confounded by the demographic characteristics of the respondents (Table 6).

4.5. Moderation Analysis

This study proposed that MI moderates the relationships between BDA, sustainable products, and green channels and promotion. A moderation analysis was conducted using the PLS product-indicator approach. According to Chin, Marcolin [62], the PLS method provides more accurate estimates of moderation effects by accounting for the error attenuation in estimated relationships, thereby enhancing the validation of theoretical models [60].
As shown in Table 7, the standardized path coefficients for the moderating effect of MI were significant for both sustainable products (β = 0.240; p < 0.01) and green channels and promotion (β = 0.200; p < 0.01). Consequently, H8 and H9 were supported. These findings indicate that when organizations effectively leverage Market Intelligence, the positive impact of big data analytics on sustainability-oriented business strategies is amplified. Specifically, firms with strong Market Intelligence capabilities can better translate BDA insights into actionable strategies, leading to more effective sustainable product innovations and optimized green marketing initiatives.

4.6. Endogeneity Assessment

To check the robustness and validity of our structural model, the Gaussian copula approach was employed to examine any possible endogeneity in key relationships. This technique allows the detection of any hidden correlations between explanatory variables and the model’s error terms, therefore addressing concerns related to the omitted variable bias and reverse causality [63].
As given in Table 8, the results of these tests clearly show a non-significant relationship between BDA and marketing innovation and the error terms of their respective dependent variables, sustainable products and green channels and promotion. For the relationship between BDA and sustainable products, the Gaussian copula coefficient is β = −0.029 (p = 0.877), which suggests that there is no significant correlation between BDA and the error term of the sustainable product variable. This suggests that the path from BDA to the sustainable product is robust and not affected by omitted variables or reverse causality. Moreover, for the path of BDA to green channels and promotion, the coefficient is β = 0.033 (p = 0.894), further confirming the lack of endogeneity. A high p-value strengthens our confidence that the positive impact of big data applications on green channels and promotion is genuine and is not spuriously affected by other unmeasured factors or reverse effects.
Moreover, the ability of marketing innovation to predict sustainable products (β = 0.020; p = 0.652) also reflects an insignificant correlation with residual errors. This strongly implies that the relationship of marketing innovation to sustainable products is well specified, being free from serious reverse causality or omitted variable bias. Finally, in the marketing innovation–green channels–promotion nexus, the Gaussian copula coefficient is β = 0.005 (p = 0.555), thus confirming negligible endogeneity concerns. Therefore, these findings demonstrate compelling evidence that neither omitted variable bias nor reverse causality adversely influences any of the core pathways examined in our research model. Thus, the relationships put forward in our conceptual framework, supported by empirical analysis, are established to be well founded, credible, and robust [64].

5. Discussion and Conclusions

This study presents a comprehensive analytical framework integrating the Stimulus–Organism–Response model with the Technology Acceptance Model to deepen our understanding of the SMm in the restaurant industry. It proposes a novel causal model where the adoption of BDA technology is influenced by sustainable marketing as a key stimulus factor. Within this framework, sustainable marketing acts as the initial stimulus (S), triggering emotional responses (Os) among employees in terms of their perceived value and the user friendliness of BDA. These emotional responses, in turn, drive behavioral outcomes (Rs) related to the SMm, ultimately encouraging the adoption of BDA. Given the crucial role of BDA in the restaurant sector, this study identifies user friendliness and perceived value as critical antecedents to employees’ acceptance and utilization of these technologies. The findings suggest that BDA positively contributes to the SMm by enhancing operational and strategic decision-making. Moreover, this study hypothesizes that MI moderates the relationship between BDA and the SMm. In this context, MI intensifies the positive impact of BDA, reinforcing its importance in achieving sustainable marketing objectives.
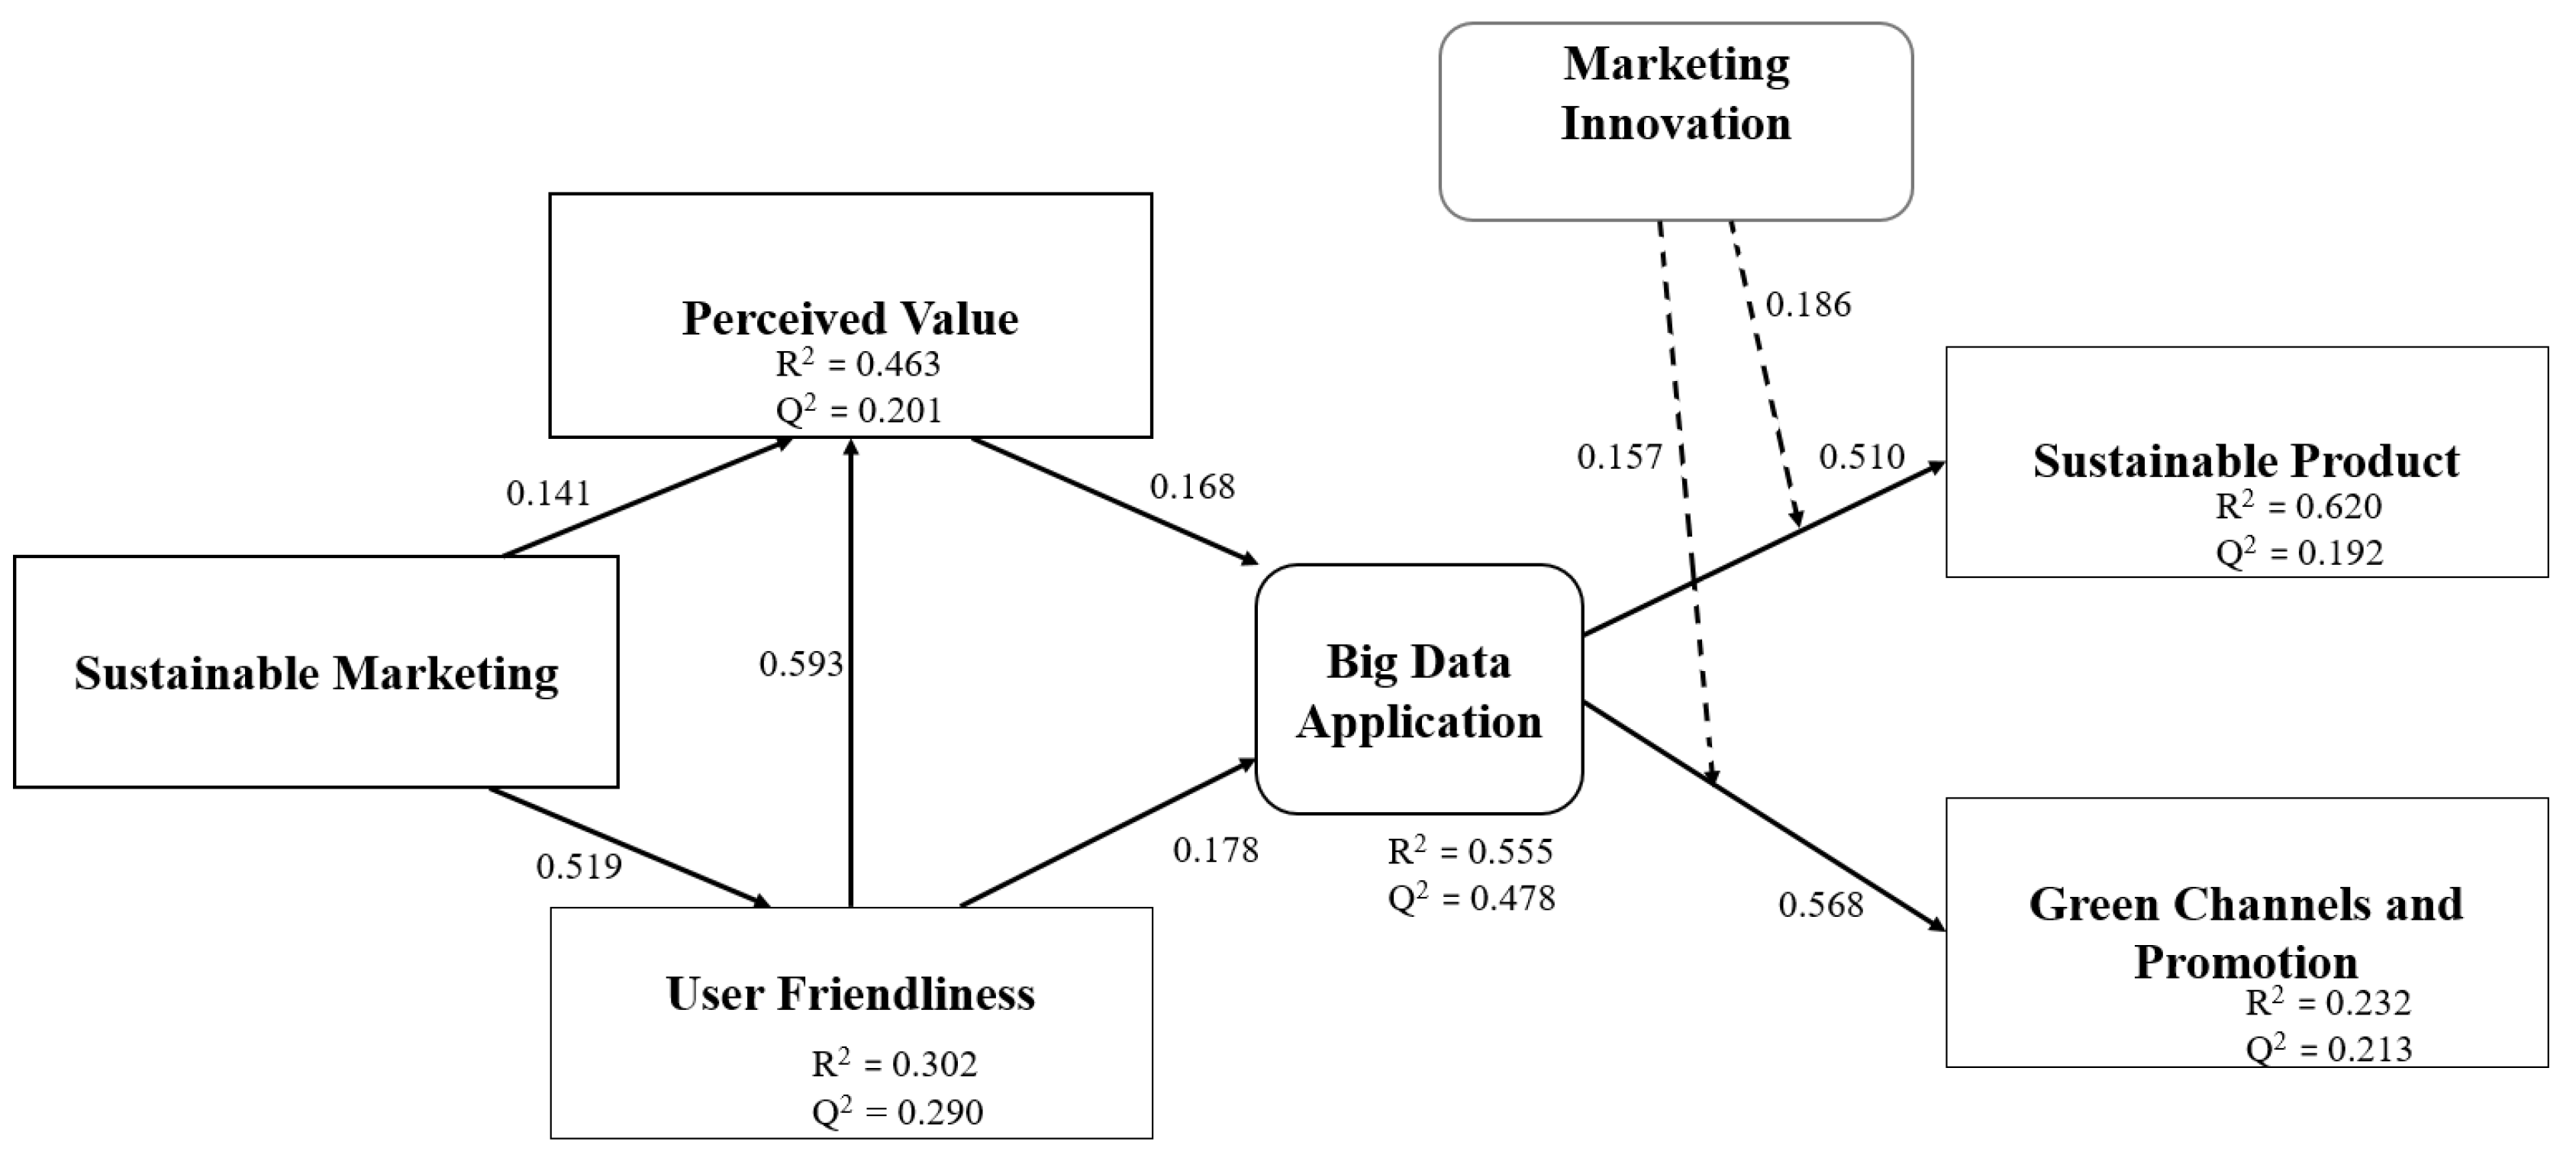
As predicted, the findings of this study indicate that sustainable marketing directly influences employees’ perceptions of the value and user friendliness of BDA. Mahmood, Ahmed [65] validated our results that employees’ perceptions of new technologies strongly influence their willingness to adopt them. Parallel results were provided by Ahn and Chen [66], highlighting that employees’ attitudes toward technological advancements, along with their perceived ease of use and usefulness, play a crucial role in determining their adoption behavior. A possible explanation for this is that while companies encourage employees to adopt green marketing practices and leverage e-commerce to meet environmental sustainability goals, they may overlook whether the related job requirements and work environment are user-friendly for employees [67]. Tao, Ding [68] emphasize that when introducing innovative technological applications, such as big data analysis, companies must prioritize both the practicality and ease of use of these technologies. Similarly, the findings of Osei and Rasoolimanesh [69] also supported our results that in technology-driven workplaces, employees are more likely to engage with digital tools when they perceive them as user-friendly and beneficial to their tasks. This consideration is especially crucial in the restaurant industry, where peak service periods are often busy and highly time sensitive. In such fast-paced environments, promoting new technologies becomes challenging if they are not easy to use. The findings of this study further confirm this perspective, highlighting the importance of user friendliness in ensuring the successful adoption of new technologies in the workplace.
Furthermore, user friendliness was found to have a positive effect on perceived value. This result is consistent with prior research, which emphasizes the importance of ease of use in enhancing user perceptions of value [70]. According to the Technology Acceptance Model, the perceived ease of use directly influences users’ evaluations of a system’s overall usefulness and value, which subsequently affects their engagement and behavioral intentions [71]. The results also revealed that user friendliness and perceived value significantly influence the adoption of BDA. This is supported by earlier studies emphasizing the importance of usability in technology adoption. According to the TAM, the perceived ease of use is a critical factor in technology acceptance, as individuals are more likely to adopt systems that require minimal effort to operate [72]. Similarly, Zarezadeh, Rastegar [73]’s research on big data adoption reinforces this notion, highlighting that user-friendly interfaces enhance usability, facilitate smoother interactions, and reduce resistance to technological change.
Moreover, BDA demonstrated a positive relationship with the SMm (e.g., sustainable products and green channels and promotion). As evidence from prior research pointed out that data-intensive methods improve innovation performance and sustainability in the environment [74]. Empirical evidence indicates that the integration of big data across product development phases maximizes the use of resources, minimizes waste, and enhances sustainability performance [75]. Similarly [76]’s study reported that big data allows companies to maximize green supply chains, minimize carbon footprints, and enhance the visibility of eco-friendly products through focused promotions and customized marketing. These results confirm our findings, emphasizing big data as a central driver of successful sustainable products and green channels and promotion.
This study also identified a positive moderating effect of MI on the relationship between BDA and the SMm. Our research results are consistent with Al-Khatib [77], who explained that MI is vital in making BDA more effective in stimulating sustainable product development. Precisely, their study indicates that marketing innovation enables the application of big data insights to strategic decision-making, enabling companies to understand consumers’ preferences better, maximize the use of resources, and create green products. This supports our argument that MI strengthens the positive impact of BDA on sustainable product outcomes by enabling businesses to transform data-driven insights into innovative and sustainable market offerings. In the same context, Zhang, Shang [78]’s empirical study supports this argument by pointing out that MI helps companies use big data analysis to create specific and personalized green marketing campaigns. Moreover, according to Aziz, Al Mamun [79], combining MI with big data helps firms anticipate consumer demands for sustainable products, streamline environmentally friendly supply chain management, and maximize green branding strategies. These studies collectively reinforce the idea that MI strengthens the effectiveness of BDA in driving green channel development and promotion.
The COVID-19 pandemic has significantly shifted consumer preferences in the restaurant industry, moving demand from in-person dining to takeout, home delivery, and online platforms [1]. These changes emphasize the importance of understanding how restaurant businesses can influence the acceptance and utilization of BDA. To support this transition, big data technology providers must prioritize the user friendliness of their tools, as this will facilitate the effective integration of big data analysis into the SMm, helping restaurants achieve their sustainability goals. While previous studies have explored the role of big data in tourism [1], this research highlights the critical importance of big data management capabilities within the restaurant industry for the first time.

5.1. Theoretical Implications

This study offers several theoretical contributions to the existing literature. First, it provides empirical evidence supporting the integration of the SOR and TAM frameworks within the context of the SMm in the restaurant industry. Specifically, it examines the role of BDA alongside employees’ perceptions of user friendliness and perceived value. The findings enrich the literature by demonstrating the complementary nature of these two models in explaining the relationships among SM, BDA, and the SMm in the restaurant industry. Second, this study underlines the role of MI in enhancing sustainable practices related to place and promotion strategies, confirming its critical moderating effect in the sustainable services industry. Unlike previous research, which has primarily associated greater MI with improved business performance [80], this study highlights a more nuanced perspective regarding environmental sustainability. It emphasizes that MI should be appropriately aligned with sustainability goals, particularly in terms of pricing and promotional strategies. Excessive promotions or overly diversified pricing strategies are unnecessary; instead, businesses should focus on delivering an appropriate and meaningful value to consumers. This reinforces the importance of aligning MI with sustainability objectives to achieve both business and environmental benefits. Unlike previous research that primarily focuses on individual components, this study offers a comprehensive perspective by integrating these factors under the dual lens of the SOR and TAM frameworks. By highlighting the significance of employees’ perceptions and the moderating influence of MI, this research advances the understanding of how digital capabilities can drive sustainable marketing strategies, thereby bridging theoretical gaps for scholars and practitioners.

5.2. Practical Implications

This study offers several practical implications for practitioners and managers in the restaurant industry. First, it highlights the importance of fostering sustainable marketing as a solid foundation for designing green strategies and integrating BDA. By adopting these approaches and actions toward BDA, managers can enhance the quality of the product, improve manufacturing flexibility, and simultaneously diminish the use of materials and minimize production expenses [81]. In the post-COVID-19 era, where the services industry increasingly embraces technological advancements, the adoption of BDA is becoming a necessity. This study’s findings offer important insights for suppliers of big data technology, helping them better understand the factors influencing the restaurant industry’s adoption and integration of data technologies to enhance sustainable marketing efforts.
Second, this study highlights the importance of providing appropriate training for employees to effectively utilize BDA in strategic operations. Through this training, frontline employees will be better equipped to identify and respond to consumers’ actual needs, offering green products and services. By ensuring workers are capable in leveraging BDA, businesses can extract meaningful insights, drive value creation, and gain a competitive advantage in the market [82]. This approach not only enhances operational excellence but also aligns with the overarching sustainability objectives of the restaurant industry.
Consistent with the findings of Gu, Ślusarczyk [83], the COVID-19 pandemic has significantly altered consumer behavior, reducing the prevalence of physical store shopping while increasing the demand for online shopping. For restaurant enterprises, the lack of innovation and technological application capabilities poses a serious risk of bankruptcy. The adoption of BDA can address this challenge by enabling companies to quickly understand consumer needs, enhance the customer experience, and facilitate the transformation of enterprise logistics and smart manufacturing processes. In addition, businesses must foster a data-driven culture, ensuring that employees at all levels embrace BDA tools for strategic decision-making and sustainable growth. To remain competitive, businesses must prioritize the integration of technology and ensure that big data tools are user-friendly and human centered. Moreover, the restaurant industry must develop sustainable strategies that balance environmental responsibility with customer satisfaction. These strategies should focus on minimizing environmental harm while meeting customers’ expectations for sustainable value by offering eco-friendly products and services. By aligning technological advancements with sustainability goals, the restaurant industry can adapt to evolving market demands while contributing to broader environmental sustainability.

5.3. Limitations and Future Scope

While this study has made significant contributions, several limitations exist which provide opportunities for future research. The current study presents a comprehensive model grounded in the prior literature; future research could collect data over multiple years to conduct longitudinal studies. Such an approach would allow for a deeper understanding of the long-term effects of BDA on the SMm. Moreover, leveraging BDA is increasingly recognized as a source of competitive advantage; future research should consider incorporating a broader range of factors to enhance the model’s comprehensiveness. This could include external international influences, regulatory policies, cultural differences, corporate culture, industrial dynamics, and internal organizational characteristics. Examining these additional variables could provide more robust insights into the interplay between BDA, sustainability, and organizational performance.
This study focused exclusively on surveying companies in the restaurant industry. Future research could expand the scope by including consumers’ perceptions, attitudes, and behaviors. Conducting paired studies that analyze both the organizational and consumer-level effects of BDA would provide a more comprehensive understanding of their impact. Moreover, the COVID-19 pandemic has posed unprecedented challenges to the services industry, accelerating the trend of reducing physical contact in favor of virtual interactions through online platforms. Traditional consumer surveys, which rely on intuition or fragmented and resource-intensive methods, may no longer be sufficient to address rapidly evolving consumer behaviors and competitive dynamics.
The nonprobability convenience sampling may restrict the generalizability of the findings. Although this approach was appropriate given this study’s constraints, we recognize its potential limitations and recommend that future research adopt stratified or quota sampling techniques to enhance the representativeness and mitigate bias.
In addition, this study did not incorporate control variables, which may limit the robustness of the findings. Future research should consider including relevant control variables to account for potential confounding factors and provide more precise insights into the relationships examined.
While this study has limitations, its findings offer valuable insights. The results can guide technology providers, academic researchers, and services businesses in understanding the role of BDA in shaping sustainable marketing practices within the industry. These insights are particularly relevant in navigating the changing landscape of consumer interactions and competitive strategies during and beyond the pandemic.

Author Contributions

Conceptualization, H.Q. and M.B.H.; Methodology, M.B.H. and Y.L.; Software, H.Q.; Validation, M.B.H.; Formal analysis, H.Q. and Y.L.; Investigation, M.B.H. and Y.L.; Data curation, H.Q.; Writing—original draft, H.Q.; Writing—review & editing, H.Q., Y.L. and M.B.H.; Visualization, Y.L.; Resources, H.Q. and M.B.H.; Project administration, H.Q. and Y.L.; Funding acquisition, M.B.H.; Supervision, M.B.H. All authors have read and agreed to the published version of the manuscript.

Funding

This research received no external funding.

Institutional Review Board Statement

The study was conducted in accordance with the Declaration of Helsinki, and approved by the Institutional Review Board 2024/DT/204.

Informed Consent Statement

All participants provided written informed consent before participating in this study, and all research processes were conducted following the ethical requirements of the school.

Data Availability Statement

The data will be made available upon request.

Conflicts of Interest

The authors declare no conflicts of interest.

References

  1. Chou, S.-F.; Horng, J.-S.; Liu, C.-H.; Yu, T.-Y.; Kuo, Y.-T. Identifying the critical factors for sustainable marketing in the catering: The influence of big data applications, marketing innovation, and technology acceptance model factors. J. Hosp. Tour. Manag. 2022, 51, 11–21. [Google Scholar] [CrossRef]
  2. Lai, I.K.W.; Wong, J.W.C. Comparing crisis management practices in the hotel industry between initial and pandemic stages of COVID-19. Int. J. Contemp. Hosp. Manag. 2020, 32, 3135–3156. [Google Scholar] [CrossRef]
  3. Wen, Z.; Huimin, G.; Kavanaugh, R.R. The impacts of SARS on the consumer behaviour of Chinese domestic tourists. Curr. Issues Tour. 2005, 8, 22–38. [Google Scholar] [CrossRef]
  4. Kaushal, V.; Srivastava, S. Hospitality and tourism industry amid COVID-19 pandemic: Perspectives on challenges and learnings from India. Int. J. Hosp. Manag. 2021, 92, 102707. [Google Scholar] [CrossRef]
  5. Rajani, R.L.; Heggde, G.S.; Kumar, R.; Chauhan, P. Demand management strategies role in sustainability of service industry and impacts performance of company: Using SEM approach. J. Clean. Prod. 2022, 369, 133311. [Google Scholar] [CrossRef]
  6. Chaturvedi, P.; Kulshreshtha, K.; Tripathi, V.; Agnihotri, D. Investigating the impact of restaurants’ sustainable practices on consumers’ satisfaction and revisit intentions: A study on leading green restaurants. Asia-Pac. J. Bus. Adm. 2024, 16, 41–62. [Google Scholar] [CrossRef]
  7. Kim, M.J.; Hall, C.M. Can sustainable restaurant practices enhance customer loyalty? The roles of value theory and environmental concerns. J. Hosp. Tour. Manag. 2020, 43, 127–138. [Google Scholar] [CrossRef]
  8. Fernández-Gámez, M.A.; Santos, J.A.C.; Diéguez-Soto, J.; Campos-Soria, J.A. The effect of countries’ health and environmental conditions on restaurant reputation. Sustainability 2020, 12, 10101. [Google Scholar] [CrossRef]
  9. Prakash, S.; Sharma, V.P.; Singh, R.; Vijayvargy, L. Adopting green and sustainable practices in the hotel industry operations-an analysis of critical performance indicators for improved environmental quality. Manag. Environ. Qual. Int. J. 2023, 34, 1057–1076. [Google Scholar] [CrossRef]
  10. Morgan, N.A.; Vorhies, D.W.; Mason, C.H. Market orientation, marketing capabilities, and firm performance. Strateg. Manag. J. 2009, 30, 909–920. [Google Scholar] [CrossRef]
  11. Rashid, M.A.; Kalyar, M.N.; Shafique, I. Market orientation and women-owned SMEs performance: The contingent role of entrepreneurial orientation and strategic decision responsiveness. South Asian J. Bus. Stud. 2020, 9, 215–234. [Google Scholar] [CrossRef]
  12. Purchase, S.; Volery, T. Marketing innovation: A systematic review. J. Mark. Manag. 2020, 36, 763–793. [Google Scholar] [CrossRef]
  13. Rianmora, S.; Sukjitsakunchai, L.; Tachawatanawisal, T.; Samorhom, N. Design and Development of Restaurant for Senior Adults with Natural Lifestyle in Thailand. Sci. Technol. Asia 2023, 28, 156–190. [Google Scholar]
  14. Naeem, H.M.; Di Maria, E. Customer participation in new product development: An Industry 4.0 perspective. Eur. J. Innov. Manag. 2022, 25, 637–655. [Google Scholar] [CrossRef]
  15. Pugna, A.P.; Potra, S.A.; Negrea, R. A strategic decision making tool for new product and service design. Manag. Decis. 2021, 59, 406–425. [Google Scholar] [CrossRef]
  16. Ladeira, W.J.; Santini, F.d.O.; Rasul, T.; Cheah, I.; Elhajjar, S.; Yasin, N.; Akhtar, S. Big data analytics and the use of artificial intelligence in the services industry: A meta-analysis. Serv. Ind. J. 2024, 44, 1117–1144. [Google Scholar] [CrossRef]
  17. Behl, A.; Gaur, J.; Pereira, V.; Yadav, R.; Laker, B. Role of big data analytics capabilities to improve sustainable competitive advantage of MSME service firms during COVID-19–A multi-theoretical approach. J. Bus. Res. 2022, 148, 378–389. [Google Scholar] [CrossRef]
  18. Lee, M.; Kwon, W.; Back, K.-J. Artificial intelligence for hospitality big data analytics: Developing a prediction model of restaurant review helpfulness for customer decision-making. Int. J. Contemp. Hosp. Manag. 2021, 33, 2117–2136. [Google Scholar] [CrossRef]
  19. Vafaei-Zadeh, A.; Nikbin, D.; Wong, S.L.; Hanifah, H. Investigating factors influencing AI customer service adoption: An integrated model of stimulus–organism–response (SOR) and task-technology fit (TTF) theory. Asia Pac. J. Mark. Logist. 2024. [Google Scholar] [CrossRef]
  20. Kabadayi, E.T.; Aksoy, N.C.; Turkay, P.B. How does customer engagement value occur in restaurants? A stimulus-organism-response (SOR) perspective. Serv. Ind. J. 2023, 43, 497–524. [Google Scholar] [CrossRef]
  21. Hameed, I.; Hussain, H.; Khan, K. The role of green practices toward the green word-of-mouth using stimulus-organism-response model. J. Hosp. Tour. Insights 2022, 5, 1046–1061. [Google Scholar]
  22. Lau, A. New technologies used in COVID-19 for business survival: Insights from the Hotel Sector in China. Inf. Technol. Tour. 2020, 22, 497–504. [Google Scholar]
  23. Chung, K.C. Green marketing orientation: Achieving sustainable development in green hotel management. J. Hosp. Mark. Manag. 2020, 29, 722–738. [Google Scholar]
  24. Kizanlikli, M.M.; Margazieva, N.; Asanova, K.; Gundogdu, I. An assessment of eco hotel practices and green marketing perceptions: An eco-labelling model proposal for hotels in Kyrgyzstan. J. Clean. Prod. 2023, 420, 138438. [Google Scholar] [CrossRef]
  25. Cohen, J. Statistical Power Analysis for the Behavioral Sciences; Routledge: London, UK, 2013. [Google Scholar]
  26. Kayode, A.I.; Tella, A.; Akande, S.O. Ease-of-use and user-friendliness of cloud computing adoption for web-based services in academic libraries in Kwara State, Nigeria. Internet Ref. Serv. Q. 2020, 23, 89–117. [Google Scholar] [CrossRef]
  27. Hällås, A.; Högberg, M.; Lyon, E. Easy-to-Use User Interfaces, the Future of Marketing? The Marketability and Sustainability of an Easy-to-Use User Interface. Bachelor’s Thesis, University of Gothenburg, Gothenburg, Sweden, 2022. [Google Scholar]
  28. Hong, C.; Choi, E.-K.; Joung, H.-W.; Kim, H.-S. The impact of customer perceived value on customer satisfaction and loyalty toward the food delivery robot service. J. Hosp. Tour. Technol. 2023, 14, 908–924. [Google Scholar] [CrossRef]
  29. Zhu, B.; Kowatthanakul, S.; Satanasavapak, P. Generation Y consumer online repurchase intention in Bangkok: Based on Stimulus-Organism-Response (SOR) model. Int. J. Retail. Distrib. Manag. 2020, 48, 53–69. [Google Scholar]
  30. Kolobkova, V.A.; Romanov, A.A.; Frolova, E.A. Digital technologies in the hotel industry: New prospects for sustainable development. In Socio-Economic Systems: Paradigms for the Future; Springer: Cham, Switzerland, 2021; pp. 387–394. [Google Scholar]
  31. Gunduz Songur, A.; Turktarhan, G.; Cobanoglu, C. Progress on green technology research in hotels: A literature review. J. Hosp. Tour. Insights 2023, 6, 2052–2072. [Google Scholar] [CrossRef]
  32. Musa, H.G.; Fatmawati, I.; Nuryakin, N.; Suyanto, M. Marketing research trends using technology acceptance model (TAM): A comprehensive review of researches (2002–2022). Cogent Bus. Manag. 2024, 11, 2329375. [Google Scholar] [CrossRef]
  33. Ahmeti, F.; Bajrami, H. Exploring the Impact of Technology Acceptance Model Constructs on Consumer Behavior in SMEs: With A focus on E-Marketing Strategies. Econ. Stud. 2024, 33, 66–88. [Google Scholar]
  34. Davis, F.D. Perceived usefulness, perceived ease of use, and user acceptance of information technology. MIS Q. 1989, 13, 319–340. [Google Scholar] [CrossRef]
  35. Yaşar, E.; Demir, M.; Cobanoglu, C. Big data analytic capabilities, intrapreneurship, and service innovation behaviors: A moderated mediation model. Serv. Ind. J. 2024, 1–25. [Google Scholar] [CrossRef]
  36. Verma, S.; Bhattacharyya, S.S.; Kumar, S. An extension of the technology acceptance model in the big data analytics system implementation environment. Inf. Process. Manag. 2018, 54, 791–806. [Google Scholar] [CrossRef]
  37. Mustapha, S.S. The UAE Employees’ Perceptions towards Factors for Sustaining Big Data Implementation and Continuous Impact on Their Organization’s Performance. Sustainability 2022, 14, 15271. [Google Scholar] [CrossRef]
  38. Kim, S.Y.; Kim, J.U.; Park, S.C. The effects of perceived value, website trust and hotel trust on online hotel booking intention. Sustainability 2017, 9, 2262. [Google Scholar] [CrossRef]
  39. Chang, S.-T. Influence of robot coolness and affinity on behavioral intention: Examining perceived value as a mediating factor. J. Hosp. Tour. Technol. 2024, 15, 825–841. [Google Scholar] [CrossRef]
  40. Zhong, L.; Coca-Stefaniak, J.A.; Morrison, A.M.; Yang, L.; Deng, B. Technology acceptance before and after COVID-19: No-touch service from hotel robots. Tour. Rev. 2022, 77, 1062–1080. [Google Scholar] [CrossRef]
  41. Bonfanti, A.; Vigolo, V.; Yfantidou, G. The impact of the COVID-19 pandemic on customer experience design: The hotel managers’ perspective. Int. J. Hosp. Manag. 2021, 94, 102871. [Google Scholar] [CrossRef]
  42. Ben Youssef, A.; Zeqiri, A. Hospitality industry 4.0 and climate change. Circ. Econ. Sustain. 2022, 2, 1043–1063. [Google Scholar] [CrossRef]
  43. Zhang, X.; Jeong, E.L. Are co-created green initiatives more appealing than firm-created green initiatives? Investigating the effects of co-created green appeals on restaurant promotion. Int. J. Hosp. Manag. 2023, 108, 103361. [Google Scholar] [CrossRef]
  44. Nguyen-Viet, B. The impact of green marketing mix elements on green customer based brand equity in an emerging market. Asia-Pac. J. Bus. Adm. 2023, 15, 96–116. [Google Scholar] [CrossRef]
  45. Ku, E.C. Digital marketing innovation and industrial marketing: Evidence from restaurants’ service robots. Asia Pac. J. Mark. Logist. 2024, 36, 3099–3117. [Google Scholar] [CrossRef]
  46. Peñalba-Aguirrezabalaga, C.; Ritala, P.; Sáenz, J. Putting marketing knowledge to use: Marketing-specific relational capital and product/service innovation performance. J. Bus. Ind. Mark. 2022, 37, 209–224. [Google Scholar] [CrossRef]
  47. Samuelsson, P. The effects of innovation types and customer participation on organizational performance in complex services. Eur. J. Mark. 2023, 57, 27–55. [Google Scholar] [CrossRef]
  48. Akpan, I.J.; Soopramanien, D.; Kwak, D.-H. Cutting-edge technologies for small business and innovation in the era of COVID-19 global health pandemic. J. Small Bus. Entrep. 2021, 33, 607–617. [Google Scholar] [CrossRef]
  49. Henseler, J.; Ringle, C.M.; Sarstedt, M. A new criterion for assessing discriminant validity in variance-based structural equation modeling. J. Acad. Mark. Sci. 2015, 43, 115–135. [Google Scholar] [CrossRef]
  50. Iqbal, S.; Moleiro Martins, J.; Nuno Mata, M.; Naz, S.; Akhtar, S.; Abreu, A. Linking entrepreneurial orientation with innovation performance in SMEs; the role of organizational commitment and transformational leadership using smart PLS-SEM. Sustainability 2021, 13, 4361. [Google Scholar] [CrossRef]
  51. Kamboj, S.; Rahman, Z. Market orientation, marketing capabilities and sustainable innovation: The mediating role of sustainable consumption and competitive advantage. Manag. Res. Rev. 2017, 40, 698–724. [Google Scholar] [CrossRef]
  52. Podsakoff, P.M.; MacKenzie, S.B.; Podsakoff, N.P. Sources of method bias in social science research and recommendations on how to control it. Annu. Rev. Psychol. 2012, 63, 539–569. [Google Scholar] [CrossRef]
  53. Harman, H.H. Modern Factor Analysis; University of Chicago Press: Chicago, IL, USA, 1976. [Google Scholar]
  54. Kock, N. Common method bias in PLS-SEM: A full collinearity assessment approach. Int. J. e-Collab. (IJeC) 2015, 11, 1–10. [Google Scholar] [CrossRef]
  55. Kraus, S.; Rehman, S.U.; García, F.J.S. Corporate social responsibility and environmental performance: The mediating role of environmental strategy and green innovation. Technol. Forecast. Soc. Change 2020, 160, 120262. [Google Scholar] [CrossRef]
  56. Hair, J.F.; Risher, J.J.; Sarstedt, M.; Ringle, C.M. When to use and how to report the results of PLS-SEM. Eur. Bus. Rev. 2019, 31, 2–24. [Google Scholar] [CrossRef]
  57. Chin, W.W.; Peterson, R.A.; Brown, S.P. Structural equation modeling in marketing: Some practical reminders. J. Mark. Theory Pract. 2008, 16, 287–298. [Google Scholar] [CrossRef]
  58. Hair, J.F.; Ringle, C.M.; Sarstedt, M. Partial least squares structural equation modeling: Rigorous applications, better results and higher acceptance. Long Range Plan. 2013, 46, 1–12. [Google Scholar] [CrossRef]
  59. Fornell, C.; Larcker, D.F. Evaluating structural equation models with unobservable variables and measurement error. J. Mark. Res. 1981, 18, 39–50. [Google Scholar] [CrossRef]
  60. Henseler, J.; Fassott, G. Testing moderating effects in PLS path models: An illustration of available procedures. In Handbook of Partial Least Squares: Concepts, Methods and Applications; Springer: Berlin/Heidelberg, Germany, 2010; pp. 713–735. [Google Scholar]
  61. Kline, R.B. Principles and Practice of Structural Equation Modeling; Guilford Publications: New York, NY, USA, 2023. [Google Scholar]
  62. Chin, W.W.; Marcolin, B.L.; Newsted, P.R. A partial least squares latent variable modeling approach for measuring interaction effects: Results from a Monte Carlo simulation study and an electronic-mail emotion/adoption study. Inf. Syst. Res. 2003, 14, 189–217. [Google Scholar] [CrossRef]
  63. Park, S.; Gupta, S. Handling endogenous regressors by joint estimation using copulas. Mark. Sci. 2012, 31, 567–586. [Google Scholar] [CrossRef]
  64. Eckert, C.; Hohberger, J. Addressing endogeneity without instrumental variables: An evaluation of the gaussian copula approach for management research. J. Manag. 2023, 49, 1460–1495. [Google Scholar] [CrossRef]
  65. Mahmood, Q.-U.-A.; Ahmed, R.; Philbin, S.P. The moderating effect of big data analytics on green human resource management and organizational performance. Int. J. Manag. Sci. Eng. Manag. 2023, 18, 177–189. [Google Scholar] [CrossRef]
  66. Ahn, M.J.; Chen, Y.-C. Digital transformation toward AI-augmented public administration: The perception of government employees and the willingness to use AI in government. Gov. Inf. Q. 2022, 39, 101664. [Google Scholar] [CrossRef]
  67. Iqbal, S.; Tian, H.; Akhtar, S.; Javed, H. Effects of green entrepreneurship and digital transformation on eco-efficient e-commerce. Int. Entrep. Manag. J. 2025, 21, 8. [Google Scholar] [CrossRef]
  68. Tao, Q.; Ding, H.; Wang, H.; Cui, X. Application research: Big data in food industry. Foods 2021, 10, 2203. [Google Scholar] [CrossRef] [PubMed]
  69. Osei, B.A.; Rasoolimanesh, S.M. Does value matter? Predicting hotel employees’ intentions towards the adoption of Technologies 4.0. Technol. Anal. Strateg. Manag. 2024, 1–17. [Google Scholar] [CrossRef]
  70. Ershova, I.; Dukmasova, N.; Prilutskaya, M. Energy efficiency and environmental friendliness of production as factors of consumer value of goods and image of the enterprise. In Challenges and Solutions in the Russian Energy Sector; Springer: Cham, Switzerland, 2018; pp. 217–223. [Google Scholar]
  71. Helal, M.Y.; Palei, T.; Safiullin, M. Developing and Validating a Perceived Digital Customer Value Scale in Restaurants. J. Qual. Assur. Hosp. Tour. 2024, 1–32. [Google Scholar] [CrossRef]
  72. Sagnier, C.; Loup-Escande, E.; Lourdeaux, D.; Thouvenin, I.; Valléry, G. User acceptance of virtual reality: An extended technology acceptance model. Int. J. Hum.–Comput. Interact. 2020, 36, 993–1007. [Google Scholar] [CrossRef]
  73. Zarezadeh, Z.Z.; Rastegar, R.; Xiang, Z. Big data analytics and hotel guest experience: A critical analysis of the literature. Int. J. Contemp. Hosp. Manag. 2022, 34, 2320–2336. [Google Scholar] [CrossRef]
  74. Belaud, J.-P.; Prioux, N.; Vialle, C.; Sablayrolles, C. Big data for agri-food 4.0: Application to sustainability management for by-products supply chain. Comput. Ind. 2019, 111, 41–50. [Google Scholar] [CrossRef]
  75. Majeed, A.; Zhang, Y.; Ren, S.; Lv, J.; Peng, T.; Waqar, S.; Yin, E. A big data-driven framework for sustainable and smart additive manufacturing. Robot. Comput.-Integr. Manuf. 2021, 67, 102026. [Google Scholar] [CrossRef]
  76. Wang, L.; Chen, L.; Li, C. Research on strategies for improving green product consumption sentiment from the perspective of big data. J. Retail. Consum. Serv. 2024, 79, 103802. [Google Scholar] [CrossRef]
  77. Al-Khatib, A.W. Big data analytics capabilities and green supply chain performance: Investigating the moderated mediation model for green innovation and technological intensity. Bus. Process Manag. J. 2022, 28, 1446–1471. [Google Scholar] [CrossRef]
  78. Zhang, Z.; Shang, Y.; Cheng, L.; Hu, A. Big data capability and sustainable competitive advantage: The mediating role of ambidextrous innovation strategy. Sustainability 2022, 14, 8249. [Google Scholar] [CrossRef]
  79. Aziz, N.A.; Al Mamun, A.; Reza, M.N.H.; Naznen, F. The impact of big data analytics on innovation capability and sustainability performance of hotels: Evidence from an emerging economy. J. Enterp. Inf. Manag. 2024, 37, 1044–1068. [Google Scholar] [CrossRef]
  80. Tjahjadi, B.; Soewarno, N.; Hariyati, H.; Nafidah, L.N.; Kustiningsih, N.; Nadyaningrum, V. The role of green innovation between green market orientation and business performance: Its implication for open innovation. J. Open Innov. Technol. Mark. Complex. 2020, 6, 173. [Google Scholar] [CrossRef]
  81. Qureshi, I.H.; Mehraj, D. Identifying the factors of internal green marketing: A scale development and psychometric evaluation approach. Int. J. Manpow. 2022, 43, 786–804. [Google Scholar] [CrossRef]
  82. Jagtap, S.; Duong, L.N.K. Improving the new product development using big data: A case study of a food company. Br. Food J. 2019, 121, 2835–2848. [Google Scholar] [CrossRef]
  83. Gu, S.; Ślusarczyk, B.; Hajizada, S.; Kovalyova, I.; Sakhbieva, A. Impact of the COVID-19 pandemic on online consumer purchasing behavior. J. Theor. Appl. Electron. Commer. Res. 2021, 16, 2263–2281. [Google Scholar] [CrossRef]
Figure 1. Conceptual framework.
Sustainability 17 04425 g001
Figure 2. Structural analysis.
Sustainability 17 04425 g002
Table 1. Demographic characteristics.
CharacteristicsCategoriesn = 319Percentage
GenderMale14746%
Female17254%
Age20–3020765%
31–407022%
Above 404213%
Academic QualificationCollege level4915%
Graduate11235%
Postgraduate15850%
Job ExperienceLess than 2 years4514%
3–5 years18357%
Above 5 years9129%
LocationBeijing19561%
Tianjin7524%
Shijiazhuang4915%
Table 2. Validity and reliability for constructs.
Items λαCR AVE VIF
Sustainable Marketing 0.8130.8750.636
SM1 0.806 1.607
SM2 0.746 1.605
SM3 0.759 1.703
SM4 0.874 1.955
Perceived Value 0.8190.8800.648
PV1 0.812 1.967
PV2 0.817 1.788
PV3 0.811 1.665
PV4 0.778 1.646
User Friendliness 0.8990.9290.767
UF1 0.841 2.183
UF2 0.865 2.352
UF3 0.917 3.233
UF4 0.879 3.068
Big Data Application 0.9060.9340.781
BDA1 0.806 2.035
BDA2 0.912 3.182
BDA3 0.906 3.072
BDA4 0.906 3.425
Marketing Innovation 0.8830.9140.681
GI1 0.857 2.694
GI2 0.837 2.535
GI3 0.851 2.329
GI4 0.766 1.746
GI5 0.812 1.889
Sustainable Product 0.7900.8660.622
SP10.613 1.365
SP20.891 3.139
SP30.886 3.142
SP40.730 1.486
Green Channels and Promotion 0.7820.8590.604
GCP1 0.725 1.817
GCP2 0.812 2.043
GCP3 0.770 1.727
GCP4 0.799 1.709
Table 3. Discriminant validity (Fornell and Larcker, 1981 [59]).
BDAGCPGPMIPVSMUF
BDA0.884
GCP0.4260.777
SP0.5380.3220.789
MI0.5410.4330.4780.825
PV0.5070.3860.4410.5220.805
WM0.3980.3030.4180.5020.4990.798
UF0.5110.3760.4380.4630.5440.3670.876
Table 4. Validity and reliability for constructs.
BDAGCPGPMIPVSMUF
BDA
GCP0.501
SP0.6260.402
MI0.6020.5090.565
PV0.5830.4770.5420.606
WM0.4440.3550.490.5930.573
UF0.5650.4430.5250.5190.6350.411
Table 5. Direct relationship.
HypothesesBetaS.DT-Values p-Values DecisionF Square
SM → UF 0.549 0.048 11.440 0.000 Accepted0.432
SM → PV 0.141 0.068 2.079 0.038 Accepted0.261
UF → BDA 0.178 0.068 2.607 0.009 Accepted0.340
PV → BDA 0.168 0.069 2.419 0.016 Accepted0.273
UF → PV 0.593 0.059 10.048 0.000 Accepted0.458
BDA → SP 0.510 0.056 9.173 0.000 Accepted0.351
BDA → GCP 0.568 0.052 10.904 0.000 Accepted0.477
Table 6. Control variable results.
Dependent VariableControl Variable(β)p-Value
Big Data ApplicationAge0.0210.456
Big Data ApplicationGender−0.0180.601
Big Data ApplicationExperience0.0340.382
Big Data ApplicationAcademic Qualification0.0120.734
Sustainable ProductAge0.0140.549
Green Channels and PromotionGender−0.0190.618
Table 7. Moderation analysis.
HypothesesBetaS.DT-Values p-Values Decision
BDA → MI * → SP 0.186 0.076 2.055 0.040 Accepted
BDA → MI * → GCP 0.157 0.072 2.5640.010 Accepted
* indicated the moderating impact.
Table 8. Assessment of endogeneity test using Gaussian copula approach.
TestConstruct Testedβp-Value
Gaussian Copula (Endogenous: BDA → Sustainable Product)BDA−0.0290.877
Gaussian copula (Endogenous: BDA → Green Channels and Promotion)BDA0.0330.894
Gaussian copula (Endogenous: Marketing Innovation → Sustainable Product)Marketing Innovation0.0200.652
Gaussian Copula (Endogenous: Marketing Innovation → Green Channels and Promotion)Marketing Innovation0.0050.555
Disclaimer/Publisher’s Note: The statements, opinions and data contained in all publications are solely those of the individual author(s) and contributor(s) and not of MDPI and/or the editor(s). MDPI and/or the editor(s) disclaim responsibility for any injury to people or property resulting from any ideas, methods, instructions or products referred to in the content.

