Abstract
Improving energy efficiency is critical for promoting energy-saving transitions in resource-based cities. However, the expected benefits of such improvements are often offset by the energy rebound effect. Based on 115 prefecture-level cities in accordance with the “National Sustainable Development Plan for Resource-based Cities” as study units, this study employs the efficiency decomposition method to evaluate the energy rebound effect and applies spatial kernel density estimation and standard deviation ellipse analysis to investigate the spatiotemporal evolution of the rebound effect across Chinese resource-based cities. Furthermore, a matrix-based classification framework is applied to identify stages of energy-saving potential and to propose differentiated transition pathways. The results reveal the following: (1) The rebound effect demonstrates fluctuating temporal patterns and a spatial shift from clustering to more dispersed distributions. (2) Temporal dynamics play a suppressive role on the rebound effect while also shaping spatial spillover interactions among cities. (3) Strategic pathway planning is essential for cities with high potential for energy conservation and emission reduction to curb the regional diffusion of the rebound effect. This study offers an assessment of the rebound effect in China’s resource-based cities, providing actionable insights for rebound risks and supporting low-carbon urban transformation.
1. Introduction
Cities are major centers of economic activity, population aggregation, and energy consumption [1], accounting globally for 60% to 80% of total energy use [2]. In China, this proportion is already 70% and is expected to rise to 83% by 2030 [3]. Resource-based cities, whose economies heavily depend on the extraction and processing of natural resources, often feature high energy intensity and outdated industrial structures, making them critical yet vulnerable nodes in China’s energy transition [4].
Against the backdrop of intensified global climate goals, China faces mounting internal and external pressures to promote green transformation, enhance energy efficiency, and reduce emissions. While energy efficiency improvements are widely regarded as an effective strategy to reduce energy consumption and promote sustainable urban development [5], a growing body of evidence suggests that such improvements may trigger a rebound effect. This effect occurs when gains in efficiency reduce the effective cost of energy services, leading to increased consumption through substitution, income, or output effects [6,7,8]. As a result, the actual energy-saving benefits may be partially or fully offset. Given their high dependence on fossil energy and strong responsiveness to policy and technological changes, resource-based cities are likely to exhibit complex and region-specific rebound effects. However, current studies tend to focus on national-level estimations or sectoral analyses, lacking detailed spatial assessments at the city scale. Without a clear understanding of the spatiotemporal patterns and influencing factors of the rebound effect in resource-based cities, it becomes difficult to identify where energy-saving potentials are truly located or to design tailored policy pathways.
Therefore, this study aims to systematically examine the temporal evolution and spatial distribution of the energy rebound effect in Chinese resource-based cities, identify typical patterns of energy-saving potential, and clarify region-specific energy policy paths. The findings of this study are expected to contribute theoretical insights into the spatial heterogeneity of the energy rebound effect, offer practical guidance for low-carbon transformation in resource-based cities, and support China’s broader goals for sustainable and energy-efficient urban development.
The rebound effect, originally proposed by Khazzoom and Brookes and theoretically extended by Saunders (1992) [9] within a neoclassical growth framework, has become a central concept in energy economics [10,11]. The relevant literature can be reviewed from three major perspectives: conceptual foundations, influencing factors, and methodological approaches.
The formation of the rebound effect is typically explained through technological progress and the associated behavioral and economic responses. Technological advancements improve energy efficiency, but the resulting decline in the cost of energy services may induce behavioral shifts—such as increased consumption—thereby offsetting some of the energy savings. Scholars categorize rebound effects into direct, indirect, and economy-wide effects, depending on the nature of the response and scope of analysis [12]. Macro-level analyses are often considered more effective than household-level studies for capturing the full elasticity of rebound effects, especially in developing contexts where energy saturation has not been reached [13]. In the Chinese context, due to the relatively late development of market-based energy systems and incomplete energy price formation, researchers have adopted alternative modeling techniques to infer the mechanism and magnitude of the rebound effect [14].
A range of factors has been identified as key drivers of the rebound effect. These include macroeconomic structure, sectoral energy consumption behaviors, and the nature of energy efficiency interventions. Galvin (2014) [15] shows that rebound effects tend to be more pronounced in high-income economies due to greater energy demand elasticity. In the Chinese setting, Xu et al. (2021) [16] argue that sector-specific planning and differentiated policies are necessary, as uniform efficiency interventions may yield uneven rebound outcomes across industries. Additionally, Kern et al. (2022) [17] highlight the contested effectiveness of typical policy instruments—such as energy taxes and efficiency standards—in mitigating rebound effects, stressing the need for more adaptive, context-sensitive policy designs.
Empirical estimation of the rebound effect varies widely based on regional data availability and methodological choices. In developed countries, long-term panel data and well-established energy pricing systems enable more direct econometric assessments. For example, Belaid et al. (2018) [18] used French household heating data to quantify direct rebound effects, while Chitnis et al. (2020) [19] explored both direct and indirect effects in the UK by disaggregating household expenditures. In contrast, due to China’s regulated energy pricing, researchers often rely on indirect estimation techniques. Kong et al. (2023) [20] employed a Cobb–Douglas production function and Solow residuals to estimate rebound effects at macro-, industry, and sectoral levels in Beijing. Ouyang et al. (2021) [21] adopted a stochastic frontier model to examine how improved electricity efficiency influenced total consumption, ultimately confirming that substitution and income effects could diminish net energy savings. The choice of method remains largely contingent on the research context and data granularity, a consensus broadly shared across the literature.
Prior studies have provided valuable insights into the rebound effect by investigating its mechanisms, influencing factors, and policy implications across various scales. Most existing research focuses either on the macro-national level or the micro-household level [22,23]. However, resource-based cities, which are the critical nodes in China’s national energy security and industrial structure, have received limited attention in this literature. Despite their high energy intensity and structural dependence on resource extraction and consumption, few studies have examined the rebound effect within this urban typology.
Additionally, much of the existing work emphasizes the identification of influencing factors [24,25], with relatively little exploration of the spatiotemporal dynamics of the rebound effect. Given the geographic and developmental diversities across Chinese cities, particularly among resource-based cities at different stages of transformation, it remains unclear whether the rebound effect exhibits regionally differentiated patterns or temporal persistence. This omission limits our understanding of how local rebound dynamics evolve over time and space.
Furthermore, while many scholars recognize that the rebound effect can offset energy savings and undermine sustainability goals [26], few studies explicitly integrate this phenomenon with empirical estimation of energy conservation potential. This gap restricts a holistic understanding of how the rebound effect interacts with actual energy-saving capacities and policy trajectories at the regional level.
In light of these limitations, this study centers on resource-based cities in China and investigates the energy rebound effect from a spatiotemporal perspective, using panel data and spatial simulation techniques. Specifically, it addresses three core gaps: (1) the lack of empirical research on rebound effects in resource-based cities, (2) the absence of dynamic and spatial pattern analyses, and (3) the insufficient integration between rebound effects and energy-saving potential assessment. By doing so, the study contributes new empirical evidence and methodological tools to support low-carbon transition strategies in resource-intensive urban contexts, aligning with national sustainability and energy security priorities.
To address these gaps, this study examines the energy rebound effect in China’s resource-based cities. It applies spatial kernel density estimation and a standard deviation ellipse to analyze spatiotemporal evolution and employs a matrix classification method to identify energy-saving potential and transformation paths. This integrated approach captures both the dynamic patterns and spatial heterogeneity of rebound effects, offering empirical insights into their impact on low-carbon transition. By linking rebound effect with regional energy-saving assessments, the study provides practical evidence to support differentiated and sustainable policy strategies in resource-intensive urban areas.
2. Methods and Data Description
2.1. Measurement of Energy Rebound Effect and Sensitivity Considerations
Before measuring the energy rebound effect, it is essential to ascertain the total energy consumption of each city. Due to the lack of official data on total energy consumption at the prefecture level in China, this study adopts the approach of Liu et al. (2022) [27], using standard coal conversion coefficients from the China Energy Statistical Yearbook to uniformly estimate city-level energy use. Focusing on natural gas, liquefied petroleum gas, and electricity—given their widespread use and data availability—city-level consumption is multiplied by the respective coefficients and summed to approximate the total energy consumption in standard coal equivalents.
While this approach may omit certain energy sources such as coal and diesel, introducing some degree of measurement error, its key strength lies in ensuring cross-city comparability and methodological consistency. The primary objective of this study is not to precisely quantify absolute energy consumption but to classify urban energy rebound effect types and explore their spatiotemporal evolution. To reinforce the robustness and scientific validity of the findings, this paper incorporates a standard deviation ellipse and spatial kernel density estimation for cross-validation. Furthermore, sensitivity tests based on ±5% variation in conversion coefficients show stable spatial patterns and classifications, suggesting that any estimation bias is unlikely to materially affect the study’s relative conclusions.
In the equation above, is the total energy consumption, denotes the consumption of natural gas, LPG, and electricity, respectively, and is the different energy consumption coefficients of 13.300, 1.714, and 1.229, respectively. On this basis, the energy intensity can be further expressed as:
In the equation above, is the energy intensity, and represents the gross domestic products.
Firstly, technological progress has contributed to a decrease in energy intensity. Therefore, the reduction in energy consumption resulting from this decrease in energy intensity can be expressed as:
In the formula above, represents different years in the study.
Secondly, the technological progress can drive energy economic growth, which, in turn, generates new demand for energy resources inputs, thereby increasing energy consumption. Therefore, the increase in energy consumption due to technological progress can be expressed as:
In the formula above, is the rate of technological progress. Given that energy efficiency represents more of a broad technical progress in terms of integrated productivity, this paper needs to decompose the rate of technical progress from energy efficiency in order to accurately measure the actual effect of technical progress on energy consumption. With reference to the relevant literature [11], this paper uses the DEA-BCC model to estimate energy efficiency and decompose the rate of technical progress from it.
In the formula above, measures the relative efficiency of each decision-making unit, where higher values indicate greater efficiency. denotes the year, with total years in this study. is the weight vector of inputs and outputs for year , where and are the input and output values, and , are their slack variables. and represent the optimal input and output levels. If with zero slacks, the unit is fully DEA efficient. If but slacks exist, it is weakly efficient. If , the unit is inefficient
Ultimately, the ratio between the increase in energy consumption due to technological progress and the decrease in energy consumption can be expressed as an energy rebound according to the theory of the rebound effect [28], as follows:
The rebound effect reflects how much of the expected energy savings from improved energy intensity is offset by increased energy demand, with the classification shown in Table 1.

Table 1.
Classification of rebound effect levels and interpretations.
2.2. Spatial Kernel Density
Spatial kernel density estimation is employed to reveal the continuous spatial distribution and clustering patterns of the energy rebound effect across cities, enabling intuitive visualization of spatial heterogeneity and dynamic evolution [29]. Based on the ordinary kernel density estimation method, the incorporation of time and space parameters results in a spatial kernel density, which estimates the probability density of a random variable and describes its distribution pattern conditioned on space–time. The joint kernel density function of and is denoted by , while the distribution of given is represented by . In this study’s spatial kernel density analysis, the bandwidth parameter controls the smoothness of the estimated density curve, where smaller values of result in less smooth curves but higher estimation precision. Existing studies commonly set the bandwidth within the interval [0, 1] [30]. Balancing the need for capturing data variability and ensuring estimation accuracy, this study sets . This value has been validated through multiple simulation to effectively capture the evolutionary characteristics of the energy rebound effect, ensuring both estimation precision and strong capability in identifying distribution patterns.
2.3. Standard Deviation Ellipse
The standard deviation ellipse can be used to analyze the spatial distribution characteristics of geographical elements from a global perspective [31]. In this study, the turning angle and the long semi-axis of the ellipse were used to reflect the spatial dominant direction of the energy rebound effect, while the short semi-axis and the average shape index were used to reflect its equilibrium level. The center of gravity and the moving distance were also used to reflect the distribution and evolution characteristics of the rebound effect. These parameters were extracted from ArcGIS10.8 software.
2.4. Spatial Panel Model Analysis
Given the potential for regional linkage and spatial diffusion mechanisms in the rebound effect across geographic dimensions, it is necessary to introduce spatial panel models to empirically test its spatial dependence and dynamic propagation effects [4]. To this end, this study constructs a spatial autoregressive model and a spatial Durbin model to identify spatial spillover paths and influencing mechanisms of the rebound effect across regions. SAR is used to capture how rebound levels in neighboring cities influence local outcomes, while the SDM further incorporates spatial lags of explanatory variables to assess both direct and spillover effects. The models allow for empirical identification of spatial correlation patterns and heterogeneous responses under different spatial weight matrices, both contiguity and distance based, enhancing our understanding of the rebound effect’s spatiotemporal dynamics.
2.5. Energy Conservation and Emission Reduction Potential Measurement
To capture the joint inefficiencies in both energy use and environmental impact, this paper, based on Sun and Huang’s (2021) [32] idea and methodology, incorporates slack variables to assess energy conservation potential while also accounting for CO2 emissions, the primary source of air pollution, as an undesired output in the modeling of reduction potential. The geometric model can be expressed as follows (Figure 1):
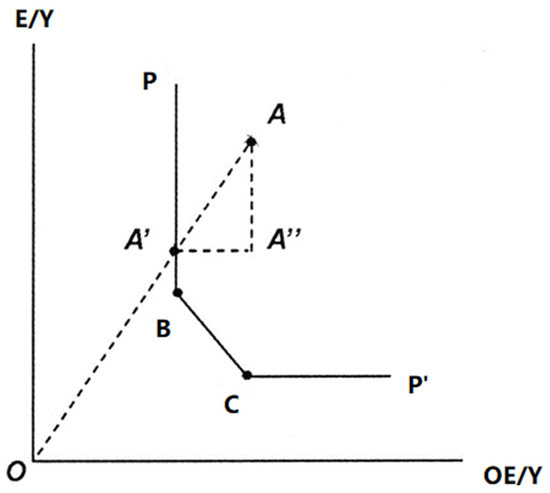
Figure 1.
Geometric model of energy relative efficiency.
Under the basic production model, the unitized equal output curve is , with energy, capital, and human resources being the input factors. Points and on the production frontier indicate efficiency, while point , located above the production frontier curve, represents inefficiency, as it requires more resources to achieve the same output. According to Farrell’s (1957) [33] definition of the production function, the efficiency at point can be geometrically expressed as , while point is the Pareto optimal point, as at point , the energy input can be further reduced by to reach the production frontier. At point , inefficiency losses occur due to excessive energy input , caused by technical inefficiency, and slack variable , resulting from the misallocation of energy resources. Thus, represents the amount of energy adjustment required at inefficient point to reach the target point .
Based on the analysis above, this paper defines the relative energy efficiency at the outset:
In the equation above, represents the energy input required for optimal production on the frontier in period for city ; represents the actual energy input; is the energy over-input relative to the optimal production frontier and can be regarded as the energy conservations achieved or the slack in energy input. Accordingly, the specific energy conservation potential for city in period can be derived, defined as follows:
In the equation, the value of reflects the degree of energy conservation potential in the production process. Similarly, the expression for the reduction potential can be derived as follows:
In the equation above, denotes the actual carbon emissions in period in city , and denotes the pollutant emissions at the target point on the production frontier.
2.6. Data Sources
Due to missing data, this paper now selected 115 prefecture-level cities in accordance with the “National Sustainable Development Plan for Resource-based Cities” as the study units. The input factors of energy efficiency were represented by capital, labor, and energy [34], while the GDP was used to represent the output factor. The capital stock is estimated using the perpetual inventory method, with a capital depreciation rate of 10.96% to reflect capital input [35], the number of employees at the end of the year is used to reflect labor input, and total energy consumption is used to reflect energy input. All indicators were obtained from the China Urban Statistical Yearbook and the socio-economic bulletin of each prefecture-level city, except for the capital stock, which required additional estimation. Additionally, carbon emissions were selected as the primary proxy for air pollution emissions in this study, with the data sourced from published articles in Scientific Data [36].
3. Results
3.1. Description of Basic Factual Features
The energy rebound effect refers to the phenomenon where the energy conservation and emission reduction achieved through energy efficiency improvements are partially or fully offset by the increased demand for products and energy consumption. Therefore, classify Chinese resource-based cities into four stages based on their development plans: growing, mature, declining, and renewable. This study will analyze the trends in energy efficiency and energy consumption in each category and conduct a preliminary investigation into the preconditions for the energy rebound effect, as shown in Figure 2.
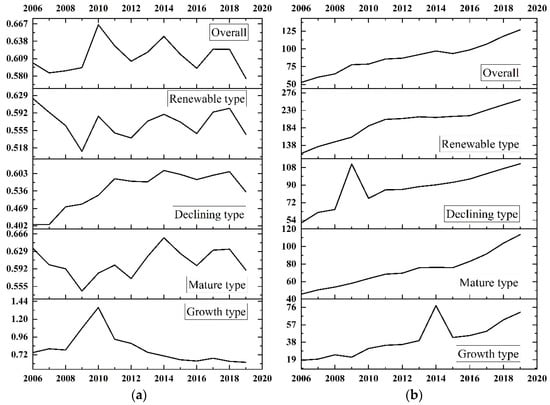
Figure 2.
Comparation between energy consumption and energy efficiency in resource-based cities. (a) Energy efficiency; (b) energy consumption.
In terms of the energy efficiency development trend, except for growing resource-based cities that demonstrated a temporary rise followed by a decline, energy efficiency across Chinese resource-based cities generally exhibited high volatility and stage-specific divergence. This fluctuation coincides with major economic shifts and policy transitions, such as the 2008 stimulus package and the 2013 energy intensity targets, highlighting the sensitivity of efficiency levels to macroeconomic and regulatory changes. Regarding energy consumption, aside from brief deviations in 2009 and 2014, which corresponded to the global financial crisis aftermath and industrial structural adjustments, the overall energy use in resource-based cities has shown a continuous upward trend. Despite differences in the average levels of consumption across city types, the yearly energy consumption curves remain broadly consistent, reflecting the inertia of industrial energy demand.
When comparing energy consumption and energy efficiency, the decoupling becomes apparent: while energy efficiency fluctuates in three-year cycles, likely influenced by policy enforcement lags or investment cycles, energy consumption trends upward steadily, showing limited responsiveness to efficiency gains. This suggests that improvements in energy efficiency have not effectively curbed consumption growth, indicating persistent rebound effects.
These findings imply that despite periodic improvements in energy efficiency, resource-based cities continue to consume more energy due to structural and behavioral inertia. The persistence and expansion of the rebound effect across all stages reveal the limitations of efficiency-driven policies and underscore the need for coordinated interventions that integrate energy efficiency with industrial restructuring and demand-side management.
3.2. Spatiotemporal and Morphological Evolution of the Energy Rebound Effect
3.2.1. Spatiotemporal Evolution Analysis of the Energy Rebound Effect
After confirming the occurrence conditions for the rebound effect, this paper proceeds to classify the rebound effect values of each resource-based city and analyze their evolutionary characteristics at four characteristic time points: 2007, 2011, 2015, and 2019, shown in Figure 3.
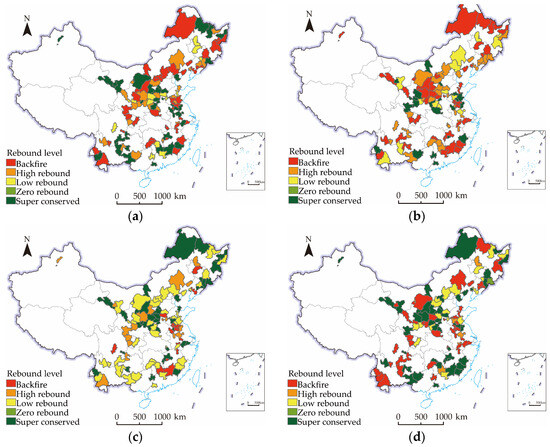
Figure 3.
Spatiotemporal evolution of the energy rebound effect in resource-based cities. (a) 2007; (b) 2011; (c) 2015; (d) 2019.
In terms of the chronological development, the evolution of China’s resource-based cities has shown a shift from predominantly experiencing backfire effects at the beginning of the study period to a greater control of energy rebound effects in 2015, resulting in an increase in weak rebound cities. However, at the end of the study period, while the number of super-conserved cities increased, the number of cities experiencing backfire effects also increased, leading to a divergent trend in the energy rebound effect in resource-based cities. The most significant decline in the energy rebound effect between 2011 and 2015 can be attributed to the issuance of multiple regulations, including the “Opinions on Accelerating the Merger and Reorganization of Coal Mining Enterprises” and the “Circular on Further Eliminating Backward Coal Mining Capacity and Promoting the Consolidation and Closure of Coal Mines” by the State Council and the National Energy Administration after 2010. These regulations have curbed the substitution effect of energy rebounds in China’s resource-based cities and have led to better realization of expected energy conservation.
In terms of spatial patterns, resource-based cities in the south have shown a lower energy rebound effect than those in the north, and those in the east have shown lower rebound effects than those in the west. Differences in location, resource endowment, and industrial structure can have an impact on the distribution of the energy rebound effect. Among all stages of resource-based cities, renewable resource-based cities have gradually reduced their dependence on energy consumption by optimizing traditional industries and developing non-resource-based industries, leading to the lowest rebound effect at all time points. On the other hand, growing resource-based cities have the highest rebound effect among all stages of resource-based cities, as energy efficiency development is slower than the growth in energy consumption demand due to ongoing resource and industrial developments.
3.2.2. Spatial Morphological Evolution Analysis of the Energy Rebound Effect
Based on the initial observation of the spatiotemporal pattern in previous section, this paper now conducts a detailed analysis of the spatial pattern changes of the rebound effect from an evolutionary perspective. Utilizing the standard deviation ellipse analysis method, this study quantitatively identifies the evolutionary dynamics of the energy rebound effect in Chinese resource-based cities at four time points: 2007, 2011, 2015, and 2019. These results are presented in Table 2.
Table 2.
The standard deviation elliptic parameter of energy rebound effect.
Regarding the standard deviation ellipse, Chinese resource-based cities’ average shape index gradually increased from 0.46 in 2007 to 0.76 in 2015, maintaining a good elliptical shape. The mean shape index gradually decreased from 0.76 in 2015 to 0.44 in 2019, returning to the level observed in 2007. The elliptical shape also deviates from the perfect circle, suggesting that in Chinese resource cities, the energy rebound effect tends to cluster in the early stages and gradually becomes more decentralized and staggered over time.
Regarding rotation angle, it increased from 44.54° in 2007 to 63.37° in 2015, indicating a shift in the spatial distribution pattern of the energy rebound effect from a north–south direction to a northeast–southwest direction. In 2019, the rotation angle decreased to 40.37°, and the spatial pattern of the energy rebound effect shifted back to a north–south direction.
Regarding the barycentric coordinates and trajectory, the center of gravity of each characteristic point shifts between 111.86 and 114.94° E and 34.65 and 35.15° N. Specifically, at the prefecture level, the center of gravity is mainly located around Sanmenxia and Xinxiang, which did not show a significant shift trajectory in the observed years.
3.3. Spatiotemporal Dynamic Simulation of the Energy Rebound Effect
Building on the previous analysis of energy rebound effect in Chinese resource-based cities, this study now employs the spatial kernel density model to simulate the evolution process and spatial distribution patterns of the energy rebound effect in Chinese resource-based cities.
3.3.1. Unconditional Kernel Density Analysis
Under the unconditional setting, Figure 4a presents the three-dimensional kernel density of the energy rebound effect in resource-based cities. A 3-year lag is adopted in the spatial dynamic kernel density analysis to capture the delayed responses of time effect. This temporal window allows for a more accurate reflection of spatiotemporal evolution patterns [37]. The Z-axis represents the conditional kernel density, which reflects the probability of conditional occurrence at each point in the plane. By rotating the vertical plane, the X- and Y-axes were processed in parallel, and the resulting section plane in Figure 4b illustrates the transfer probability distribution of energy rebound effect from year t to year t + 3.
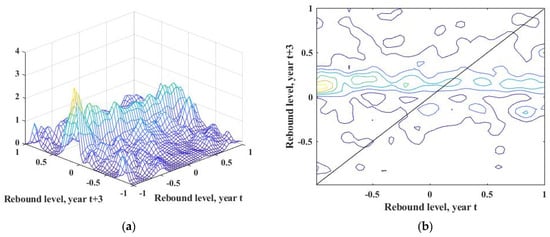
Figure 4.
Unconditional kernel density (a) and density contour of energy rebound effect (b).
In terms of the distribution state, the density contour of the rebound effect is mainly distributed below the negative 45-degree diagonal, with the primary peak of kernel density located in this area and several side peaks extending in parallel. This phenomenon indicates that the energy rebound effect in Chinese resource-based cities shifts significantly from year t to year t + 3 without considering spatial factors, showing an overall decreasing trend. In general, the time factor causes the energy rebound effect in Chinese resource-based cities to gradually converge in the range of 0 to 0.5 effect values, resulting in a spatial distribution pattern with the weak rebound effect dominating and super-conserved and strong rebound coming second. Additionally, the density contour is primarily parallel to the X-axis, also indicating that an increase in energy consumption does not necessarily lead to an increase in the energy rebound effect. This highlights the potential for energy conservation and emission reduction in Chinese resource-based cities, which is worth exploring.
3.3.2. Spatial Static Kernel Density Analysis
Building on the analysis of the unconditional situation, this study now investigates the potential spatial effects on energy rebound in Chinese resource-based cities. Figure 5 shows the results of this analysis.
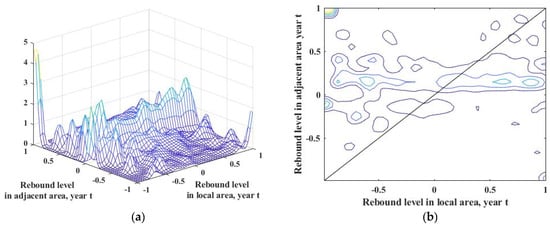
Figure 5.
Spatial static kernel density (a) and density contour of energy rebound effect (b).
In terms of the distribution state, the density contours are concentrated along the negative 45-degree diagonal, with the main peak of kernel density in the upper left corner, and multiple lateral peaks within the range of 0 to 0.5 rebound effect values. This indicates that under spatial conditions, without the consideration of the time span, areas with backfire effects are spatially correlated and tend to be adjacent to each other. In contrast, cities with weak rebound effects are interspersed with those with high rebound effects and do not exhibit significant spatial correlation. Moreover, the contour of the kernel density from −0.5 to 1 in neighboring regions is parallel to the X-axis, suggesting that the energy rebound effect in the local region usually remains weak even when neighboring regions are experiencing weak to strong rebound effects. This indicates that the spatial spillover effect of neighboring regions does not significantly influence the energy rebound effect in Chinese resource-based cities.
3.3.3. Spatial Dynamic Kernel Density Analysis
Subsequently, this study now further investigates the temporal and spatial correlations of the energy rebound effect in Chinese resource-based cities by analyzing the dynamic kernel density with both temporal and spatial conditions, as illustrated in Figure 6.
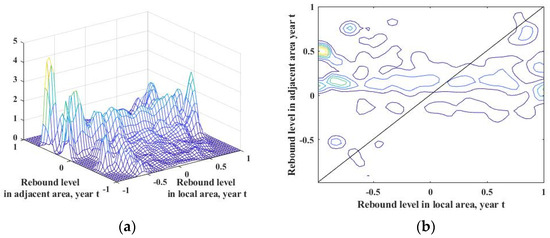
Figure 6.
Spatial dynamic kernel density (a) and density contour of energy rebound effect (b).
In terms of distribution state, the spatial dynamic kernel density exhibits a multi-peaked distribution, with density contours mostly clustered around the negative 45-degree diagonal. This suggests that the neighboring regions’ energy rebound effect in year t has a certain impact on the local region’s energy rebound effect in year t + 3 under a three-year time lag, and resource-based cities in China tend to experience a shift toward lower rebound effect levels. In terms of the direction of distribution, the energy rebound effect is characterized by a double-dominant distribution, with density contours roughly parallel to the x-axis for values below −0.5, indicating that the spatial distribution of the energy rebound in resource-based cities in China is dominated by weak and strong rebounds under both spatial and temporal conditions. Moreover, the level of super-conserved effect in neighboring regions has a lagging effect on the energy rebound in the local region through positive spillover effects. Compared to the spatially static kernel density, the dynamic kernel density, with the addition of a time lag, ranges from 1 to a low effect of 0.5 to 0, indicating that time factors have a significant influence on the spatial interaction of the energy rebound effect between cities.
3.4. Empirical Validation
To further validate the spatial and temporal patterns of the energy rebound effect identified before, this section employs spatial econometric regression models to test their robustness from an empirical perspective. By introducing spatial lag (SAR) and spatial Durbin (SDM) models, this paper aims to assess both the direct and spillover impacts of the energy rebound effect under different spatial adjacency structures, thereby offering empirical evidence for the underlying mechanisms of spatiotemporal evolution, as shown in Table 3. ** and *** represent significance levels of 5% and 1% respectively.
Table 3.
Spatial econometric analysis of the energy rebound system effect.
The regression results empirically validate the spatiotemporal evolution trends identified in the previous analysis. First, the core explanatory variable—energy efficiency—shows a significantly negative coefficient across all models, −0.988 in OLS and −0.894 to −0.898 in the SAR model and SDM, all significant at the 1% level, confirming that improvements in energy efficiency effectively suppress the rebound effect. This aligns with the kernel density analysis showing a downward shift of the density peak and convergence toward a weaker rebound. Second, although the spatial lag coefficient ρ under the 0–1 contiguity matrix is positive, the spatial error term γ is only 0.083 and weakly significant, indicating limited static spatial spillover. This supports the static kernel density finding of interspersed weak and strong rebound cities without strong spatial clustering. Lastly, dynamic kernel density analysis revealed a time–space convergence toward lower rebound levels and lagged influence from neighboring cities. This is corroborated by a significantly stronger spatial error term under the distance-based matrix, suggesting growing spatial spillovers over time. Together, the regression findings provide robust empirical support for the observed patterns of temporal convergence, spatial differentiation, and dynamic spillover, reinforcing the credibility and scientific rigor of this study’s conclusions on the spatiotemporal evolution of the energy rebound effect.
3.5. Measurement of Energy Conservation and Emission Reduction Potential
The above studies demonstrate the prevalence of the energy rebound effect at different stages in resource-based cities, resulting in significant energy losses and excessive carbon pollution in China. Therefore, this study aims to quantify the energy-saving and emission-reduction potentials of resource-based cities at different stages, providing a reference for designing efficient energy-saving pathways. Due to space constraints, only four characteristic time points—2007, 2011, 2015, and 2019—are selected to present the results in Table 4 and Table 5.
Table 4.
Change in energy conservation potential of various resource-based cities.
Table 5.
Change in emission potential of various resource-based cities.
In general, the energy-saving potential and emission-reduction potential of resource-based cities are comparable at all stages, indicating homogeneity in energy waste and carbon pollution in real production. Energy-saving and carbon emission-reduction tasks are characterized by consistent objectives. During the study period, the average energy conservations that could be achieved by resource-based cities at each stage amounted to 14,144,500 tons of standard coal, with an energy-saving potential of 56.07%. The average emission reduction achievable amounted to 78,485,600 tons, with an emission reduction potential of 52.05%. This suggests that in the process of economic development, more than half of the energy in China’s resource-based cities is wasted, and excessive carbon emissions exceed 50%, leaving ample room for improvement in the effective allocation of resources and reasonable control of energy rebound.
By stage, growing type resource-based cities are in the rising stage of resource and industrial development, characterized by rapid growth in strategic new industries. These cities exhibit lower energy waste and excessive carbon emissions, with rates of 46.33% and 41.33%, respectively, which are the lowest among all types of resource-based cities. Mature resource-based cities have the largest number among all types of resource-based cities and exhibit a high level of socio-economic development and energy demand, resulting in the largest share of energy conservations (43.97%) and emission reductions (42.96%) among all types of resource-based cities. Declining cities exhibit stagnant economic development due to resource depletion, industrial decline, and slowed technological renewal, leaving the greatest room for improvement in energy conservation (65.67%) and emission reduction (62.19%) among all types of resource-based cities and exerting the greatest pressure on energy conservation and emission reduction. It can be seen that the planning and transformation of mature resource-based cities should be prioritized in the process of energy conservation and emission reduction in China’s resource-based cities. Improving the energy conservation and emission reduction potential in renewable resource-based cities will be a key indicator of effective control of the energy rebound effect and transition to sustainable development in resource-based cities.
3.6. Implementation Path of Energy Conservation and Emission Reduction
At the end, to clarify the focus of energy conservation and emission reduction in China’s resource-based cities at different stages, this paper concludes by constructing a matrix that measures the energy conservation and emission reduction potential of resource-based cities in China and categorizing them using a 0.5 dividing line in order to analyze the path of energy conservation and emission reduction in China’s resource-based cities at different stages (Figure 7).
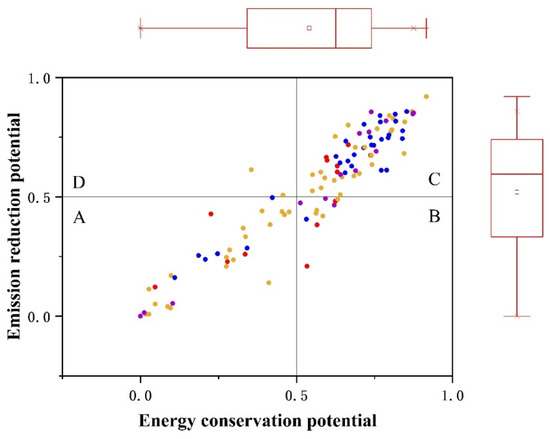
Figure 7.
State matrix of energy conservation and emission reduction potentials.
In general, energy-saving and emission-reducing potentials in Chinese resource-based cities are reciprocal, resulting in their distribution mainly within quadrants A and C of the state matrix. Few cities fall into quadrant B, which has high energy-saving and low emission-reduction potentials, or quadrant D, which has low energy-saving and high emission-reduction potentials. Specifically, 4 growing, 18 mature, 6 declining, and 3 renewable resource-based cities fall into quadrant A, with low energy efficiency and emission reduction potential, indicating high energy usage and pollution levels that will reach the optimal frontier sooner. In contrast, quadrant C has a large number of cities, including 5 growing, 23 mature, 22 declining, and 9 renewable resource-based cities, with high energy conservation and emission reduction potential, indicating significant energy wastage and excessive pollution emissions.
Using different paths, resource-based cities in quadrant C have two options to choose from for their energy-saving and emission-reduction planning: the C-B-A or C-D-A progressive implementation path. These paths allow the cities to quickly move to adjacent quadrants based on their own energy-saving or emission-reduction advantages and eventually transition to the A quadrant. Moreover, cities in quadrant B can implement the B-A unilateral breakthrough energy conservation and emission reduction path, which focuses on improving energy efficiency and controlling energy rebound effects to accelerate the overall progress of energy conservation and emission reduction efforts. These cities have an advantage in emission reduction. In the end, it is also worth noting that quadrant D, which is low in energy conservation and high in emission reduction, only has two cities in the quadrant, highlighting the significant pressure that resource-based cities face in dealing with energy rebound and the urgent need for energy-saving and efficiency improvement work.
4. Conclusions and Policy Implications
This study investigates the spatiotemporal characteristics, driving mechanisms, and transformation pathways of the energy rebound effect in Chinese resource-based cities. By constructing a rebound effect index and employing spatial kernel density analysis, a standard deviation ellipse, and energy-saving potential estimation, we provide empirical evidence to support energy efficiency governance and low-carbon transitions. The key conclusions are as follows:
- The energy rebound effect in resource-based cities demonstrates clear temporal volatility and spatial decentralization. From 2007 to 2015, the rebound effect showed convergence toward weak rebound, while the period from 2015 to 2019 marked a divergence, with increases in both backfire and super-conservation cases. This evolution from spatial clustering to staggered distribution indicates that rebound trends vary across development stages and are sensitive to macroeconomic shifts and policy shocks.
- Time factors suppress the rebound effect and moderate its spatial diffusion. Non-spatial analysis reveals gradual convergence in rebound levels, while spatial constraints show limited spillover effects between neighboring cities. When time and space dimensions are combined, a downward convergence trend emerges, reflecting the growing effectiveness of region-wide energy efficiency improvements and the gradual reduction of rebound intensity.
- Resource-based cities have substantial room for energy conservation (average potential of 56.07%) and emission reduction (52.05%). However, cities at different development stages exhibit distinct energy rebound risks and need-tailored transformation pathways. Quadrant C cities, characterized by low efficiency and high rebound, should be prioritized in policy design, with transition paths such as C-B-A or C-D-A providing phased improvement strategies.
Based on these findings, the following policy recommendations are proposed to mitigate the energy rebound effect and accelerate sustainable transitions:
- Embed rebound effect risk into policy frameworks by city type: Energy efficiency policies must account for rebound risks, especially in growing and mature resource-based cities, where efficiency gains may trigger consumption surges. For high-rebound cities, stricter demand-side management tools, such as progressive energy tariffs, mandatory efficiency audits, and behavioral nudges, should be prioritized. In low-rebound cities, incentives for deeper retrofits and innovation adoption can safely amplify efficiency gains.
- Establish regionally coordinated governance platforms: For cities with spatially dispersed and staggered rebound patterns, especially those in overlapping economic zones, regional coordination mechanisms—such as joint emission-reduction agreements, integrated infrastructure planning, and cross-border pilot zones—should be formalized. Such platforms can facilitate technology spillovers, prevent policy fragmentation, and foster synchronized low-carbon transitions.
- Design stage-specific transformation pathways: Cities should be classified into categories—such as high potential, transitional, and lagging—based on their energy-saving and emission-reduction capacities. High-potential cities (Quadrant A) should pilot advanced decarbonization strategies; transitional cities (Quadrants B and D) require technical and financial support to progress; and lagging cities (Quadrant C) need foundational reforms such as restructuring high-emission industries and improving public service energy efficiency. This study provides a novel framework for assessing energy rebound effects by integrating spatiotemporal analysis with efficiency-based estimation, thereby revealing regionalized patterns and transition pathways in China’s resource-based cities. Nevertheless, future research would benefit from incorporating dynamic energy accounting methods, more granular sectoral or firm-level data, and comparative studies across different city types or regions. In addition, extending the temporal scope beyond 2019 and applying causal inference techniques could help capture emerging trends and policy impacts with greater precision.
Author Contributions
Methodology, Z.Z. (Zhigang Zhu); Formal analysis, Z.Z. (Zhongjia Zhang); Investigation, Z.Z. (Zhigang Zhu); Resources, Z.Z. (Zhigang Zhu); Data curation, Z.Z. (Zhongjia Zhang); Writing—original draft, Z.Z. (Zhongjia Zhang); Writing—review & editing, Z.Z. (Zhigang Zhu); Funding acquisition, Z.Z. (Zhongjia Zhang). All authors have read and agreed to the published version of the manuscript.
Funding
This research received no external funding.
Institutional Review Board Statement
Not applicable.
Informed Consent Statement
Not applicable.
Data Availability Statement
The original contributions presented in this study are included in the article. Further inquiries can be directed to the corresponding author.
Conflicts of Interest
The authors declare no conflict of interest.
References
- Sodiq, A.; Baloch, A.A.; Khan, S.A.; Sezer, N.; Mahmoud, S.; Jama, M.; Abdelaal, A. Towards modern sustainable cities: Review of sustainability principles and trends. J. Clean. Prod. 2019, 227, 972–1001. [Google Scholar] [CrossRef]
- Nematchoua, M.K.; Sadeghi, M.; Reiter, S. Strategies and scenarios to reduce energy consumption and CO2 emission in the urban, rural and sustainable neighbourhoods. Sustain. Cities Soc. 2021, 72, 103053. [Google Scholar] [CrossRef]
- Wang, J.; Huang, Y.; Teng, Y.; Yu, B.; Wang, J.; Zhang, H.; Duan, H. Can buildings sector achieve the carbon mitigation ambitious goal: Case study for a low-carbon demonstration city in China? Environ. Impact Assess. Rev. 2021, 90, 106633. [Google Scholar] [CrossRef]
- Duan, Z.; Tang, T. Quantitative simulation and verification of the coordination curves between sustainable development and green innovation efficiency: From the perspective of urban agglomerations development. Sustainability 2022, 14, 16686. [Google Scholar] [CrossRef]
- Wei, T.; Duan, Z.; Xie, P. Spatial disparities and variation sources decomposition of energy poverty in China. J. Clean. Prod. 2023, 421, 138498. [Google Scholar] [CrossRef]
- Yang, S.; Duan, Z.; Jiang, X. Spatial dynamics and influencing factors of carbon rebound effect in tourism transport: Evidence from the Yangtze-river delta urban agglomeration. J. Environ. Manag. 2023, 344, 118431. [Google Scholar] [CrossRef] [PubMed]
- Brockway, P.E.; Sorrell, S.; Semieniuk, G.; Heun, M.K.; Court, V. Energy efficiency and economy-wide rebound effects: A review of the evidence and its implications. Renew. Sustain. Energy Rev. 2021, 141, 110781. [Google Scholar] [CrossRef]
- Brännlund, R.; Ghalwash, T.; Nordström, J. Increased energy efficiency and the rebound effect: Effects on consumption and emissions. Energy Econ. 2007, 29, 1–17. [Google Scholar] [CrossRef]
- Saunders, H.D. The Khazzoom-Brookes postulate and neoclassical growth. Energy J. 1992, 13, 131–148. [Google Scholar] [CrossRef]
- Sorrell, S.; Dimitropoulos, J.; Sommerville, M. Empirical estimates of the direct rebound effect: A review. Energy Policy 2009, 37, 1356–1371. [Google Scholar] [CrossRef]
- Jin, T.; Kim, J. A new approach for assessing the macroeconomic growth energy rebound effect. Appl. Energy 2019, 239, 192–200. [Google Scholar] [CrossRef]
- Castro, C.G.; Trevisan, A.H.; Pigosso, D.C.; Mascarenhas, J. The rebound effect of circular economy: Definitions, mechanisms and a research agenda. J. Clean. Prod. 2022, 345, 131136. [Google Scholar] [CrossRef]
- Rajabi, M.M. Dilemmas of energy efficiency: A systematic review of the rebound effect and attempts to curb energy consumption. Energy Res. Soc. Sci. 2022, 89, 102661. [Google Scholar] [CrossRef]
- Ai, H.; Wu, X.; Li, K. Differentiated effects of diversified technological sources on China’s electricity consumption: Evidence from the perspective of rebound effect. Energy Policy 2020, 137, 111084. [Google Scholar] [CrossRef]
- Galvin, R. Estimating broad-brush rebound effects for household energy consumption in the EU 28 countries and Norway: Some policy implications of Odyssee data. Energy Policy 2014, 73, 323–332. [Google Scholar] [CrossRef]
- Xu, L.; Fan, M.; Yang, L.; Shao, S. Heterogeneous green innovations and carbon emission performance: Evidence at China’s city level. Energy Econ. 2021, 99, 105269. [Google Scholar] [CrossRef]
- Kern, F.; Peuckert, J.; Lange, S.; Ahmann, L.; Banning, M.; Lutz, C. Designing effective and acceptable policy mixes for energy transitions: Countering rebound effects in German industry. Energy Res. Soc. Sci. 2022, 90, 102680. [Google Scholar] [CrossRef]
- Belaïd, F.; Bakaloglou, S.; Roubaud, D. Direct rebound effect of residential gas demand: Empirical evidence from France. Energy Policy 2018, 115, 23–31. [Google Scholar] [CrossRef]
- Chitnis, M.; Fouquet, R.; Sorrell, S. Rebound effects for household energy services in the UK. Energy J. 2020, 41, 31–60. [Google Scholar] [CrossRef]
- Kong, L.; Mu, X.; Hu, G.; Tu, C. Will energy efficiency improvements reduce energy consumption? Perspective of rebound effect and evidence from beijing. Energy 2022, 263, 125665. [Google Scholar] [CrossRef]
- Ouyang, X.; Chen, J.; Du, K. Energy efficiency performance of the industrial sector: From the perspective of technological gap in different regions in China. Energy 2021, 214, 118865. [Google Scholar] [CrossRef]
- Inglesi-Lotz, R. Decomposing the South African CO2 emissions within a BRICS countries context: Signalling potential energy rebound effects. Energy 2018, 147, 648–654. [Google Scholar] [CrossRef]
- Baležentis, T.; Butkus, M.; Štreimikienė, D.; Shen, Z. Exploring the limits for increasing energy efficiency in the residential sector of the European Union: Insights from the rebound effect. Energy Policy 2021, 149, 112063. [Google Scholar] [CrossRef]
- Chen, J.; Gao, M.; Shahbaz, M.; Cheng, S.; Song, M. An improved decomposition approach toward energy rebound effects in China: Review since 1992. Renew. Sustain. Energy Rev. 2021, 145, 111141. [Google Scholar] [CrossRef]
- Cansino, J.M.; Ordóñez, M.; Prieto, M. Decomposition and measurement of the rebound effect: The case of energy efficiency improvements in Spain. Appl. Energy 2022, 306, 117961. [Google Scholar] [CrossRef]
- Omondi, C.; Njoka, F.; Musonye, F. An economy-wide rebound effect analysis of Kenya’s energy efficiency initiatives. J. Clean. Prod. 2022, 385, 135730. [Google Scholar] [CrossRef]
- Liu, Q.; Cheng, K.; Zhuang, Y. Estimation of city energy consumption in China based on downscaling energy balance tables. Energy 2022, 256, 124658. [Google Scholar] [CrossRef]
- Chen, J.; Gao, M.; Li, D.; Song, M. Analysis of the rebound effects of fossil and nonfossil energy in China based on sustainable development. Sustain. Dev. 2019, 28, 235–246. [Google Scholar] [CrossRef]
- Zeng, P.; Wei, X.; Duan, Z. Coupling and coordination analysis in urban agglomerations of China: Urbanization and ecological security perspectives. J. Clean. Prod. 2022, 365, 132730. [Google Scholar] [CrossRef]
- Xie, P.; Duan, Z.; Wei, T.; Pan, H. Spatial disparities and sources analysis of co-benefits between air pollution and carbon reduction in China. J. Environ. Manag. 2024, 354, 120433. [Google Scholar] [CrossRef]
- Wei, T.; Duan, Z.; Xie, P. Fall into the pseudo-decoupling trap: Type identification, trend characterization and solution path of carbon decoupling trap in urban agglomerations of China. Environ. Pollut. 2024, 361, 124782. [Google Scholar] [CrossRef] [PubMed]
- Sun, S.; Huang, C. Energy structure evaluation and optimization in BRICS: A dynamic analysis based on a slack based measurement DEA with undesirable outputs. Energy 2021, 216, 119251. [Google Scholar] [CrossRef]
- Farrell, M.J. The measurement of productive efficiency. J. R. Stat. Soc. Ser. A (Gen.) 1957, 120, 253–281. [Google Scholar] [CrossRef]
- Guo, R.; Yuan, Y. Different types of environmental regulations and heterogeneous influence on energy efficiency in the industrial sector: Evidence from Chinese provincial data. Energy Policy 2020, 145, 111747. [Google Scholar] [CrossRef]
- Duan, Z.; Wei, T.; Xie, P.; Lu, Y. Co-benefits and influencing factors exploration of air pollution and carbon reduction in China: Based on marginal abatement costs. Environ. Res. 2024, 252, 118742. [Google Scholar] [CrossRef] [PubMed]
- Chen, J.; Gao, M.; Cheng, S.; Hou, W.; Song, M.; Liu, X.; Liu, Y. Global 1 km × 1 km gridded revised real gross domestic product and electricity consumption during 1992–2019 based on calibrated nighttime light data. Sci. Data 2022, 9, 202. [Google Scholar] [CrossRef]
- Wei, T.; Duan, Z.; Xie, P. The multi-dimensional assessment and dynamic evolution of the energy trilemma in China. Environ. Impact Assess. Rev. 2025, 114, 107914. [Google Scholar] [CrossRef]
Disclaimer/Publisher’s Note: The statements, opinions and data contained in all publications are solely those of the individual author(s) and contributor(s) and not of MDPI and/or the editor(s). MDPI and/or the editor(s) disclaim responsibility for any injury to people or property resulting from any ideas, methods, instructions or products referred to in the content. |
© 2025 by the authors. Licensee MDPI, Basel, Switzerland. This article is an open access article distributed under the terms and conditions of the Creative Commons Attribution (CC BY) license (https://creativecommons.org/licenses/by/4.0/).