Article

Research on Strategy Selection of Power Supply Chain Under Renewable Energy Consumption and Energy Storage Cost Sharing

Center of Energy Economy Study, School of Business Administration, Henan Polytechnic University, Jiaozuo 454003, China
*
Author to whom correspondence should be addressed.
Sustainability 2025, 17(10), 4382; https://doi.org/10.3390/su17104382
Submission received: 27 March 2025 / Revised: 7 May 2025 / Accepted: 9 May 2025 / Published: 12 May 2025
(This article belongs to the Topic Energy Economics and Sustainable Development)

Abstract

:
The development of renewable energy in the power industry plays a crucial role in mitigating environmental degradation. The renewable energy (RE) consumption system and green certificate trading market are significant in promoting renewable energy adoption, while energy storage technology has advanced substantially to address power supply instability. Against this backdrop, this study employs a Stackelberg game approach to construct a power supply chain model, with generation companies as leaders and retail companies as followers, examining energy storage cost-sharing mechanisms and retailers’ renewable energy investment decisions. Key findings include the following: (1) a higher RE consumption ratio reduces wholesale prices, power stability, electricity demand, and retailers’ renewable investment; (2) when the energy storage cost coefficient exceeds a threshold, higher green certificate prices increase retailers’ renewable investment; (3) beyond the threshold, a higher RE consumption ratio incentivizes retailers to invest in renewables; (4) proportional cost sharing enhances renewable investment by approximately 15% and maximizes supply chain profits. The study provides decision-making insights for power companies and policy references for governments.

1. Introduction

Climate change has received significant global attention, with countries increasingly recognizing the significance of balancing economic development and environmental protection [1]. Renewable energy sources, including solar, wind, and hydroelectric power, play a pivotal role in mitigating environmental degradation and addressing global energy crises owing to their clean and sustainable characteristics [2]. Consequently, numerous nations have implemented targeted policies and established ambitious development goals to accelerate renewable energy adoption. For instance, Germany has set a target of having 80% renewable sources of the overall electricity usage by 2030. Similarly, Italy has announced a target of achieving 70–72% renewable energy by 2030 [3]. China has also committed to ensuring that non-fossil energy accounts for 25% of its total energy consumption by 2030 [4]. Corporate green innovation plays a significant role in mitigating environmental degradation [5,6,7,8,9]. To incentivize renewable energy production by enterprises, two key mechanisms have emerged internationally: the feed-in tariff subsidy policy (government-funded) and the renewable portfolio standard. Additionally, the establishment of green certificate markets enables enterprises to trade renewable energy generation in the form of tradable certificates [10,11]. In 2019, the National Development and Reform Commission of China issued the Notice on Establishing and Improving the Renewable Energy Power Consumption Guarantee Mechanism, marking the implementation of the renewable energy consumption system, requiring the electricity retail side to assume the responsibility of green power consumption [12].
The implementation of renewable energy quotas or consumption systems, along with the establishment of green certificate markets, significantly influences the decision-making processes of power enterprises. Under certain conditions, these mechanisms can enhance the willingness of enterprises to invest in renewable energy [13,14]. However, coal-fired power companies can fulfill quota obligations by purchasing green certificates, thereby avoiding the risks associated with investing in renewable energy production infrastructure [15]. Consequently, determining how to set appropriate renewable energy consumption targets to incentivize power companies to invest in sustainable energy production and reduce carbon dioxide emissions has become a critical challenge for policymakers.
The temporal imbalance in power demand, coupled with the instability and intermittency of renewable energy generation due to weather and other factors, may lead to substantial power losses [16,17]. The integration of energy storage technology provides an effective solution to these challenges by mitigating the supply–demand mismatch in electricity, enabling peak shaving and valley filling, converting intermittent energy into stable and high-quality power, reducing energy losses, and promoting the adoption of renewable energy [18].
However, the high initial cost of storing energy technology, combined with the lack of effective investment recovery channels, has dampened the willingness of power corporations to invest in energy storage equipment. Consequently, exploring cooperative approaches to energy storage investment has become increasingly important [19]. In practice, cooperative models for constructing energy storage power stations have begun to emerge. For instance, in China, the Power Investment Energy Subsidiary and China Resources New Energy Company jointly established a venture in 2024 to fund and develop shared energy storage power stations.
As electricity market reforms progress, the market has increasingly separated electricity generation from retailing. It is important to examine the impact of energy storage investment on the electricity supply chain. Therefore, exploring cost-sharing mechanisms for energy storage investments between upstream and downstream power companies is crucial to alleviate the financial strain on electricity production firms and ensuring equitable participation in energy storage development.
On the basis of the analysis above, we construct a power supply chain model led by a power producer and followed by an electricity retailer. Within the context of a renewable power consumption system and a market for trading green certificates, we examine the selection of green power consumption strategies on the sales side and the energy storage cost-sharing mechanisms between the upstream and downstream entities in the power supply chain. This paper is organized as follows: Section 2 reviews the relevant literature. Section 3 formulates the research problem. Section 4 develops the analytical models and derives their equilibrium solutions. Section 5 investigates how the renewable energy consumption ratio and green certificate pricing affect the models’ equilibrium outcomes. Section 6 analyzes electricity retailers’ strategic decisions under two energy storage cost-sharing mechanisms. Section 7 performs numerical simulations to validate the theoretical results. Section 8 extends the baseline model with additional considerations. Finally, Section 9 concludes with key findings and their managerial implications.

2. Literature Review

In recent years, the research on environmental policy, power supply chain, and energy storage investment has become a prominent focus in academia. The research relevant to this paper can be categorized into the following aspects.

2.1. Environmental Policy Research

In the electricity market, many countries have implemented feed-in tariff subsidy systems and renewable energy quota systems to encourage renewable energy investments by power enterprises. By analyzing data on China’s renewable energy development, Lin and Xie found that feed-in tariff subsidies have a substantial positive effect on the investment activities of renewable power corporates [20]. In the context of quota systems, Han and Fu, along with their respective co-authors, investigated renewable energy quota issues, focusing on the heterogeneity across regions and industries [21,22]. In a comparative study of Asia–Pacific energy transition policies, Kilinc-Ata assessed the impact of energy policy instruments, such as feed-in tariffs, quotas, tenders, and tax incentives. Empirical results indicate that feed-in tariffs, quotas, and tenders are particularly influential in accelerating the shift toward green energy systems [23]. Additionally, the system of trading in green certificates serves as another mechanism to promote renewable energy investments by power companies. Guo and Liu, along with their co-authors, proposed a blockchain-enabled system for excess consumption and green certificate trading. Their research confirmed the feasibility of the platform, demonstrating its potential to enhance the efficiency of green certificate trading [24,25]. Many scholars have explored the effects of multiple environmental policies and found that adopting different policy combinations in varying contexts can effectively reduce carbon footprint and encourage investment in renewable energy [26,27,28]. In line with its development status, China has implemented a renewable energy consumption system where the responsibility for green power consumption is assigned to the electricity sales side [29,30].

2.2. Research on the Current State of Energy Storage

Important advancement has been made in academic studies on energy storage, yielding fruitful results. Some scholars have focused on physical energy storage technologies. For instance, Wang and Chen, along with their co-authors, studied pumped storage systems and proposed an innovative pumped storage technology [31,32]. Other scholars have explored chemical energy storage technologies. For example, Wang and Liao, along with their co-authors, proposed optimization strategies for existing battery energy storage technologies to improve the health and performance of battery energy storage systems [33,34]. Moreover, some scholars have focused on electromagnetic energy storage technologies. For instance, Du et al. enhanced the performance of electromagnetic energy storage systems by developing new processes and materials and integrating them into these systems [35,36]. Mao et al. further incorporated flexible demand-side resources as generalized energy storage and examined their impact on the operational costs of integrated energy systems across day-ahead, intraday, and post-day timescales [37]. However, the high costs in connection with constructing energy storage power stations, coupled with the lack of effective cost recovery channels, have dampened enterprises’ willingness to invest in energy storage technology. To address this problem, some scholars have suggested reducing losses and energy storage costs through advancements in energy storage technology [38,39,40]. Others advocate for optimizing energy systems, developing new energy management models, and enhancing energy storage efficiency [41,42,43].

2.3. Research on Enterprise Cost-Allocation Problem

To address the issue of cost allocation between the upstream and downstream segments of the supply chain, many scholars have carried out extensive studies. Song and Shen, along with their co-authors, developed a cost-sharing contract model between retailers and producers in a green supply chain. Their findings suggest that such contracts enhance the greening of products and improve supply chain profitability [44,45]. Similarly, Herbon and David analyzed an integrated inventory supply chain where transportation costs are proportionally shared between the manufacturer and the retailer. Their study identified an optimal proportion for transportation cost allocation [46]. In the field of energy storage cost allocation, many scholars have conducted extensive research. Pei et al. proposed three energy storing cost distribution methods for renewable energy stations, addressing the energy storage cost-sharing problem on the production side. Their results indicate that selecting the appropriate method used to allocate cost under different conditions can enhance the efficiency of the power generation system [47]. Ma developed a game model including two rival renewable energy power suppliers, a power grid enterprise, and the government. In this model, advanced technology power suppliers use unit production or fixed costs to authorize less advanced power suppliers to adopt energy storage technology [48]. Mao et al. established a refined bilevel coordinated optimization operation model with energy suppliers acting as the master station while micro-energy grid operators and shared energy storage operators (SESO) serve as slave stations. This model effectively enhances the local consumption rate of renewable energy and improves the profitability of SESO [49].
An analysis of the aforementioned existing research reveals that existing studies predominantly focus on scenarios where power generation companies invest in renewable energy, such as Ma and Jamali et al. [48,50]. Although some scholars, such as Ji et al., have investigated renewable energy investment entities in the electricity supply chain by integrating green certificate trading markets with renewable energy consumption mechanisms, their studies overlook a critical aspect [13]. Under the framework of green certificate trading markets, electricity retailers can fulfill their renewable energy consumption obligations by purchasing green certificates, thereby avoiding the risks associated with direct investment in renewable energy. Consequently, it is imperative to explore whether electricity retailers will opt to invest in renewable energy generation. In terms of energy storage costs, numerous scholars advocate for technological innovation in energy storage to achieve cost reduction. Although some scholars, such as Ma and Jamali, have investigated the cost allocation of energy storage in electricity supply chains, their studies primarily focus on cost sharing among power generation companies or electricity retailers [48,50]. They overlook the critical issue of energy storage cost allocation between power generation companies and electricity retailers (i.e., upstream and downstream entities in the electricity supply chain).
Therefore, this paper presents the following innovations and novelties:
  • In contrast to existing studies that focus on power generation companies’ investments in renewable energy electricity, this paper constructs Stackelberg game models under various scenarios to investigate the renewable energy investment strategies of electricity retailers. Furthermore, we incorporate the renewable energy (RE) consumption policy and the green certificate trading market into the decision-making framework of the electricity supply chain.
  • In contrast to existing research focusing on cost allocation for energy storage within the same tier of the power supply chain, this paper investigates cost-sharing mechanisms for energy storage between generation companies and electricity retailers. Furthermore, it analyzes the impact of different cost-allocation models on power supply chain members’ decision-making.
  • To conduct a comparative analysis of the advantages and disadvantages of the two distinct energy storage cost allocation methods, in the numerical simulation section, we conduct a comparative analysis of decision-making behaviors among power supply chain members under four distinct models, followed by an examination of optimal mode selection strategies for power enterprises.

3. Problem Description and Model Assumptions

In a specific region, the power supply chain, consisting of a single traditional energy generator and a single electricity retailer, is responsible for meeting the region’s power supply needs. To encourage renewable energy investment by power enterprises, the government has implemented a renewable energy consumption policy targeting the electricity retail side. This policy mandates that electricity retailers bear a certain proportion of green power consumption, thereby reducing wind and solar energy curtailment rates and enhancing environmental benefits. The introduction of a green certificate market enables electricity retailers to convert green electricity into tradable green certificates. Retailers can fulfill their consumption requirements either by investing in renewable energy or by purchasing green certificates. To improve the stability of power supply and reduce power loss, power generators are incentivized and capable of constructing energy storage power stations. Electricity retailers benefit from a stable power supply provided by power producers, enabling them to sell electricity at higher prices and secure more orders due to the improved quality of power. However, in this process, a “free rider” problem arises, where electricity retailers benefit from the energy storage infrastructure without contributing to its costs. Therefore, it is reasonable for power generation companies to require electricity retailers to share the construction costs of energy storage power plants. Drawing on the approaches adopted by Ma and Jamali et al. [48,50], this cost sharing can be implemented using methodologies such as the unit power method or the proportion method.
Building upon the above background, we formulate a Stackelberg game model for the electricity supply chain, where the power generation company acts as the leader and the electricity retailer serves as the follower. This modeling framework aligns with established practices in prior studies [13,15,51]. To investigate the renewable energy investment decisions of electricity retail companies and the cost-sharing mechanisms for energy storage in the electricity supply chain, we construct four distinct game-theoretic models.
The specific components of the models are delineated in Table 1.
The structural diagram of the electric power supply chain is illustrated in Figure 1.
In order to better analyze the game models, the following assumptions have been applied:
  • The power supplier and retailer are both rational and share information.
  • Electricity price will not only be affected by demand, but also by the reliability of power supply [50]. The inverse demand function of users for electricity is shown in Equation (1).
    p = a b q + α r
  • The renewable energy input cost of power producers or retailers is 1 2 λ k 2 , where λ is the renewable energy input cost coefficient, and k represents the amount of renewable energy input [52].
  • The power supplier carries out the construction of an energy storage power station, and the construction cost of the energy storage power plant is 1 2 τ r 2 , where τ denotes the energy storage cost coefficient, and r denotes the stability of power supply [53].
  • The generator and retailers share energy storage investment costs. Under the unit power method, the retailer needs to bear the cost per unit of electricity δ of the power producer (generator decision-making). Under the proportional method, the retailer pays a certain percentage of the energy storage investment cost incurred by the generator, assuming that the proportion is γ (generator decision-making).
Table 2 lists the symbols used in this article and their meanings.

4. Model Construction and Solution

Based on the energy storage cost-sharing methods—the unit power method and the proportional method—this section examines whether electricity retailers choose to invest in renewable energy under the renewables consumption system. By constructing four models and solving their respective equilibrium solutions, this analysis lays the foundation for subsequent research on equilibrium analysis and strategy selection with respect to key parameters. The process of deriving the equilibrium solution is detailed in Appendix A.

4.1. Model Construction and Solution Under the Unit Power Method

Under the unit power method, the electricity seller needs to pay the cost of the power producer δ when it sells each unit of electricity to share the expenditure involved in establishing the energy storage facility for the power producer. To encourage active consumption of renewable energy by power retailers, the government has implemented a renewable energy consumption system and established a green certificate market, enabling the conversion of renewable energy power into tradable green certificates. Within this context, two game models are constructed: one focusing on renewable energy investment by the retailer (UK) and the other on the retailer’s purchase of green certificates (UT) to meet the required consumption.

4.1.1. RE-Investment (UK)

Under this model, the power producer uses the unit power method to share the energy storage cost with the retailer, and decides the electricity wholesale price ( w ) and the electricity reliability ( r ); then, the retailer decides the renewable energy input ( k ) and power supply ( q ). The profits of power producer ( Π m u k ) and retailer ( Π r u k ) are as follows.
Π m u k ( w , r ) = ( w c ) ( q k ) + δ q 1 2 τ r 2
Π r u k ( k , q ) = ( p w ) ( q k ) + p k 1 2 λ k 2 δ q + p t ( k θ q )
To make the Hessian matrix negative definite, using inverse induction to solve the problem, the relevant parameters need to meet the following condition: 4 b τ ( λ + 2 b ) α 2 λ > 0 . The equilibrium solution is shown in the first column of Table 3. w u k , r u k , k u k , q u k , s u k , p u k , Π m u k , and Π r u k represent the optimal solutions under the UK model for wholesale electricity price, power system stability, renewable energy investment by electricity retailers, electricity demand, electricity procurement volume of retailers, electricity price, power generation company profit, and electricity retailer profit, respectively.

4.1.2. No-RE-Investment (UT)

In this mode, the power producer and the retailer choose the unit power method to share the energy storage cost, and the retailer completes the consumption task by purchasing the green certificate. The power producer decides the wholesale price ( w ) and power quality ( r ), and then the retailer decides the power supply ( q ). The profits of generator and retailer are shown in Equations (4) and (5), respectively.
Π m u t ( w , r ) = ( w c + δ ) q 1 2 τ r 2
Π r u t ( q ) = ( p w δ ) q p t θ q
In order to ensure the negative definiteness of the Hessian matrix, the relevant parameters need to meet the following conditions: 4 b τ α 2 > 0 . Using reverse solution method, the specific solution outcomes can be found in the second column of Table 3. w u t , r u t , q u t , s u t , p u t , Π m u t , and Π r u t represent the optimal solutions under the UT model for wholesale electricity price, power system stability, electricity demand, electricity procurement volume of retailers, electricity price, power generation company profit, and electricity retailer profit, respectively.

4.2. Model Construction and Solution Under Proportional Method

Under the proportional method, the power producer and the retailer share the construction cost of the energy storage according to a certain proportion. The proportion shared by the power producer is ( 1 γ ) , and the proportion shared by the retailer is γ . Consistent with the unit power method, based on the responsibility of consumption, different models are constructed for the two consumption strategies of renewable energy investment and green certificate purchase, and the equilibrium solution is obtained.

4.2.1. RE-Investment (YK)

Under this model, the power producer and the retailer bear a certain proportion of the energy storage construction cost, respectively, and the retailer completes the consumption obligation through the renewable energy input. The power producer first decides the wholesale price ( w ) and power stability ( r ), and the retailer decides the renewable energy input ( k ) and power supply ( q ). The profit equations for the generator and the seller are presented in Formula (6) and Formula (7), respectively.
Π m y k ( w , r ) = ( w c ) ( q k ) 1 2 ( 1 γ ) τ r 2
Π r y k ( k , q ) = ( p w ) ( q k ) + p k 1 2 λ k 2 + p t ( k θ q ) 1 2 γ τ r 2
In order to ensure the negative definiteness of the Hessian matrix, the relevant parameters need to meet the following requirements: 4 b ( 1 γ ) ( 2 b + λ ) τ α 2 λ > 0 . Using the reverse solution method, the equilibrium solution is obtained as shown in the first column of Table 4. w y k , r y k , k y k , q y k , s y k , p y k , Π m y k , and Π r y k represent the optimal decision-making variables in the YK model for the electricity supply chain, corresponding to wholesale electricity price, power system stability, renewable energy investment by electricity retailers, electricity demand, electricity procurement volume of retailers, retail electricity price, power generation company profit, and electricity retailer profit, respectively.

4.2.2. No-RE-Investment (YT)

Under this model, the power producer and the retailer share the construction cost of the energy storage power station according to a certain proportion, and the retailer purchases the green certificate to complete the consumption. The power producer first decides the wholesale price ( w ) and power reliability ( r ), and then the retailer decides the power supply ( q ). The profit functions of generator and seller are shown in Formulas (8) and (9).
Π m y t ( w , r ) = ( w c ) q 1 2 ( 1 γ ) τ r 2
Π r y t ( q ) = ( p w ) q p t θ q 1 2 γ τ r 2
To ensure the negative definiteness of the Hessian matrix, the relevant parameters need to meet the following requirement: 4 b τ ( 1 γ ) α 2 > 0 . Using the reverse solution method, the equilibrium results are illustrated in the second column of Table 4. w y t , r y t , q y t , s y t , p y t , Π m y t , and Π r y t represent the optimal decision-making variables in the YK model for the electricity supply chain, corresponding to wholesale electricity price, power system stability, electricity demand, electricity procurement volume of retailers, retail electricity price, power generation company profit, and electricity retailer profit, respectively.

5. Equilibrium Analysis

From the above analysis, we see that when the energy companies choose the unit power method or the proportional method to share the energy storage cost, there exists a distinct Nash equilibrium solution regardless of whether the retailer invests in sustainable energy. Next, the influence of renewable energy consumption ratio ( δ ) and green certificate price ( p t ) on the equilibrium solutions is discussed. The proof procedure is detailed in Appendix A.
Proposition 1. 
The relationship between renewable energy consumption quotas and the decision-making processes of power enterprises is as follows:
1. 
w u k θ < 0 ; r u k θ < 0 ; q u k θ < 0 ; k u k θ < 0 ; s u k θ < 0 ;
2. 
w u t θ < 0 ; r u t θ < 0 ; s u t θ = q u t θ < 0 ;
3. 
w y k θ < 0 ; r y k θ < 0 ; q y k θ < 0 ; s y k θ < 0 ; k y k θ < 0 ;
4. 
w y t θ < 0 ;  r y t θ < 0 ;  s y t θ = q y t θ < 0 .
As indicated by Proposition 1, when generation companies and retail electricity companies share energy storage costs based on both the per-unit electricity method and the proportional method, the wholesale electricity price, power stability, electricity demand, and the volume of electricity procured by retail companies from generation companies all decrease as the renewable energy consumption quota increases—regardless of whether retail companies invest in renewable energy. Moreover, when retail companies invest in renewable energy, the renewable energy input under both cost-sharing methods also declines with an increase in the renewable energy consumption quota.
To further substantiate Proposition 1, we take Sichuan Province in China as an illustrative case. In 2020, the National Development and Reform Commission stipulated that the minimum compliance standard for the total renewable energy consumption obligation in Sichuan Province was set at 80.0%. This requirement was subsequently reduced to 74.0% in 2021 and further lowered to 70% in 2022. According to data from the Sichuan Statistical Yearbook, the province’s total available electricity supply from 2020 to 2022 was 418.23, 453.03, and 484.62 billion kWh, respectively, demonstrating a consistent upward trend. Concurrently, the electricity generated from renewable energy sources, including hydropower, nuclear power, and wind power, amounted to 365.46, 386.35, and 405.16 billion kWh during the same period, likewise exhibiting sustained growth. The findings demonstrate that the reduction in renewable energy consumption obligation quota contributes to an increase in both total electricity consumption and renewable energy generation, which aligns with the conclusion derived from Proposition 1.
Management implications: the implementation of renewable energy consumption quotas mandates that electricity retailers bear the responsibility for green power utilization, which is conducive to environmental benefits. However, excessively high quotas may undermine the incentives within the electricity market and lead to a reduction in retailers’ investments in renewable energy. For instance, Chinese 2024 policy on renewable energy consumption quotas stipulates a range of 0.2–0.4 for most provinces, except for regions in the west with abundant hydropower resources. Therefore, governments should avoid setting excessively high renewable energy consumption quotas to ensure both environmental sustainability and the healthy development of the electricity market.
Proposition 2. 
The relationship between electricity pricing and renewable energy consumption quota manifests in the following manner:
1. 
if  τ u k A < τ < τ u k B , then  p u k θ < 0 , if  τ > τ u k B , then  p u k θ > 0 ;
2. 
if  τ u t A < τ < τ u t B , then  p u t θ < 0 , if  τ > τ u t B , then  p u t θ > 0 ;
3. 
if  τ y k A < τ < τ y k B , then  p y k θ < 0 ; if  τ > τ y k B , then  p y k θ > 0 ;
4. 
if  τ y t A < τ < τ y t B , then  p y t θ < 0 ; if  τ > τ y t B , then  p y t θ > 0 .
Where:  τ u k A = α 2 λ 4 b ( 2 b + λ ) ,  τ u k B = α 2 λ b ( 4 b + λ ) ;  τ u t A = α 2 4 b ,  τ u t B = α 2 b ;  τ y k A = α 2 λ 4 b ( 1 γ ) ( 2 b + λ ) ,  τ y k B = α 2 λ b ( 1 γ ) ( 4 b + λ ) ;  τ y t A = α 2 4 b ( 1 γ ) ,  τ y t B = α 2 b ( 1 γ ) .
As demonstrated in Proposition 2, under all four operational modes, the impact of renewable energy consumption quota on electricity pricing is contingent upon the magnitude of the energy storage cost coefficient. Specifically, when the energy storage cost coefficient falls below a critical threshold, electricity prices exhibit a decreasing trend with the escalation of renewable energy consumption requirements; Conversely, when the energy storage cost coefficient exceeds said threshold, electricity prices demonstrate a positive correlation with increasing renewable energy consumption mandates.
When the energy storage cost coefficient remains relatively low, power generation enterprises incur minimal storage-related expenditures, thereby incentivizing electricity retailers to implement price reductions. Conversely, elevated energy storage cost coefficients impose substantial financial burdens on generation companies. Furthermore, increased renewable energy penetration simultaneously raises retailers’ operational costs, encompassing both direct renewable energy investments and renewable energy certificate procurement expenses. Consequently, electricity retailers exhibit a propensity to escalate retail electricity prices as a cost-transfer mechanism to end consumers.
Management implications: the electricity supply chain should enhance technological collaboration to reduce the energy storage cost coefficient, thereby alleviating cost pressures associated with energy storage. For policymakers, it is imperative to establish appropriate renewable energy consumption quota based on the actual development status of power enterprises, ensuring that electricity prices remain within a reasonable range while balancing environmental and economic objectives.
Proposition 3. 
The variations in wholesale electricity prices, power stability, and the volume of electricity procured by retail enterprises from coal-fired power plants in response to changes in the green power certificate trading price are as follows:
1. 
w u k p t < 0 ;  r u k p t < 0 ;  s u k p t < 0 ;
2. 
w u t p t < 0 ;  r u t p t < 0 ;   s u t p t < 0 ;
3. 
w y k p t < 0 ;   r y k p t < 0 ;   s y k p t < 0 ;
4. 
w y t p t < 0 ;  r y t p t < 0 ;  s y t p t < 0 .
As established in Proposition 3, when generation companies and retail electricity enterprises adopt either the per-unit method or the proportional method to share energy storage costs, the wholesale electricity price, power system stability, and the volume of electricity procured by retail enterprises from generation companies all decline as the green power certificate trading price increases, regardless of whether retail enterprises invest in renewable energy.
Management implications: a high green power certificate (GPC) trading price exerts a negative impact on the profitability of generation companies. To safeguard their economic interests, these firms tend to reduce investments in energy storage systems, thereby compromising power system stability. Consequently, regulatory authorities should strengthen oversight of the GPC trading platform to ensure prices remain within a lower optimal range. For example, The National Development and Reform Commission of China stated in its 2025 Guidelines on Promoting the High-Quality Development of the Renewable Energy Green Certificate Market that it is imperative to guide green certificate prices to operate at reasonable levels and ensure the rational formation of green certificate pricing in green electricity transactions.
Proposition 4. 
The variation in renewable energy investment by electricity retail enterprise in response to changes in green power certificate trading price is as follows:
1. 
if   τ > τ u k C , then   k u k p t > 0 ; if   τ u k A < τ < τ u k C , then  k u k p t < 0 ;
2. 
if  τ > τ y k C , then  k y k p t > 0 ; if  τ y k A < τ < τ y k C , then  k y k p t < 0 .
Where:  τ u k A = α 2 λ 4 b ( 2 b + λ ) ,  τ u k C = α 2 λ 2 b [ 2 b + ( 2 θ ) λ ] ;  τ y k A = α 2 λ 4 b ( 1 γ ) ( 2 b + λ ) ,  τ y k C = α 2 λ 2 b ( γ 1 ) ( λ θ 2 b 2 λ ) .
As demonstrated in Proposition 4, regardless of whether power generation enterprises and electricity retail enterprises adopt the per-unit method or the proportional method to share energy storage costs, when electricity retail enterprises chooses to invest in renewable energy, the impact of green power certificate trading prices on renewable energy investment levels is contingent upon the magnitude of the energy storage cost coefficient. (1) When the energy storage cost coefficient exceeds the threshold, the renewable energy investment by electricity retail enterprises increases with rising green certificate prices. (2) When the energy storage cost coefficient falls below the threshold, the renewable energy investment decreases as green certificate prices rise.
When the energy storage cost coefficient is relatively low, electricity retailers bear a smaller portion of the storage costs, allowing it sufficient capital to purchase green power certificates and thereby mitigate the risks associated with substantial renewable energy investments. In this scenario, if the green certificate trading price is high, as indicated in Proposition 3, electricity retailers tend to reduce both renewable energy investment and the volume of electricity procured from generation enterprises. This leads to a decrease in the total baseline for renewable energy consumption. Conversely, when the energy storage cost coefficient exceeds a certain threshold, electricity retailers face higher costs associated with renewable energy integration. To safeguard its profit margins, it seeks to capitalize on the green certificate trading market. Consequently, it increases its renewable energy investment, and as green certificate prices rise, the resulting profit incentives further amplify its renewable energy commitments.
Management implications: a moderately elevated energy storage cost coefficient can compel electricity retailers to increase their renewable energy investments. Therefore, from an environmental protection perspective, the energy storage cost coefficient should not be minimized without consideration.
Proposition 5. 
The relationship between electricity demand and the trading price of green certificates is as follows:
1. 
When  0 < θ < θ A , if   τ > τ u k D , then   q u k p t > 0 , if   τ u k A < τ < τ u k D , then  q u k p t < 0 ; when   θ A < θ < 1 ,  q u k p t < 0 ;   q u t p t < 0 ;
2. 
When  0 < θ < θ A , if  τ > τ y k D , then  q y k p t > 0 , if  τ y k A < τ < τ y k D , then  q y k p t < 0 ; when  θ A < θ < 1 , then  q y k p t < 0 ;  q y t p t < 0 .
Where,  θ A = 2 b 4 b + λ ,  τ u k A = α 2 λ 4 b ( 2 b + λ ) ,  τ u k D = α 2 ( 4 b + λ ) θ 2 b ,  τ y k A = α 2 λ 4 b ( 1 γ ) ( 2 b + λ ) ,  τ y k D = α 2 ( 1 γ ) [ ( 4 b + λ ) θ 2 b ] .
As demonstrated in Proposition 5, when electricity-selling enterprises do not invest in renewable energy, electricity demand invariably decreases as the price of green certificates rises. However, the scenario becomes more complex when these enterprises invest in renewable energy. (1) When the renewable energy consumption quota is below the threshold, a high energy storage cost coefficient leads to a positive correlation between electricity demand and green certificate price, whereas a low energy storage cost coefficient results in an inverse relationship; (2) when the renewable energy consumption quota exceeds the threshold, electricity demand consistently exhibits an inverse relationship with the green certificate price.
When the renewable energy consumption quota is relatively low, electricity retailers investing in renewable energy can more easily generate profits in the green certificate trading market. In conjunction with Proposition 4, a high energy storage cost coefficient compels retailers to increase renewable energy investment, thereby driving up electricity demand. Conversely, when the renewable energy consumption quota exceeds the threshold, electricity retailers face greater challenges in fulfilling consumption obligations, and rising green certificate prices further exacerbate these difficulties, which prompts retailers to reduce total electricity sales to lower the baseline for renewable energy consumption, ultimately leading to a decline in electricity demand.
Management implications: for power enterprises, it is imperative to adapt flexibly to policy changes by adjusting renewable energy investment levels and total electricity sales volume to safeguard their profit margins.
Proposition 6. 
The relationship between electricity prices and the trading prices of green power certificates is as follows:
1. 
When   θ A < θ < 1 , if   τ > τ u k E , then   p u k p t > 0 , if   τ u k A < τ < τ u k E , then   p u k p t < 0 ; when   0 < θ < θ A , then   p u k p t < 0 ;
2. 
If   τ u t A < τ < τ u t B , then   p u t p t < 0 , if   τ > τ u t B , then   p u t p t > 0 ;
3. 
When   θ A < θ < 1 , if   τ > τ y k E , then   p y k p t > 0 , if   τ y k A < τ < τ y k E , then   p y k p t < 0 ; when   0 < θ < θ A , then   p y k p t < 0 ;
4. 
If  τ > τ y t B , then  p y t p t > 0 ; if  τ y t A < τ < τ y t B , then  p y t p t < 0 .
Where,  θ A = 2 b 4 b + λ ;  τ u k A = α 2 λ 4 b ( 2 b + λ ) ,  τ u k E = α 2 ( b + λ θ ) b [ ( 4 b + λ ) θ 2 b ] ;  τ u t A = α 2 4 b ,  τ u t B = α 2 b ;  τ y k A = α 2 λ 4 b ( 1 γ ) ( 2 b + λ ) ,  τ y k E = α 2 ( b + θ λ ) b ( 1 γ ) [ ( 4 b + λ ) θ 2 b ] ;  τ y t A = α 2 4 b ( 1 γ ) ,  τ y t B = α 2 b ( 1 γ ) .
As demonstrated in Proposition 6, under the scenario where electricity-selling firms invest in renewable energy, if the renewable energy consumption quota exceeds the threshold, a high energy storage cost coefficient leads to a positive correlation between electricity prices and green certificate prices, whereas a low energy storage cost coefficient results in an inverse relationship. Conversely, if the renewable energy consumption weighting falls below the threshold, electricity prices consistently decrease as green certificate prices rise. When electricity-selling firms do not invest in renewable energy, a high energy storage cost coefficient induces a positive relationship between electricity prices and green certificate prices, while a low energy storage cost coefficient causes them to move in opposite directions.
When the renewable energy consumption ratio is high, electricity retailers face difficulties in seeking profits in the green certificate trading market. A high energy storage cost coefficient further increases its operational costs, prompting it to raise electricity prices to pass these costs on to consumers. Conversely, when the renewable energy consumption ratio is low, electricity retailers can more easily generate profits from the green certificate market, incentivizing it to reduce electricity prices. In cases where electricity retailers do not invest in renewable energy, both a high energy storage cost coefficient and elevated green certificate prices contribute to increased operational costs. Consequently, it tends to raise electricity prices to offset these additional expenses.
Management implications: the variation of electricity prices with respect to green certificate trading prices is significantly influenced by the renewable energy consumption quota and the magnitude of the energy storage cost coefficient. Consistent with the implications derived from the preceding propositions, maintaining a low renewable energy consumption weighting and moderate green certificate trading prices proves essential. Furthermore, power enterprises should intensify technological research and development to reduce the energy storage cost coefficient, thereby mitigating energy storage expenses.

6. Analysis of Power Retailer Strategy Selection

The preceding section primarily examined the impacts of the renewable energy consumption mandate and the green certificate trading market on the decision-making variables of power enterprises. To better analyze the strategic choices of electricity retailers under the Renewable Portfolio Standard, namely purchasing green power certificates and investing in renewable energy, this chapter conducts a comparative analysis of retailers’ different decisions under two energy storage cost allocation methods: the per-unit electricity method and the proportional method. The proof procedure is detailed in Appendix A.

6.1. Strategy Selection of Retailer Under Unit Electricity Method

Within the limitations of the renewable energy usage framework, this section investigates when the electricity supply chain chooses the unit power method to share the expense of building an energy storage facility, what factors lead the electricity retailer to opt for renewable energy investment and how the cost coefficient of energy storage investment ( τ ) and the share of renewable energy consumption ( θ ) influence the decision-making strategy of the retailer. We define θ U = 4 b ( a + p t 2 δ ) τ α 2 ( c + p t 2 δ ) 4 b p t τ , τ U = α 2 2 b .
Proposition 7. 
If   θ U < θ < 1 , then  w u k > w u t ,  r u k > r u t ,  p u k > p u t , otherwise,  w u k < w u t ,  r u k < r u t ,  p u k < p u t ; if  θ U < θ < 1 and  0 < τ < τ U , or  0 < θ < θ U and  τ > τ U , then  q u k > q u t ; if  θ U < θ < 1 and  τ > τ U , or  0 < θ < θ U and  0 < τ < τ U , then  q u k < q u t .
Proposition 7 illustrates that when the energy supply chain chooses the unit power method for energy storage cost sharing, if the share of renewable energy usage surpasses a limit ( θ U < θ < 1 ), the electricity wholesale price, power stability, and electricity price will increase due to the retailer’s selection of renewable energy inputs. Furthermore, when energy storage cost is low ( 0 < τ < τ U ), the electricity sales will increase. On the contrary, when the proportion of renewables consumption is below a specified threshold ( 0 < θ < θ U ), the seller chooses to purchase the green card to complete the consumption responsibility, which will increase the wholesale electricity price, power stability, and electricity price, and when the energy storage cost coefficient is low ( 0 < τ < τ U ), the electricity sales will increase. From the above analysis, it is evident that when energy storage cost is low, the higher proportion of renewable energy consumption exerts a motivating effect on renewable energy investment for the electricity retailer.

6.2. The Selection of Retailer Strategy Under the Proportional Method

This section discusses the conditions for the retailer to choose renewable energy investment when the power supply chain shares energy storage investment costs according to a certain proportion under the constraint of the renewable energy consumption system. We define θ Y = 4 b ( 1 γ ) ( a + p t ) τ ( c + p t ) α 2 4 b ( 1 γ ) p t τ and τ Y = α 2 2 b ( 1 γ ) .
Proposition 8. 
If   θ Y < θ < 1 , then  w y k > w y t ,  r y k > r y t ,  p y k > p y t ; otherwise,  w y k < w y t ,  r y k < r y t ,  p y k < p y t ; if  θ Y < θ < 1 and  0 < τ < τ Y , or  0 < θ < θ Y and  τ > τ Y , then  q y k > q y t ; if  θ Y < θ < 1 and  τ > τ Y , or  0 < θ < θ Y and  0 < τ < τ Y , then  q y k < q y t .
Proposition 8 shows that under the condition that the electricity supply chain chooses to share energy storage cost in proportion, when the share of renewable energy use surpasses a specific limit ( θ Y < θ < 1 ), the retailer’s choice of renewable energy investment strategy will result in a rise of the electricity wholesale price, power stability and electricity price, and when the energy storage cost is low ( 0 < τ < τ Y ), sale of electricity volume will also be increased. On the contrary, when the proportion of renewable energy consumed is less than a specified threshold ( 0 < θ < θ Y ), the retailer completes the consumption responsibility by purchasing the green certificate, which will increase the wholesale electricity price, power stability, and electricity price, and increase the electricity sales when the energy storage cost is low ( 0 < τ < τ Y ).
Management implications: from the above analysis, it is evident that regardless of whether the power enterprise adopts the unit power method or the proportional method to share the energy storage construction cost, a higher share of renewable energy used incentivizes the retailer’s renewable energy investment. This not only benefits environmental protection but also enhances power stability. At the same time, power enterprises should focus on advancing energy storage technology, reducing energy storage costs, and improving profitability. However, when the share of renewable energy usage is excessively high, the retailer’s increased renewable energy input can result in elevated electricity prices, which is detrimental to consumer interests.

7. Numerical Example

In order to better reflect the above conclusions and explore the strategic choice of energy storage cost-sharing mode in the power supply chain, this section uses MATLAB (2023a) software for numerical simulation. With reference to the “Notice on Renewable Energy Consumption Responsibility Weights and Related Matters for 2024” issued by China’s National Development and Reform Commission, the value range of renewable energy consumption weight θ is [0.2,0.7], and the value range of the green certificate price p t is [5,15]. In addition, building upon the work of Ji et al. and Jamali et al., we set a = 15 , b = 0.4 , α = 0.8 , c = 2 , λ = 3 , τ = 1 [13,50].
When the generator and the retailer choose the unit electricity method to share the energy storage cost, to ensure the electricity retailer profit, the unit electricity energy storage price should be lower than the disparity between the electricity consumer price and wholesale price. Suppose δ = β ( p w ) and the range of β is [0.1,0.3]. When p t = 10 , θ = 0.5 , the value range of δ under the UK model is [0.9,3.7] and [0.9,3.6] under the UK model. When the supply chain chooses the proportional method to share the cost, the value range of γ is [0.2,0.4]. Therefore, we can let δ = 2 , γ = 0.3 .

7.1. Electricity Retailers’ Renewable Energy Input Influencing Factors Analysis

Figure 2 illustrates the impact of the renewable energy consumption quota ( θ ) and the green power certificate trading price ( p t ) on the renewable energy investment volume of electricity-selling companies under different operational modes when these companies choose to invest in renewable energy. Additionally, it demonstrates how the energy storage cost per unit of electricity and the proportion of energy storage costs borne by electricity-selling companies affects the renewable energy investment levels.
According to Figure 2, when τ = 1 , it satisfies τ > τ u k C , τ > τ y k C , and the results presented in the figure are consistent with Propositions 1 and 3. The analysis yields the following inferences: (1) regarding the selection of energy storage cost allocation methods, the proportional approach provides stronger incentives for electricity retailers to invest in renewable energy, which increases by approximately 15%. (2) As the cost-sharing ratio ( γ ) increases, the renewable energy investment volume of electricity retailers also rises. Conversely, higher per-unit energy storage costs ( δ ) lead to a reduction in renewable energy investment.
Under the proportional allocation method, the energy storage costs borne by electricity retailers remain unaffected by total electricity sales volume. The high proportion of allocated storage costs creates an economic incentive for retailers to increase renewable energy investments, thereby generating profits in the green certificate trading market. In contrast, under the per-unit electricity method, higher sales volumes lead to proportionally higher energy storage costs. Consequently, electricity retailers exhibit a tendency to reduce renewable energy investment as a cost mitigation strategy.

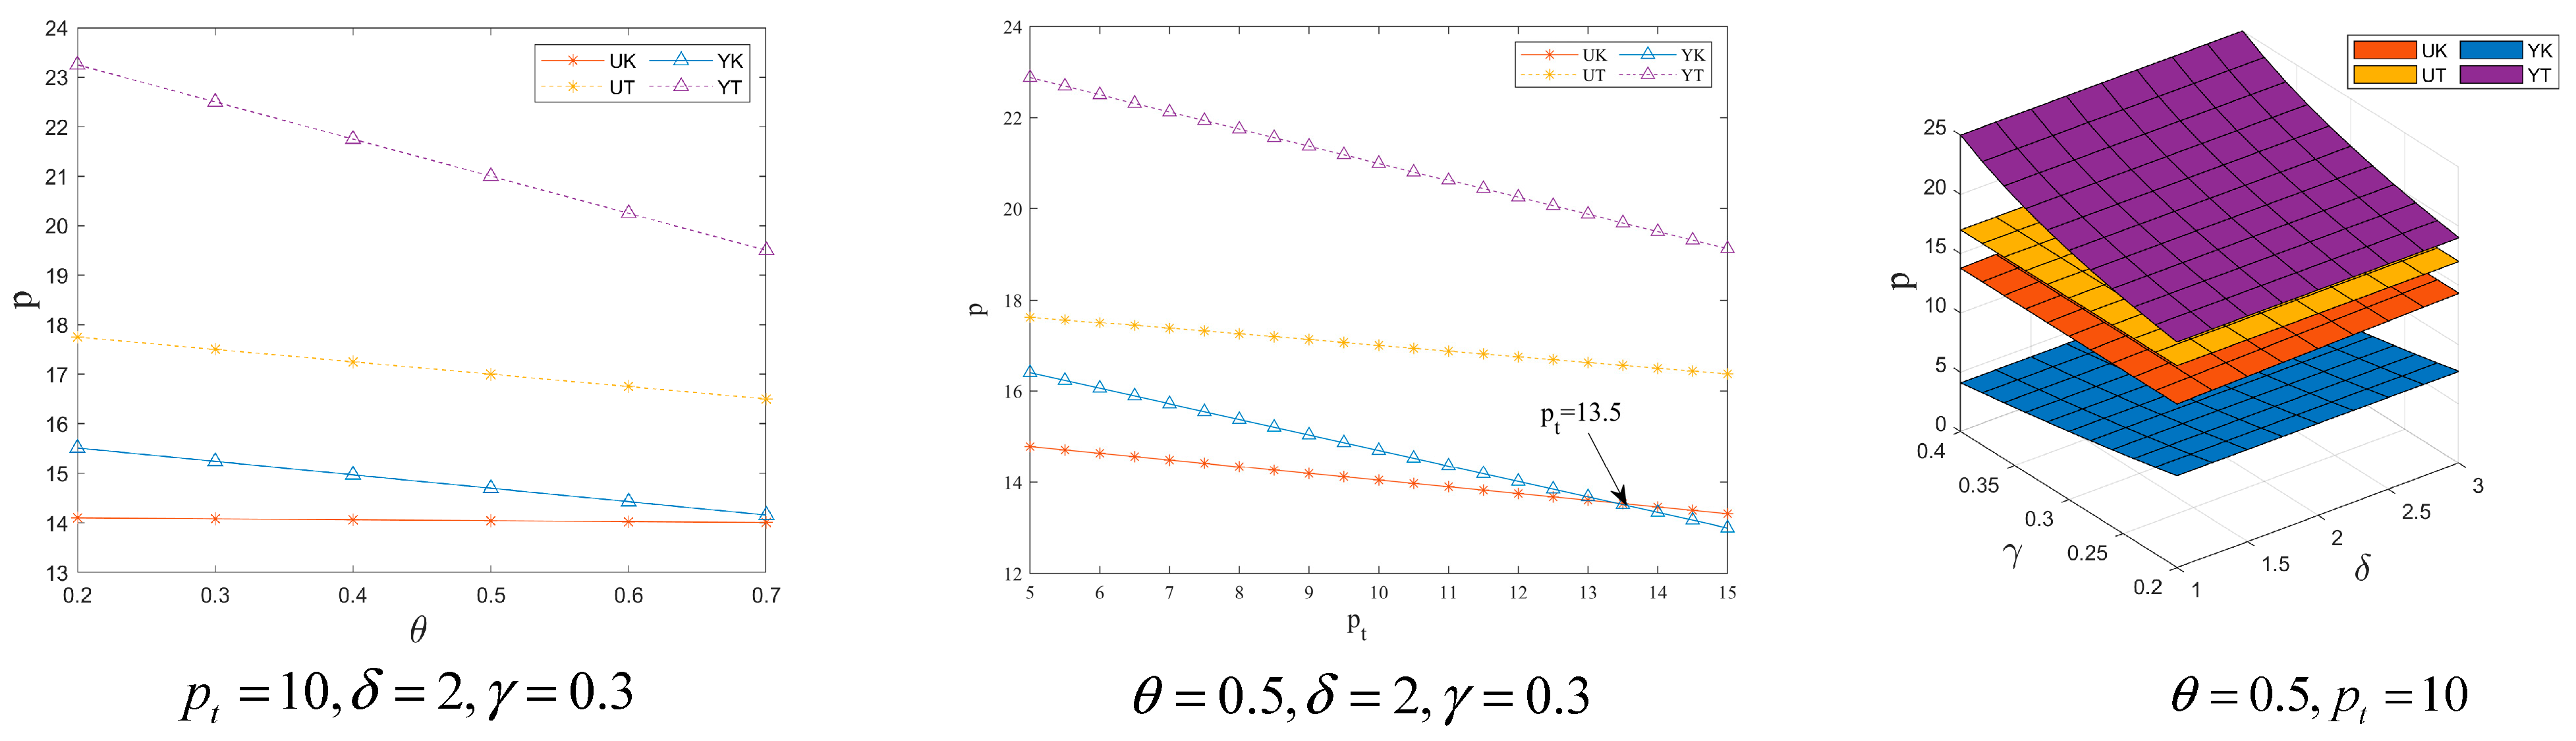
7.2. Electricity Price Impacts Factors Analysis

Figure 3 illustrates the impact of renewable energy consumption weight ( θ ) and green power certificate trading price ( p t ) on electricity price under four modes, while also demonstrating the influence of energy storage cost per unit of electricity sold by power selling companies ( δ ) and the cost-sharing ratio of energy storage ( γ ) on electricity price under different scenarios.
According to Figure 3, when θ = 0.5 and τ = 1 , it satisfies θ A < θ < 1 , 0 < θ < θ U , 0 < θ < θ Y , τ > τ u k B , τ u k A < τ < τ u k E , τ u t A < τ < τ u t B , τ y k A < τ < τ y k B , τ y k A < τ < τ y k E , τ y t A < τ < τ y t B , and the findings presented in the figure are consistent with Propositions 1–8. The analysis yields the following inferences: (1) investment in renewable energy by electricity retailers contributes to electricity price reduction. (2) Under the proportional cost allocation method, when retailers invest in renewable energy, electricity prices decrease with increasing energy storage cost-sharing ratio ( γ ); when retailers refrain from renewable energy investment, electricity prices exhibit an upward trend with rising cost-sharing ratio. (3) Under the per-unit electricity cost method, renewable energy investments by retailers lead to higher electricity prices as the per-unit energy storage cost ( δ ) increases. In scenarios without renewable energy investment, electricity prices remain constant regardless of per-unit storage cost variations.
The investment in renewable energy enables electricity retailers to generate profits in both the electricity market and the green certificate trading market. As demonstrated in Section 7.1, increasing the cost-sharing ratio of energy storage for retailers can enhance renewable energy deployment. To maximize profits in the green certificate market, retailers are consequently incentivized to reduce electricity prices, thereby stimulating electricity demand. For instance, in Qinghai Province, China, the renewable energy accommodation obligation for non-hydro renewable energy in 2024 increased by 2.8 percentage points compared to 2023, while the average renewable energy electricity price decreased by RMB 8 per megawatt-hour (MWh) and the traded electricity volume increased by 2.34%.

7.3. Analysis of the Factors Affecting the Profit of Power Producers

Figure 4 illustrates the impact of the renewable energy accommodation ratio ( θ ) and the green power certificate trading price ( p t ) on the profits of traditional coal-fired power generation companies. Additionally, it demonstrates the influence of the energy storage cost per unit of electricity sold by power retail companies ( δ ) and the energy storage cost allocation ratio ( γ ) on the profits of coal-fired power generation companies under different scenarios.
Based on Figure 4, the following inferences can be drawn: (1) investment in renewable energy by electricity retailers reduces the profits of power generation companies. (2) Increasing the renewable energy accommodation ratio or the green power certificate trading price leads to a decline in the profits of electricity generation companies. (3) Under the proportional allocation method, power generation companies achieve the highest profits when retailers do not invest in renewable energy, whereas their profit is minimized when retailers invest in renewables. (4) As the energy storage cost allocation ratio of electricity retailers rises, the profits of power generation companies increase, with a more pronounced growth when the retailers refrain from renewable energy investments. (5) When electricity retailers invest in renewable energy, the profits of power generation companies increase with rising energy storage costs per unit of electricity sold. Conversely, when retailers do not invest in renewable energy, the profits of generation companies remain constant.
When electricity retailers invest in renewable energy, their procurement from conventional generation companies decreases, consequently reducing the profits of power generators. However, an increase in the energy storage cost allocation borne by retailers alleviates the storage cost burden on generation companies, thereby enhancing their profitability. When electricity retail companies invest in renewable energy, adopting the per-unit electricity method can enhance the profitability of power generation enterprises. Conversely, when electricity retail companies do not invest in renewable energy, the proportional method proves more effective in increasing the profits of power generation enterprises.

7.4. Analysis of Influencing Factors of Retailer Profit

Figure 5 illustrates the impact of the renewable energy accommodation ratio ( θ ) and the green power certificate trading price ( p t ) on the profit of electricity-selling companies under four different models. Additionally, it reveals the influence of the unit electricity storage cost ( δ ) and the energy storage cost allocation ratio ( γ ) on the profit of electricity-selling companies across various scenarios.
According to Figure 5, (1) investing in renewable energy can increase the profit of electricity-selling companies, with the highest profit observed under the proportional method. (2) However, an increase in the renewable energy accommodation ratio and the green power certificate trading price tends to reduce the profit of electricity-selling companies. (3) Under the proportional method, when electricity-selling companies invest in renewable energy, their profit rises as the energy storage cost allocation ratio increases, whereas when they do not invest in renewable energy, their profit declines with an increase in this ratio. (4) Under the unit electricity method, if electricity-selling companies invest in renewable energy, the profit decreases as the unit electricity storage cost rises; conversely, if they do not invest, the profit remains constant.
As demonstrated in Section 7.1 and Section 7.2, electricity retailers exhibit a stronger preference for investing in renewable energy under the proportional method. A higher energy storage cost allocation ratio incentivizes retailers to increase renewable energy investments, thereby enhancing profits from the green certificate market. Meanwhile, the resulting reduction in electricity prices stimulates greater electricity demand. The profit gain from increased demand outweighs the revenue loss from lower electricity prices, leading to the highest overall profitability. However, elevated renewable energy accommodation requirements constrain retailers’ profit potential in the green certificate market. Consequently, as the renewable energy accommodation ratio increases, overall profits decline.

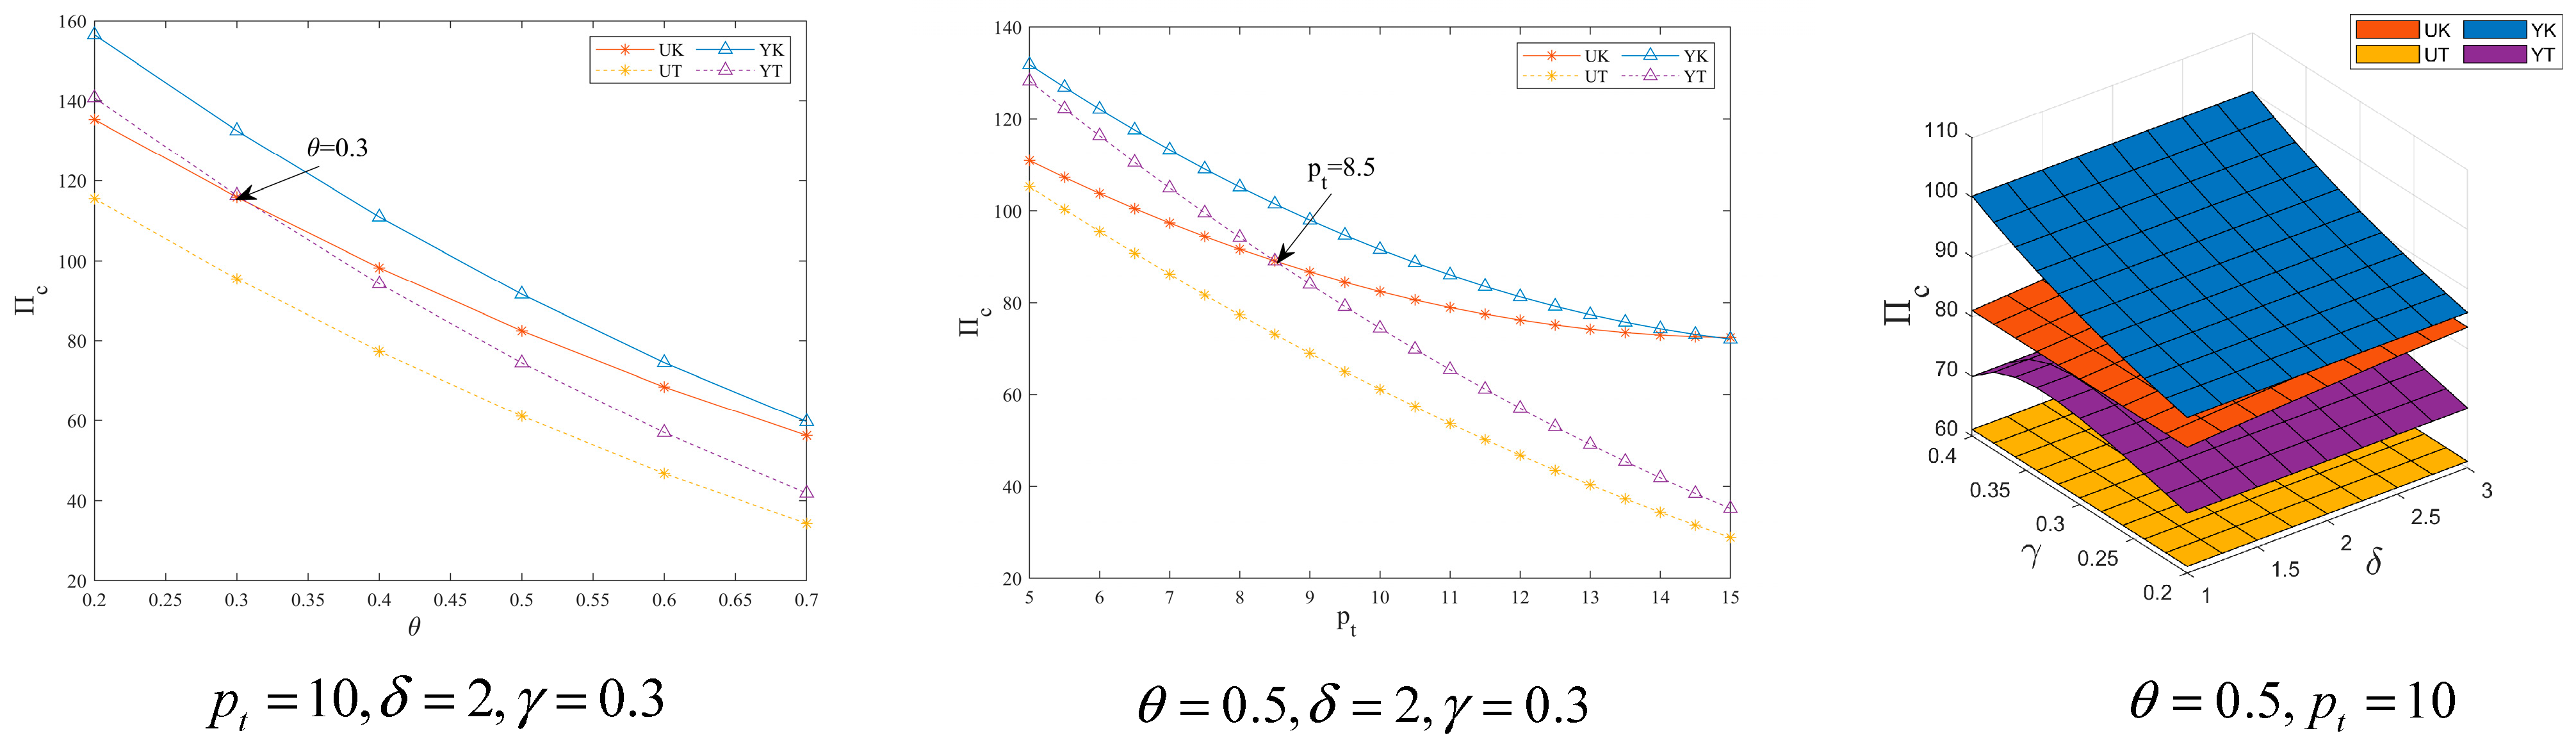
7.5. Analysis of Influencing Factors of Supply Chain Profit

Figure 6 illustrates the impact of renewable energy consumption quota ( θ ) and green power certificate trading price ( p t ) on the profits of the power supply chain. Additionally, it demonstrates the influence of the energy storage cost per unit of electricity for retail electricity companies ( δ ) and the energy storage cost allocation ratio ( γ ) on the power supply chain’s profitability.
As shown in Figure 6, (1) an increase in the renewable energy consumption quota and green power certificate trading price leads to a decline in the profitability of the power supply chain. (2) The power supply chain achieves maximum profit when adopting the proportional cost-sharing method for energy storage and when the retail electricity company invests in renewable energy. (3) Under the proportional method, if the retail electricity company invests in renewable energy, the supply chain profit increases with a higher energy storage cost allocation ratio; conversely, if the company does not invest, the profit initially rises and then declines. (4) Under the per-unit electricity method, if the retail electricity company invests in renewable energy, the supply chain profit decreases with rising energy storage cost per unit of electricity; however, if no investment is made, the profit remains constant.
As demonstrated in Section 7.3 and Section 7.4, under the proportional cost-sharing method, investment in renewable energy by the retail electricity company can significantly enhance its profitability. Although this approach may adversely affect the profits of the coal-fired power generation company, the resulting profit increase for the retail electricity company outweighs the profit reduction for the generation company. Consequently, the total supply chain profit reaches its maximum under this scenario.

7.6. Comparative Analysis of the Four Models

Table 5 presents a comprehensive overview of the numerical simulation results, illustrating the ranking (from highest to lowest) of the following indicators across the four operational models: renewable energy investment by electricity retailers, electricity pricing, profits of coal-fired power generation companies, profits of electricity retailers, and overall profitability of the power supply chain.
As evidenced in Table 5, it can be clearly observed that renewable energy investments by electricity retailers not only enhance their own profitability but also increase the overall profit of the power supply chain, while simultaneously reducing electricity price. This represents the optimal decision from both environmental and consumer perspectives. However, such investments lead to diminished profits for coal-fired power generation companies.
Regarding the choice of energy storage cost allocation methods, the proportional approach demonstrates superior advantages over the per-unit electricity method, as it promotes higher renewable energy investment by retailers and greater supply chain profitability. Under conditions where the power supply chain adopts proportional cost sharing for energy storage and retailers invest in renewable energy, electricity price can be minimized while supply chain profits are maximized. Nevertheless, this configuration results in the lowest profitability for coal-fired power generation companies.
Given the benefits that investing in renewable energy can bring to electricity retail companies, many such firms are inclined to invest in renewable energy projects. For instance, The Brazilian subsidiary of EDF Renewables acquired an 80% equity stake in the photovoltaic power plant in Brazil from Canadian Solar Inc. Through this equity investment, the company directly engaged in the operation of local renewable energy assets, thereby promoting the development of the clean energy market in South America. Similarly, Green Mountain Energy in the United States invests in renewable energy generation facilities, providing households and commercial users with pollution-free green electricity derived from wind, solar, and other renewable sources. Additionally, the company expands its revenue streams by selling renewable energy certificates and carbon offset solutions.
Regarding the investment costs of energy storage, most energy companies prefer a proportional cost-sharing approach, which involves jointly investing in the construction of energy storage facilities. For example, Salt River Project (SRP), a U.S. public power utility, collaborated with EDP Renewables North America—a renewable energy firm—to co-invest in the Flatland Battery Energy Storage System in Arizona. Similarly, China’s Dong Jian Digital Energy Group partnered with Comika Mining, a Congolese mining company, to jointly develop the Southern Africa Digital Energy Microgrid Project, which includes a 135 MWh energy storage system.
From this, it is evident that, both theoretically and practically, electricity retail companies investing in renewable energy contribute to the efficient operation of the power market and facilitate the low-carbon development of the energy sector. The joint investment by power enterprises in energy storage power stations not only alleviates the financial burden on individual companies but also enhances the stability of power supply, particularly in the context of rapid renewable energy expansion.

8. Model Extension

To further advance the research, we build upon the YT model, where generation companies and electricity retailers share energy storage costs proportionally and the retailers do not invest in renewable energy. Under conditions of demand-side information asymmetry, we incorporate the risk-averse behavior of either the generation company or the electricity retailer into the analysis. We employ the mean-variance approach to characterize the risk aversion of generation companies and electricity retailers. Accordingly, the utility functions for risk-averse generation companies and electricity retailers can be expressed as follows:
U m = E ( Π m ) η m ( V a r ( Π m ) )
U r = E ( Π r ) η r ( V a r ( Π r ) )
Among them, Π m and Π r represent the profits of the power generation companies and the electricity retail companies, respectively, while η m > 0 and η r > 0 denote the risk-aversion coefficients of the power generation companies and the electricity retail companies, respectively. A higher coefficient indicates a more pronounced tendency toward risk aversion.
Based on the inverse electricity demand function assumed in this study, p = a b q + α r , the electricity demand function can be derived as q = a b p b α r b . By defining a b = m , 1 b = n , α b = f , the electricity demand function can be expressed as q = m n p + f r . Among them, m represents the baseline demand in the electricity market, n denotes the coefficient of electricity price’s impact on demand, and f signifies the coefficient of power supply stability’s influence on electricity demand.
Driven by profit-maximizing motives, retailers may distort authentic market information m and share m r with power generation companies. Based on the received m r , along with historical average demand data m ¯ , and an assessed trust level T ( 0 T 1 ) toward the retailer, the generator synthesizes and derives the final demand information m m = m r T + ( 1 T ) m ¯ . Therefore, the perceived market demand by the electricity retailer is q = m n p + f r + ε , while the perceived market demand by the generator is q = m m n p + f r + ε = m r T + ( 1 T ) m ¯ n p + f r + ε . Here, ε denotes a random coefficient with a mean of 0 and variance of σ 2 . The superscript i = { 1 , 2 } and subscript j = { 1 , 2 } denote the scenarios of risk aversion for the generation company and the retail company, respectively.
When the power generation company is risk averse and the electricity retail company is risk neutral, the utility functions of both entities can be expressed as follows:
U m 1 ( w , r ) = ( w c ) ( m m n p + f r ) 1 2 ( 1 γ ) τ r 2 η m ( w c ) σ
U r 1 ( q ) = ( p w p t θ ) ( m n p + f r ) 1 2 γ τ r 2
To ensure the negative definiteness of the Hessian matrix, the relevant parameters must satisfy f 2 + 4 n ( 1 + γ ) τ < 0 . By solving the equations, the optimal solutions for the wholesale electricity price w and the retail electricity price p are derived as follows:
w 1 = c f 2 2 1 + γ m c n + 2 m ¯ 1 + T 2 m r T + n p t θ + 2 η m σ τ f 2 + 4 n 1 + γ τ
p 1 = f 2 m + c n + m ¯ 1 + T m r T + n p t θ + η m σ + n 1 + γ m + 2 m ¯ + c n + 2 m r T 2 m ¯ T + n p t θ 2 η m σ τ n f 2 + 4 n 1 + γ τ
When the power generation company is risk neutral and the electricity retail company is risk averse, the utility functions of both entities can be expressed as follows:
U m 2 ( w , r ) = ( w c ) ( m n p + f r ) 1 2 ( 1 γ ) τ r 2
U r 2 ( q ) = ( p w p t θ ) ( m n p + f r ) 1 2 γ τ r 2 η r ( p w p t θ ) σ
To ensure the negative definiteness of the Hessian matrix, the relevant parameters must satisfy f 2 + 4 n ( 1 + γ ) τ < 0 . The optimal solutions for the wholesale electricity price w and the retail electricity price p are then derived as follows:
w 2 = c f 2 + 2 1 + γ m + c n n p t θ + η r σ τ f 2 + 4 n 1 + γ τ
p 2 = f 2 c n + n p t θ η r σ + n 1 + γ 3 m + c n + n p t θ η r σ τ n f 2 + 4 n 1 + γ τ
The demonstration of the proof is provided in Appendix A.
Proposition 9. 
When power generation companies exhibit risk-averse behavior, the variations in wholesale electricity prices and electricity tariffs in relation to the level of trust that generation companies place in electricity retail companies are as follows:
1. 
When  m r > m ¯ ,  w 1 T > 0 ,  p 1 T > 0 ;
2. 
When  m r < m ¯ ,  w 1 T < 0 ,  p 1 T < 0 .
According to Proposition 9, when the demand information shared by the electricity retail company with the power generation company exceeds the historical average demand level, an increase in the generation company’s trust toward the retail company will lead to higher wholesale electricity prices and retail electricity tariffs. Conversely, when the market demand information provided by the retail company falls below the historical average, the wholesale electricity prices and retail tariffs move inversely with the generation company’s level of trust in the retail company.
The underlying mechanism for this phenomenon can be explained as follows: when the trust level ( T ) is sufficiently high, power generation companies rely more heavily on the demand information provided by electricity retailers to assess market conditions. Given the elevated m r , generation firms perceive the market demand to be robust and thus tend to raise wholesale electricity prices to maximize profits. In response to the increased wholesale price, retailers subsequently elevate the retail electricity price to maintain their margins. Conversely, when the market demand information disclosed by retailers to generators is below the historical average, generation companies interpret this as weak market demand. Consequently, they strategically reduce the wholesale price to stimulate electricity consumption. To further boost demand and sustain profitability, retailers correspondingly lower the retail electricity price.
Proposition 10. 
The variations of wholesale electricity prices and electricity prices with the renewable energy consumption responsibility weight under the two models are as follows:
1. 
w 1 θ < 0 ; when  τ l < τ < τ h ,  p 1 θ < 0 , when  τ > τ h ,  p 1 θ > 0 ;
2. 
w 2 θ < 0 ; when  τ l < τ < τ h ,  p 2 θ < 0 , when  τ > τ h ,  p 2 θ > 0 .
Proposition 11. 
The variations of wholesale electricity prices and electricity tariffs with the trading price of green certificate under the two models are as follows:
1. 
w 1 p t > 0 ; when  τ l < τ < τ h ,  p 1 p t < 0 , when  τ > τ h ,  p 1 p t > 0 ;
2. 
w 2 p t < 0 ; when  τ l < τ < τ h ,  p 2 p t < 0 , when  τ > τ h ,  p 2 p t > 0 .
We define  τ l = f 2 4 n ( 1 γ ) and  τ h = f 2 n ( 1 γ ) .
Propositions 10 and 11 demonstrate that under conditions of demand information asymmetry, an increase in both the renewable energy consumption quota and the green certificate trading price leads to a reduction in wholesale electricity price, regardless of whether the generation company or the retail company is risk averse. When the energy storage cost coefficient is sufficiently high ( τ > τ h ), an increase in the renewable energy consumption quota and the green certificate trading price results in higher retail electricity prices; conversely, when ( τ l < τ < τ h ), it leads to lower retail electricity prices. This finding aligns with the conclusions drawn earlier.
The results indicate that the impacts of the renewable energy consumption quota and green certificate trading price on wholesale and retail electricity price remain consistent, irrespective of risk-aversion behaviors among power companies under demand information asymmetry.

9. Concluding Remarks

9.1. Conclusions

Within a renewable energy consumption system framework, this study investigates a power supply chain comprising one traditional energy producer and one electricity retailer. By considering two energy storage cost-sharing approaches–the unit power method and the proportional method–along with the retailer’s option to invest in renewable energy, we develop four distinct analytical models. The principal findings are summarized as follows:
  • An increase in the proportion of renewable energy consumption results in a reduction in wholesale electricity price, power stability, renewable energy input, power purchases, electricity sales, and the profits of power companies. However, the impact on electricity prices is influenced by the energy storing cost coefficient. When the coefficient for energy storage expenses is elevated, electricity prices increase as the proportion of renewable energy utilized rises; otherwise, electricity prices decrease.
  • An increase in the green certificate price reduces the wholesale price, power stability, and electricity purchases. However, the changes in electricity price, renewable energy input, and electricity sales resulting from a growth in the green certificate price are influenced by both the energy storage cost coefficient and the proportion of renewable energy consumption.
  • A higher greater proportion of cost allocation for energy storage can compel electricity retail companies to increase their investment in renewable energy.
  • When the energy storage cost is low, a higher proportion of renewable energy consumption can encourage the seller to allocate funds for sustainable energy, and the retailer’s investment in renewable energy will reduce electricity price and improve its own profit, but will damage the benefit of the power producer.
  • When the power supplier and the retailer use the proportional method to share the energy storage cost and the retailer chooses to take responsibility for consumption by investing in renewable energy, it can increase the renewable energy input of the retailer and maximize the supply chain profit.
  • Under conditions of information asymmetry in demand, when generation companies or electricity retailers exhibit risk-averse behavior, the renewable consumption standards and the trading price of green certificates will not alter their impact on both wholesale electricity price and general electricity pricing.

9.2. Practical Implication

On the basis of the above conclusions of the research, the following implications for management can be drawn:
  • For governments, it is essential to establish a renewable energy consumption ratio based on regional realities. For instance, regions abundant in hydropower, wind, and solar resources should be assigned higher renewable energy consumption quotas, while those with scarce renewable resources may be subject to lower requirements. Meanwhile, proactive measures must be taken to regulate the green certificate trading market, ensuring prices remain within a reasonable range. Policymakers should facilitate technological collaboration within the power sector, revitalize certificate trading, and stabilize price levels through targeted interventions.
  • For the power companies, it is essential to strengthen energy storage research and development to reduce energy storage costs, enhance profitability, and improve total supply chain profit. It should also appropriately increase the proportion of energy storage costs allocated to electricity retail companies, which can compel electricity retail company to invest in renewable energy.
  • For the retailer, investing in renewable energy can reduce electricity prices and increase both their own profits and the overall supply chain profits. This approach not only benefits environmental protection but also serves the interests of consumers. In recent years, China has actively promoted the market-oriented reform of its power sector. For electricity retail companies, aligning with policy requirements and proactively investing in renewable energy represents a strategic approach to fostering their own development.

9.3. Limitations and Future Directions

This study has several limitations and further attempts. (1) This paper examines a supply chain model comprising a single power generation company and a single electricity retail company, whereas real-world scenarios often involve multiple entities. Future research could consider multi-agent situations; (2) This study does not account for the long-term dynamic effects of the renewable energy consumption system and the green certificate trading market on the electricity supply chain. Further research could refine the model to incorporate these factors.

Author Contributions

Conceptualization, D.W.; methodology, Q.W.; software, Q.W. and J.G.; validation, D.W., Q.W., and J.G.; formal analysis, D.W. and Q.W.; investigation, D.W.; resources, Q.W.; data curation, Q.W.; writing—original draft preparation, D.W. and Q.W.; writing—review and editing, D.W., Q.W., and J.G.; supervision, Q.W. and J.G.; project administration, D.W. funding acquisition, D.W. All authors have read and agreed to the published version of the manuscript.

Funding

This research was funded by “Henan Province Philosophy and Social Science Planning Project”, grant number 2023CJJ145; “the Fundamental Research Funds for the Universities of Henan Province”, grant number SKJYB2023-13; “Henan Polytechnic University Humanities and Social Sciences Research Fund”, grant number GSKY2024-03; “Funding of Innovation Team of School of Business Administration of Henan Polytechnic University”, grant number GSKC2024-1.

Institutional Review Board Statement

Not applicable.

Informed Consent Statement

Not applicable.

Data Availability Statement

Data can be accessed upon request.

Acknowledgments

All individuals would like to thank the reviewers for their useful comments and suggestions.

Conflicts of Interest

The authors declare no financial interests or personal connections that could have affected the results of this study.

Appendix A

When the power supply chain chooses the unit power method to share the energy storage cost and the electricity retailer invests in renewable energy, the solution process of the model (UK model) is as follows.
The reverse induction method is used to solve the problem. Firstly, the optimal response functions of electricity-selling decision variables k u k and q u k are solved. The Hessian matrix H 1 of Π r u k with respect to k u k and q u k is 2 b 0 0 λ . Obviously, H 1 is negative definite, so there exists a maximum value of Π r u k . Combining Π r u k k u k = 0 and Π r u k q u k = 0 , the optimal reaction functions of k u k and q u k can be obtained. Then, they are brought into the profit function of the power producer ( Π m u k ) to solve its optimal response function. The Hessian matrix H 2 of Π m u k with respect to w u k and r u k is 1 b 2 λ α 2 b α 2 b τ . In order to ensure that H 2 is negative definite, 4 b τ ( λ + 2 b ) α 2 λ > 0 can be obtained. Combining Π m u k r u k = 0 and Π m u k w u k = 0 , we can obtain w u k and r u k . When we bring them into the optimal reaction function of k u k and q u k , we can obtain k u k and q u k . Finally, w u k , r u k , k u k , and q u k are introduced into p , Π m u k , and Π r u k to obtain p u k , s u k , Π m u k , and Π r u k , where, s u k = q u k k u k .
The proof process of the other three models and extend models is the same as above.
The proof process for the first conclusion of Propositions 1 and 2 is as follows: the equilibrium solution w u k , r u k , k u k , q u k , p u k , and s u k obtained by the UK model are derived from the renewable energy consumption ratio θ , respectively, and w u k θ < 0 , r u k θ < 0 , q u k θ < 0 , k u k θ < 0 , s u k θ < 0 is obtained easily. p u k θ = p t α 2 λ b 4 b + λ τ α 2 λ 4 b 2 b + λ τ , when α 2 λ 4 b ( 2 b + λ ) < τ < α 2 λ b ( 4 b + λ ) , p u k θ < 0 ; when τ > α 2 λ b ( 4 b + λ ) , then p u k θ > 0 .
The proving process of the first conclusion of Propositions 3–6: the equilibrium solution w u k , r u k , k u k , q u k , p u k , and s u k obtained by the UK model are respectively derived from the green power certificate transaction price p t , and it is easy to obtain w u k p t < 0 , r u k p t < 0 , s u k p t < 0 . k u k p t = α 2 λ + 2 b 2 b + 2 + θ λ τ λ α 2 λ 4 b 2 b + λ τ , when α 2 λ 4 b ( 2 b + λ ) < τ < α 2 λ 2 b [ 2 b + ( 2 θ ) λ ] , k u k p t < 0 , when τ > α 2 λ 2 b [ 2 b + ( 2 θ ) λ ] , then k u k p t > 0 . q u k p t = α 2 + b 2 + 4 θ τ + θ λ τ α 2 λ 4 b 2 b + λ τ , when 0 < θ < 2 b 4 b + λ , if α 2 λ 4 b ( 2 b + λ ) < τ < α 2 ( 4 b + λ ) θ 2 b , then q u k p t < 0 , and if τ > α 2 ( 4 b + λ ) θ 2 b , then q u k p t > 0 ; when 2 b 4 b + λ < θ < 1 , q u k p t < 0 . p u k p t = α 2 b + θ λ b b 2 + 4 θ + θ λ τ α 2 λ 4 b 2 b + λ τ , when 2 b 4 b + λ < θ < 1 , if α 2 λ 4 b ( 2 b + λ ) < τ < α 2 ( b + λ θ ) b [ ( 4 b + λ ) θ 2 b ] , p u k p t < 0 , and if τ > α 2 ( b + λ θ ) b [ ( 4 b + λ ) θ 2 b ] , then p u k p t > 0 ; when 0 < θ < 2 b 4 b + λ , p u k p t < 0 .
The proof process of other conclusions of Propositions 1–6 and 9–11 is the same as above.
Proof of Proposition 7. 
According to the equilibrium solutions of the UK model and the UT model, we can obtain w u k w u t = 4 b 2 τ α 2 c + p t 2 δ 4 b a + p t 2 δ p t θ τ α 2 4 b τ α 2 λ 4 b 2 b + λ τ , r u k r u t = 2 b α α 2 c + p t 2 δ 4 b a + p t 2 δ p t θ τ α 2 4 b τ α 2 λ 4 b 2 b + λ τ , p u k p u t = b α 2 + 2 b τ α 2 c + p t 2 δ 4 b a + p t 2 δ p t θ τ α 2 4 b τ α 2 λ 4 b 2 b + λ τ . When 4 b ( a + p t 2 δ ) τ α 2 ( c + p t 2 δ ) 4 b p t τ < θ < 1 , the above formula is greater than 0; on the contrary, when 0 < θ < 4 b ( a + p t 2 δ ) τ α 2 ( c + p t 2 δ ) 4 b p t τ , the above formula is less than 0. q u k q u t = α 2 2 b τ α 2 c + p t 2 δ 4 b a + p t 2 δ p t θ τ α 2 4 b τ α 2 λ 4 b 2 b + λ τ , when 0 < θ < 4 b ( a + p t 2 δ ) τ α 2 ( c + p t 2 δ ) 4 b p t τ and τ > α 2 2 b or 4 b ( a + p t 2 δ ) τ α 2 ( c + p t 2 δ ) 4 b p t τ < θ < 1 and 0 < τ < α 2 2 b , q u k q u t > 0 ; when 0 < θ < 4 b ( a + p t 2 δ ) τ α 2 ( c + p t 2 δ ) 4 b p t τ and 0 < τ < α 2 2 b or 4 b ( a + p t 2 δ ) τ α 2 ( c + p t 2 δ ) 4 b p t τ < θ < 1 and τ > α 2 2 b , q u k q u t < 0 .☐
The proof process of Proposition 8 is the same as above.

References

  1. Feng, C.; Liu, Y.-Q.; Yang, J. Do Energy Trade Patterns Affect Renewable Energy Development? The Threshold Role of Digital Economy and Economic Freedom. Technol. Forecast. Soc. Change 2024, 203, 123371. [Google Scholar] [CrossRef]
  2. Erdoğdu, A.; Dayi, F.; Yanik, A.; Yildiz, F.; Ganji, F. Innovative Solutions for Combating Climate Change: Advancing Sustainable Energy and Consumption Practices for a Greener Future. Sustainability 2025, 17, 2697. [Google Scholar] [CrossRef]
  3. Maliszewska-Nienartowicz, J. Impact of Russia’s Invasion of Ukraine on Renewable Energy Development in Germany and Italy. Util. Policy 2024, 87, 101731. [Google Scholar] [CrossRef]
  4. Yang, Z.; Liu, H.; Yuan, Y.; Li, M. Can Renewable Energy Development Facilitate China’s Sustainable Energy Transition? Perspective from Energy Trilemma. Energy 2024, 304, 132160. [Google Scholar] [CrossRef]
  5. Huang, H.; Mbanyele, W.; Wang, F.; Song, M.; Wang, Y. Climbing the Quality Ladder of Green Innovation: Does Green Finance Matter? Technol. Forecast. Soc. Change 2022, 184, 122007. [Google Scholar] [CrossRef]
  6. Mbanyele, W.; Huang, H.; Muchenje, L.T.; Zhao, J. How Does Climate Regulatory Risk Influence Labor Employment Decisions? Evidence from a Quasi-Natural Experiment. China Econ. Rev. 2024, 87, 102236. [Google Scholar] [CrossRef]
  7. Liu, Y.; Huang, H.; Mbanyele, W.; Wei, Z.; Li, X. How Does Green Industrial Policy Affect Corporate Green Innovation? Evidence from the Green Factory Identification in China. Energy Econ. 2025, 141, 108047. [Google Scholar] [CrossRef]
  8. Huang, H.; Mbanyele, W.; Zhang, L.; Chen, X.-L.; Song, M. Nonnegligible Transition Risks towards Net-Zero Economy: Lessons from Green Finance Initiatives in China. J. Environ. Manag. 2025, 375, 124132. [Google Scholar] [CrossRef]
  9. Huang, H.; Mbanyele, W.; Wang, F.; Zhang, C.; Zhao, X. Nudging Corporate Environmental Responsibility through Green Finance? Quasi-Natural Experimental Evidence from China. J. Bus. Res. 2023, 167, 114147. [Google Scholar] [CrossRef]
  10. Dimitriadis, C.N.; Tsimopoulos, E.G.; Georgiadis, M.C. Co-Optimized Trading Strategy of a Renewable Energy Aggregator in Electricity and Green Certificates Markets. Renew. Energy 2024, 236, 121444. [Google Scholar] [CrossRef]
  11. Karakosta, O.; Petropoulou, D. The EU Electricity Market: Renewables Targets, Tradable Green Certificates and Electricity Trade. Energy Econ. 2022, 111, 106034. [Google Scholar] [CrossRef]
  12. Yu, X.; Ge, S.; Zhou, D.; Wang, Q.; Chang, C.-T.; Sang, X. Whether Feed-in Tariff Can Be Effectively Replaced or Not? An Integrated Analysis of Renewable Portfolio Standards and Green Certificate Trading. Energy 2022, 245, 123241. [Google Scholar] [CrossRef]
  13. Ji, C.-Y.; Tan, Z.-K.; Chen, B.-J.; Zhou, D.-C.; Qian, W.-Y. The Impact of Environmental Policies on Renewable Energy Investment Decisions in the Power Supply Chain. Energy Policy 2024, 186, 113987. [Google Scholar] [CrossRef]
  14. Meng, X.; Yu, Y. Can Renewable Energy Portfolio Standards and Carbon Tax Policies Promote Carbon Emission Reduction in China’s Power Industry? Energy Policy 2023, 174, 113461. [Google Scholar] [CrossRef]
  15. Bangjun, W.; Yue, W.; Linyu, C.; Kejia, X. Supply Chain Coordination Mechanisms of Coal Power Enterprises under Renewable Energy Quota System: A Perspective of Game Analysis. J. Clean. Prod. 2023, 426, 139108. [Google Scholar] [CrossRef]
  16. Qu, R.; Kou, R.; Zhang, T. The Impact of Weather Variability on Renewable Energy Consumption: Insights from Explainable Machine Learning Models. Sustainability 2025, 17, 87. [Google Scholar] [CrossRef]
  17. Chakraborty, N.; Choudhury, N.B.D.; Tiwari, P.K. Profit Maximization of Retailers with Intermittent Renewable Sources and Energy Storage Systems in Deregulated Electricity Market with Modern Optimization Techniques: A Review. Renew. Energy Focus 2023, 47, 100492. [Google Scholar] [CrossRef]
  18. Radmanesh, H.; Barkam, E. Robust Co-Planning of Transmission Expansion and Merchant Energy Storage Investments Considering Long- and Short-Term Uncertainties. Int. J. Electr. Power Energy Syst. 2024, 160, 110062. [Google Scholar] [CrossRef]
  19. Nazari, A.; Keypour, R.; Amjady, N. Joint Investment of Community Energy Storage Systems in Distribution Networks Using Modified Nash Bargaining Theory. Appl. Energy 2021, 301, 117475. [Google Scholar] [CrossRef]
  20. Lin, B.; Xie, Y. How Feed-in-Tariff Subsidies Affect Renewable Energy Investments in China? New Evidence from Firm-Level Data. Energy 2024, 294, 130853. [Google Scholar] [CrossRef]
  21. Fu, C.; Li, Y.; Giwa, A.S.; Luo, S. Impact Analysis of Renewable Portfolio Standard on Retail Power Market Considering Quota Heterogeneity. Heliyon 2023, 9, e20701. [Google Scholar] [CrossRef]
  22. Han, R.; Li, J.; Guo, Z. Optimal Quota in China’s Energy Capping Policy in 2030 with Renewable Targets and Sectoral Heterogeneity. Energy 2022, 239, 121971. [Google Scholar] [CrossRef]
  23. Kilinc-Ata, N.; Proskuryakova, L.N. The Contribution of Energy Policies to Green Energy Transition in the Asia-Pacific Region. Renew. Energy 2024, 237, 121797. [Google Scholar] [CrossRef]
  24. Guo, S.; Feng, T. Blockchain-Based Smart Trading Mechanism for Renewable Energy Power Consumption Vouchers and Green Certificates: Platform Design and Simulation. Appl. Energy 2024, 369, 123351. [Google Scholar] [CrossRef]
  25. Liu, W.-J.; Chiu, W.-Y.; Hua, W. Blockchain-Enabled Renewable Energy Certificate Trading: A Secure and Privacy-Preserving Approach. Energy 2024, 290, 130110. [Google Scholar] [CrossRef]
  26. Li, J.; Hu, Y.; Chi, Y.; Liu, D.; Yang, S.; Gao, Z.; Chen, Y. Analysis on the Synergy between Markets of Electricity, Carbon, and Tradable Green Certificates in China. Energy 2024, 302, 131808. [Google Scholar] [CrossRef]
  27. Zhen, J.; Zhao, L.; Yi, H.; Cheng, Y.; Wang, K.; Hu, H. Cross-Provincial Collaborative Transaction That Considers Both the Green Electricity and the Green Certificate Markets under a Renewable Portfolio Standard Policy. Appl. Energy 2024, 372, 123787. [Google Scholar] [CrossRef]
  28. Wang, H.; Feng, T.; Kong, J.; Cui, M.; Xu, M. Grappling with the Trade-Offs of Carbon Emission Trading and Green Certificate: Achieving Carbon Neutrality in China. J. Environ. Manag. 2024, 360, 121101. [Google Scholar] [CrossRef]
  29. Deng, X.; Lv, T.; Xu, J.; Hou, X.; Liu, F. Assessing the Integration Effect of Inter-Regional Transmission on Variable Power Generation under Renewable Energy Consumption Policy in China. Energy Policy 2022, 170, 113219. [Google Scholar] [CrossRef]
  30. Zahan, I.; Shuai, C. Towards a Green Economic Policy Framework in China: Role of Green Investment in Fostering Clean Energy Consumption and Environmental Sustainability. Environ. Sci. Pollut. Res. 2021, 28, 43618–43628. [Google Scholar] [CrossRef]
  31. Wang, K.; Shi, X.; He, Q. Thermodynamic Analysis of Novel Carbon Dioxide Pumped-Thermal Energy Storage System. Appl. Therm. Eng. 2024, 225, 123969. [Google Scholar] [CrossRef]
  32. Chen, L.; Wang, J.; Lou, J.; Cheng, Z.; Wang, N.; Cheng, S.; Sun, L. Thermo-Economic Analysis of a Pumped Thermal Energy Storage Combining Cooling, Heating and Power System Coupled with Photovoltaic Thermal Collector: Exploration of Low-Grade Thermal Energy Storage. J. Energy Storage 2024, 96, 112718. [Google Scholar] [CrossRef]
  33. Liao, Y.; Yang, C.; Bai, J.; He, Q.; Wang, H.; Chen, H.; Zhang, Q.; Chen, L. Insights into the Cycling Stability of Manganese-Based Zinc-Ion Batteries: From Energy Storage Mechanisms to Capacity Fluctuation and Optimization Strategies. Chem. Sci. 2024, 15, 7441–7473. [Google Scholar] [CrossRef] [PubMed]
  34. Wang, G.; Gu, L.; Li, Y.; Hou, P.; Huang, Q.; Shi, Z.; Liu, Y.; Ma, F.; Zhao, J. Optimization of Guide Plates and Orifice Plates on Thermal Management of Battery Energy Storage System. Appl. Therm. Eng. 2024, 253, 123794. [Google Scholar] [CrossRef]
  35. Du, B.; Zhu, H.; Bai, Y.; Xu, J.; Pan, Z.; Wang, Q.; Wang, X.; Zhou, J. Multifunction Lignin-Based Carbon Nanofibers with Enhanced Electromagnetic Wave Absorption and Surpercapacitive Energy Storage Capabilities. Int. J. Biol. Macromol. 2022, 199, 201–211. [Google Scholar] [CrossRef]
  36. Alsalmah, H.A.; Alruqi, A.B.; Nur, O.; Rajeh, A. Developing Polymer Nanocomposite Films of ZnO/NiFe2O4 Nanohybrids, Polyvinyl Pyrrolidone, and Chitosan for Flexible Electromagnetic Applications and Energy Storage Devices. Ceram. Int. 2024, 50, 28794–28804. [Google Scholar] [CrossRef]
  37. Mao, Y.; Cai, Z.; Jiao, X.; Long, D. Multi-Timescale Optimization Scheduling of Integrated Energy Systems Oriented towards Generalized Energy Storage Services. Sci. Rep. 2025, 15, 8549. [Google Scholar] [CrossRef]
  38. Zhang, T.; She, X.; Nie, B.; Kildahl, H.; Ding, Y. Integration of Liquid Air Energy Storage with Ammonia Synthesis Process for Resource Efficiency and Cost-Effectiveness. J. Energy Storage 2024, 97, 112637. [Google Scholar] [CrossRef]
  39. Kurşun, B.; Ökten, K.; Özak, B. Reducing the Cost of Electricity Storage with a Novel Solar Thermal Support Scenario in Pumped Thermal Energy Storage (PTES). Appl. Therm. Eng. 2024, 241, 122317. [Google Scholar] [CrossRef]
  40. Iñigo Agirre-Muñoz, J.; Lozano, J.; Serrano, A.; Arribalzaga, P.; Martinez, I.; Bielsa, D. Experimental Results and Upscaling Assessment of a Cost-Efficient Macro-Encapsulated Latent Heat Energy Storage System for Heat Pumps. Energy Build. 2024, 319, 114496. [Google Scholar] [CrossRef]
  41. Rajeevkumar Urs, R.; Mussawar, O.; Zaiter, I.; Mezher, T.; Mayyas, A. Navigating the Cost-Efficiency Frontier: Exploring the Viability of Grid-Connected Energy Storage Systems in Meeting District Load Demand. Energy Convers. Manag. 2024, 299, 117828. [Google Scholar] [CrossRef]
  42. Ahsan, M.B.F.; Mekhilef, S.; Soon, T.K.; Usama, M.; Binti Mubin, M.; Seyedmahmoudian, M.; Stojcevski, A.; Mokhlis, H.; Shrivastava, P.; Alshammari, O. Optimal Sizing and Cost Analysis of Hybrid Energy Storage System for EVs Using Metaheuristic PSO and Firefly Algorithms. Results Eng. 2024, 23, 102358. [Google Scholar] [CrossRef]
  43. Ahmad, F.; Ashraf, I.; Iqbal, A.; Bilal, M.; Yadav, D.M. Energy Management Strategies and Cost Benefits Analysis at Electric Vehicle Parking Lots Incorporating Photovoltaic Energy Generation and Energy Storage System. J. Energy Storage 2024, 92, 112105. [Google Scholar] [CrossRef]
  44. Song, H.; Chu, H.; Yue, H.; Chen, Y. Green Supply Chain Coordination with Substitutable Products under Cost Sharing Contract. Procedia Comput. Sci. 2022, 199, 1112–1119. [Google Scholar] [CrossRef]
  45. Shen, J.; Yan, H.; Sheng, L.; Zhang, B.; Shi, Y.; Shen, S. Pricing Decision in an Uncertain Green Product Supply Chain under Cost Sharing Contract. Expert Syst. Appl. 2024, 250, 123899. [Google Scholar] [CrossRef]
  46. Herbon, A.; David, I. Optimal Manufacturer’s Cost Sharing Ratio, Shipping Policy and Production Rate—A Two-Echelon Supply Chain. Oper. Res. Perspect. 2023, 10, 100264. [Google Scholar] [CrossRef]
  47. Pei, N.; Song, X.; Zhang, Z.; Peña-Mora, F. Optimizing the Operation and Allocating the Cost of Shared Energy Storage for Multiple Renewable Energy Stations in Power Generation Side. Energy Convers. Manag. 2024, 302, 118148. [Google Scholar] [CrossRef]
  48. Ma, X.; Pan, Y.; Zhang, M.; Ma, J.; Yang, W. A Study of Licensing Strategies for Energy Storage Technologies in the Renewable Electricity Supply Chain under Government Subsidies. J. Clean. Prod. 2023, 420, 138343. [Google Scholar] [CrossRef]
  49. Mao, Y.; Wan, K.; Xu, D.; Long, D. Collaborative Operation Strategy of Multiple Microenergy Grids Considering Demand-Side Energy-Sharing Behavior. Energy Sci. Eng. 2024, 12, 3663–3680. [Google Scholar] [CrossRef]
  50. Jamali, M.-B.; Rasti-Barzoki, M. A Game-Theoretic Approach for Examining Government Support Strategies and Licensing Contracts in an Electricity Supply Chain with Technology Spillover: A Case Study of Iran. Energy 2022, 242, 122919. [Google Scholar] [CrossRef]
  51. Yuan, J.; Wang, L.; Li, Y. Carbon Emission Reduction Dynamic Decision-Making in the Electricity Supply Chain with Different Carbon Emission Allowance Principles. Energy 2024, 312, 133563. [Google Scholar] [CrossRef]
  52. Menanteau, P.; Finon, D.; Lamy, M.-L. Prices versus Quantities: Choosing Policies for Promoting the Development of Renewable Energy. Energy Policy 2003, 31, 799–812. [Google Scholar] [CrossRef]
  53. Jamali, M.-B.; Rasti-Barzoki, M. A Game Theoretic Approach for Green and Non-Green Product Pricing in Chain-to-Chain Competitive Sustainable and Regular Dual-Channel Supply Chains. J. Clean. Prod. 2018, 170, 1029–1043. [Google Scholar] [CrossRef]
Figure 1. Power supply chain structure diagram.
Sustainability 17 04382 g001
Figure 2. Comparative analysis of renewable energy investment by electricity retail companies under different energy storage cost allocation methods.
Sustainability 17 04382 g002
Figure 3. Comparative analysis of the impact of various coefficients on electricity price under four distinct models.
Sustainability 17 04382 g003
Figure 4. Comparative analysis of the impact of different coefficients on power generation companies’ profits under four modeling frameworks.
Sustainability 17 04382 g004
Figure 5. Comparative analysis of the impact of varying coefficients on electricity retailer profitability.
Sustainability 17 04382 g005
Figure 6. Impact analysis of different coefficients on profitability in the electric power supply chain.
Sustainability 17 04382 g006
Table 1. Comparative analysis of four model scenarios.
UKUTYKYT
RE inputYesNoYesNo
cost allocationUnit powerUnit powerProportionProportion
Table 2. Parameters of the model and their meanings.
NotationDescription
Parameters\
a Basic electricity price, a > 0 . (USD/MWh)
b The influence coefficient of power demand on electricity price, b > 0 .
α The influence coefficient of power reliability on electricity price, α > 0 .
c Unit power generation cost of the traditional power producer, 0 < c < w . (USD/MWh)
λ Renewable energy investment cost coefficient of retailer, λ > 0 . (USD/h)
τ Energy storage cost coefficient, τ > 0 . (USD/h)
δ When M = UK and M = UT, it represents the unit power energy storage cost charged by the power producer to the retailer, δ > 0 . (USD/MWh)
γ When M = YK and M = YT, it represents the percentage of energy storage investment cost charged by power supplier to electricity retailer, 0 < γ < 1 .
Dependent variables\
w Wholesale price, w > c . (USD/MWh)
p Electricity price, p > w . (USD/MWh)
k Renewable energy input of retailer, k > 0 . (MW)
q Electricity demand, q > 0 . (MW)
s The electricity purchased by the retailer from the power producer, 0 < s q . (MW)
r Electricity reliability, r > 0 .
Π The profit of electric power enterprise, Π > 0 .(USD)
Decision variables\
p t Green certificate transaction price, p t > 0 . (USD)
θ Renewable energy consumption ratio, 0 < θ < 1 .
Index\
j Subscripts, j = { m , r , c } representing power supplier, electricity retailer and power supply chain, respectively
i Superscript, the strategy of electric power enterprise. ( i = { u k , u t , y k . y t } )
Table 3. UK and UT strategy equilibrium solutions.
UKUT
w u k = α 2 c δ λ 2 b [ 2 b c p t + a + c 2 δ p t θ λ ] τ α 2 λ 4 b 2 b + λ τ w u t = α 2 c δ 2 b a + c 2 δ p t θ τ α 2 4 b τ
r u k = α 2 A b + R λ α 2 λ 4 b 2 b + λ τ r u t = R α α 2 4 b τ
k u k = A α 2 λ 2 b [ 2 b c + p t + a + c + 2 p t 2 δ p t θ λ ] τ λ [ α 2 λ 4 b 2 b + λ τ ] \
q u k = A α 2 + 2 b 2 a + c p t + 2 δ + 2 p t θ τ + R λ τ α 2 λ 4 b 2 b + λ τ q u t = R τ α 2 + 4 b τ
s u k = α 2 δ λ + 2 b + λ [ 2 b c + p t + a + c + p t θ λ ] τ λ α 2 λ 4 b 2 b + λ τ s u t = R τ α 2 + 4 b τ
p u k = A α 2 b 2 ( 2 a + c p t + 2 δ + 2 δ θ ) b 2 τ + [ ( c + p t θ ) α 2 ( 3 a + c + p t θ ) b τ ] λ α 2 λ 4 b ( 2 b + λ ) τ p u t = 3 a b τ + c + p t θ α 2 b τ α 2 4 b τ
Π m u k = 2 α 2 ( A + δ ) δ λ R 2 τ λ 2 4 b 2 ( c + p t 2 ) 2 τ 4 b ( c 2 + c p t A a + 2 p t δ 2 δ 2 + A p t θ ) τ λ 2 λ [ α 2 λ 4 b 2 b + λ τ ] Π m u t = R 2 τ 2 α 2 + 8 b τ
Π r u k = α 4 λ [ 2 b A 2 + ( A + δ ) 2 λ ] 4 b α 2 λ ( 2 b M + N λ ) τ + 2 b ( 2 b + λ ) [ 4 b 2 ( c + p t ) 2 + 4 b K λ + A 2 λ 2 ] τ 2 2 λ α 2 λ 4 b 2 b + λ τ 2 Π r u t = R 2 b τ 2 α 2 4 b τ 2
A = c + p t 2 δ , R = a + c + p t θ , M = 2 c p t + 2 p t 2 + 2 a A c δ 5 p t δ + 4 δ 2 2 p t A θ , N = 2 a c + p t + 2 p t δ 2 3 a δ c [ δ + 2 p t 1 + θ ] + p t 2 p t + 3 δ θ , K = 2 a 2 + c 2 + 2 p t δ 2 + p t 3 p t + 4 δ θ + 2 p t 2 θ 2 + c p t 1 + θ a c 3 p t + 4 δ + 4 p t θ .
Table 4. YK and YT strategy equilibrium solutions.
YKYT
w y k = c α 2 λ + 2 b ( γ 1 ) [ 2 b c p t + a + c p t θ λ ] τ α 2 λ + 4 b ( γ 1 ) 2 b + λ τ w y t = c α 2 + 2 b 1 + γ a + c p t θ τ α 2 + 4 b 1 + γ τ
r y k = α [ 2 b c + p t + R λ ] α 2 λ + 4 b ( γ 1 ) 2 b + λ τ r y t = α R α 2 + 4 b τ ( γ 1 )
k y k = c α 2 λ + 2 b ( γ 1 ) [ 2 b ( c p t ) + ( a + c p t θ ) λ ] τ + p t [ α 2 λ + 4 b ( γ 1 ) 2 b + λ τ ] [ α 2 λ + 4 b ( γ 1 ) 2 b + λ τ ] λ \
q y k = c + p t α 2 2 b ( γ 1 ) c p t + 2 p t θ τ ( γ 1 ) [ c + p t θ λ + a 4 b + λ ] τ α 2 λ + 4 b ( γ 1 ) 2 b + λ τ q y t = ( 1 γ ) R τ α 2 + 4 b τ ( γ 1 )
s y k = 1 + γ 2 b + λ [ 2 b c + p t + a + c + p t θ λ ] τ λ α 2 λ + 4 b 1 + γ 2 b + λ τ s y t = ( 1 γ ) R τ α 2 + 4 b τ ( γ 1 )
p y k = α 2 b c + p t + c + p t θ λ + b ( γ 1 ) { 2 b [ 2 a + c + p t 2 θ 1 ] + 3 a + c + p t θ λ } τ α 2 λ + 4 b ( γ 1 ) 2 b + λ τ p y t = α 2 c + p t θ + b ( γ 1 ) 3 a + c + p t θ τ α 2 + 4 b τ ( γ 1 )
Π m y k = ( γ 1 ) 2 b c + p t + R λ 2 τ 2 λ α 2 λ + 4 b ( γ 1 ) 2 b + λ τ Π m y t = R 2 τ ( γ 1 ) 2 α 2 + 8 b τ ( γ 1 )
Π r y k = 16 b 4 c + p t 2 1 + γ 2 τ 2 8 b 3 1 + γ 2 λ τ 2 E + α 2 λ 2 [ c + p t 2 α 2 + γ R 2 λ τ ] 4 b 2 λ τ [ F + ( 1 + γ ) 2 G λ τ ] + 2 b λ H 2 λ α 2 λ + 4 b 1 + γ 2 b + λ τ 2 Π r y t = R 2 τ α 2 γ 2 b 2 τ ( γ 1 ) 2 α 2 + 4 b τ ( γ 1 ) 2
R = a + c + p t θ , E = 4 a 2 + 3 c 2 + 2 c p t 2 + θ + p t 2 5 6 θ + 4 θ 2 2 a [ c + p t 3 + 4 θ ] , F = c + p t α 2 { 4 a 1 + γ + c γ + p t [ 4 3 γ + 4 1 + γ θ ] } , G = 5 a 2 + 3 c 2 + 2 c p t + 2 p t θ + p t 2 [ 4 + θ 6 + 5 θ ] 2 a [ 2 c + p t 3 + 5 θ ] , H = c + p t 2 α 4 + 2 c + p t α 2 [ a 2 3 γ + c γ + p t 2 2 γ 2 θ + 3 γ θ ] λ τ 1 + γ 2 R 2 λ 2 τ 2 .
Table 5. A comparative ranking of decision-making values across the four models.
DecisionsVariablesConditionsHigh → Low
k θ , p t , δ , γ \YK\\UK
p θ \YTUTYKUK
p t 5 < p t < 13.5 YTUTYKUK
13.5 < p t < 15 YTUTUKYK
δ , γ \YTUTUKYK
Π m θ , p t , δ , γ \YTUTUKYK
Π r θ , p t \YKUKYT = UT
δ , γ 0.2 < γ < 0.3 YKUKYTUT
0.3 < γ < 0.4 YKUKUTYT
Π c θ 0.2 < θ < 0.3 YKYTUKUT
0.3 < θ < 0.7 YKUKYTUT
p t 5 < p t < 8.5 YKYTUKUT
8.5 < p t < 15 YKUKYTUT
δ , γ \YKUKYTUT
Disclaimer/Publisher’s Note: The statements, opinions and data contained in all publications are solely those of the individual author(s) and contributor(s) and not of MDPI and/or the editor(s). MDPI and/or the editor(s) disclaim responsibility for any injury to people or property resulting from any ideas, methods, instructions or products referred to in the content.

