Article

Assessing the Impact of Climate-Resilient City Development on Urban Sustainability: Evidence from China

College of Business and Economics, Australian National University, Canberra 2601, Australia
*
Author to whom correspondence should be addressed.
Sustainability 2025, 17(10), 4381; https://doi.org/10.3390/su17104381
Submission received: 5 March 2025 / Revised: 9 May 2025 / Accepted: 9 May 2025 / Published: 12 May 2025
(This article belongs to the Section Air, Climate Change and Sustainability)

Abstract

:
Developing a climate-resilient city (CRC) is a crucial strategy to improve the integrated adaptability of urban areas, enhance their livability, and fulfill the Sustainable Development Goals (SDGs). The paper utilizes panel data from 298 cities at or above the prefecture level in China, spanning from 2007 to 2022. Treating the 2017 CRC pilot policy as a quasi-natural experiment, this study applies a difference-in-differences (DID) model to evaluate its effects and mechanisms on urban sustainable development by comparing changes in outcomes between pilot and non-pilot cities over time. The research indicated that the establishment of CRC significantly improves urban sustainable development, with this impact being more pronounced in regions characterized by inadequate infrastructure, lower administrative capacity, and low extreme climate risk. Mechanism analysis reveals that industrial structure optimization and talent attraction serve as primary channels, while green technology innovation and heightened public environmental awareness provide complementary support. These mechanisms jointly reinforce the effectiveness of the CRC policy. Furthermore, CRC implementation generates positive geographical spillover effects, enhancing sustainability in neighboring cities through demonstration effects and policy diffusion. This paper offers an empirical foundation for advancing the pilot initiatives of climate-resilient urban development and presents policy recommendations for the expedited advancement of sustainable urban growth.

1. Introduction

Due to global climate change and socio-economic development, urban sustainable development has emerged as the most pressing issue of the 21st century. Cities accommodate over 55% of the global population and account for more than 75% of GDP; however, their dense populations and industrial activities intensify emissions, pollution, resource use, and climate risks [1,2]. The United Nations Sustainable Development Goals (SDG 11) and the Paris Agreement underscore the significance of green infrastructure, low-carbon development, and social governance in promoting urban sustainability [3]. Urban sustainability refers to the coordinated advancement of economic development, environmental quality, and social equity in urban systems, aiming to ensure long-term viability and intergenerational well-being [4]. Nevertheless, despite nations’ endeavors to diminish carbon emissions and shift towards sustainable energy, existing policies predominantly emphasize the “Mitigation” of climate change, with insufficient study on resilience [5].
According to the UN’s “Cities on the Road to 2030” report, 93% of cities face significant climate risks, underscoring their central role in climate vulnerability [6,7]. In 2016, Chinese cities were responsible for over 85% of national carbon emissions, and more than 70% of key urban areas failed to meet PM2.5 air quality standards, highlighting the urgent need for systemic adaptation policies [8]. Nevertheless, current strategies predominantly depend on low-carbon economic transition, energy conservation and emission reduction, and green infrastructure [8,9]. According to research, reducing climate risks through mitigation actions alone is not enough. Cities need to strengthen their resilience to make the system more stable [10,11]. Urban resilience is generally defined as a city’s capacity to absorb, adapt to, and recover from external shocks—including climate events—while maintaining essential socio-economic and infrastructural functions [12]. In this context, a Climate-Resilient City (CRC) was proposed, highlighting the improvement of urban resilience to climate change by infrastructure development, ecological restoration, and social governance [13]. In recent years, the global community has initiated the Making Cities Resilient program, aligned with the United Nations 2030 Agenda for Sustainable Development [14]. China has initiated a CRC pilot and will evaluate urban resilience in 2023 to investigate sustainable development models tailored to its national context.
Sustainable development prioritizes the integrated advancement of economic growth, environmental conservation, and social equity [15], with cities, as hubs of economic activity and population, being critical to the attainment of the Sustainable Development Goals (SDGs) [16]. Nonetheless, industrialization and urbanization have exacerbated environmental degradation and resource depletion [17,18]. Green Total Factor Productivity (GTFP) is extensively utilized to assess sustainable development levels, as evaluated by Data Envelopment Analysis (DEA) and Directional Distance Function (DDF) [19,20]. In recent years, measures including fiscal decentralization, environmental regulation, and green finance have been deemed effective for advancing green development [21,22], where green finance includes financial activities that directly support environmental protection and climate-related objectives. Notwithstanding China’s significant advancements in economic expansion, opportunities for enhancement in green development remain [23]. Research indicates that addressing intricate climate threats just through mitigation strategies, such as carbon emission reduction, is challenging; nevertheless, augmenting urban climate adaptation capabilities can significantly bolster resilience for sustainable development [24,25]. Nevertheless, the majority of current research emphasizes the short-term effects of policies, whereas comprehensive investigations into the long-term dynamic impact, transregional spillover effects, and multi-path transmission mechanisms of resilient policies remain insufficient [26].
Climate-resilient City (CRC) seeks to enhance urban capacity to withstand climate change [27]. In contrast to conventional mitigation techniques, there is a heightened focus on infrastructure enhancement, ecological management, and the resilience of socio-economic systems [28]. Beyond this functional perspective, the recent literature also emphasizes a more transformative interpretation of resilience—one that involves the reorganization of urban systems, structural adaptation to ecological constraints, and the redesign of urban metabolic flows to support long-term sustainability [29]. The global community has implemented initiatives like UNISDR’s Making Cities Resilient and the Rockefeller Foundation’s 100RC program [30]. In this context, China initiated a prototype CRC in 2017 to advance policy implementation [31]. Resilient policies enhance sustainable urban development by fostering green technology innovation, optimizing industrial structures, and boosting infrastructure resilience [32,33]. Sponge cities mitigate flooding risk through enhanced stormwater management, while low-carbon infrastructure diminishes energy consumption and carbon emissions [27,34]. Nonetheless, the resilient capacity of various places varies, with less developed cities exhibiting significant deficiencies in technology, money, and policy assistance [31]. Furthermore, processes like policy transmission pathways, regional spillovers, and long-term economic effects remain inadequately researched [35]. Simultaneously, inadequacies in legal and institutional frameworks in developing nations may impact policy efficacy [36].
Current research has thoroughly examined the determinants of sustainable development and assessed how the establishment of CRC can bolster urban resilience, facilitate the shift to a green economy, and improve social resilience [37]. Nevertheless, the existing literature predominantly emphasizes theoretical discourse or localized case studies and is deficient in rigorous empirical examinations [31]. The specific consequences, methods of action, and regional variability of climate adaptation programs remain inadequately researched [35,38]. We employ panel data from 298 Chinese cities spanning 2007 to 2022 to systematically evaluate the influence of pilot CRC initiatives on urban sustainable development through the difference-in-differences method. It further examines the underlying mechanisms and regional disparities, aiming to address the research gap and offer a scientific foundation for policy enhancement.
The marginal contribution of this paper is mainly reflected in the following aspects: First, in terms of viewpoint contribution, We systematically evaluate the impact of climate-resilient policies on urban sustainable development based on the practice of policy pilot, which makes up for the shortcomings of existing studies that mostly stay in theoretical discussion and local case analysis, and provides a new perspective for the empirical evaluation of resilient policies. Secondly, in terms of methodological innovation, we focus on the analysis of policy action mechanisms, discuss their possible influence paths, and further focus on the applicability of policies among different urban types, providing empirical evidence for regional heterogeneity research. Additionally, in conjunction with the research on spatial spillover effects, the possible influence of policies on adjacent cities will be examined, and the comprehension of the diffusion process of resilient policies and regional interconnectedness will be enhanced. The findings of this article can provide a basis for policy formulation, aid in improving the building of CRC, and deliver practical insights for cities at different developmental stages to promote sustainable development methods.

2. Policy Background and Research Hypothesis

2.1. Policy Background

Since the 1970s, climate change has gradually evolved from an academic debate into a core agenda of global governance. Multinational initiatives, such as the United Nations’ “Making Cities Resilient 2030”, the U.S. “100 Resilient Cities” program, and the EU’s “Europe 2020 Strategy”, have been implemented, advancing urban climate resilience from theoretical analysis to extensive implementation. Within this global governance framework, China has systematically established a climate resilience policy structure with unique national attributes. In contrast to many nations that predominantly depend on market processes or specific regulatory frameworks to promote resilience initiatives, China employs a “strategic guidance–pilot first–nationwide expansion” methodology. This approach not only enables the examination of resilience models but also establishes a foundation for policy enhancement and extensive implementation.
Before the CRC policy was launched, Chinese cities faced increasingly severe ecological challenges, including persistently high levels of greenhouse gas emissions and particulate pollution. As of 2016, the average PM2.5 concentration in major cities was nearly double the WHO standard, and total energy consumption in urban areas had reached record highs [3]. In 2013, the National Strategy for Climate Change Adaptation incorporated climate resilience into the urban infrastructure planning framework, establishing the primary direction for national resilience initiatives. In 2016, the Urban Climate Change Resilience Action Plan aimed at selecting 30 pilot cities. The initiative was bolstered in 2017 with the publication of the Pilot Work Plan for CRC Development, which formally initiated pilot programs focused on 28 cities, including Hohhot in Inner Mongolia. The selection of pilot towns was determined by various variables, including climate typologies (monsoonal, continental, and plateau-mountain climates), geographical distribution (east-west and north-south), and development gradients (e.g., Wuhan against Korla). This varied policy experimentation approach offers empirical evidence for future institutional enhancement and national expansion.
Building upon this policy experimentation framework, China has continued to iterate and refine its climate resilience strategies, reinforcing systemic transformation. In 2021, the 14th Five-Year Plan incorporated the notion of “resilient cities” into the nation’s strategic framework for the first time. In the subsequent year, the nationwide Strategy for Climate Change Resilience 2035 formalized urban resilience initiatives into a nationwide program. In that year, the report of the 20th National Congress of the Communist Party of China explicitly promoted the coordinated development of “livable, resilient, and smart cities”, signifying a shift from a singular focus on climate risk mitigation to an integrated governance model that aligns resilience with sustainable development objectives.

2.2. Research Hypothesis

Climate-resilient urban development primarily mitigates both immediate and prolonged threats posed by climate change and is essential for attaining urban sustainability. While current academic research indicates considerable potential for enhancement in the pilot programs of CRC, the majority of researchers believe that these initiatives significantly bolster urban resilience and sustainability. The Notice on the Implementation of CRC Pilot Programs explicitly outlines the policy’s objectives. On the one hand, the policy guides the optimization and upgrading of urban infrastructure, such as improving drainage systems and strengthening flood control facilities, effectively mitigating the threats posed by extreme climate events and ensuring the sustainable operation of cities. On the other hand, the pilot policy promotes ecological restoration and green development measures, such as expanding green space coverage and improving air quality, directly enhancing urban environmental quality while reinforcing ecological resilience. Moreover, the policy emphasizes scientific and forward-looking urban planning, optimizing land use and rationally allocating functional zones to reduce resource wastage and environmental degradation, thus establishing a robust foundation for sustainable urban growth [39]. The findings suggest that the CRC pilot strategy addresses climate change challenges while directly promoting urban sustainability. Therefore, the following testable hypotheses are proposed:
Hypothesis 1 (H1).
The CRC pilot program can significantly enhance urban sustainability.
Through what specific mechanisms does the CRC pilot program influence urban sustainability? The Urban Climate Change Resilience Action Plan highlights numerous critical ways to bolster urban resilience against climatic threats. It advocates for the enhancement of operational coordination and emergency command systems, including the formation of specialized rescue teams to augment urban emergency response and disaster relief capabilities. Furthermore, it underscores the necessity of enhancing fundamental research on climate resilience and fostering the development and implementation of essential resilience technologies to strengthen the scientific and technological basis for urban climate resilience. The strategy concurrently promotes elevating the standards for urban infrastructure design and construction, thereby enabling the creation of climate-resilient public infrastructure.
The CRC pilot program directly impacts urban sustainability and functions through many mediating processes, influencing the paths of policy effects. First, the initiative enhances urban government modernization by attracting and developing individuals proficient in climate resilience management. It enables the creation of specialized positions in environmental management, climate risk evaluation, and sustainable infrastructure development, thus enhancing cities’ ability to tackle complicated climate issues while bolstering human capital resources [40]. Second, the pilot program facilitates the growth of green service industries, which refer to sectors that provide services supporting environmental protection and low-carbon development, encouraging the advancement of environmental consultancy, ecological restoration, and green financing sectors. This method establishes low-carbon and resilience-focused services as catalysts for urban economic growth while augmenting employment creation in the green sector, refining industrial frameworks and strengthening economic resilience [41]. Third, by promoting innovative green technologies, the initiative expedites the research and implementation of sophisticated climate monitoring systems, catastrophe prevention and mitigation tools, and adaptive infrastructure solutions. This improves urban safety and resilience during extreme weather events while producing beneficial technical spillover effects that promote regional green economic growth [42]. Fourth, the pilot program raises public environmental awareness, strengthens societal recognition of climate risks, and fosters a shared consensus among governments, corporations, and the public to drive more proactive resilience actions [43]. For instance, increased public environmental consciousness—measured by indicators such as the Baidu Smog Search Index—may further influence policy implementation effectiveness and social capital accumulation. These mechanisms interact with one another, reinforcing the overall policy effects of the CRC pilot program and providing long-term support for urban sustainability. Consequently, the subsequent testable hypotheses are proposed:
Hypothesis 2a (H2a).
The CRC pilot program enhances urban sustainability by increasing talent attraction.
Hypothesis 2b (H2b).
The CRC pilot program enhances urban sustainability by promoting the growth of the service sector.
Hypothesis 2c (H2c).
The CRC pilot program enhances urban sustainability by driving inventive green technological innovation.
Hypothesis 2d (H2d).
The CRC pilot program enhances urban sustainability by raising public environmental awareness.
Does the influence of the CRC pilot program on urban sustainability exhibit spatial effects? Current studies indicate that urban pilot programs like the CRC initiative frequently produce substantial spatial spillover effects. The sustainable development of urban clusters demonstrates significant spatial spillover effects, with core cities influencing adjacent cities and enhancing regional sustainability through resource sharing and industrial synergy [44]. Furthermore, environmental regulatory programs, although reducing local ecological hazards, may generate adverse spatial spillover effects on adjacent areas via mechanisms such as the migration of polluting industries and industrial transitions [45]. Specifically, concerning the coordinated governance of environmental pollutants and carbon emissions, research demonstrates that the local advantages of these policies display spatial variation. Economically advanced locations may draw resources from adjacent areas via a siphoning effect, thereby limiting the green growth of neighboring cities [46]. The findings indicate that pilot policies may stimulate imitation, competition, or collaboration among pilot cities and adjacent cities due to geographic proximity or economic connections, thus producing spatial spillover effects on regional sustainability. Thus, the subsequent testable hypothesis is proposed:
Hypothesis 3 (H3).
The CRC pilot program illustrates spatial effects on urban sustainability.

3. Methodology

3.1. Variable Selection

3.1.1. The Explained Variable

This paper employs the logarithmic form of the Sustainable Development Index (SDI) as the explained variable to measure the impact of CRC development on urban sustainability. Current research indicates that a scientific evaluation of urban sustainability must thoroughly address three fundamental dimensions: economic sustainability, ecological sustainability, and social sustainability. A multi-indicator composite evaluation system is crucial for encompassing these dimensions. This work develops a complete evaluation system consisting of 19 variables based on the findings [47,48,49] while taking into account data availability at the prefecture-level city size (refer to Table 1). Notably, the structure of this index system is conceptually consistent with international frameworks such as the UN-Habitat City Prosperity Index and ISO 37120 [50], which also emphasize integrated assessments of economic, environmental, and social sustainability [49].
This paper uses the entropy technique to apply weights to each evaluation criterion, estimating urban sustainability levels and enhancing the scientific rigor and dependability of the assessment. The entropy method, an objective weighting technique grounded in information entropy, assigns weights to indicators based on their variability, thereby reducing any biases linked to subjective weighting. This paper enhances the evaluation technique and indicator system based on the current literature, emphasizing the integrated development of economic, environmental, and social dimensions. This methodology offers a comprehensive depiction of urban sustainability while establishing a robust theoretical basis for future policy effect evaluations [51].

3.1.2. Core Explanatory Variables

The core explanatory variable of this paper is the pilot of CRC construction, which is used to reflect whether a city is included in the pilot list determined in the Notice on the Issuance of CRC Construction Pilot Work. If a city is a pilot city, in 2017 and subsequent years, the dummy variable P o l i c y i t = 1; Otherwise, P o l i c y i t = 0.

3.1.3. Mediating Variables

Based on the analysis of the impact pathways of the CRC pilot policy on urban sustainability, this paper selects talent attraction, the proportion of the service sector, inventive green technological innovation, and public environmental awareness as mediating variables to explore the specific mechanisms through which the policy operates. Talent attraction is measured by the proportion of higher education teachers in the population as a proxy while incorporating pollution levels to account for potential negative environmental externalities to reflect a city’s ability to attract highly skilled professionals. The service sector’s percentage is evaluated by the ratio of the service industry’s added value to GDP, capturing the influence of industrial structure optimization on urban sustainability. Inventive green technological innovation is represented by the number of granted green patents, serving as a proxy for a city’s capacity for green technology innovation and its contribution to sustainable development. In this paper, green patents refer to patents classified under the IPC Green Inventory developed by the World Intellectual Property Organization (WIPO), which includes technologies related to renewable energy, energy efficiency, waste management, and pollution control. The Baidu Smog Search Index quantifies public environmental awareness, indicating the level of popular concern regarding environmental issues and its possible impact on policy execution.

3.1.4. Control Variables

This paper integrates a series of control variables to more precisely evaluate the effect of the CRC pilot program on urban sustainability (sus) by considering other potential influencing factors. According to the studies [52,53,54], we integrate six critical control variables that span economic, social, and resource allocation dimensions. The extent of infrastructure development (inf) is measured as the logarithm of per capita road area, whereas the amount of economic development (econ) is represented by the natural logarithm of per capita GDP. The investment level (inv) is defined as the logarithm of the ratio of fixed asset investment to GDP, whilst the openness level (ope) is quantified as the logarithm of the ratio of actual used foreign capital to regional GDP. The extent of human capital (hum) is represented by the logarithm of the ratio of college students to the total urban population, whereas government size (gov) is measured as the logarithm of per capita fiscal revenue. The inclusion of these variables reduces omitted variable bias and improves the reliability and robustness of the model estimate results.

3.2. Model Specification

By constructing a comparative analysis between pilot and control regions, this paper treats the implementation of the CRC pilot policy as a quasi-natural experiment, thereby mitigating biases caused by unobservable factors and enhancing the credibility of the estimation results. Building on the difference-in-differences (DID) approach, this paper establishes the following baseline regression model to examine the impact of CRC development on urban sustainability:
s u s i t = α 0 + α P o l i c y i t + j α j c o n t r o l i t + μ i + σ t + ε i t
where s u s i t represents the sustainability level of city i in year t and is measured as the logarithm of the Sustainable Development Index. P o l i c y i t is the key explanatory variable, representing the difference-in-differences interaction term for the policy pilot; it takes a value of 1 if the city is a pilot city in the post-policy implementation period and 0 otherwise. c o n t r o l i t denotes a set of control variables, μ i and σ t represent city fixed effects and year fixed effects, respectively, and ε i t is the random error term.
This paper selects the proportion of the service sector, talent attraction, the number of green inventions, and the PC-based smog search index as key mediating variables. Referring to existing studies [39], we establish the following mediation effect model:
m e d i t = β 0 + β P o l i c y i t + j β j c o n t r o l i t + μ i + σ t + ε i t
s u s i t = γ 0 + γ P o l i c y i t + m e d i t θ + j γ j c o n t r o l i t + μ i + σ t + ε i t
where m e d i t represents the mediating variable, capturing the impact of the CRC pilot program on the proportion of the service sector, talent attraction, the number of green inventions, and the PC-based smog search index. The definitions of other variables remain consistent with those in the previous sections.

3.3. Data Sources and Processing Methods

This paper utilizes panel data from 298 prefecture-level and above cities in China from 2006 to 2022 as the research sample. The data primarily originate from various editions of the China Urban Statistical Yearbook, China Urban Construction Statistical Yearbook, and China Urban-Rural Construction Statistical Yearbook, as well as the Wind and CSMAR (Guotaian) databases, together with the China Emission Accounts and Datasets, Economy Prediction System, and the China Environment Statistical Yearbook, which collectively provide supplementary data on financial development, environmental indicators, energy consumption, and green innovation, such as carbon emissions, green patents, and urban-level financial metrics. To ensure data completeness and reliability, cities with significant data omissions or name changes were excluded. Although the policy documents specify 28 pilot cities or regions, this study ultimately includes only 23 cities. The exclusions were made for two main reasons. First, certain regions, such as Tongnan District and Bishan District in Chongqing, are administrative districts rather than independent cities, making their statistical data difficult to compare directly with other prefecture-level cities. Second, some cities, including Korla City and Aksu City (Baicheng County) in the Xinjiang Autonomous Region, as well as Shihezi City in the Xinjiang Production and Construction Corps, were excluded due to severe data deficiencies, which hinder an accurate assessment of policy effects.

3.4. Descriptive Statistics

Table 2 presents the descriptive statistics for the key variables. The urban sustainability level ranges from a low of −5.330 to a maximum of −0.919, reflecting considerable variability among cities. This variation may be affected by factors including geographical distribution, administrative resource allocation, and climate change hazards. Consequently, further analysis will include heterogeneity tests to investigate how the effects of the CRC pilot strategy vary among areas, administrative tiers, and climate risk levels, thus revealing the fundamental mechanisms of its influence.
Table 3 illustrates discernible baseline disparities between the treatment and control cities regarding various ecological sustainability metrics prior to the enactment of the CRC policy. Treated cities generally exhibited higher levels of industrial pollution and resource pressure, while control cities performed relatively better in waste management and urban greening metrics. These variations reflect significant heterogeneity in environmental conditions, infrastructure capacity, and governance levels across cities. Recognizing such differences is essential for ensuring the credibility of the identification strategy. Accordingly, the subsequent heterogeneity analysis explores how policy effects vary across different city types and regions. Furthermore, given the spatial nature of several ecological variables, the study also investigates potential spatial spillover effects to assess whether the CRC pilot may generate indirect environmental benefits in neighboring cities.

4. Empirical Results and Discussion

4.1. Baseline Regression Results

Using the DID model to examine the impact of the CRC pilot program on urban sustainability, the baseline regression results are presented in Table 4. Column (1) contains the key explanatory variable and fundamental control variables solely; Column (2) integrates individual fixed effects; Column (3) incorporates year fixed effects, and Column (4) encompasses both individual and year fixed effects. The results repeatedly demonstrate that the CRC pilot program markedly improves urban sustainability. After controlling for all variables, as well as individual and time-fixed effects, the pilot policy is found to increase urban sustainability levels by 0.039%, so supporting Hypothesis H1.
As shown in Column (4), the results for the control variables indicate that economic development, openness, government size, and investment levels significantly enhance urban sustainability. The beneficial impact of economic development may arise from efficiency improvements facilitated by the green industry’s enhancement during economic restructuring [55]. The positive impact of openness is closely related to foreign capital spillover effects and the transfer of low-carbon management expertise [56]. The advantageous impact of government size indicates the motivation for specific expenditures in environmental infrastructure under a decentralized fiscal structure [57]. Furthermore, investment levels strongly influence sustainable transitions via green technology innovation and circular economy initiatives [58]. While infrastructure development shows a certain degree of positive impact on urban sustainability, human capital does not exhibit a significant effect. This may be due to the limitations of traditional education-based indicators in capturing the long-term cumulative effect of human capital on green technology absorption, aligning with the theoretical expectation of human capital lag effects [57].

4.2. Parallel Trend Test

A prerequisite for accurately evaluating the policy effect is that the treatment and control groups exhibit no significant differences in sustainability levels before policy implementation. To verify this, this paper follows the methodology of Zhao and Wang and Ge [59,60] and employs an event study approach to construct a dynamic difference-in-differences (DID) model. Using the five years preceding the implementation of the pilot policy as the baseline group and the four years following policy implementation as the treatment period, the specific model is formulated as follows:
s u s i t = δ 0 + n = 1 5 P o l i c y p r e _ n β p r e _ n + P o l i c y c u r r e n t β c u r r r e n t + n = 1 4 P o l i c y p o s t _ n β p o s t _ n + j ω j c o n t r o l i t + μ i + σ t + ε i t
where P o l i c y p r e _ n , P o l i c y c u r r e n t , P o l i c y p o s t _ n represent the interaction terms between the policy dummy variable and the dummy variables for the years before, during, and after the implementation of the pilot policy, respectively. β p r e _ n , β c u r r r e n t , β p o s t _ n are the corresponding key coefficients of interest. The definitions and notations of other variables remain consistent with those in the previous model.
Figure 1 depicts the outcomes of the parallel trend test. Prior to the implementation of the CRC pilot policy, there was no notable difference in urban sustainability levels between pilot and non-pilot cities, hence validating the parallel trend assumption. This also indicates that the discerned variations in urban sustainability prior to and after policy implementation are not influenced by unobservable factors. Subsequent to the policy shock, the policy’s influence persisted robustly during both the implementation year and the next year, illustrating the enduring and steady effect of the CRC pilot program on urban sustainability, thereby fulfilling the parallel trend assumption. Consequently, the policy effect gradually declines and stabilizes over time, aligning with the law of diminishing marginal returns in resource allocation during policy implementation [61]. This finding further validates the robustness of the dynamic effect model.
In addition to the graphical validation, this study conducts a joint F-test on the interaction terms prior to the policy intervention to statistically examine the parallel trends assumption, following the approach of He [62]. The results show that the null hypothesis of jointly zero coefficients on pre-policy interaction terms cannot be rejected at the 5% level (F = 0.72, p = 0.5774), indicating no significant difference in trends between the treatment and control groups before the implementation of the CRC policy. By contrast, a joint F-test for the implementation and immediate post-treatment periods yields marginal significance (F = 2.82, p = 0.0595), confirming a deviation from the prior trajectory and reinforcing the validity of the causal interpretation.

4.3. Robustness Test

4.3.1. Substitution of Explanatory Variables

To remove measurement bias in the dependent variable, further validation is necessary to determine if the research results are influenced by the methodology used to evaluate urban sustainable development potential. This research utilizes the methodology of Li [63] by replacing the original entropy method with the TOPSIS entropy method to reevaluate the comprehensive assessment index and conduct baseline regression analysis. Column 4 of Table 5 reveals that the estimated coefficient of the policy variable, obtained by the TOPSIS entropy method, is 0.082 and highly positive, so affirming the consistency and robustness of the research findings. This further illustrates that climate-resilient urban policies significantly enhance the ability for sustainable development in cities.

4.3.2. PSM-DID

This paper employs the methodology of Yang [64] to assess the robustness of CRC policies on urban sustainable development capacity and to mitigate potential sample selection bias, utilizing propensity score matching in conjunction with difference-in-differences (PSM-DID) for robustness analysis. We initially estimate the propensity score of cities entering the pilot group using a logit model and implement 1:1 nearest-neighbor matching to enhance the comparability of covariate distributions between the treatment and control groups, thereby mitigating potential selection bias in policy effect estimation. Subsequent to matching, we reevaluate the DID regression, with findings displayed in Column 2 of Table 5.
The policy treatment effect coefficient rises to 0.126 and remains statistically positive at the 1% level post-matching. This outcome suggests that, when adjusting for sample selection bias, the estimated policy effect intensifies. This discovery corresponds with the anticipation of Heckman & Robb [65] concerning the correction of bias in policy evaluation—that when the treatment group displays “positive selection bias”, conventional Difference-in-Differences (DID) may undervalue the actual policy impact. By removing systematic disparities across groups via Propensity Score Matching (PSM), the net policy effect can be identified with greater precision.
Applying this methodology, our PSM-DID findings further validate the beneficial influence of climate-resilient urban policies on sustainable development capacity and affirm the robustness of our research conclusions. The regression analysis of the matched sample demonstrates that the significance of the policy effect is not influenced by sample selection bias but rather accurately represents the impact of policy implementation.

4.3.3. Province Fixed Effects Test

To further validate the impact of the CRC policy on urban sustainability, this paper follows the methodology of Wang and Yu [66,67] by incorporating provincial fixed effects into the model. This approach controls for time-invariant heterogeneity at the provincial level that may interfere with the estimation of policy effects. The inclusion of provincial fixed effects not only captures persistent unobservable regional differences—such as economic foundations and resource endowments—but also eliminates the potential influence of other provincial-level policies on urban sustainability, such as regional green development plans or economic development initiatives.
Upon the introduction of provincial fixed effects, as illustrated in Table 5, Column 3, the estimated coefficient of the policy variable rises to 0.090, achieving a significance level of 1%. This suggests that the positive effect of the CRC policy persists robustly despite the adjustment for provincial-level heterogeneity. This further substantiates the study’s findings and indicates that the observed policy effects are not influenced by other provincial-level policies but instead represent the genuine impact of the CRC program itself.

4.3.4. Winsorization

This paper utilizes a two-sided winsorization at the 1–99% level on the primary variables in order to reduce the impact of outliers on the regression results, as demonstrated in Table 5, Column 5. Following this modification, the estimated coefficient of the policy variable is 0.032, maintaining significance at the 5% level and consistent in direction with the baseline regression. This indicates that, even when considering outliers, the policy effect remains robust and statistically significant. The results of the winsorization test further corroborate the reliability of this study’s conclusions, demonstrating that the positive impact of the CRC policy on urban sustainability is not due to outliers but authentically reflects the true advantages of policy implementation.

4.3.5. Adjustment Window Period

This research modifies the study period from 2006–2022 to 2009–2022 and 2011–2022, respectively, to further validate the robustness of the CRC policy’s impact on urban sustainability and re-estimates the regression models. As shown in Table 5, Columns 6 and 7, the estimated coefficients of the policy variable in the adjusted time windows are 0.033 and 0.023, both of which remain significant and consistent in direction. This signifies that the policy effect is consistently strong throughout many timeframes, hence reinforcing the study’s conclusions’ reliability.

4.3.6. Counterfactual Test

To mitigate potential interference from unrecognized policies impacting the regression outcomes, this study adopts the methodology of Dong [68] by artificially advancing the implementation timeline of the CRC policy to 2009 and 2011, respectively, thereby constructing placebo policy variables and re-estimating the regressions. As shown in Table 5, Columns 8 and 9, the estimated coefficients of the placebo policy variables are both small and statistically insignificant. This result indicates that the estimated policy effects in this study exhibit strong robustness.

4.3.7. Placebo Test

To verify the causal effect of the CRC policy on urban sustainability and eliminate potential systematic bias, this paper conducts a placebo test, as illustrated in Figure 2. Following the method of Cicala [69] for randomly generating a placebo treatment group and drawing on the empirical design of Du [70], we randomly pick 28 placebo pilot cities from a total of 298 cities, designating them as the treatment group while the remaining cities constitute the control group. This process is repeated 500 times, with each iteration evaluated using the identical difference-in-differences model as the first regression. The calculated coefficients of the main explanatory variable and their associated p-values are subsequently illustrated using kernel density plots and distribution graphs.
The calculated coefficients for the placebo pilot cities exhibit a normal distribution centered around zero, with the highest density near 0 and the majority of p-values surpassing 0.1, thereby validating that the model successfully passes the placebo test. This conclusion reinforces the causal inference that the observed enhancement in urban sustainability is predominantly attributable to the enactment of the CRC strategy rather than to unobservable omitted variables. The results exhibit significant robustness.

4.3.8. Eliminating the Interference of Other Policies

This research selects three analogous policies enacted concurrently, as shown in Table 6, to further assess the net impact of the CRC policy on urban sustainability and to mitigate potential confounding influences from other simultaneous policies. Column (1) delineates the Three-Year Action Plan for the Blue Sky Protection Campaign, Column (2) pertains to the Near-Zero Carbon Emission Zone Demonstration Project, and Column (3) represents the Clean Energy Consumption Action Plan—all of which are highly relevant to urban sustainability.
To account for their potential influence, these policies are incorporated into the model as dummy policy variables for robustness testing. The regression outcomes, displayed in Table 6, demonstrate that after accounting for the possible influence of these simultaneous policies, the magnitude, sign, and significance of the CRC policy variable remain aligned with the baseline regression results. This data substantiates that the beneficial impact of the CRC policy on urban sustainability is largely unaffected by other policy interventions, reinforcing the robustness of the paper’s conclusions.

5. Further Analysis

5.1. Mechanism Analysis

5.1.1. Mediating Effect

This paper, consistent with the previously outlined theoretical framework, identifies the proportion of the service sector (Service), talent attraction (Talent), the number of green inventions (Green), and the PC-based smog search index (Search) as critical mediating variables to empirically investigate the mechanisms by which CRC development fosters sustainability. These mechanisms are analyzed from four dimensions: industrial structure optimization, human capital enhancement, technological innovation, and increased public environmental awareness. The estimation results, presented in Table 7, indicate that CRC development significantly enhances talent attraction (Column 1), suggesting that the policy fosters sustainable development by promoting talent agglomeration. The policy also significantly increases the proportion of the service sector (Column 2), implying that industrial structure optimization serves as a key channel for promoting sustainability. Furthermore, the policy strengthens public environmental awareness (Column 3), demonstrating that heightened public consciousness of environmental issues contributes to sustainable development. Finally, the policy promotes green technological innovation (Column 4), further reinforcing urban sustainability. These findings collectively support the theoretical hypothesis that CRC development enhances urban sustainability through multiple interconnected mechanisms.

5.1.2. Decomposition of Mechanism Contributions

To further explore the contribution of each mediating variable in the process through which CRC development promotes sustainability, this paper follows the research design of Lu & Wang [71] and constructs the following econometric model for mechanism decomposition:
s u s i t = α 0 + α P o l i c y i t + j α j c o n t r o l i t + μ i + σ t + ε i t
m e d i t = β 0 + β P o l i c y i t + j β j c o n t r o l i t + μ i + σ t + ε i t
s u s i t = γ 0 + γ P o l i c y i t + m e d i t θ + j γ j c o n t r o l i t + μ i + σ t + ε i t
The contribution of the j th mediating variable to sustainable development is denoted as β j / α × θ j , and computed contributions of each mechanism variable are presented in Table 8. The estimation results demonstrate that the explanatory contributions of talent recruitment, the service sector proportion, green technical innovation, and public environmental consciousness are 63.8%, 68.0%, 28.4%, and 49.1%, respectively. In summary, climate-resilient urban development promotes sustainable growth through various mechanisms, such as improving talent attraction, refining industrial structure, advancing green technological innovation, and bolstering public environmental awareness, thereby positively influencing urban development and validating Hypothesis H2.
Industrial structure optimization and talent attraction serve as the principal transmission mechanisms, exhibiting comparatively greater contributions, so underscoring the policy’s vital role in promoting economic restructuring and augmenting human capital. Conversely, although the impacts of green technical innovation and public environmental awareness are comparatively lesser, they are nonetheless substantial. Green technological innovation serves as a long-term catalyst, producing a cumulative influence that improves urban environmental resilience and sustainability [72]. Concurrently, the rise in public environmental awareness demonstrates the policy’s beneficial impact on cultivating society’s environmental consciousness [73]. Economic change and talent agglomeration are the primary short-term drivers of sustainable development, although technology innovation and public environmental awareness are anticipated to have a more significant long-term effect.

5.2. Heterogeneity Analysis

5.2.1. Regional Heterogeneity Analysis Based on the Hu Huanyong Line

The Hu Huanyong Line is a notable geographical demarcation that extends in a northeast-southwest orientation, partitioning China into southeastern and northwestern territories. The southeastern area comprises approximately 43% of the country’s landmass yet houses over 90% of the population and economic activities. Conversely, the northwestern region, despite its enormous land area, possesses a small population and a comparatively underdeveloped economy. This split not only underscores the uneven population distribution but also reveals significant regional variations in economic structures, infrastructure, and natural resources.
The Hu Huanyong Line delineates unique regional characteristics, offering an effective geographical and economic framework for examining the regional diversity of the CRC pilot policy. Table 9, Columns (1) and (2) demonstrate that the policy has a considerable positive impact in both the southeastern and northwestern regions, with the marginal benefit being more evident in the northwest. This phenomenon may arise from the fragile economic foundations and inadequate infrastructure in the northwest, resulting in a heightened dependence on policy interventions and, hence, more pronounced marginal impacts. Furthermore, the northwestern region is ecologically delicate, and the policy promotes regional stability by enhancing the ecological environment and fortifying disaster prevention and mitigation infrastructure. The “14th Five-Year National Comprehensive Disaster Prevention and Mitigation Plan” prioritizes the enhancement of river management, the fortification of aging reservoirs, and the execution of flood disaster prevention initiatives to bolster disaster resilience in the northwest. Conversely, in the southeastern region, characterized by a more developed economy and established market processes, the minimal necessity for policy interventions is reduced, and resource redundancy results in a weakened policy impact.

5.2.2. Heterogeneity Analysis Based on Administrative Levels

Differences in administrative levels directly influence cities’ access to policy resources, fiscal autonomy, and governance capacity. To examine the implementation effects of the CRC policy across different administrative tiers, this paper classifies cities into high-administrative-level and low-administrative-level categories. The high-administrative-level cities include provincial capitals, sub-provincial cities, municipalities directly under the central government, and cities specifically designated in the state plan, totaling 31 cities, while all other cities are categorized as low-administrative-level cities.
As shown in Table 9, Columns (3)–(4), the policy impact differs across administrative levels. The effect in low-administrative-level cities aligns with the baseline regression, whereas the estimated coefficient for high-administrative-level cities is negative, suggesting that the policy weakens sustainable development in the latter group. This phenomenon may be attributed to administrative resource allocation and fiscal autonomy. While high-administrative-level cities have greater financial resources and stronger policy implementation capacity, the complexity of governance structures may reduce the marginal effectiveness of the policy. On the one hand, fiscal resources may be subject to redundant investments or excessive dependence on intergovernmental transfers, leading to lower resource utilization efficiency. On the other hand, multi-tiered governance increases policy coordination costs, potentially hampering implementation effectiveness. A study [74] discovered that in multi-level governance systems, resource allocation and policy coordination substantially affect policy outcomes in climate adaptation policies within Europe’s public health sector, with local governments encountering significant difficulties in cross-sectoral collaboration. This conclusion is also applicable to this study, indicating that the governance complexity of high-administrative-level cities may weaken the actual effectiveness of the policy. In contrast, low-administrative-level cities, constrained by limited fiscal resources, rely more heavily on external policy support, making policy interventions more directly translatable into infrastructure improvements and public service enhancements.

5.2.3. Heterogeneity Analysis Based on Extreme Weather Risk Zones

Climate change-induced extreme weather events exert disparate effects across various locations. This paper employs the classification criteria from the China Comprehensive Climate Change Risk Zoning Report to categorize cities into high-risk and low-risk zones, thus facilitating a more precise evaluation of regional disparities in policy effectiveness.
Table 9, Columns (5)–(6), illustrates that the policy exerts a positive impact in both high-risk and low-risk climate zones; however, the marginal effect is more significant in low-risk areas, indicating the variability of policy efficacy across different climate risk levels. This mismatch may arise from the phenomenon of “adaptation saturation”. High-risk regions, having long endured severe climatic threats, have constructed robust adaptive infrastructure (e.g., flood control initiatives emergency response systems), so constraining the potential for further policy influence. Moreover, reliance on established adaption systems limits the incremental advantages of new programs. It has been found [75] that self-reinforcing mechanisms inside policy institutions can diminish the effectiveness of new coastal adaptation strategies in the UK and Germany, corroborating the “adaptation lock-in” phenomena noted in high-risk regions. Conversely, low-risk regions typically lack adequate resilient infrastructure, rendering policy interventions more efficacious in promoting preventive expenditures (e.g., ecological restoration infrastructure enhancements). These measures improve resilient ability, mitigate future climate risks, and produce greater marginal benefits.

5.3. Spatial Econometrics

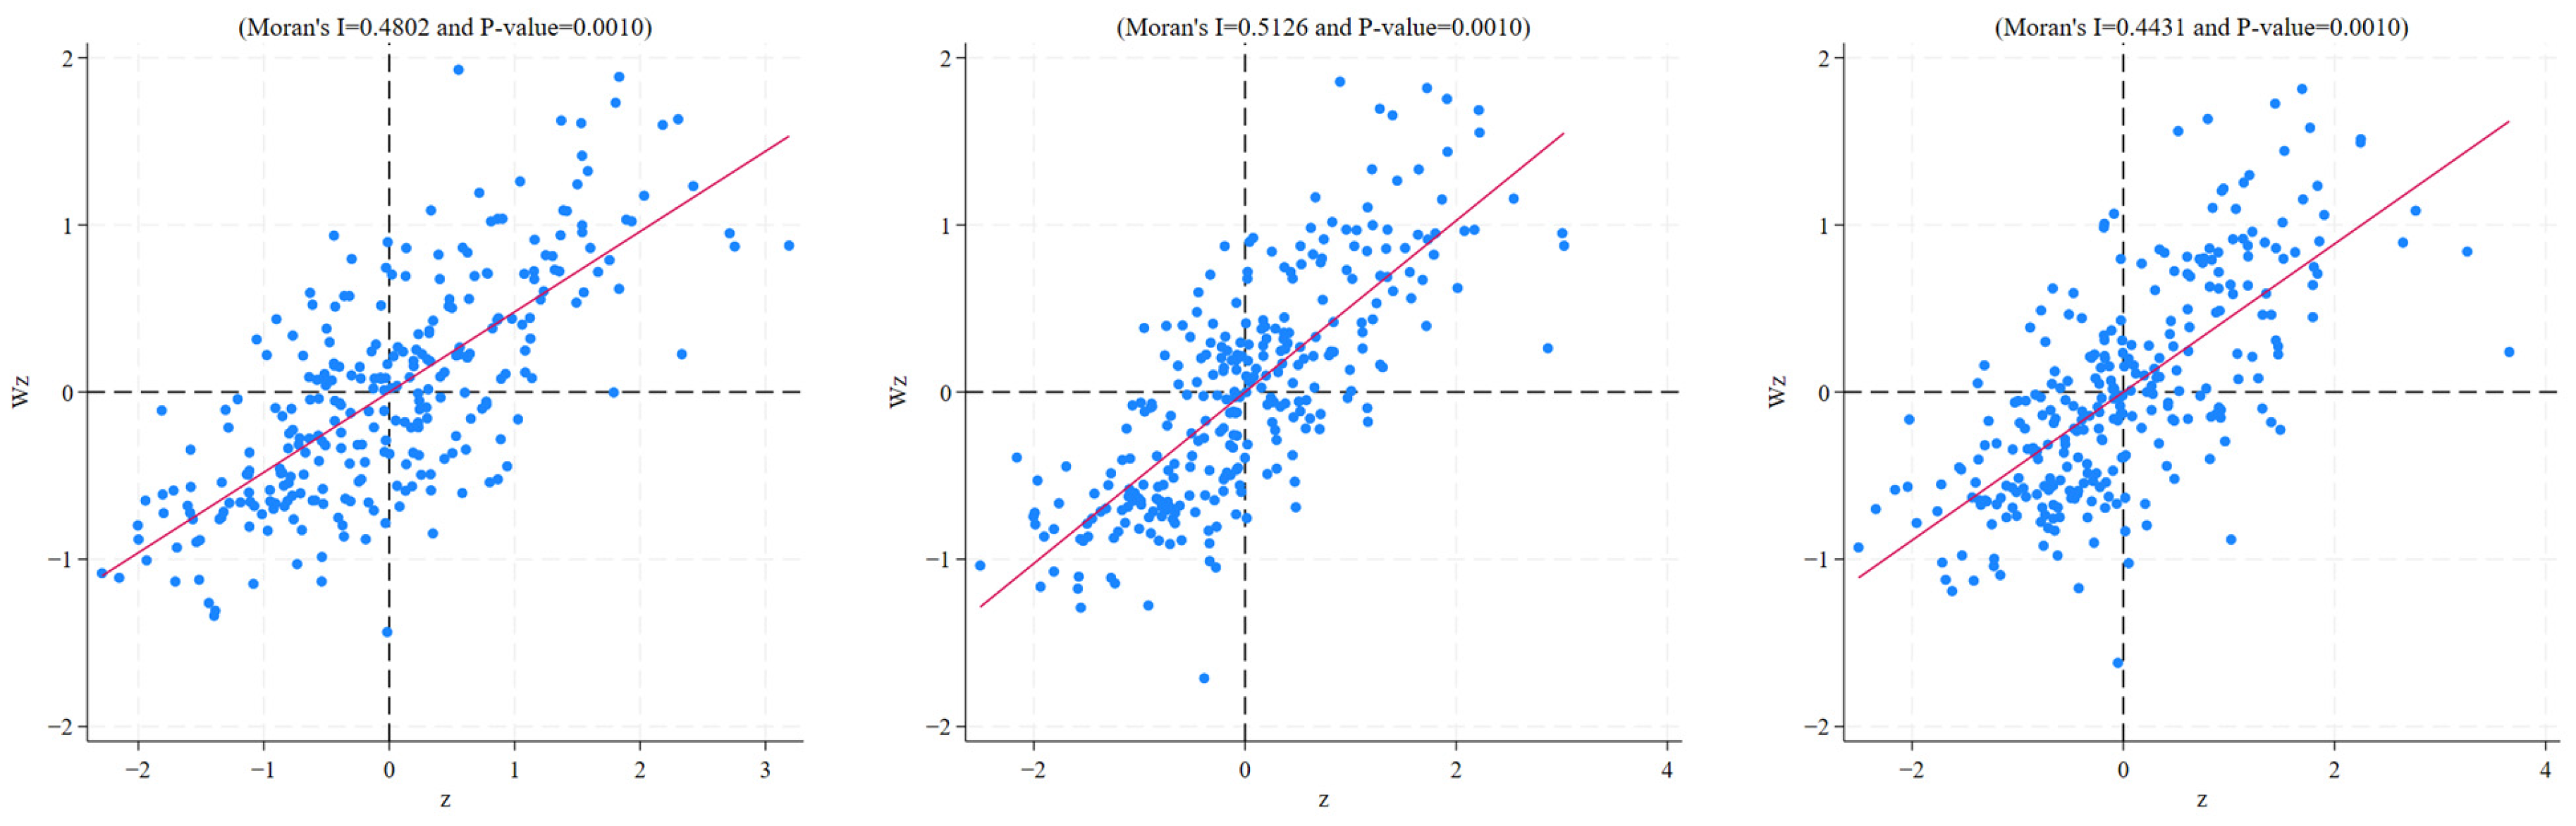
5.3.1. Local Moran’s I and Model Testing

This paper utilizes Moran scatter plots (Figure 3) to illustrate the spatial patterns of pertinent indicators, acknowledging that CRC growth may have spillover effects via spatial diffusion and regional connections. The findings demonstrate that Moran’s I for the years 2010, 2015, and 2020 is markedly positive, indicating a robust spatial autocorrelation and spatial dependency in urban sustainability levels. The majority of cities predominantly occupy the first quadrant (high-high clustering) and the third quadrant (low-low clustering), signifying that cities exhibiting high sustainability levels tend to cluster, while those with low sustainability levels are also geographically concentrated. This spatial clustering pattern suggests that climate-resilient urban development may have spillover effects on urban sustainability. This study significantly enhances the analysis by utilizing spatial economic regression models.
Subsequent to the spatial autocorrelation test, additional model selection tests were performed, with the findings detailed in Table 10. The results demonstrate that both the LR test and the Wald test are significant, indicating that the Spatial Durbin Model (SDM) cannot be reduced to either the Spatial Error Model (SEM) or the Spatial Autoregressive Model (SAR). Furthermore, the Hausman test is significant, suggesting that the fixed-effects specification is appropriate for the SDM model. This research finally selects the fixed-effects Spatial Durbin Model (SDM) as the preferable model based on these results.

5.3.2. Spatial Effect Regression

Table 11 illustrates that the SDM estimation findings demonstrate a strong positive effect of the CRC policy on urban sustainability. The estimated coefficient of the key explanatory variable, Policy, is consistently positive across all models (SDM, SAR, SEM) and retains significance at the 1% level, so affirming that climate-resilient urban development effectively improves urban sustainability, further supporting Hypothesis H1.
The spatial dependence study indicates that the spatial lag coefficient (ρ) is 0.212 in the SDM model and 0.404 in the SAR model, both significant at the 1% level. This outcome indicates a significant spatial dependence on urban sustainability, suggesting that cities with higher sustainability levels tend to aggregate, whereas those with diminished sustainability levels also display spatial clustering. This trend underscores the advantageous spatial spillover effect of climate-resilient urban development, indicating that when a city adopts the policy, other cities may similarly benefit in terms of sustainability. The calculated coefficient of the spatially lagged policy variable (Policy × W) is 0.172, significant at the 1% level, hence reinforcing the previously stated conclusions. This outcome corroborates the previous findings [46], suggesting that the influence of environmental policies extends beyond pilot cities, potentially affecting adjacent regions via regional coordination mechanisms, thus producing a spatial positive feedback effect and substantiating Hypothesis H3.
Regarding effect decomposition, the estimated direct and indirect effects shed further light on the mechanisms through which CRC development affects urban sustainability. Specifically, the direct effect estimation yields a Policy coefficient of 0.044, which is statistically significant at the 1% level, demonstrating a strong positive influence of the policy on local city sustainability. Meanwhile, for the indirect effect, the estimated coefficient is 0.220, which is also significant at the 1% level, further confirming that the policy generates a substantial positive spillover effect on neighboring cities. In other words, CRC development not only enhances the sustainability of pilot cities but also fosters improvements in surrounding cities through demonstration effects, knowledge spillovers, and regional cooperation mechanisms.
In summary, CRC development exhibits a “point-to-area” regional development pattern. Future policy formulation must transcend administrative boundaries by instituting ecological compensation mechanisms, cultivating regional green infrastructure networks, where green infrastructure involves integrating nature-based solutions into urban planning to improve environmental performance and climate resilience and executing institutional innovations to convert spatial spillover effects into tangible outcomes for coordinated regional governance.

6. Discussion

The empirical results presented in Section 4 and Section 5 generally confirm the study’s core hypotheses and correspond well with the prior literature on urban sustainability and resilience. The CRC pilot policy significantly improved sustainability outcomes in pilot cities, particularly through industrial restructuring and talent agglomeration. These mechanisms are consistent with earlier findings in the environmental economics literature that emphasize endogenous institutional capacity and sectoral transformation as key to adaptive governance.
The empirical results of this study indicate the potential advantages of the CRC pilot; nonetheless, it is crucial to exercise caution in overgeneralizing the findings. The implementation and impact of climate resilience policies may vary significantly depending on local governance capacity, administrative coordination, and institutional support. For instance, although Bijie, a trial city located in the underdeveloped western region, was included in the pilot program, its limited fiscal capacity and weak infrastructure base may constrain the scope and effectiveness of policy execution. On the other hand, in more developed cities like Wuhan, the coexistence of multiple overlapping strategic agendas—such as climate resilience, urban regeneration, and ecological restoration—may generate administrative fragmentation or diluted implementation focus. Such instances demonstrate that unintended effects, such as resource misallocation or regulatory burdens, may occur, particularly in cities with constrained absorptive capacity or too ambitious institutional agendas. Consequently, resilience solutions must be crafted with adequate local adaptation and integrated with dynamic evaluation methods to guarantee sustained effectiveness and responsiveness.
Finally, the advancement of CRC will further strengthen the data foundation on the long-term impacts of policies and urban resilient development, hence offering robust support for the examination of its enduring dynamic effects. The conventional DID technique may clarify the average impact of policy, although it fails to identify how it changes over time. Future research may integrate the dynamic DID method to monitor whether the policy effect amplifies, diminishes, or varies non-linearly over time and examine its adaptability discrepancies at various stages of urban development, thereby optimizing resilient policies and facilitating the establishment of enduring sustainable climate-resilient development strategies. Moreover, some unobserved factors—such as demographic pressures—may remain uncontrolled and warrant further exploration in future studies. In addition, this study does not engage in cross-national comparisons of policy outcomes. Future research may expand this framework by examining how CRC-like resilience strategies perform in different institutional contexts, thereby enhancing international generalizability. At the organizational level, sustainability practices constitute a critical factor shaping the effectiveness of climate resilience policies. The reaction of firms, as the core component of green technology innovation and low-carbon transformation, may differ based on industry features and market conditions. Future research may integrate micro-data to assess the influence of policies on enterprises’ green investments, production methods, and industrial chain synergy while also evaluating their alignment with city-level sustainable development outcomes, thereby explaining the transmission mechanisms of policy effects and refining resilient governance strategies.

7. Conclusions and Policy Implications

This paper theoretically examines the impact and underlying mechanisms of the CRC pilot policy on urban sustainability. To empirically validate these theoretical expectations, we employ panel data from 298 prefecture-level and above cities in China from 2007 to 2022 for empirical testing. The principal conclusions are as follows: First, the CRC pilot strategy markedly improves urban sustainability, and this finding is consistently validated through various robustness checks. Second, the mechanism analysis indicates that the policy primarily drives sustainability through two core pathways: industrial structure optimization and talent agglomeration. Green technological innovation and public environmental awareness serve as secondary pathways with relatively lower short-term contributions. Third, heterogeneity analysis reveals that the policy’s impact is more pronounced in the northwest region, low-administrative-level cities, and low climate-risk areas. This suggests that economically underdeveloped regions rely more heavily on policy interventions, while high-risk areas, having already established comprehensive, adaptive infrastructure, exhibit lower marginal benefits, reflecting the “adaptation saturation” effect. Fourth, the spatial effect analysis confirms that the CRC pilot policy generates significant positive spatial spillover effects. The policy not only improves sustainability within pilot cities but also exerts positive regional spillover effects through inter-city linkages, creating a “point-to-area” diffusion effect. Based on these findings, this paper derives the following policy implications:
  • Deepening the Development of CRC Pilots and Enhancing Policy Systematicity: Under the framework of the National Strategy for Climate Change Adaptation 2035, regulatory authorities should promote the formulation of provincial-level adaptation plans and integrate CRC development into local planning. A “risk identification—policy intervention—adaptation action—dynamic evaluation” governance system should be established to strengthen institutional support. In light of the verified policy effectiveness observed in the baseline DID analysis (Table 4), the second batch of pilots should be promoted in a targeted manner, with a focus on economically underdeveloped and high climate-risk regions to ensure precise policy implementation. For instance, a tiered support system can be introduced, where high-risk areas are prioritized for disaster prevention funding, while underdeveloped regions receive subsidies for adaptation technology promotion and talent training to enhance policy effectiveness and feasibility.
  • Adopting Locally Adapted and Differentiated Climate Resilience Strategies: As revealed in the heterogeneity analysis (Table 9), Regions with weak economies should expedite financial and technological assistance to diminish adaption costs, foster industrial structure optimization, and augment talent concentration. Conversely, economically advanced or high climate-risk areas ought to prioritize bolstering green technological innovation and improving infrastructure resilience while optimizing current adaptation strategies to prevent the “adaptation saturation” phenomenon that could reduce the marginal benefits of governmental interventions. Cities in varying climatic conditions should implement specific strategies; for instance, desert regions should focus on establishing water-conserving infrastructure, whereas flood-prone areas should enhance stormwater management systems to bolster urban disaster resilience.
  • Enhancing the Synergy Between Human Capital, Green Innovation, and Infrastructure Development: Mechanism analysis (Table 8) demonstrates that industrial structure optimization and talent agglomeration are the primary transmission channels through which CRC impacts sustainability outcomes. Therefore, a climate adaptation talent development system should be established to integrate green innovation with urban sustainability goals, fostering professionals and policymakers to enhance policy implementation capacity. Simultaneously, the government should increase support for green technology R&D, drive low-carbon industrial upgrades, and overcome key technological bottlenecks to strengthen cities’ long-term adaptation capacity. Additionally, fiscal resources should be directed toward high-resilience infrastructure while encouraging private capital investment to create a government-led, multi-stakeholder adaptation framework. For instance, a “Green Industry Guidance Fund” could be established to support technological breakthroughs, while Public-Private Partnership (PPP) projects for adaptive infrastructure should be promoted to facilitate deeper corporate involvement and improve resource allocation efficiency.
  • Amplifying Policy Spillover Effects and Building Regional Coordination Mechanisms: Spatial regression results (Table 11) confirm that CRC policies produce statistically significant and economically meaningful spillover effects across adjacent cities. To maximize the demonstration effect of pilot cities, policy experiences should be actively disseminated within urban clusters and metropolitan areas, fostering a regional collaborative adaptation framework. Strengthening intercity cooperation is crucial to promoting shared adaptive infrastructure, such as regional water resource allocation systems, disaster early warning networks, and ecological corridor development. At the same time, enhanced coordination at the provincial and national levels is needed to optimize resource allocation and ensure the policy’s full impact. By reinforcing strategic planning and cross-regional synergies, this will provide strong support for achieving the goal of building a climate-resilient society by 2035.

Author Contributions

Conceptualization, W.H.; methodology, W.H.; software, W.H.; validation, W.H.; formal analysis, W.H.; investigation, W.H.; resources, W.H.; data curation, W.H.; writing—original draft preparation, W.H.; writing—review and editing, W.H., X.G. and C.Z.; visualization, W.H.; project administration, W.H., X.G. and C.Z. All authors have read and agreed to the published version of the manuscript.

Funding

This research received no external funding.

Institutional Review Board Statement

Not applicable.

Informed Consent Statement

Not applicable.

Data Availability Statement

The data supporting the findings of this study will be made available upon request. Please contact the corresponding author at u7689829@anu.edu.au.

Conflicts of Interest

The authors declare no conflicts of interest.

Abbreviations

The following abbreviations are used in this manuscript:
CRCClimate-Resilient City
SDISustainable Development Index
DIDDifference-In-Differences Model
GDPGross Domestic Product
UNISDRUnited Nations Office for Disaster Risk Reduction
TOPSISTechnique for Order Preference by Similarity to Ideal Solution
PSM-DIDPropensity Score Matching with Difference-in-Differences
SDMSpatial Durbin Model
SARSpatial Autoregressive Model
SEMSpatial Error Model
ESGEnvironmental, Social, and Governance

References

  1. Bi, X.; Wu, C.; Wang, Y.; Li, J.; Wang, C.; Hahs, A.; Mavoa, S.; Song, C.; Konra, C.; Emch, M. Changes in the Associations between Heatwaves and Human Mortality during Two Extreme Hot Summers in Shanghai, China. Sustain. Cities Soc. 2023, 95, 104581. [Google Scholar] [CrossRef]
  2. Hirabayashi, Y.; Mahendran, R.; Koirala, S.; Konoshima, L.; Yamazaki, D.; Watanabe, S.; Kim, H.; Kanae, S. Global Flood Risk under Climate Change. Nat. Clim. Change 2013, 3, 816–821. [Google Scholar] [CrossRef]
  3. Commane, R.; Schiferl, L.D. Climate Mitigation Policies for Cities Must Consider Air Quality Impacts. Chem 2022, 8, 910–923. [Google Scholar] [CrossRef]
  4. Elmqvist, T.; Andersson, E.; Frantzeskaki, N.; McPhearson, T.; Olsson, P.; Gaffney, O.; Takeuchi, K.; Folke, C. Sustainability and resilience for transformation in the urban century. Nat. Sustain. 2019, 2, 267–273. [Google Scholar] [CrossRef]
  5. Zameer, H.; Wang, Y.; Vasbieva, D.G.; Abbas, Q. Exploring a Pathway to Carbon Neutrality via Reinforcing Environmental Performance through Green Process Innovation, Environmental Orientation and Green Competitive Advantage. J. Environ. Manag. 2021, 296, 113383. [Google Scholar] [CrossRef]
  6. McCarthy, M.P.; Best, M.J.; Betts, R.A. Climate Change in Cities Due to Global Warming and Urban Effects. Geophys. Res. Lett. 2010, 37, L09705. [Google Scholar] [CrossRef]
  7. Broto, V.C.; Bulkeley, H. A Survey of Urban Climate Change Experiments in 100 Cities. Glob. Environ. Change 2013, 23, 92–102. [Google Scholar] [CrossRef]
  8. Zhang, X.; Xu, X.; Pan, S.; Mo, Y.; Dong, C. Exploring the Impact of Low-Carbon City Pilot Policy on Urban Ecological Welfare Performance: A Quasi-Natural Experiment in 282 Chinese Cities. Urban Clim. 2024, 58, 102216. [Google Scholar] [CrossRef]
  9. Liu, L.; Zhang, Z.; Ding, S.; Yang, F.; Fu, T. Combined Effects of Climate Change on Urban Resilience in the Tibetan Plateau. Environ. Impact Assess. Rev. 2023, 102, 7186. [Google Scholar] [CrossRef]
  10. Meerow, S.; Stults, M. Comparing Conceptualizations of Urban Climate Resilience in Theory and Practice. Sustainability 2016, 8, 701. [Google Scholar] [CrossRef]
  11. Marschütz, B.; Bremer, S.; Runhaar, H.; Hegger, D.; Mees, H.; Vervoort, J.; Wardekker, A. Local Narratives of Change as an Entry Point for Building Urban Climate Resilience. Clim. Risk Manag. 2020, 28, 100223. [Google Scholar] [CrossRef]
  12. Meerow, S.; Newell, J.P.; Stults, M. Defining urban resilience: A review. Landsc. Urban Plan. 2016, 147, 38–49. [Google Scholar] [CrossRef]
  13. Wang, D.; Chen, S. The Effect of Pilot Climate-Resilient City Policies on Urban Climate Resilience: Evidence from Quasi-Natural Experiments. Cities 2024, 153, 105316. [Google Scholar] [CrossRef]
  14. Fuso Nerini, F.; Sovacool, B.; Hughes, N.; Cozzi, L.; Cosgrave, E.; Howells, M.; Tavoni, M.; Tomei, J.; Zerriffi, H.; Milligan, B. Connecting Climate Action with Other Sustainable Development Goals. Nat. Sustain. 2019, 2, 674–680. [Google Scholar] [CrossRef]
  15. Cesário, F.; Sabino, A.; Moreira, A.; Azevedo, T. Green Human Resources Practices and Person-Organization Fit: The Moderating Role of the Personal Environmental Commitment. Emerg. Sci. J. 2022, 6, 938–951. [Google Scholar] [CrossRef]
  16. Kadhim, N.; Ismael, N.T.; Kadhim, N.M. Urban Landscape Fragmentation as an Indicator of Urban Expansion Using Sentinel-2 Imageries. Civ. Eng. J. 2022, 89, 1799–1814. [Google Scholar] [CrossRef]
  17. Yuan, H.; Feng, Y.; Lee, C.C.; Cen, Y. How Does Manufacturing Agglomeration Affect Green Economic Efficiency? Energy Econ. 2020, 92, 104944. [Google Scholar] [CrossRef]
  18. Li, G.; Wen, H. The Low-Carbon Effect of Pursuing the Honor of Civilization? A Quasi-Experiment in Chinese Cities. Econ. Anal. Pol. 2023, 78, 343–357. [Google Scholar] [CrossRef]
  19. Song, M.; Du, J.; Tan, K.H. Impact of Fiscal Decentralization on Green Total Factor Productivity. Int. J. Prod. Econ. 2018, 205, 359–367. [Google Scholar] [CrossRef]
  20. Li, Y.; Chen, Y. Development of an SBM-ML Model for the Measurement of Green Total Factor Productivity: The Case of Pearl River Delta Urban Agglomeration. Renew. Sustain. Energy Rev. 2021, 145, 111131. [Google Scholar] [CrossRef]
  21. Du, K.; Li, J. Towards a Green World: How Do Green Technology Innovations Affect Total-Factor Carbon Productivity? Energy Pol. 2019, 131, 240–250. [Google Scholar] [CrossRef]
  22. Fang, L.; Hu, R.; Mao, H.; Chen, S. How Crop Insurance Influences Agricultural Green Total Factor Productivity: Evidence from Chinese Farmers. J. Clean. Prod. 2021, 321, 128977. [Google Scholar] [CrossRef]
  23. Cao, X.; Deng, M.; Li, H. How Does E-Commerce City Pilot Improve Green Total Factor Productivity? Evidence from 230 Cities in China. J. Environ. Manag. 2021, 289, 112520. [Google Scholar] [CrossRef]
  24. Yang, L.; Ni, M. Is Financial Development Beneficial to Improve the Efficiency of Green Development? Evidence from the “Belt and Road” Countries. Energy Econ. 2022, 105, 105734. [Google Scholar] [CrossRef]
  25. Wen, H.; Liang, W.; Lee, C.C. China’s Progress toward Sustainable Development in Pursuit of Carbon Neutrality: Regional Differences and Dynamic Evolution. Environ. Impact Assess. Rev. 2023, 98, 106959. [Google Scholar] [CrossRef]
  26. Xue, W.; Lei, Y.; Liu, X.; Shi, X.; Liu, Z.; Xu, Y.; Chen, X.; Song, X.; Zheng, Y.; Zhang, Y.; et al. Synergistic Assessment of Air Pollution and Carbon Emissions from the Economic Perspective in China. Sci. Total Environ. 2023, 858, 159736. [Google Scholar] [CrossRef]
  27. Zhao, Y.; Liang, C.; Zhang, X. Positive or Negative Externalities? Exploring the Spatial Spillover and Industrial Agglomeration Threshold Effects of Environmental Regulation on Haze Pollution in China. Environ. Dev. Sustain. 2021, 23, 11335–11356. [Google Scholar] [CrossRef]
  28. Lomba-Fernández, C.; Hernantes, J.; Labaka, L. Guide for Climate-Resilient Cities: An Urban Critical Infrastructures Approach. Sustainability 2019, 11, 4727. [Google Scholar] [CrossRef]
  29. Ahern, J. From fail-safe to safe-to-fail: Sustainability and resilience in the new urban world. Landsc. Urban Plan. 2011, 100, 341–343. [Google Scholar] [CrossRef]
  30. Johnson, C.; Blackburn, S. Advocacy for Urban Resilience: UNISDR’s Making Cities Resilient Campaign. Environ. Urban 2014, 26, 29–52. [Google Scholar] [CrossRef]
  31. Pei, X.; Wu, J.; Xue, J.; Zhao, J.; Liu, C.; Tian, Y. Evaluation of Climate Change Adaptation in Chinese Cities. Urban Dev. Res. 2022, 29, 39–46+52+2. [Google Scholar]
  32. Zheng, Y.; Xin-Lu, X.; Chen-Zhen, L.; Mou, W.; Xiao-Jia, H.E. Development as Adaptation: Framing and Measuring Urban Resilience in Beijing. Adv. Clim. Change Res. 2018, 9, 234–242. [Google Scholar] [CrossRef]
  33. Li, G.; Kou, C.; Wang, Y.; Yang, H. System Dynamics Modelling for Improving Urban Resilience in Beijing, China. Resour. Conserv. Recycl. 2020, 161, 104954. [Google Scholar] [CrossRef]
  34. Yang, K.; Chen, G.; Chen, R. The Dark Side of Climate Policy Uncertainty: Hindering Energy Transition by Shaping Environmental Taxes Effectiveness. J. Environ. Manag. 2024, 369, 122314. [Google Scholar] [CrossRef]
  35. Gandini, A.; Quesada, L.; Prieto, I.; Garmendia, L. Climate Change Risk Assessment: A Holistic Multi-Stakeholder Methodology for the Sustainable Development of Cities. Sustain. Cities Soc. 2021, 65, 102641. [Google Scholar] [CrossRef]
  36. Greenstone, M.; Hanna, R. Environmental Regulations, Air and Water Pollution, and Infant Mortality in India. Am. Econ. Rev. 2014, 104, 3038–3072. [Google Scholar] [CrossRef]
  37. Zhao, X.; Bian, T.; Ren, G.; Zhang, Y.; Han, Z. The Role of Geographic Factors in the Change of Extreme Temperature Trends in Northern Xinjiang. Prog. Geosci. 2021, 40, 681–692. [Google Scholar]
  38. Zhang, T.; Sun, Y.; Zhang, X.; Yin, L.; Zhang, B. Potential Heterogeneity of Urban Ecological Resilience and Urbanization in Multiple Urban Agglomerations from a Landscape Perspective. J. Environ. Manag. 2023, 342, 118129. [Google Scholar] [CrossRef]
  39. Zhang, Z.Q.; Yao, M.Q.; Zheng, Y. Impact of the Pilot Policy for Constructing Climate Resilient Cities on Urban Resilience. China Popul. Resour. Environ. 2024, 34, 1–12. [Google Scholar]
  40. Liu, X.; Yuan, X.; Ge, X.; Jin, Z. Adaptation and Innovation: How Does Climate Vulnerability Shape Corporate Green Innovation in BRICS? Int. Rev. Financ. Anal. 2024, 94, 103272. [Google Scholar] [CrossRef]
  41. Wen, H.; Hu, K.; Nghiem, X.-H.; Acheampong, A.O. Urban Climate Adaptability and Green Total-Factor Productivity: Evidence from Double Dual Machine Learning and Differences-in-Differences Techniques. J. Environ. Manag. 2024, 350, 119588. [Google Scholar] [CrossRef] [PubMed]
  42. Zhang, H.; Liu, J.; Guo, Q.; Zhang, X.; Hu, X. The Impact of Climate Policy Uncertainty on Urban Climate Risk: Evidence from 274 Cities in China. Sustain. Cities Soc. 2025, 119, 106097. [Google Scholar] [CrossRef]
  43. Wu, L.; Yang, M.; Sun, K. Impact of Public Environmental Attention on Environmental Governance of Enterprises and Local Governments. China Popul. Resour. Environ. 2022, 32, 1–14. [Google Scholar]
  44. Du, X.; Zhou, J.; Xiao, C. Spatial Effects and Influencing Factors of Urban Sustainable Development: An Analysis of Urban Agglomerations in China. Econ. Anal. Policy 2024, 81, 556–575. [Google Scholar] [CrossRef]
  45. Tao, W.; Song, M.; Weng, S.; Chen, X.; Cui, L. Assessing the Impact of Environmental Regulation on Ecological Risk Induced by PM2.5 Pollution: Evidence from China. J. Clean. Prod. 2024, 451, 142029. [Google Scholar] [CrossRef]
  46. Qiu, L.; Xia, W.; Wei, S.; Hu, H.; Yang, L.; Chen, Y.; Zhou, H.; Hu, F. Collaborative Management of Environmental Pollution and Carbon Emissions Drives Local Green Growth: An Analysis Based on Spatial Effects. Environ. Res. 2024, 259, 119546. [Google Scholar] [CrossRef]
  47. Yi, P.; Li, W.; Zhang, D. Sustainability Assessment and Key Factors Identification of First-Tier Cities in China. J. Clean. Prod. 2021, 281, 125369. [Google Scholar] [CrossRef]
  48. Wojewnik-Filipkowska, A.; Gierusz-Matkowska, A.; Krauze-Maślankowska, P. Fundamental Power of the City—A Proposition of a New Paradigm and Index for City Development. Cities 2024, 144, 104630. [Google Scholar] [CrossRef]
  49. Abunada, Z.; Dawoud, O.; Kıymaz, G. Sustainability, Resilience, and Smartness: A Novel City Characterization Approach Using ZOG-Diagram. J. Clean. Prod. 2025, 496, 145080. [Google Scholar] [CrossRef]
  50. ISO 37120:2018; Sustainable Cities and Communities—Indicators for City Services and Quality of Life. International Organization for Standardization: Geneva, Switzerland, 2018.
  51. Zhang, D.; Tang, Y. Does the Construction of Smart Cities Promote Urban Sustainable Development? Macroecon. Res. 2024, 02, 74–91. [Google Scholar] [CrossRef]
  52. Yu, J.; Hu, W.; Hou, L. Towards More Resilient Cities—Analyzing the Impact of New-Type Urbanization on Urban Resilience: Considering Spatial Spillover Boundaries. Sustain. Cities Soc. 2024, 114, 105735. [Google Scholar] [CrossRef]
  53. He, F.; Hu, Y. Non-linear effects of environmental regulation on urban sustainable development efficiency. China Popul. Resour. Environ. 2022, 32, 84–95. [Google Scholar]
  54. Gao, C.; Song, P.; Wen, Y.; Yang, D. Effect of Science and Technology Finance Policy on Urban Green Development in China. Front. Environ. Sci. 2022. [Google Scholar] [CrossRef]
  55. Ning, X.; Qiu, Y.; Du, X.; Xing, K. Multi-Sectoral Based Innovative Approach for Evaluating Human Well-Being Efficiency of Urban Metabolism. Sustain. Cities Soc. 2024, 102, 105238. [Google Scholar] [CrossRef]
  56. Li, J.; Zhang, T.; Du, X.; Li, Y. How Can the Digital Economy Drive Low-Carbon City Performance in China to Achieve Sustainable Development Goals? A Multiple-Output Perspective. J. Clean. Prod. 2024, 454, 142316. [Google Scholar] [CrossRef]
  57. Wu, T.; Xu, W.; Kung, C.-C. The Impact of Data Elements on Urban Sustainable Development: Evidence from the Big Data Policy in China. Technol. Soc. 2025, 81, 102800. [Google Scholar] [CrossRef]
  58. Wang, Z.; Li, K. Can Green Finance Exorcize the Resource Curse in China’s Resource-Based Cities? A Geographically and Temporally Weighted Regression (GTWR) Analysis. J. Environ. Manag. 2025, 375, 124184. [Google Scholar] [CrossRef]
  59. Zhao, Y.; Dou, S.; Li, J.; Cheng, J.; Xu, D. The Economic Inequality Effect of Environmental Policies—A Case from China’s “Authoritarian Environmentalism” Actions. J. Environ. Manag. 2025, 374, 123926. [Google Scholar] [CrossRef]
  60. Wang, F.; Ge, X. Does Low-Carbon Transition Impact Employment? Empirical Evidence from Low-Carbon City Pilot Projects. China Ind. Econ. 2022, 2022, 81–99. [Google Scholar] [CrossRef]
  61. Lin, L.; Zheng, Y.; Tu, Y. The New Environmental Protection Law, ESG Investment, and Corporate Innovation Performance. Int. Rev. Econ. Financ. 2025, 98, 103916. [Google Scholar] [CrossRef]
  62. He, S.; Du, S.; Huang, G. Traditional Finance and Early Industrialisation: Evidence from Piaohao and Modern Private Corporate Establishment. J. World Econ. 2025, 48, 90–121. [Google Scholar]
  63. Li, Q.; Shi, X.; Wang, Q. Assessing Climate Vulnerability in China’s Industrial Supply Chains: A Multi-Region Network Analysis Approach. J. Clean. Prod. 2025, 490, 144718. [Google Scholar] [CrossRef]
  64. Yang, J.; Liu, P.; Zhong, F.; Han, N. Subway Opening Enables Urban Green Development: Evidence from Difference-in-Differences and Double Dual Machine Learning Methods. J. Environ. Manag. 2025, 375, 124177. [Google Scholar] [CrossRef]
  65. Heckman, J.J.; Robb, R. Alternative Methods for Evaluating the Impact of Interventions: An Overview. J. Econom. 1985, 30, 239–267. [Google Scholar] [CrossRef]
  66. Wang, W.; Yang, Z.; Chen, J.; Liu, J. How Does ESG Affect Government Procurement in Countries Where ESG Systems Are Established from the Top Down? Econ. Model. 2025, 146, 107024. [Google Scholar] [CrossRef]
  67. Yu, L.; Chen, Y.; Zhang, S. Climate Change and Staple Grain Acreage: Regional Adaptation in China’s Agricultural Cluster. China Econ. Rev. 2025, 89, 102314. [Google Scholar] [CrossRef]
  68. Dong, Z.; Shi, J. Environmental Regulation and the Widening Inequality in Urban Green Innovation: Evidence from China. J. Environ. Manag. 2025, 374, 124181. [Google Scholar] [CrossRef]
  69. Cicala, S. Imperfect Markets versus Imperfect Regulation in U.S. Energy Efficiency. Am. Econ. Rev. 2022, 112, 1445–1475. [Google Scholar] [CrossRef]
  70. Du, M.; Zhang, J.; Hou, X. Decarbonization Like China: How Does Green Finance Reform and Innovation Enhance Carbon Emission Efficiency? J. Environ. Manag. 2025, 376, 124331. [Google Scholar] [CrossRef]
  71. Lu, F.; Wang, H.; Jing, G. Network Infrastructure Construction and High-Quality Green Development: A Quasi-Natural Experiment from the Broadband China Strategy. Stat. Res. 2024, 41, 112–125. [Google Scholar] [CrossRef]
  72. Zhang, Q.; Li, J.; Kong, Q.; Huang, H. Spatial Effects of Green Innovation and Carbon Emission Reduction in China: Mediating Role of Infrastructure and Informatization. Sustain. Cities Soc. 2024, 106, 105426. [Google Scholar] [CrossRef]
  73. Wang, Y.; He, Z.; Zou, J.; Xie, H.; Bao, J. Energy Transition for Sustainable Economy: What Is the Role of Government Governance and Public Concern? Financ. Res. Lett. 2024, 69, 106087. [Google Scholar] [CrossRef]
  74. Turner, G.; de’Donato, F.; Hoeben, A.; Nordeng, Z.; Coleman, S.; Otto, I.; Hajat, S.; Kovats, S. Implementation of Climate Adaptation in the Public Health Sector in Europe: Qualitative Thematic Analysis. Eur. J. Public Health 2023, 34, 544–549. [Google Scholar] [CrossRef] [PubMed]
  75. Groen, L.; Alexander, M.; King, J.P.; Jager, N.W.; Huitema, D. Re-Examining Policy Stability in Climate Adaptation through a Lock-In Perspective. J. Eur. Public Policy 2023, 30, 488–512. [Google Scholar] [CrossRef]
Figure 1. Parallel trend test.
Sustainability 17 04381 g001
Figure 2. Placebo test.
Sustainability 17 04381 g002
Figure 3. Moran scatter plots.
Sustainability 17 04381 g003
Table 1. Index system of urban sustainable development level.
Primary IndexSecondary IndexThree-Level IndexUnitIndicator Attributes
Sustainable
Development
Index (SDI)
Ecological
Sustainability
Industrial Wastewater Discharge10,000 tons
Industrial Carbon Dioxide Emissionston
Industrial Smoke and Dust Emissionston
Comprehensive Utilization Rate of Industrial Solid Waste%+
Per Capita Green Space Aream2 per capita+
Harmless Treatment Rate of Domestic Waste%+
Green Coverage Rate in Built-up Areas%+
Economic
Sustainability
Per Capita Fixed Asset InvestmentYuan per capita+
Per Capita Actual Utilization of Foreign CapitalUSD per capita+
Per Capita GDPYuan per capita+
Proportion of the Tertiary Sector in GDP%+
Proportion of the Secondary Sector in GDP%
Per Capita Total Retail Sales of Consumer GoodsYuan per capita+
Social
Sustainability
Population Density k m 2 per capita+
Number of Doctors per 10,000 People p × 10 4 × p 1 +
Per Capita Road Aream2 per capita+
Teacher-Student Ratio in Higher Education Institutions%+
Per Capita Bank Savings BalanceYuan per capita+
Unemployment Rate%
Table 2. Descriptive statistics.
StatsNMeanp50SDMinMax
sus4768−3.490−3.4930.580−5.330−0.919
Policy47680.02600.16001
inf47683.5603.5300.6420.0986.669
inv4768−0.208−0.2340.718−5.4882.917
gov47687.8847.8400.9944.57211.310
ope47680.1100.0530.17304.899
hum4768−4.524−4.5851.005−9.210−2.045
econ47684.5934.6060.3001.9965.670
Table 3. Descriptive Statistics of Ecological Sustainability Variables.
IndicatorMean (Control)Mean (Treat)Median (Control)Median (Treat)SD (Control)SD (Treat)
Industrial Wastewater Discharge547197342889302010,39015,434
Industrial Carbon Dioxide Emissions53,860193,39037,32881,98664,088600,965
Industrial Smoke and Dust Emissions39,05327,6028190660444,53736,053
Comprehensive Utilization Rate of Industrial Solid Waste747081662630
Per Capita Green Space Area362533181518
Harmless Treatment Rate of Domestic Waste676381662827
Green Coverage Rate in Built-up Areas288031581483144653414222
Table 4. Regression to baseline.
VariablesSus
(1)(2)(3)(4)
Policy0.107 ***0.112 ***0.045 *0.039 ***
(0.025)(0.016)(0.025)(0.014)
inf−0.031 ***0.015−0.028 ***0.028 *
(0.007)(0.018)(0.007)(0.016)
econ0.819 ***1.106 ***0.625 ***0.592 ***
(0.031)(0.024)(0.034)(0.025)
inv0.082 ***0.060 ***0.058 ***0.047 ***
(0.006)(0.005)(0.006)(0.004)
ope0.256 ***0.049 **0.304 ***0.061 ***
(0.025)(0.019)(0.025)(0.017)
hum0.083 ***0.0030.103 ***0.000
(0.005)(0.005)(0.005)(0.005)
gov0.203 ***0.120 ***0.220 ***0.044 ***
(0.010)(0.009)(0.010)(0.009)
Constant−8.378 ***−9.549 ***−7.552 ***−6.656 ***
(0.098)(0.089)(0.117)(0.115)
Year FENONOYESYES
Region FENOYESNOYES
N4768476847684768
R20.0100.7740.9490.785
Note: Standard errors in parentheses; *** p < 0.01, ** p < 0.05, * p < 0.1.
Table 5. Robustness check.
VariablesPSM-DIDProvince FixedVariable SubstitutionWinsor2Adjustment WindowCounterfactual Test
Topsis
Entropy
(1–99%)Period from 2009Period from 2011Three PeriodsFive Periods
Policy0.126 ***0.090 ***0.082 ***0.032 **0.033 **0.023 *0.0510.045
(0.024)(0.021)(0.020)(0.014)(0.014)(0.014)(0.037)(0.030)
Constant−8.467 ***−7.419 ***−2.706 ***−7.237 ***−6.770 ***−7.214 ***−6.650 ***−6.650 ***
(0.175)(0.110)(0.163)(0.126)(0.125)(0.142)(0.382)(0.382)
ControlYESYESYESYESYESYESYESYES
Year FEYESYESYESYESYESYESYESYES
Region FEYESYESYESYESYESYESYESYES
N11584768476847684172357647684768
R 2 0.8110.8530.8050.9620.9610.9630.9610.961
Note: Standard errors in parentheses; *** p < 0.01, ** p < 0.05, * p < 0.1.
Table 6. Eliminating the Interference of Other Policies.
VariablesSus
(1)(2)(3)(4)
Policy0.043 ***0.040 ***0.073 ***0.074 ***
(0.014)(0.014)(0.028)(0.028)
Policy_sky−0.056 *** −0.055 ***
(0.011) (0.012)
Policy_ZeroCarbon −0.035 −0.007
(0.022) (0.023)
Policy_energy −0.041−0.037
(0.029)(0.029)
Constant−6.578 ***−6.640 ***−6.654 ***−6.575 ***
(0.116)(0.115)(0.115)(0.116)
ControlYESYESYESYES
Year FEYESYESYESYES
Region FEYESYESYESYES
N4768476847684768
R 2 0.9610.9610.9610.961
Note: Standard errors in parentheses; *** p < 0.01.
Table 7. Mediator effect.
VariablesTalentServiceSearchGreen
(1)(2)(3)(4)
Policy6.224 **2.946 ***2.217 **0.319 ***
(2.698)(0.879)(1.050)(0.108)
Constant105.957 ***144.645 ***4.4182.833 ***
(12.631)(4.114)(4.924)(0.528)
ControlYESYESYESYES
Year FEYESYESYESYES
Region FEYESYESYESYES
N4768476847044667
R 2 0.3760.3630.5860.648
Note: Standard errors in parentheses; *** p < 0.01, ** p < 0.05.
Table 8. Mechanism decomposition.
TalentServiceSearchGreen
α 0.0390.0390.0390.039
β 6.2242.9462.2170.319
θ 0.0040.0090.0050.060
β / α × θ 0.6380.6800.2840.491
Table 9. Heterogeneity analysis.
VariablesUrban LocationAdministrative LevelExtreme Weather Risk Area
(1)(2)(3)(4)(5)(6)
SoutheastNorthwestHigh LevelLow LevelHigh RiskLow Risk
Policy0.099 ***0.115 ***−0.053 *0.127 ***0.069 *0.149 ***
(0.029)(0.043)(0.028)(0.031)(0.038)(0.033)
Constant−8.050 ***−9.024 ***−10.519 ***−8.493 ***−8.182 ***−8.564 ***
(0.117)(0.155)(0.234)(0.108)(0.143)(0.135)
ControlYESYESYESYESYESYES
Year FEYESYESYESYESYESYES
Region FEYESYESYESYESYESYES
N34721296560420822242544
R 2 0.7870.8040.8400.7240.8140.750
Note: Standard errors in parentheses; *** p < 0.01, * p < 0.1.
Table 10. Model Setting Test Results.
Test MethodTest ItemStatisticp-ValueConclusion
LR TestWhether SDM can be reduced to SAR45.890.000SDM model
46.550.000SDM model
Wald TestWhether SDM can be reduced to SAR46.110.000SDM model
46.810.000SDM model
Hausman TestRandom effects or fixed effects68.450.000Fixed effects
Table 11. Spatial Effects Regression.
VariablesSDMSARSEMDirectIndirect
(1)(2)(3)(4)(5)
Policy0.038 ***0.046 ***0.054 ***0.044 ***0.220 ***
(0.014)(0.014)(0.015)(0.014)(0.039)
Policy × W0.172 ***
(0.034)
rho0.212 ***0.404 ***
(0.023)(0.014)
sigma2_e0.014 ***0.014 ***0.016 ***
(0.000)(0.000)(0.000)
lambda 0.363 ***
(0.027)
ControlYESYESYES
Year FEYESYESYES
Region FEYESYESYES
N456045604560
R 2 0.6940.7210.762
Log-L3302.7553186.1472923.542
Note: Standard errors in parentheses; *** p < 0.01.
Disclaimer/Publisher’s Note: The statements, opinions and data contained in all publications are solely those of the individual author(s) and contributor(s) and not of MDPI and/or the editor(s). MDPI and/or the editor(s) disclaim responsibility for any injury to people or property resulting from any ideas, methods, instructions or products referred to in the content.

