Article

Cracking the Code of Car Crashes: How Autonomous and Human Driving Differ in Risk Factors

Department of Big Data Management and Application, School of Maritime Economics and Management, Dalian Maritime University, Dalian 116026, China
*
Author to whom correspondence should be addressed.
Sustainability 2025, 17(10), 4368; https://doi.org/10.3390/su17104368
Submission received: 16 April 2025 / Revised: 8 May 2025 / Accepted: 9 May 2025 / Published: 12 May 2025

Abstract

:
With the rapid advancement of autonomous driving (AD) technology, its application in road traffic has garnered increasing attention. This study analyzes 534 AD and 82,030 human driver traffic accidents and employs SMOTE to balance the sample sizes between the two groups. Using association rule mining, this study identifies key risk factors and behavioral patterns. The results indicate that while both AD and human driver accidents exhibit seasonal trends, their risk characteristics and distributions differ markedly. AD accidents are more frequent in summer (July–August) on clear days and tend to occur at intersections and on streets, with a higher proportion of non-injury collisions observed at night. Collisions involving non-motorized road users are more prevalent in human driver accidents. AD systems show certain advantages in detecting non-motorized vehicles and performing low-speed evasive maneuvers, particularly at night; however, limitations remain in perception and decision-making under complex conditions. Human driver accidents are more susceptible to driver-related factors such as fatigue, distraction, and risk-prone behaviors. Although AD accidents generally result in lower injury severity, further technological refinement and scenario adaptability are required. This study provides insights and recommendations to enhance the safety performance of both AD and human-driven systems, offering valuable guidance for policymakers and developers.

1. Introduction

In recent years, the ongoing advancement and advocacy of autonomous driving (AD) technology have significantly enhanced the global potential for the deployment of automated vehicles. AD is seen as a potential solution to current road traffic safety issues, with its primary advantage lying in the elimination of human driver errors, thereby reducing the incidence of traffic accidents. According to data from the World Health Organization (WHO), since 2010, the number of road traffic deaths has decreased by 5% annually, dropping to 1.19 million per year [1]. As such, the introduction of AD technology not only represents a breakthrough in technological innovation but is also viewed as a significant avenue for reducing traffic accidents and enhancing road safety.
Despite the remarkable technological progress in AD, and its widespread recognition by experts as an effective means to reduce traffic accidents caused by human error, whether it is truly safer than traditional human driving (HD) remains a complex and unresolved issue. AD systems rely on high-precision sensors, real-time data processing, and complex decision-making algorithms to control vehicles in place of human drivers [2]. These systems face the challenge of handling diverse and complex road conditions, unexpected events, and interactions with other road participants in practical applications. For instance, when sensors are affected by weather conditions or other environmental factors, AD may experience perception errors [3]. Moreover, whether the decision-making ability of autonomous systems can match or even surpass the reaction capability of human drivers, particularly in complex traffic situations (such as emergency evasive maneuvers, unstructured roads, or adverse weather conditions), remains a central area of current research.
The greatest advantage of AD lies in its ability to eliminate many of the errors made by human drivers, particularly those resulting from fatigue, distraction, or emotional factors. Recent research has also shown that physics-informed deep learning models, such as Deep Lagrangian Neural Networks (DLNNs), can enhance control accuracy and robustness in intelligent vehicle systems, providing further evidence of AD’s technical potential [4]. For example, autonomous systems can continuously monitor the surrounding environment through high-precision sensors and real-time data processing, identifying potential risks and responding accordingly, without the influence of human judgment [5]. Additionally, AD can enhance traffic flow and safety through technologies such as vehicle-to-vehicle (V2V) and vehicle-to-infrastructure (V2I) communication, enabling the real-time coordination and management of road traffic [6].
However, the adoption of AD is accompanied by significant challenges and uncertainties, raising critical questions about its feasibility and safety. The transition from human-driven to autonomous vehicles introduces a new spectrum of risks that require careful examination. Technical challenges, such as sensor malfunctions, algorithmic errors, and incomplete handling of edge cases in complex real-world environments, can compromise the safety of autonomous systems [7]. For example, identifying key physical parameters such as tire load remains difficult under real-world uncertainty. Hybrid physical–data-driven methods, which integrate extended Kalman filters with deep learning corrections, have shown promise in enhancing perception accuracy and system robustness in complex vehicle dynamics scenarios [8]. Additionally, cybersecurity threats pose a growing concern, as malicious attacks targeting the software and communication networks of AD could lead to severe consequences. Beyond technical limitations, the coexistence of human-driven and autonomous vehicles on the same roads creates a multifaceted set of interactions, including unpredictable behaviors from human drivers and potential conflicts between the two driving modes [9]. These interactions may generate unforeseen risks and complicate the integration process. While AD holds promise, skepticism persists among researchers and the public, with critics emphasizing the need for rigorous, data-driven evaluations to determine the relative safety of autonomous driving vehicles under diverse and realistic conditions [10]. Empirical evidence is essential to address these uncertainties and build confidence in autonomous systems as a viable and safer alternative to traditional driving.
This study addresses a critical question: Is autonomous driving a safer option compared to human driving? By focusing on the risk factors associated with traffic accidents in both modes of driving, this research provides a data-driven comparison of their safety performance. Leveraging association rule mining, a robust analytical approach, we identify and explore patterns and relationships among contributing factors to traffic accidents in autonomous and human-driven vehicles. These factors include environmental conditions, vehicle-specific variables, human behaviors, and technical or algorithmic limitations of autonomous systems. The findings from this research aim to provide a deeper understanding of the strengths and vulnerabilities inherent in autonomous and human driving. By identifying the key factors that differentiate the two modes of driving, we contribute valuable insights for policymakers, automotive engineers, and researchers striving to improve traffic safety.

2. Literature Review

2.1. Risk Factors in Human-Driven Vehicles

Traffic accidents have been extensively studied in the context of human-driven vehicles, with research consistently identifying human error as the predominant cause. According to the National Highway Traffic Safety Administration (NHTSA), approximately 90% of all road accidents result from human mistakes, including distractions, fatigue, impaired driving, and reckless behaviors such as speeding or aggressive maneuvers [11]. Among these, driver distraction—particularly due to mobile phone usage—has been widely recognized as a major contributor to road crashes [12]. Similarly, fatigue-induced lapses in attention and impaired driving due to alcohol or drug consumption significantly increase the likelihood of accidents [13,14].
In addition to behavioral risk factors, cognitive limitations play a crucial role in accident occurrence. Unlike automated systems that operate based on sensor-driven environmental awareness, human drivers rely on their visual perception, reaction time, and decision-making capabilities, all of which are prone to errors and deterioration under stress or fatigue [15,16]. Studies on traffic safety have shown that misjudgments in speed estimation, distance perception, and delayed responses to sudden hazards frequently lead to collisions [17]. Environmental conditions further exacerbate these risks, as factors such as poor visibility, adverse weather, and inadequate road infrastructure contribute to increased accident rates [18]. Although the introduction of advanced driver assistance systems (ADASs) has helped mitigate some of these risks, human-driven vehicles remain highly susceptible to errors that autonomous technologies aim to eliminate.

2.2. Risk Factors in Autonomous Vehicles

As AD technology continues to advance, researchers have sought to evaluate its potential to enhance road safety by reducing human error. Unlike human drivers, autonomous vehicles rely on a complex fusion of LiDAR, radar, cameras, and artificial intelligence to perceive their surroundings and make driving decisions [19]. Proponents of AD technology argue that by removing human fallibility—such as distraction, fatigue, and impaired judgment—autonomous systems could substantially lower accident rates and improve overall traffic safety [20]. Empirical studies have shown that AD demonstrates lower crash involvement in controlled environments, as seen in Waymo’s test fleet, which has exhibited fewer critical driving errors compared to human-driven vehicles [21].
However, despite these advantages, AD introduces a new set of risk factors that warrant careful examination. One of the primary concerns is the reliability of autonomous systems in complex and unpredictable real-world conditions. Sensor malfunctions, algorithmic limitations, and difficulties in interpreting nuanced human behaviors can lead to safety-critical failures [22,23]. Furthermore, AD struggles with edge cases—rare but potentially dangerous scenarios that human drivers handle instinctively, such as unexpected pedestrian behavior or sudden road obstructions [24]. Another challenge lies in AD’s interaction with HD. Studies have indicated that AD tends to adopt overly cautious driving strategies, which can increase the likelihood of low-speed rear-end collisions, especially in mixed-traffic environments where human drivers exhibit unpredictable behavior [25,26].
Comparative analyses between AD and HD suggest that while AD may reduce specific high-risk behaviors associated with human driving, they also introduce novel challenges that require further refinement. Some studies indicate that AD outperforms human drivers in controlled conditions but struggles in highly dynamic and unstructured environments, where the ability to interpret implicit social cues and rapidly adapt to unforeseen events remains a limitation [27]. As a result, while AD technology holds promise, its overall safety impact remains an open question, necessitating further empirical validation through large-scale, real-world deployment data.

3. Materials and Methods

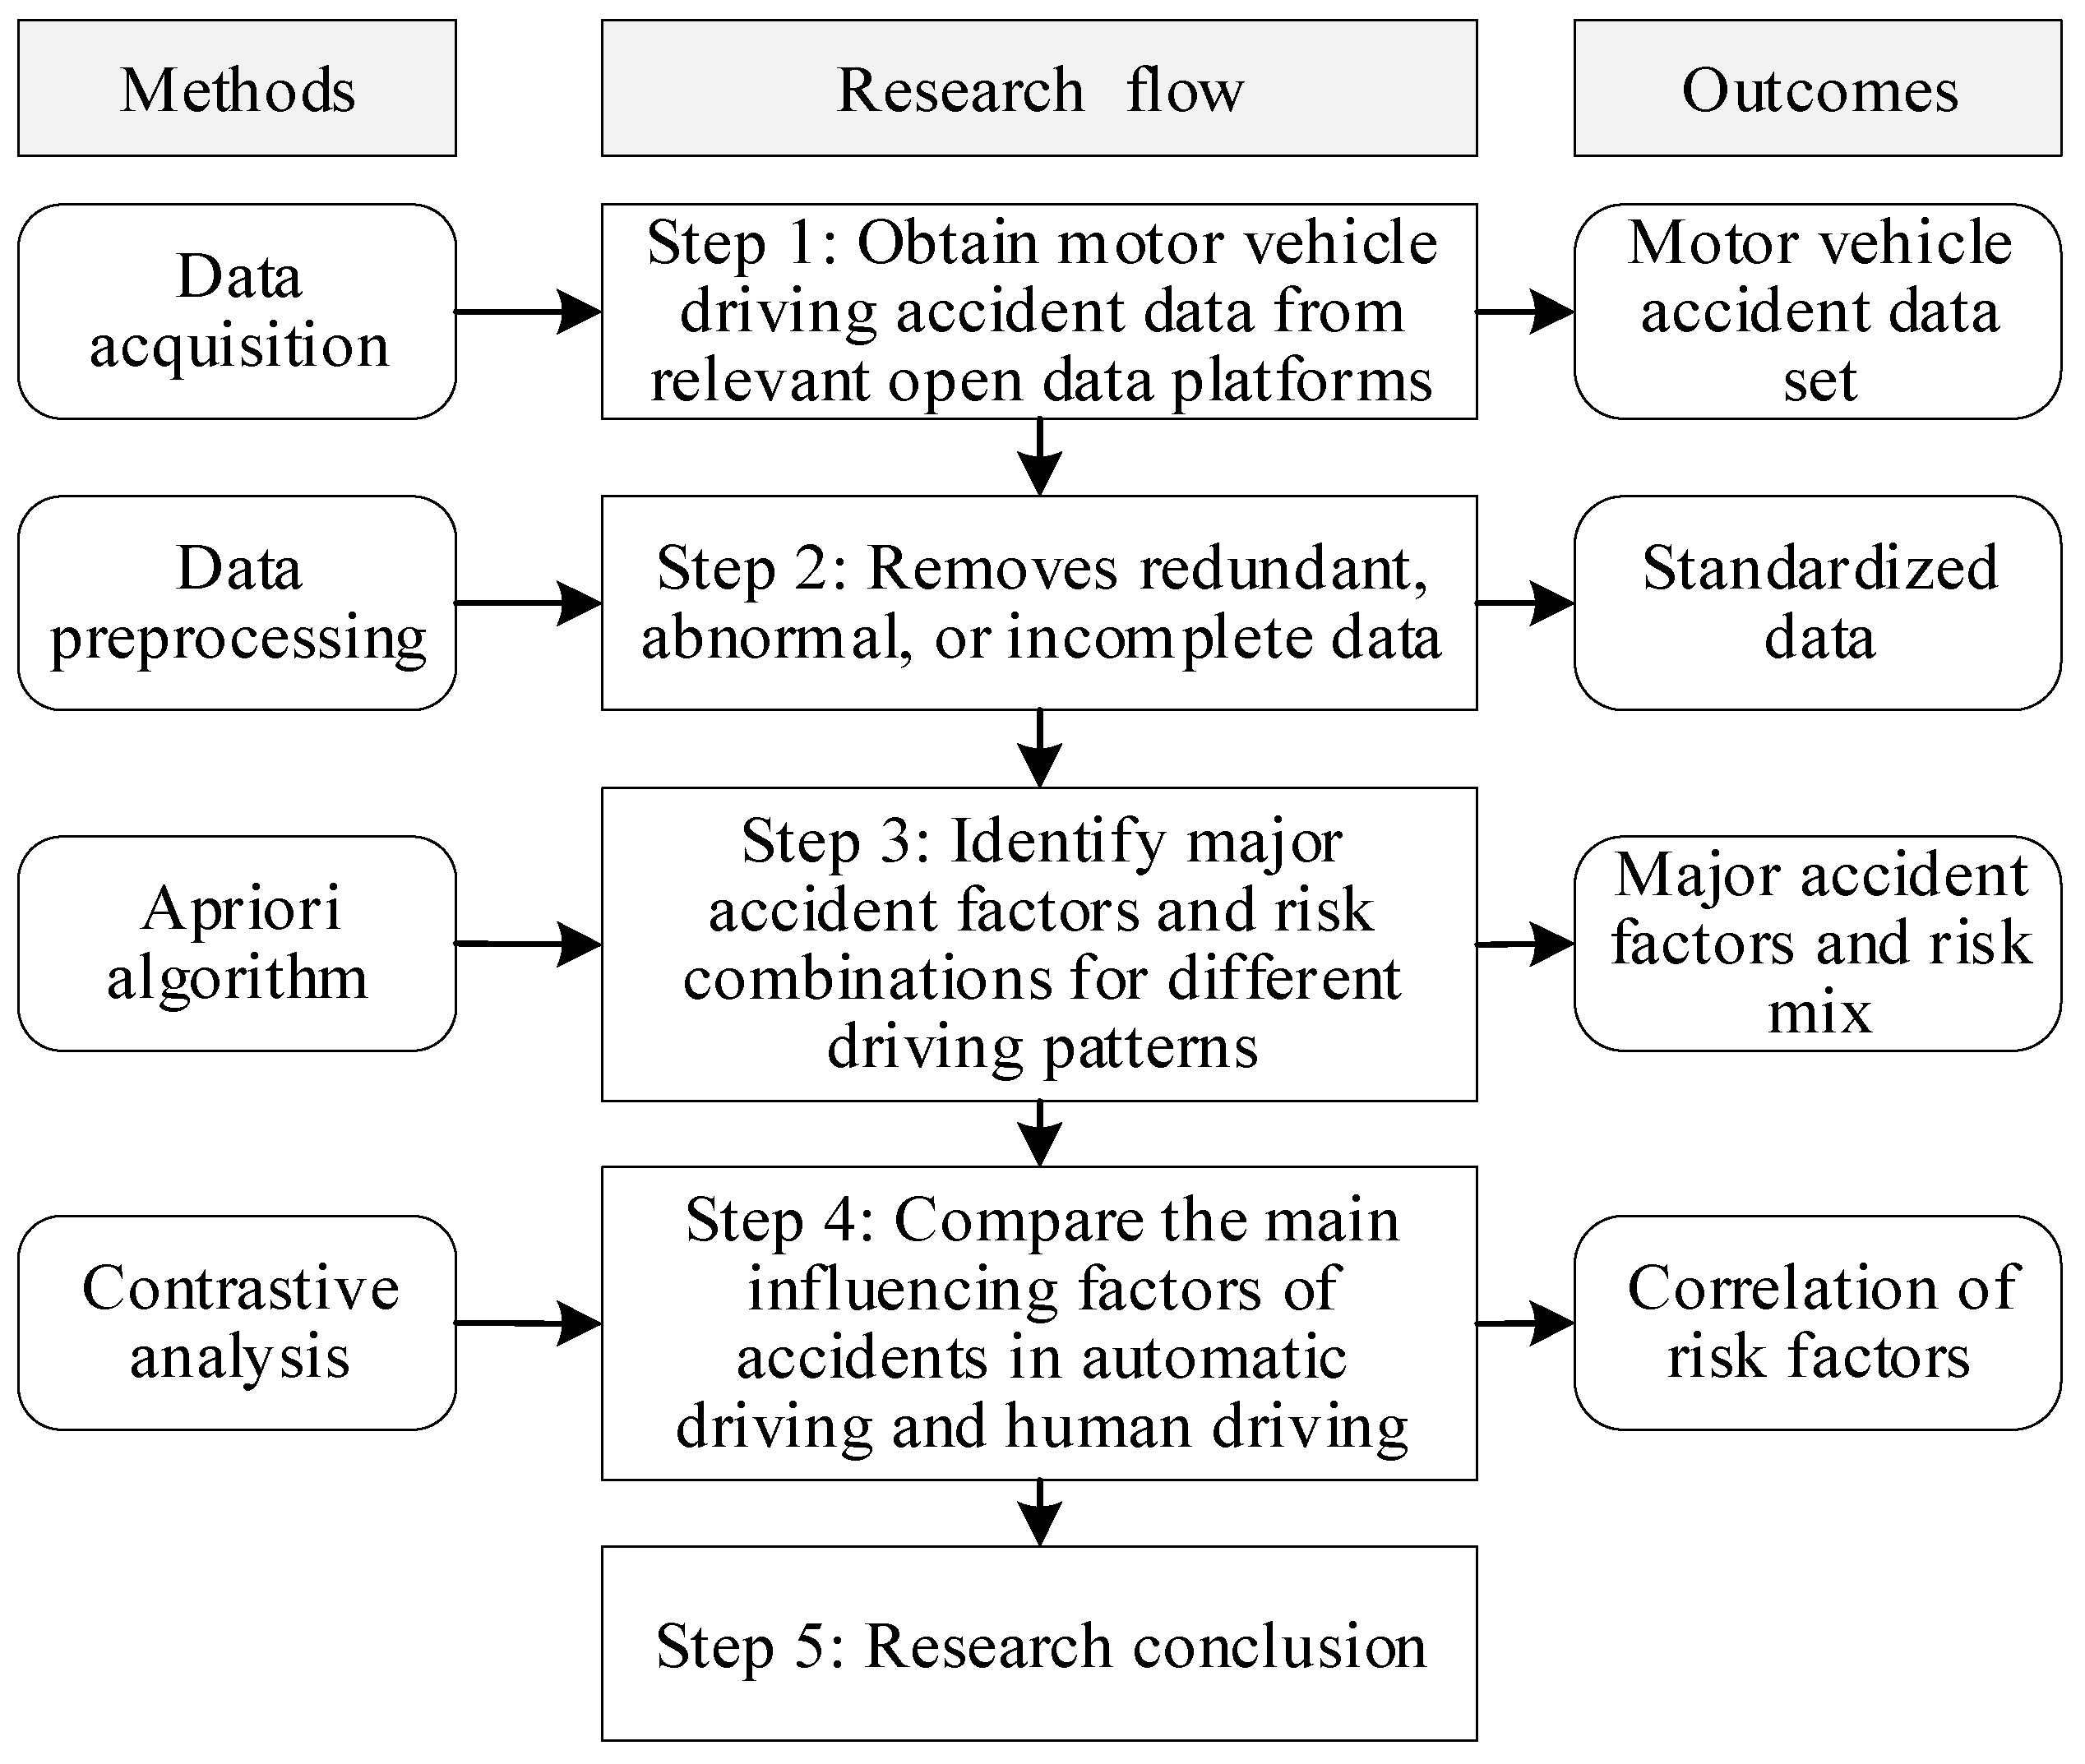
3.1. The Analytical Framework

Based on a literature review, this study presents the current state and trends in research on the risks associated with road traffic accidents. The research framework is illustrated in Figure 1. The first step involves acquiring road traffic accident data from relevant open data platforms or government transportation departments (e.g., Ministry of Transport websites, National Bureau of Statistics, publicly available traffic accident databases, etc.). The dataset should encompass a wide range of variables, including accident type, location, time, weather conditions, driving mode (automated or manual), and severity of injuries. The second step is to clean the collected data, removing any redundant, anomalous, or incomplete entries, followed by data formatting and standardization to ensure compatibility across different data sources. The third step employs association rule analysis methods (such as the Apriori or FP-Growth algorithms) to uncover the correlation rules between autonomous and human driver accident factors. This step aims to identify the primary accident factors and risk combinations for each driving mode and analyze the risk probabilities of these factors under varying circumstances, such as different weather conditions, road types, and times of day. The fourth step compares the main influencing factors of accidents in autonomous and human-driven modes, analyzing the differences in accident occurrence rates and accident types under identical conditions, as well as assessing the severity of various types of accidents. Through association rule analysis, this study identifies which factors have a greater influence on accident risk in AD mode and which factors dominate human driving. Finally, based on the analysis, the study concludes the safety advantages or risk factors of AD under specific conditions and evaluates its actual performance in reducing accident risks. Recommendations are provided to optimize AD systems, such as whether additional safety modules or enhanced decision-making capabilities are needed under certain weather or road conditions. The advantage of using association rule analysis lies in its ability to uncover potential relationships by identifying correlation rules. Exploring the potential connections between the causes of accidents and analyzing the characteristics of risk transmission in motor vehicle collisions are crucial components of safety risk management.

3.2. Data Source

3.2.1. Autopilot Accident Data

The data were obtained from publicly available sources. From July 2021 to May 2024, the California Department of Motor Vehicles (DMV) received and published reports on 1193 AD accidents, reflecting the relatively short history of autonomous vehicle deployment. Based on these reports, an AD accident dataset was compiled, which meticulously records the essential details of each accident, including the exact date, time, and location of the accident, the severity of the accident, the weather conditions at the time, and the lighting conditions, among other critical factors. The results of the compilation of AD accident data are shown in Table 1.

3.2.2. Human Driving Accident Data

The data on human driver accidents were sourced from publicly available datasets published by the National Highway Traffic Safety Administration (NHTSA). This study initially selected road traffic accident data from California between January 2016 and December 2022, yielding 367,232 records. Given that the AD accident data primarily focus on vehicle collisions, non-collision records in the human driver accident dataset were further excluded, resulting in 348,694 valid collision accident records. All vehicle accident data were downloaded on 20 June 2024.
These human-driven collision accident data served as the benchmark for the comparative analysis with AD. To ensure an effective comparison between the two types of accidents, we selected the same variables as those used in the AD accident data (as shown in Table 1) and made the necessary transformations and adjustments to the attributes of the human driver accident data. This ensured compatibility and reliability in the comparison between the two datasets.
To address the temporal mismatch between the two datasets and reduce potential confounding, this study restricted the analysis to the overlapping period from July 2021 to December 2022. Within this timeframe, 534 valid accident records were identified for AD, while 82,030 records were retained for HD vehicles. This large disparity in sample sizes may introduce statistical bias, especially when performing comparative analyses. To mitigate this imbalance, the Synthetic Minority Over-sampling Technique (SMOTE) was employed. SMOTE is a widely used data augmentation method that generates synthetic samples for the minority class (in this case, AD accidents) by interpolating between existing instances. By applying SMOTE, the AD dataset was synthetically expanded to match the size of the HD dataset (82,030 records), enabling more balanced and reliable association rule mining.

3.3. Data Preprocessing

The data processing process included data reduction and transformation, aiming to improve the quality of the data and provide a reliable foundation for association rule mining.

3.3.1. Data Specification

During data processing, to improve data cleanliness and reduce the dimensionality and complexity of the dataset, the features most relevant to the research objectives were first selected. For the AD dataset, the columns “Report ID”, “Incident Date”, “Incident Time (24:00)”, “Roadway Type”, “Lighting”, “Crash With”, “Highest Injury Severity Alleged”, as well as multiple columns describing weather conditions (such as “Weather—Clear”) and various columns related to collision locations (such as “CP (Crash Partner) Contact Area—Rear Left”) were retained. For the human driving dataset, the columns “CASENUM”, “MONTH”, “HOUR”, “HARM_EV”, “MAN_COLL”, “REL_ROAD”, “LGT_COND”, “WEATHER”, “MAX_SEV”, “INT_HWY”, and “TYP_INT” were preserved for subsequent analysis.

3.3.2. Data Conversion

To ensure the comparability of features between the autonomous and human driving datasets, this study performed data transformations for consistency. First, missing or unknown values were replaced with NaN in both datasets to standardize the data.
The collision events, which record what the vehicle collided with, were categorized for simplification. Given the diversity of collision events, the 14 different collision types in the AD dataset and 37 different types in the human driving dataset were unified into four categories: “motor vehicle”, “non-motorist”, “animal”, and “object”.
For the “month” feature, to identify seasonal patterns while ensuring data stability across time intervals, the 12 months were initially grouped into six bimonthly intervals: “January, February”, “March, April”, “May, June”, “July, August”, “September, October”, and “November, December”, as single-month data may not be sufficient to reveal meaningful patterns. This approach helps mitigate data sparsity and enhances interpretability in the association rule mining process. To evaluate the robustness of this approach, this study further tested the analysis using month-level granularity. The results remained broadly consistent, confirming that the main patterns were not significantly affected by the choice of temporal resolution.
In processing the “weather” feature, to standardize different expressions of similar weather conditions, the six weather conditions in the AD dataset and ten in the human driving dataset were consolidated into six categories: “clear”, “cloudy”, “raining or snowing”, and “foggy or smoky”, to eliminate the interference caused by varying terminology.
According to existing research [28], both datasets discretized time into four periods: 7:00–11:00, 11:00–14:00, 14:00–18:00, and 18:00–7:00. These time slots align with typical traffic flow variations throughout the day. The time slot 7:00–11:00 corresponds to the morning peak hours when commuter traffic is at its highest. The slot 11:00–14:00 covers midday traffic, which includes lunch breaks and commercial vehicle movement. The slot 14:00–18:00 represents the afternoon and early evening period, which includes school dismissals and the evening rush hour. The slot 18:00–7:00 covers nighttime and early morning hours when traffic volumes are generally lower, but accident risks may be influenced by reduced visibility and driver fatigue.
For the “lighting condition” feature, the four types of lighting in the AD dataset and five types in the human driving dataset were merged into four categories: “Dark—Lighted”, “dark-not lighted”, “daylight”, and “dawn or dusk”.
Additionally, for missing collision type information in the AD dataset, we inferred the collision type based on the collision position data from CP and SV (Subject Vehicle). The specific rules were as follows: collisions where both vehicles’ collision positions were “front” were categorized as front-to-front collisions; one vehicle being “front” and the other “rear” was categorized as a front-to-rear collision; both vehicles being “rear” was categorized as a rear-to-rear collision; one vehicle being “rear” and the other containing “side” was categorized as a rear-to-side collision; both vehicles being “side” was categorized as a side-swipe collision; and any collision position containing “angle” was categorized as an angle collision. Each vehicle may have multiple collision types.
The DMV primarily collects autonomous vehicle accident reports from manufacturers and other stakeholders, while the NHTSA gathers data from a wide range of sources, including police reports, insurance claims, and vehicle inspections. This difference in data collection procedures could introduce inconsistencies. To address these inconsistencies and ensure a fair comparison, this study classified the accidents based on the severity of the accidents.
In the AD dataset, there is a feature for injury severity, which details the extent of injuries to individuals during vehicle accidents. In the HD dataset, a fatal injury is any injury that results in death within 30 days after the motor vehicle crash in which the injury occurred. A suspected serious injury refers to any injury, other than fatal, that results in one or more of the following: severe laceration; broken or distorted extremity; crush injuries; suspected skull, chest, or abdominal injury; significant burns; unconsciousness when taken from the crash scene; or paralysis. A suspected minor injury is any injury that is evident at the scene of the crash, other than fatal or serious injuries. A possible injury is any injury reported or claimed that is not a fatal, suspected serious, or suspected minor injury. No apparent injury is a situation where there is no reason to believe that the person received any bodily harm from the motor vehicle crash [29]. In this study, based on the injury severity categories from the human driving dataset, the HD injury categories were classified as follows: “no apparent injury” as no damage, “suspected minor injury” and “possible injury” as minor damage, and “suspected serious injury” and “fatal injury” as major damage. The AD injury categories were classified as follows: “no injuries reported” as no damage, “minor” as minor damage, and “moderate”, “serious”, and “fatality” as major damage.
This categorization helps to reduce potential biases caused by the differences in how the two datasets were compiled. By grouping accidents of similar severity levels, we ensured that the comparison between human-driven and autonomous vehicles is more reliable.
The AD dataset includes five different collision locations: highway, intersection, parking lot, street, and traffic circle. For the human driving dataset, the collision locations were inferred from the “REL_ROAD”, “INT_HWY”, and “TYP_INT” columns to determine whether the collision occurred on a highway, at an intersection, in a traffic circle, or a parking lot, thus aligning them with the collision location information in the AD dataset.

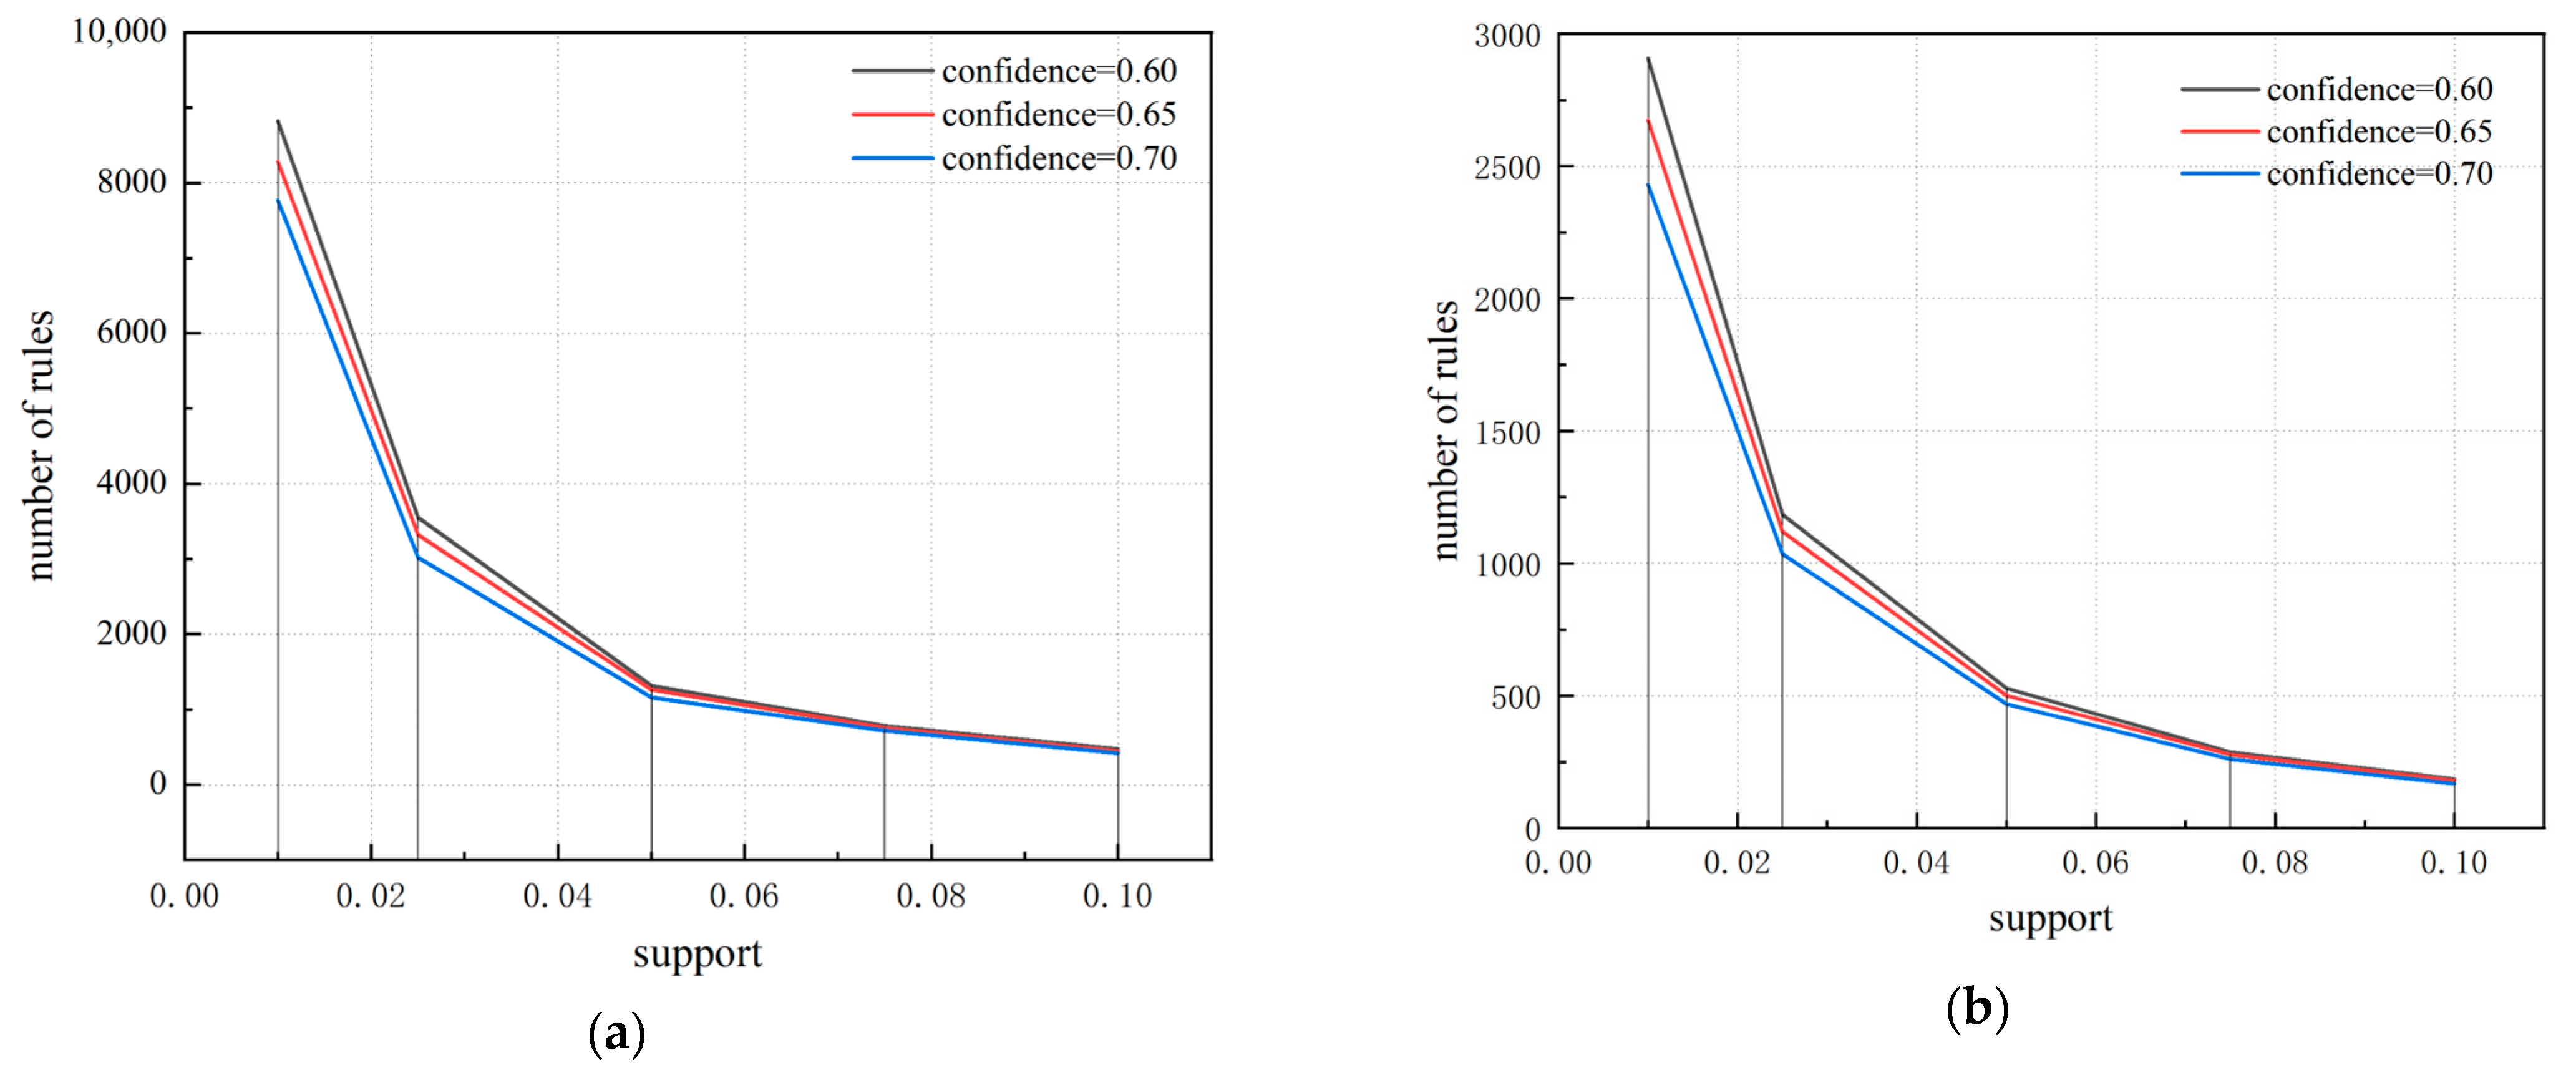
3.4. Association Rules

The association rule is a data mining technique aimed at revealing co-occurrence patterns between different itemsets within a dataset, which are typically measured by support, confidence, and lift to assess the frequency and strength of their relationships.
Support measures the frequency of an itemset appearing in the entire dataset. For an association rule A B , the support is calculated using Formula (1):
S u p p o r t A B = C o u n t A B N
Confidence measures the probability of itemset B appearing, given that itemset A appears. For the association rule A ⇒ B, the confidence is calculated as Formula (2):
C o n f i d e n c e A B = C o u n t A B C o u n t A
Lift measures the strength of the influence of the antecedent on the consequent. It evaluates the relationship between the antecedent ( A ) and consequent ( B ) by comparing the observed frequency of them occurring together to the expected frequency if they were independent. If the two events are independent, the lift value will be 1. A lift greater than 1 indicates that the antecedent and consequent occur together more frequently than expected, suggesting a meaningful relationship. Conversely, a lift less than 1 suggests that the occurrence of the antecedent reduces the likelihood of the consequent occurring, indicating a negative or weak relationship. For the association rule A B , the lift is calculated as Formula (3):
L i f t A B = C o n f i d e n c e A B S u p p o r t B
In these formulas:
A B represents the association rule with A as the antecedent and B as the consequent.
Support ( A B ) represents the support of the rule A B .
Confidence ( A B ) represents the confidence of the rule A B .
Lift ( A B ) represents the lift of the rule A B .
Count ( A B ) is the frequency of the itemset { A , B } appearing in the dataset.
N is the total frequency of itemsets in the dataset.
Several theories and algorithms have been proposed for association rule mining, among which the Apriori algorithm is one of the most influential algorithms for mining Boolean association rules and frequent itemsets and remains one of the most widely used methods. In this study, the Apriori algorithm was chosen to mine the association rules related to the factors influencing traffic accidents for both autonomous and human-driven vehicles. The Apriori algorithm generates frequent itemsets iteratively, optimizing the computation process by utilizing the property that “all subsets of a frequent itemset must also be frequent”. The algorithm first calculates the support of each item, selects frequent 1-itemsets, and then generates larger candidate itemsets based on these frequent itemsets. Itemsets with support below a threshold are removed, and the process continues iteratively until no new frequent itemsets can be generated. Finally, significant association rules are derived from the frequent itemsets based on metrics such as support, confidence, and lift.
Another prominent algorithm for association rule mining is the FP-Growth (Frequent Pattern Growth) algorithm. Instead of using a breadth-first search strategy, FP-Growth adopts a depth-first approach and compresses the dataset into a compact data structure called the FP-tree (Frequent Pattern Tree). The algorithm first scans the database to determine the frequency of individual items and orders them in descending frequency. A second scan constructs the FP-tree, in which paths represent itemsets and node counts reflect item frequencies. Once the tree is built, frequent itemsets are mined recursively by extracting conditional patterns and constructing conditional FP-trees. Like Apriori, FP-Growth derives association rules using metrics such as support, confidence, and lift, but with improved efficiency in dense datasets.
This study employed an empirical approach to determine appropriate thresholds. Since rules with a lift greater than 1 are considered meaningful—indicating a positive correlation between antecedents and consequents—the lift threshold was uniformly set to 1.0. A grid search was conducted to compare the execution time of the Apriori and FP-Growth algorithms under different threshold combinations on both autonomous and human driver accident datasets. Previous research on traffic safety evaluation has commonly set the minimum thresholds for support and confidence within the ranges of 1–10% and 60–70%, respectively [30,31]. Drawing on previous studies in traffic safety research, the ranges for minimum support and confidence were set as {0.01, 0.025, 0.05, 0.075, 0.1} and {0.6, 0.65, 0.7}, respectively. The results show that the Apriori algorithm consistently exhibited a shorter runtime than FP-Growth across various settings (Table 2). Therefore, Apriori was selected as the preferred method for this study. Based on the elbow method applied to support–confidence threshold plots (Figure 2), the thresholds for mining overall accident association rules were ultimately set at 0.05 for support and 0.7 for confidence.
Additionally, we conducted focused rule mining for different injury severity levels (i.e., no damage, minor damage, and major damage) to reveal the factors influencing autonomous and human-driven vehicles at varying levels of injury severity. Given the imbalanced distribution of accident severity levels in the dataset, we appropriately adjusted the support and confidence thresholds to ensure that meaningful rules with a lift greater than 1 could still be identified. Specifically, for the no-damage subset—which accounts for the largest proportion of cases—the thresholds were moderately lowered, with support and confidence set to 0.04 and 0.5, respectively. For minor-damage accidents, which are less frequent, a lower confidence threshold was adopted to capture potentially weak but informative rules; the support and confidence thresholds were set to 0.02 and 0.2. As major-damage accidents are the rarest, both thresholds were further reduced to 0.01 for support and 0.2 for confidence to ensure that low-frequency but important patterns could still be extracted. These adjusted thresholds were uniformly applied to both autonomous and human-driven vehicle datasets to maintain comparability of results across severity levels.

4. Results

4.1. Time Feature Analysis

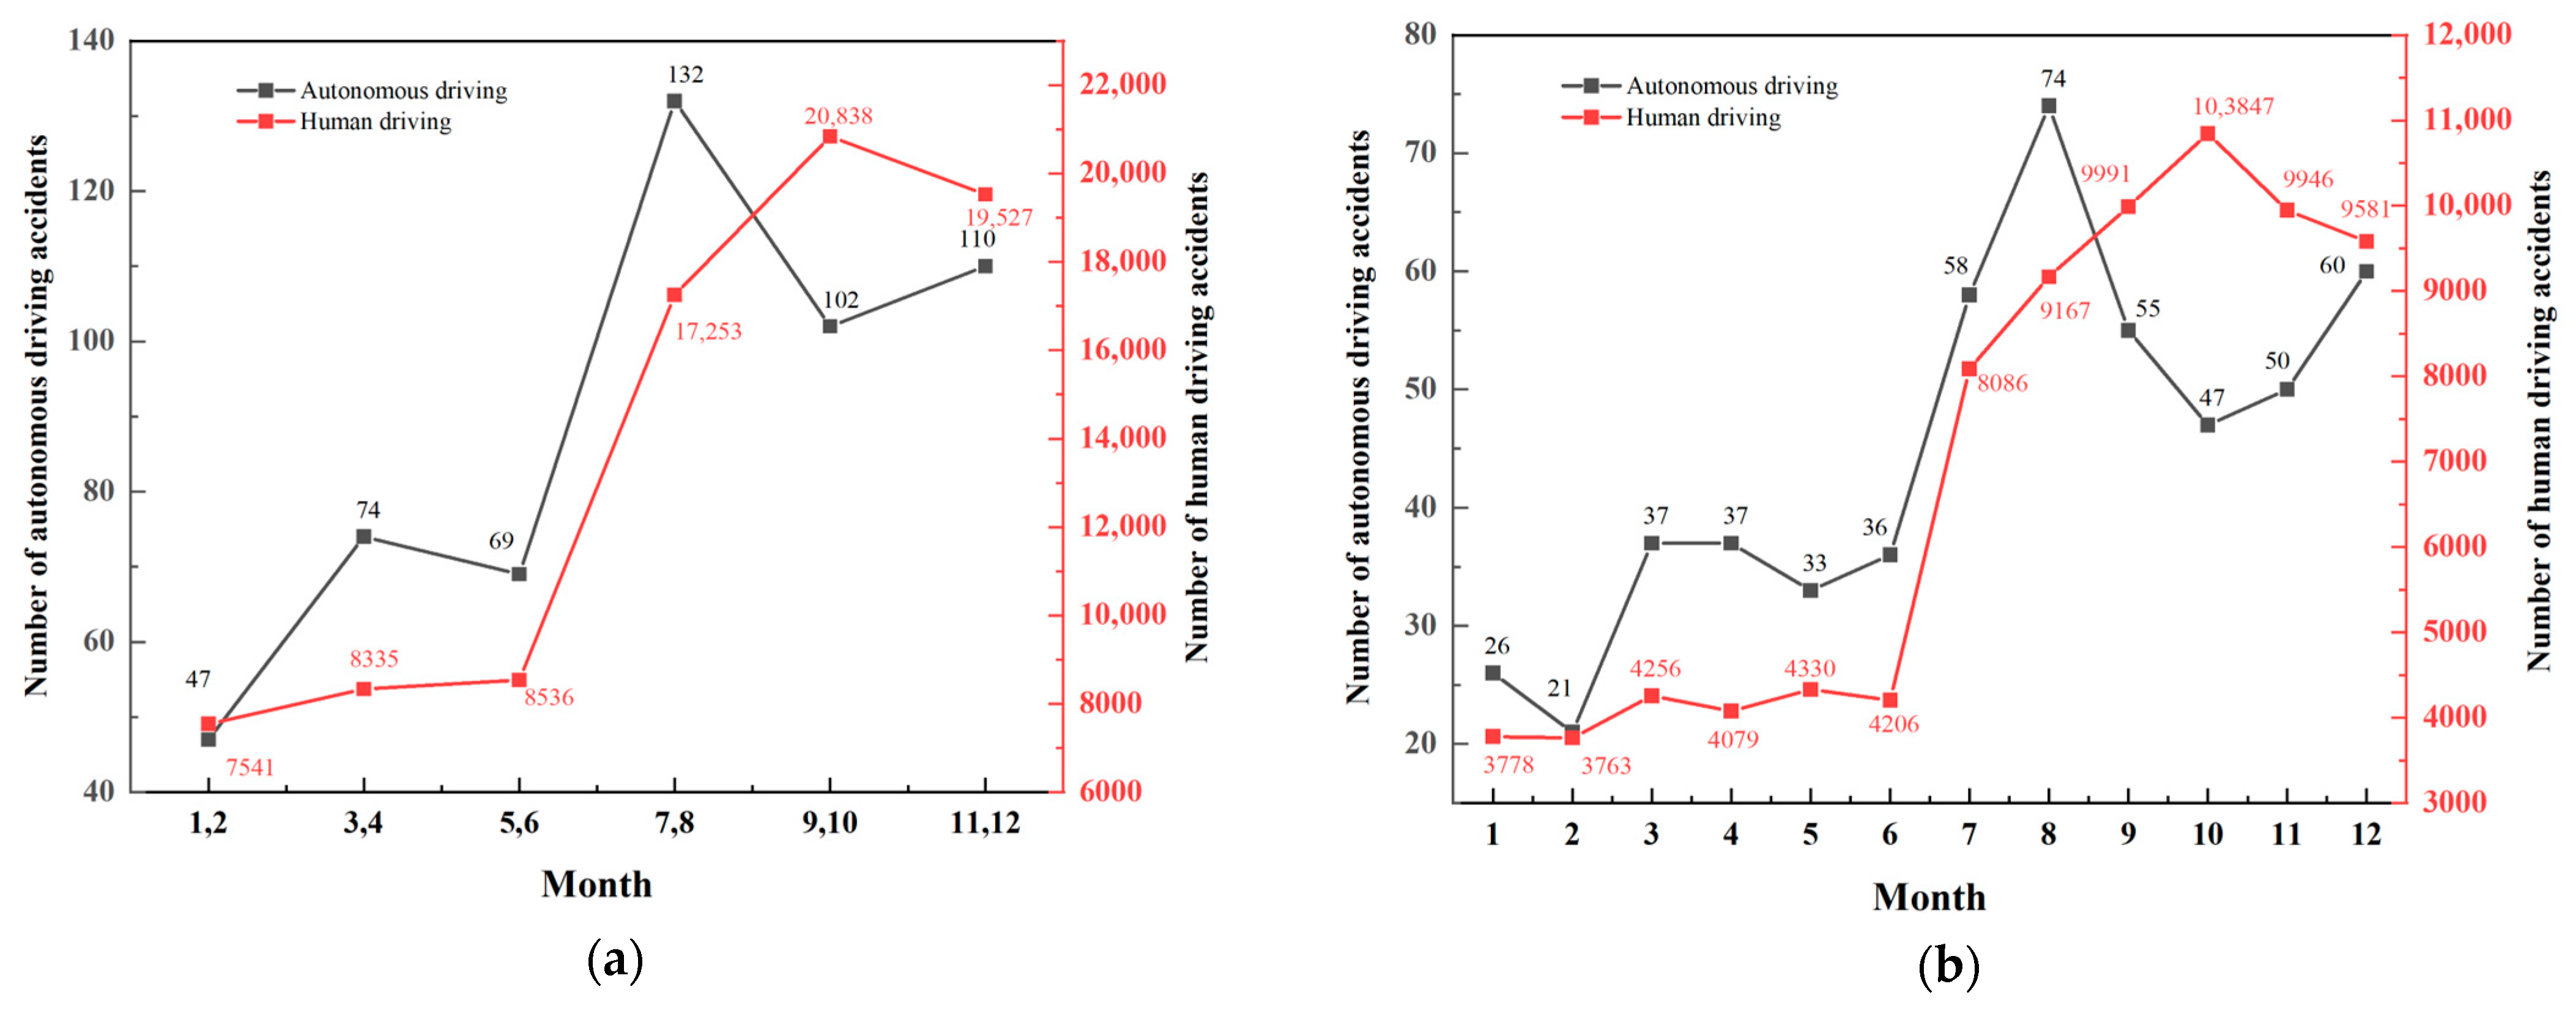
4.1.1. Monthly Feature

The accident dataset includes a total of 534 AD accidents and 80,230 human driver accidents. Figure 3 compares the monthly and bimonthly distributions of autonomous and human driving accidents. The results show that the number of accidents for both categories fluctuated over time, following certain seasonal patterns.
From January to February (47 accidents), AD accidents were at their lowest. This trend can likely be attributed to adverse weather conditions, which reduce the testing mileage of AD. For example, the test mileage in November–December 2022 was only 332,392 miles, accounting for 6.52% of the yearly total mileage. Human driver accidents reached a low point in January to February (7541 accidents) and March to April (8335 accidents), possibly due to cold temperatures and harsh weather limiting traffic flow, which in turn decreases accident exposure.
On the other hand, AD accidents peaked in July and August (132 accidents), likely due to the summer being a critical testing period for AD, with a significant increase in testing mileage. For instance, the testing mileage in July–August 2021 accounted for 19.04% of the annual mileage. The complexity of testing scenarios during this time may expose the limitations of autonomous systems in handling dynamic targets, such as sudden vehicle insertions or pedestrians. Meanwhile, human driver accidents peaked in September and October (20,940 accidents), likely due to the back-to-school season, which leads to increased commuter traffic, heightened vehicle density on the roads, and a higher incidence of accidents as drivers may be affected by time pressures and distracted attention during peak commuting hours.

4.1.2. Period Feature

This study categorized accident occurrence times into four periods: 7:00–11:00, 11:00–14:00, 14:00–18:00, and 18:00–7:00, as illustrated in Figure 4. The results show that the distribution of accidents across these time intervals was generally similar between autonomous and human driving. Notably, during the afternoon period (14:00–18:00), the proportion of human driver accidents (30.6%) was slightly higher than that of autonomous driving accidents (26.1%). This timeframe typically corresponds to peak traffic volume, when human drivers may be more prone to fatigue or stress-induced errors. In contrast, AD systems are relatively better equipped to manage complex traffic conditions under favorable lighting and visibility.

4.2. Weather Feature Analysis

This study classified road traffic accident data for both autonomous and human driving based on different severity levels and examined the distribution of these accidents under various weather conditions to explore the impact of weather on accident severity, as shown in Figure 5. Due to the extremely low proportion of “foggy or smoky” and “severe wind” weather (with no records in the AD dataset and a proportion of less than 0.4% in the human driving dataset), these conditions are not included in the discussion.
The results reveal that the distribution of accident severity for human driving was relatively balanced across different weather conditions, indicating that weather has a minimal impact on the severity of human driving accidents. In rain and snow conditions, the proportion of minor and severe accidents in AD incidents drops to zero. This phenomenon may be attributed to the reduced testing mileage of AD under harsh weather conditions and reflects the strong risk management capabilities of AD systems in complex weather conditions.

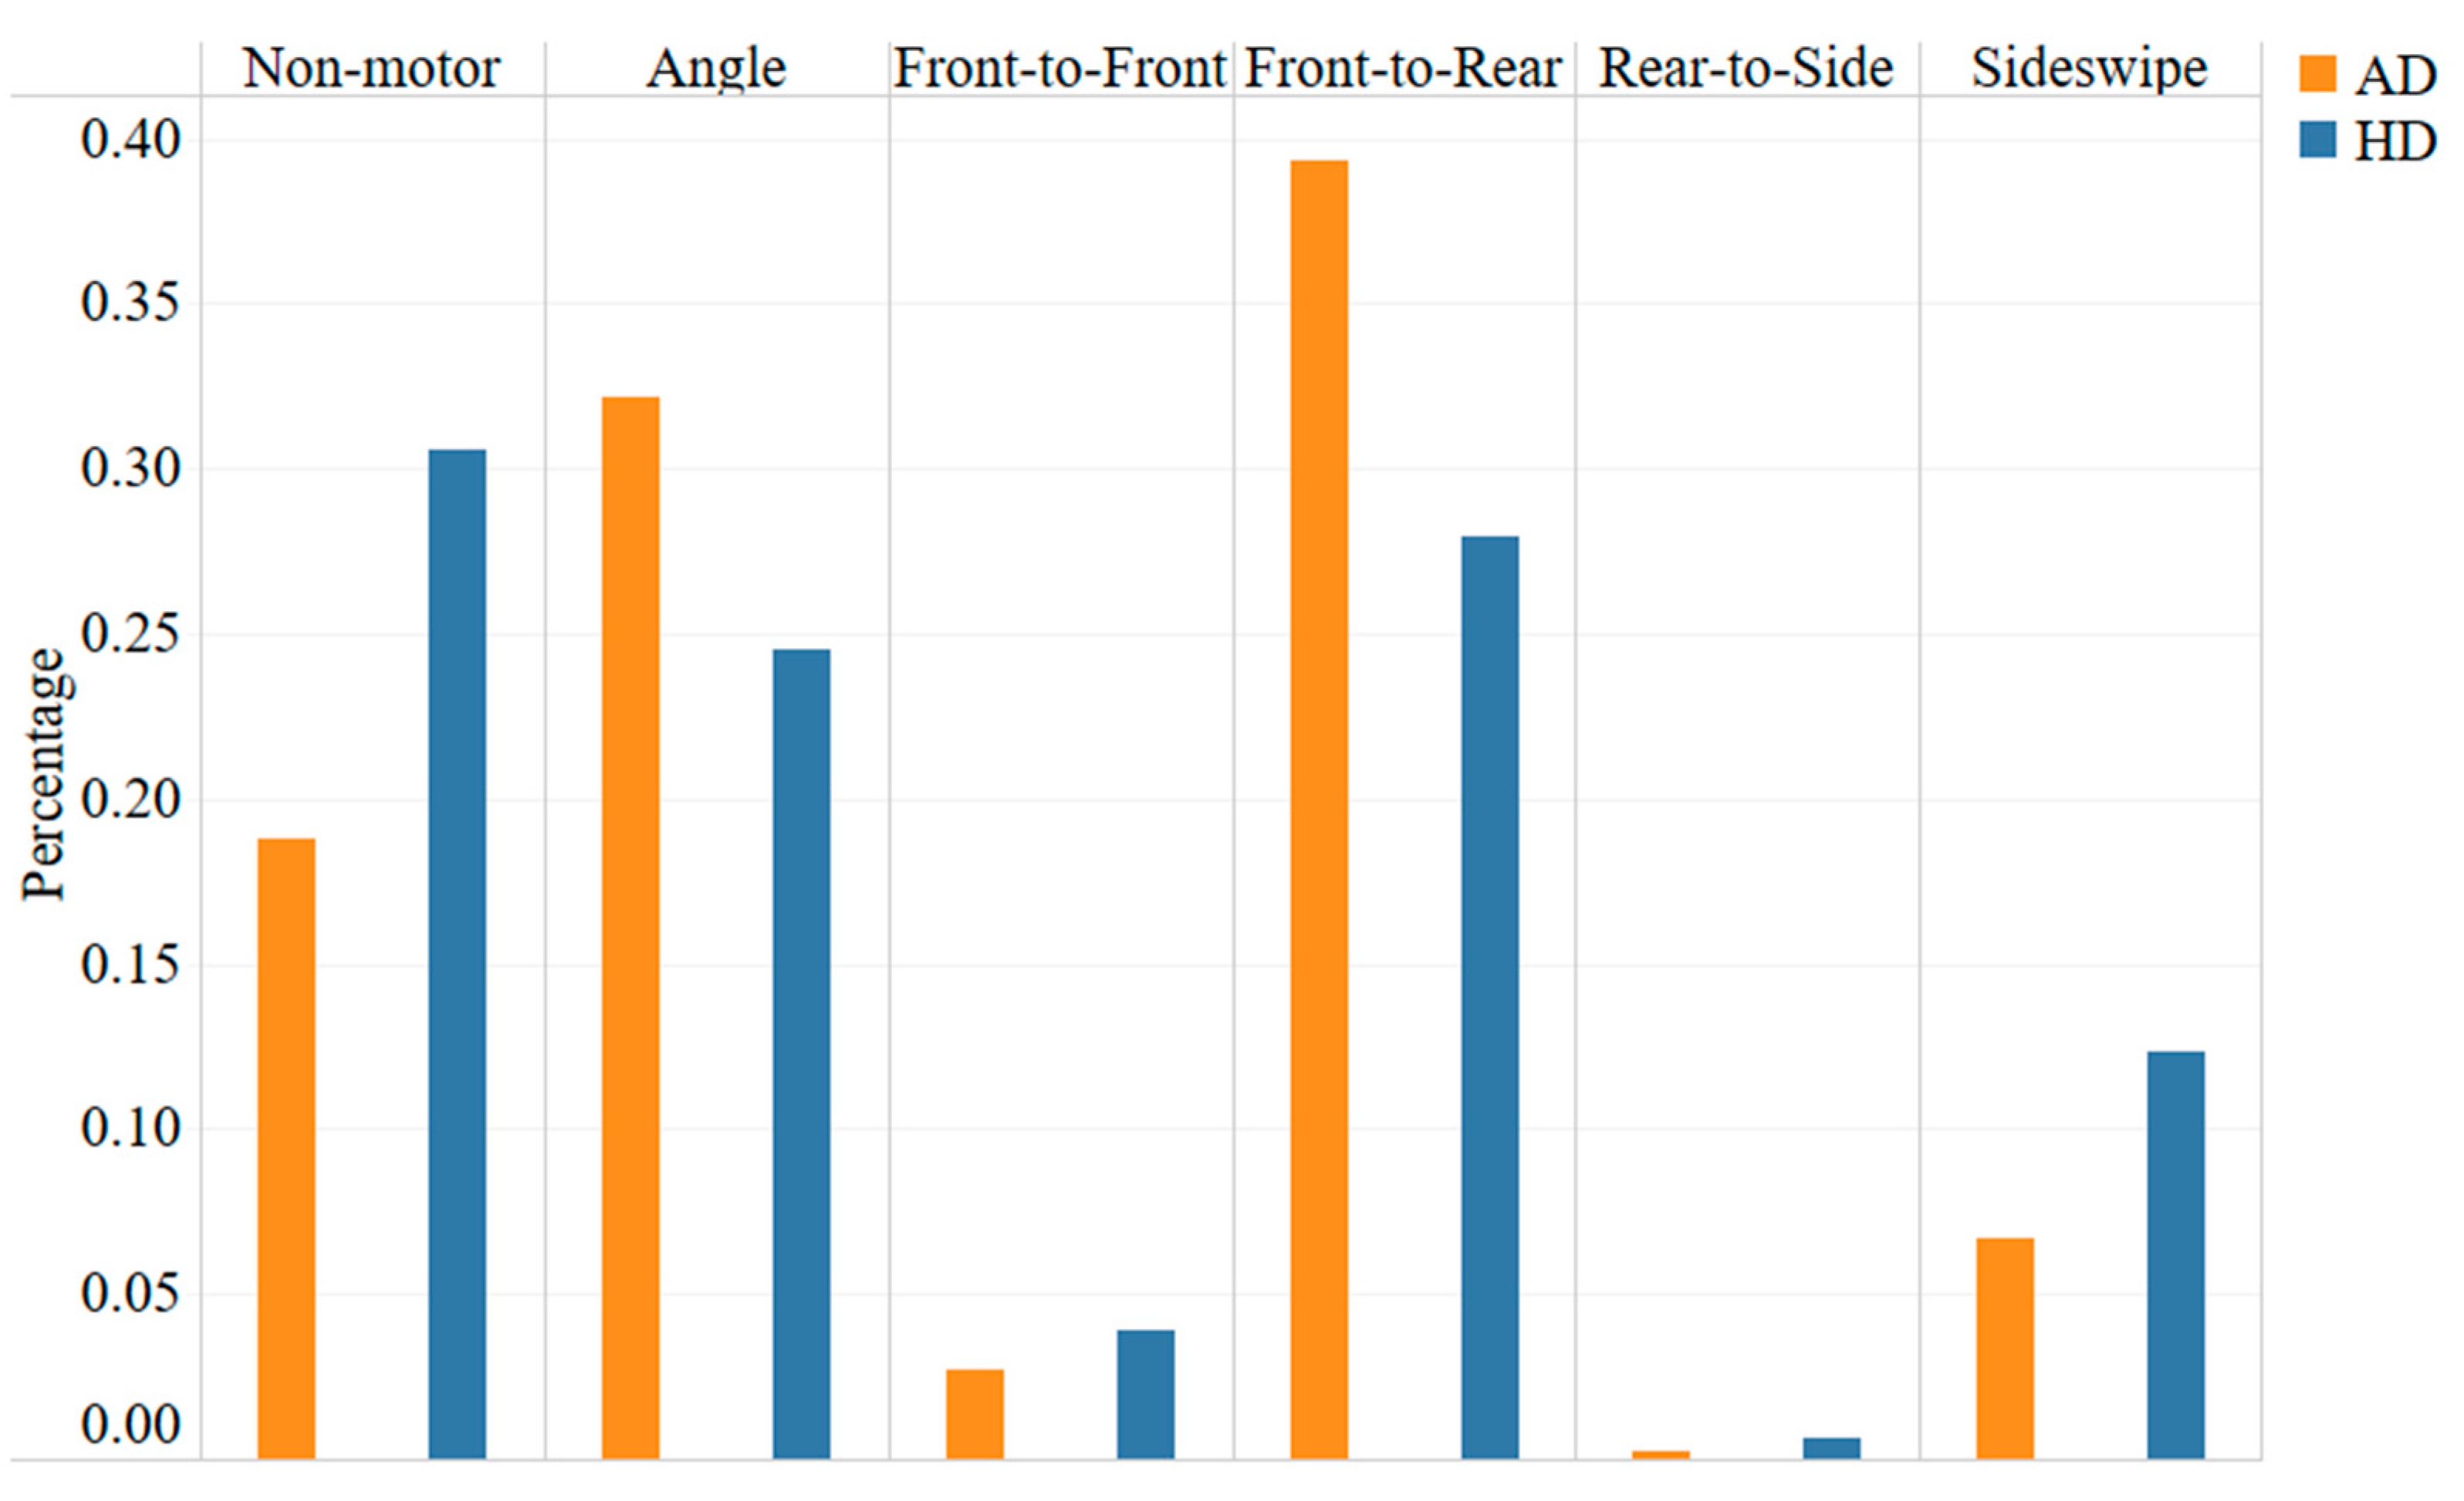
4.3. Collision Position Analysis

This study analyzed the distribution of collision types in both autonomous and human driver accidents. As shown in Figure 6, both types of accidents exhibited a high frequency of angle collisions and front-to-rear collisions. However, the frequency of collisions between human-driven vehicles and non-motorized vehicles was significantly higher than that of AD. This highlighted the limited ability of human drivers to recognize and react in complex traffic situations, while also indicating that AD systems have an advantage in identifying non-motorized vehicles and can take effective evasive measures, thereby reducing the occurrence of traffic accidents, especially those involving non-motorized vehicles. AD accidents are primarily concentrated in angle collisions and front-to-rear collisions, which may be attributed to the system’s perception of blind spots, delayed decision-making, or insufficient ability to handle unexpected situations. The system may experience blind spots in dynamic multi-vehicle intersection scenarios, making it unable to quickly predict the behavior of all vehicles, or it may exhibit delayed responses to sudden lane changes or emergency braking.

4.4. Association Rule Analysis

To avoid information redundancy and more effectively reveal the intrinsic relationships between accident factors, this study applied a minimum improvement constraint with a threshold of 0.05 to filter the association rules. Under this criterion, a rule was retained only if its confidence exceeded that of all its simplifications (i.e., rules formed by removing one or more antecedent conditions) by at least 0.05. This approach eliminates unnecessarily complex rules that do not significantly improve predictive ability. This filtering strategy ensures that the resulting rule set is both concise and informative, reducing redundancy while preserving rules with real explanatory value.

4.4.1. Association Rules

The total number of association rules obtained for AD and HD datasets was 69 and 115, respectively. The results of the best 20 association rules for both modes are shown in Table 3 and Table 4, respectively.
  • Association rule analysis for AD
As shown in Table 3, the occurrence of AD accidents was closely related to factors such as time, lighting condition, and collision location. For example, Rules 1 to 9 indicate that autonomous driving accidents are often associated with non-motor vehicles, typically occurring on streets during the afternoon in daylight conditions. Rules 10 and 11 suggest that a significant number of accidents take place at night. Meanwhile, Rules 12 to 15 reveal that accidents occurring during various daytime periods are generally concentrated on streets or at intersections.
2.
Association rule analysis for HD
As shown in Table 4, the occurrence of human driver accidents was closely related to factors such as collision type, lighting condition, and collision location. For example, Rules 1 to 4 indicate that human driver accidents frequently involve collisions with non-motor vehicles or objects. Rules 5 to 10 further reveal that such collisions often occur at intersections during nighttime. Notably, Rule 11 highlights that poor lighting conditions at night increase the likelihood of collisions. Rules 14 and 15 relate to collision types, showing that angle collisions typically occur at intersections, while side-swipe collisions generally result in no injuries.

4.4.2. Crash Damage

  • Association rules for no-damage crashes
For no-damage crashes, the total number of association rules obtained for AD and HD datasets was 18 and 10, respectively.
Table 5 presents the association rule results for no-damage accidents in AD. It revealed that factors such as collision type, time, weather, and collision location are common contributors to no-damage incidents. For example, Rules 1 to 3 indicate that angle collisions occurring on streets at night typically result in no injuries. Additionally, Rule 4 suggests that angle collisions taking place between 7 a.m. and 11 a.m. are also generally non-injury incidents. Rules 5 and 6 show that non-injury accidents involving autonomous vehicles are often associated with cloudy weather and frequently occur at intersections. Rules 7 to 9 point out that streets in the afternoon or evening are also common locations for non-injury accidents.
Table 6 presents the association rule results for no-damage accidents involving human-driven vehicles. It revealed that factors such as collision type, weather, collision location, and time are common contributors to no-damage incidents in human driving. For example, Rules 1 and 2 indicate that side-swipe and rear-end collisions under human driving typically result in no injuries. Rules 3 and 9 relate to weather conditions, showing that non-injury accidents are more likely to occur during rainy, snowy, or cloudy weather. Rule 5 highlights that highways are common locations for accidents. Rules 6, 7, 8, and 10 suggest that human driver accidents are more frequently observed during various daytime periods.
2.
Association rules for minor-damage crashes
For minor-damage crashes, the total number of association rules obtained for AD and HD datasets was 12 and 5, respectively.
Table 7 presents the association rule results for minor-damage accidents in AD. Collision type, collision location, weather, and time are key factors contributing to minor-damage incidents in AD. For example, Rules 1 and 4 indicate that rear-end collisions often result in minor injuries, particularly between 7 a.m. and 11 a.m., with streets being the most common accident locations. Rules 2, 3, and 5 further suggest that collisions with non-motorized vehicles on streets during daylight hours—especially in clear weather—are also likely to cause minor injuries.
Table 8 presents the association rule results for minor-damage accidents involving human-driven vehicles. Collision type, collision location, and vehicle type are key factors contributing to minor-damage accidents in human driving. Rules 1 through 4 indicate that minor injury accidents under human driving conditions are frequently associated with non-motorized vehicles and predominantly occur at intersections. Furthermore, Rule 5 highlights that angle collisions at intersections during daytime hours are also commonly linked to minor injuries.
3.
Association rules for major-damage crashes
For major-damage crashes, the total number of association rules obtained for AD and HD datasets was 27 and 13, respectively.
Table 9 presents the association rule results for major-damage accidents in AD. Collision type, lighting condition, collision location, and time are key factors contributing to major-damage accidents in AD. For example, Rule 1 suggests that angle collisions occurring on highways are often associated with major injuries, particularly during the afternoon hours. Rules 2 and 3 indicate that collisions involving non-motorized vehicles under cloudy weather conditions frequently result in major injuries, especially when they occur on streets. Rule 4 highlights that traffic circles represent high-risk locations for accidents. Rule 5 further reveals that side-swipe collisions during the midday period (11:00–14:00) are also commonly linked to major injuries.
Table 10 presents the association rule results for severe accidents involving human-driven vehicles. Collision type, time, and vehicle type are key factors influencing major accidents in human driving. Rules 1 and 4, which involve motor vehicles, indicate that rear-end collisions occurring at night are often associated with major injuries. Meanwhile, Rules 2, 3, and 5 suggest that nighttime collisions involving non-motorized vehicles also frequently result in major injuries.

4.5. Association Rule Analysis

To further explore the potential causal relationships among variables, this study employed a Bayesian network approach to construct a Directed Acyclic Graph (DAG). The DAG was learned from observational data using the Hill Climb Search algorithm in conjunction with the Bayesian Information Criterion (BIC) as the scoring method. In the resulting graph (Figure 7), directed edges represent conditional dependencies between variables, thereby providing insights into the possible directions of influence. This graph-based causal structure not only enhances the interpretability of the results but also lays the groundwork for future analysis based on structural causal models.

5. Discussion

5.1. Rear-End Collisions and System Optimization

Based on the analysis of association rules and classification by injury severity, it was found that rear-end collisions during daytime, whether involving AD or HD, are predominantly minor or non-injurious. Previous findings also pointed out that rear-end collisions are more likely to happen at intersections. Driverless vehicles have the best record in avoiding these types of collisions [32]. However, despite the generally low severity of such incidents in low-speed intersection scenarios, their potential safety risks and opportunities for system optimization warrant further attention. For AD systems, while current pre-collision assist technologies, such as Automatic Emergency Braking (AEB), have demonstrated effectiveness in mitigating collision severity, there remains significant room for improvement [33]. Existing algorithms may struggle to accurately differentiate between stationary vehicles, slow-moving traffic, and potential obstacles in complex traffic environments, leading to false activations or delayed responses. Future research should focus on refining autonomous perception systems to enhance target recognition accuracy and response efficiency at low speeds. Additionally, integrating vehicle-to-everything (V2X) communication can facilitate real-time data sharing between vehicles, thereby improving autonomous systems’ predictive capabilities in dynamic traffic conditions [6]. In multi-lane signalized intersections or roundabouts, the fusion of V2X-based intelligent signal control with AD strategies holds promise for further reducing the occurrence of low-speed rear-end collisions.
For HD, while most rear-end collisions at low-speed intersections result from driver inattention or misjudgment of following distance, studies suggest that advanced driver assistance systems (ADASs) can effectively mitigate such incidents [34]. For instance, distance monitoring and warning systems (DMWSs) provide alerts when a driver fails to maintain a safe following distance, while low-speed collision avoidance systems (LSCASs) can autonomously engage braking upon detecting potential crash risks. However, optimizing driver reliance on these systems, reducing false alarms, and refining human–machine interaction remain crucial to ensuring their adaptability and effectiveness in complex traffic environments. Road safety training for human drivers should emphasize low-speed intersection safety strategies, including enhancing sensitivity to traffic flow variations, optimizing braking control, and promoting the adoption of intelligent driver assistance warning systems in urban traffic settings. These measures aim to reduce minor collisions caused by driver distraction or delayed reactions. While low-speed rear-end collisions generally result in minor injuries, their high frequency and potential impact on overall traffic flow efficiency cannot be overlooked. Therefore, future traffic safety strategies should simultaneously enhance pre-collision capabilities in autonomous driving systems and improve human driver assistance technologies to foster a safer and more efficient urban transportation environment.

5.2. Collision Risks for Non-Motorized Road Users

Another critical finding is that collisions involving non-motorized road users—such as cyclists, electric scooter riders, and pedestrians—frequently result in either minor or severe injuries, regardless of driving mode. Notably, such incidents involving autonomous vehicles are more likely to occur during daytime hours, while those involving human drivers tend to be concentrated at night. High visibility often leads both autonomous vehicles and human drivers to adopt higher travel speeds. However, increased speed significantly amplifies the kinetic energy at the moment of impact, meaning that even in cases where the collision occurs over a short contact distance, non-motorized road users are still highly susceptible to severe injuries. During the day, drivers may develop a false sense of security, reducing their vigilance toward potential hazards and underestimating the likelihood of sudden appearances of non-motorized road users, particularly at intersections or mixed-traffic zones. Under these circumstances, drivers must make split-second decisions, but a decreased level of alertness can result in delayed reactions, preventing timely braking or evasive maneuvers, and thereby increase the severity of accidents. In contrast, nighttime conditions pose unique challenges for human drivers, including reduced visibility and increased fatigue, which may impair their ability to detect and respond to vulnerable road users promptly.
From the perspective of non-motorized road users, the absence of effective external protective structures means that the impact forces sustained in a collision are directly transferred to the human body, making them far more vulnerable to severe injuries compared to vehicle occupants. In many urban road designs, the lack of strict physical separation between motorized and non-motorized lanes allows for unpredictable movements of cyclists and pedestrians, which can disrupt drivers’ judgment and elevate collision risks. In high-traffic and high-speed environments, the unpredictability of non-motorized road users further complicates drivers’ decision-making processes, increasing the likelihood of accidents [35].
For AD systems, while they generally outperform human drivers in detecting non-motorized road users, they still face challenges in highly dynamic and complex environments [36,37]. This apparent advantage may be partially attributed to exposure bias. Many AD vehicles operate on restricted or pre-defined routes where interactions with pedestrians and cyclists are relatively limited, potentially reducing the likelihood of such conflicts being recorded. Therefore, although the data suggest improved performance in non-motorized traffic avoidance, challenges including decision-making delays and limited flexibility in real-time response strategies may compromise their ability to avoid potential risks.
The primary element leading to significant injuries among non-motorized road users during the day is the fundamental conflict between high-speed vehicular movement and the susceptibility of these users [38]. This challenge is intensified by diminished driver attentiveness and the intricate nature of the traffic landscape. To decrease both the occurrence and severity of these incidents, a dual strategy that includes improvements in infrastructure and advancements in technology is crucial. From an infrastructural standpoint, enhancing roadway design by strengthening the physical barriers between motorized and non-motorized traffic can decrease interaction points and lower the risk of accidents. On the technological front, autonomous driving systems need to be improved to better predict the movement behaviors of non-motorized road users, especially in fast-paced environments during clear weather. Furthermore, developments in perception algorithms should prioritize increasing the recognition precision of non-motorized entities in difficult lighting situations, such as glare and intense sunlight reflections.
For human drivers, raising awareness of road safety is crucial, particularly during nighttime, when collisions with non-motorized road users are more likely to occur. Reduced visibility, fatigue, and diminished vigilance contribute to the increased risk of such accidents after dark. To mitigate these risks, promoting the adoption of intelligent driver-assistance systems (ADASs)—such as pedestrian detection, distance warning, and low-speed collision avoidance—can significantly enhance a human driver’s ability to respond to dynamic environments, particularly in low-light conditions. These technologies serve as critical complements to driver attentiveness, ultimately reducing the likelihood and severity of collisions involving vulnerable road users.

5.3. Intersection Safety

According to association rules, intersections are identified as high-risk zones for angle collisions. Another study also indicates that autonomous vehicles often experience rear-end and angle collisions at intersections [32]. However, compared to human driver accidents, autonomous driving (AD) incidents occurring at intersections are more frequently observed during daytime under cloudy weather conditions, whereas intersection-related accidents involving human drivers tend to occur more often at night. This contrast may reflect the differing environmental perception capabilities and behavioral patterns of the two driving modes under varying lighting and weather conditions.
Accident data indicate that autonomous driving (AD) systems are more prone to intersection-related collisions during daytime under cloudy weather conditions. This suggests that even in the absence of low-light challenges, AD systems may still face difficulties in accurately detecting and responding to complex dynamic elements, such as pedestrians and non-motorized road users, under diffused lighting and variable visual conditions. These findings underscore the importance of enhancing the adaptability and robustness of AD perception algorithms in diverse daytime urban traffic scenarios.
AD systems rely on an array of sensors—including cameras, millimeter-wave radar, and LiDAR—to perceive their surroundings. While much attention has been given to their limitations under low-light conditions, findings from this study suggest that even during daytime with cloudy weather, AD systems may struggle to interpret complex intersection environments. Under such diffused lighting, camera performance can still be affected by reduced contrast and shadows, potentially hindering the accurate detection of small or partially occluded objects [39]. Given the high density and unpredictability of dynamic entities at intersections—such as pedestrians, cyclists, and vehicles—autonomous systems must not only detect but also accurately predict their movements, which remains a critical technical challenge.
Currently, most AD testing is conducted under standardized daytime conditions. The impact is often mitigated by the system’s tendency to decelerate or momentarily stop at intersections, reducing collision energy. Consequently, most accidents do not result in injuries. AD is generally equipped with pre-collision safety mechanisms, allowing them to engage emergency braking or adjust their trajectory upon detecting potential hazards, thereby minimizing accident severity. However, in highly dynamic intersection environments, such defensive maneuvers may inadvertently lead to low-speed contact with other vehicles, resulting in minor collisions.
The detection capabilities of LiDAR and infrared cameras under complex illumination conditions should be improved in AD systems [40]. Refining multi-sensor fusion algorithms will bolster their adaptability to dynamic environments. In addition, expanding the scope of testing and training data in complex nighttime traffic scenarios (particularly through real-world intersection interactions) will be crucial in improving the safety and reliability of autonomous vehicles.
Another noteworthy finding is that non-injury collisions predominantly occur between motor vehicles. However, unlike the accident patterns observed in autonomous driving, side-swipe, front-to-rear collisions, and non-injury crashes in human-driven scenarios are more prevalent during daylight hours. This phenomenon may be attributed to increased traffic volume, a higher cognitive load from road information, and driver distraction. In high-traffic environments, drivers must process a substantial amount of dynamic information, increasing the likelihood of decision-making errors due to information overload or fatigue [41].
In HD scenarios, some drivers may disregard traffic signals or right-of-way rules in an attempt to save time, particularly at intersections lacking clear signals or signage, thereby elevating the risk of side-swipe and front-to-rear collisions. Despite their frequency, daytime side-swipe and front-to-rear collisions are often mitigated by favorable visibility conditions, enabling drivers to detect potential hazards in advance and take preemptive braking or deceleration measures. This reduces both the impact velocity and severity of collisions, thereby minimizing harm to individuals. To enhance road safety in human-driven environments, it is imperative to improve drivers’ risk perception training, particularly in high-traffic intersections and dynamic traffic scenarios. Additionally, integrating intelligent driver assistance systems—such as collision warning and traffic signal recognition—can provide crucial decision-making support [10], thereby reducing the likelihood of side-swipe and front-to-rear collisions and fostering a safer road environment.

5.4. Limitations and Future Work

Although this study has uncovered valuable insights, several limitations remain to be addressed in future research. Firstly, the analysis relies solely on accident data from California, which may limit the generalizability of findings due to regional differences in traffic environments, infrastructure, and driver behavior. Secondly, this study did not incorporate hash-based optimization techniques, as our dataset size (approximately 80,000 records) allowed the algorithm to run efficiently within two seconds. Therefore, further optimization was not necessary at this stage. However, such techniques will be considered in future work involving significantly larger datasets where computational efficiency may become a critical concern.
Thirdly, the study does not account for traffic density variations, which are known to significantly influence accident probabilities. Due to the unavailability of fine-grained traffic density or vehicle exposure data in the current datasets, we were unable to construct a Traffic Density Index (TDI) or apply it as a covariate. Likewise, these data constraints limited our ability to implement a hierarchical Bayesian modeling approach, which could have incorporated both traffic exposure (e.g., miles traveled) and density information as informative priors. Future work will prioritize the integration of external traffic flow datasets (e.g., GPS or sensor-based traffic records) and explore Bayesian frameworks to more comprehensively assess accident risks under varying traffic conditions.
Lastly, this study does not differentiate between different levels of autonomous driving technologies (e.g., L2, L3, L4), which may vary significantly in terms of safety performance. Future research will aim to refine these distinctions and explore how technological maturity and operational domains affect accident patterns. Additionally, expanding the dataset to other states or countries, and including individual driver or vehicle-level data where available, may further enhance the robustness and applicability of the findings.
Future research will aim to broaden the data sources, employ diverse data analysis techniques, and consider the advancements in AD technology while incorporating an analysis of individual differences in human drivers to more comprehensively reveal the safety performance differences between autonomous and human-driven vehicles. This will provide more targeted and practical insights for future policy development and technological advancement.

6. Conclusions

This study based on road traffic accident data from California utilized association rule analysis to compare the risk factors of autonomous and human-driven vehicles in traffic accidents, revealing significant differences in terms of time, space, weather conditions, and collision types. The results indicate that AD exhibits a notable advantage in non-motorized vehicle detection and low-speed avoidance, particularly during nighttime, with related accidents (especially non-damaging accidents) occurring less frequently than in human-driven vehicles, demonstrating stronger perceptual accuracy and control capabilities. Moreover, the overall severity of injuries in AD accidents is significantly lower than in human driver accidents, suggesting that AD can effectively mitigate the severity of consequences in certain scenarios.
However, AD accidents tend to occur more frequently in complex dynamic environments, particularly at intersections with high interaction demands, where its perceptual capabilities and decision-making stability still show limitations. The technology’s adaptability to weather and dynamic conditions requires further optimization to enhance its performance in high-risk environments. Human driver accidents are strongly associated with front-to-rear collisions and accidents involving non-motorized vehicles. This suggested that driver distractions, fatigue, and risky behavior are major contributing factors to these accidents, with a significantly higher risk of injury or fatality compared to AD. While AD demonstrates superior safety in certain scenarios, its overall performance still depends on the design and constraints of the testing environment. In contrast, human driving offers greater flexibility in dynamic conditions but results in higher accident and injury rates due to the unpredictable behavior of drivers.
In conclusion, AD holds potential safety advantages over human driving, but it still faces technological limitations. Future research should focus on improving perception and decision-making systems, enhancing scene adaptation capabilities, and integrating these advancements with robust traffic management and legal frameworks to fulfill the promise of “safer” AD in real-world road environments.

Author Contributions

Conceptualization, L.L.; methodology, L.L.; software, S.Q.; validation, L.L. and S.Q.; formal analysis, S.Q.; investigation, L.L.; resources, L.L.; data curation, S.Q.; writing—original draft preparation, S.Q. and L.L.; writing—review and editing, S.Q. and L.L.; visualization, S.Q. and L.L.; supervision, L.L.; project administration, L.L.; funding acquisition, S.Q. All authors have read and agreed to the published version of the manuscript.

Funding

This research received no external funding.

Institutional Review Board Statement

Not applicable.

Informed Consent Statement

Not applicable.

Data Availability Statement

The data presented in this study are available on request from the corresponding author.

Conflicts of Interest

The authors declare no conflict of interest.

References

  1. World Health Organization. Global Status Report on Road Safety 2023: Summary; World Health Organization: Geneva, Switzerland, 2023; ISBN 9240086455. [Google Scholar]
  2. Soundarapandiyan, R.; Venkatachalam, D.; Selvaraj, A. Real-Time Data Analytics in Connected Vehicles: Enhancing Telematics Systems for Autonomous Driving and Intelligent Transportation Systems. Aust. J. Mach. Learn. Res. Appl. 2023, 3, 420–461. [Google Scholar]
  3. Zhang, Y.; Carballo, A.; Yang, H.; Takeda, K. Perception and Sensing for Autonomous Vehicles under Adverse Weather Conditions: A Survey. ISPRS J. Photogramm. Remote Sens. 2023, 196, 146–177. [Google Scholar] [CrossRef]
  4. Ji, Y.; Huang, Y.; Yang, M.; Leng, H.; Ren, L.; Liu, H.; Chen, Y. Physics-Informed Deep Learning for Virtual Rail Train Trajectory Following Control. Reliab. Eng. Syst. Saf. 2025, 261, 111092. [Google Scholar] [CrossRef]
  5. Sadaf, M.; Iqbal, Z.; Javed, A.R.; Saba, I.; Krichen, M.; Majeed, S.; Raza, A. Connected and Automated Vehicles: Infrastructure, Applications, Security, Critical Challenges, and Future Aspects. Technologies 2023, 11, 117. [Google Scholar] [CrossRef]
  6. Lu, Y.; Ma, H.; Smart, E.; Yu, H. Real-Time Performance-Focused Localization Techniques for Autonomous Vehicle: A Review. IEEE Trans. Intell. Transp. Syst. 2021, 23, 6082–6100. [Google Scholar] [CrossRef]
  7. Vargas, J.; Alsweiss, S.; Toker, O.; Razdan, R.; Santos, J. An Overview of Autonomous Vehicles Sensors and Their Vulnerability to Weather Conditions. Sensors 2021, 21, 5397. [Google Scholar] [CrossRef]
  8. Ji, Y.; Huang, Y.; Zeng, J.; Ren, L.; Chen, Y. A Physical-data-Driven Combined Strategy for Load Identification of Tire Type Rail Transit Vehicle. Reliab. Eng. Syst. Saf. 2025, 253, 110493. [Google Scholar] [CrossRef]
  9. Barabas, I.; Todoruţ, A.; Cordoş, N.; Molea, A. Current Challenges in Autonomous Driving. In Proceedings of the IOP Conference Series: Materials Science and Engineering; IOP Publishing: Bristol, UK, 2017; Volume 252, p. 012096. [Google Scholar]
  10. Neumann, T. Analysis of Advanced Driver-Assistance Systems for Safe and Comfortable Driving of Motor Vehicles. Sensors 2024, 24, 6223. [Google Scholar] [CrossRef]
  11. Petridou, E.; Moustaki, M. Human Factors in the Causation of Road Traffic Crashes. Eur. J. Epidemiol. 2000, 16, 819–826. [Google Scholar] [CrossRef]
  12. Young, K.; Regan, M.; Hammer, M. Driver Distraction: A Review of the Literature. Distracted Driv. 2007, 2007, 379–405. [Google Scholar]
  13. Kelly, E.; Darke, S.; Ross, J. A Review of Drug Use and Driving: Epidemiology, Impairment, Risk Factors and Risk Perceptions. Drug Alcohol Rev. 2004, 23, 319–344. [Google Scholar] [CrossRef] [PubMed]
  14. Smith, A.; Smith, H. Perceptions of Risk Factors for Road Traffic Accidents. Adv. Soc. Sci. Res. J. 2017, 4, 140–146. [Google Scholar] [CrossRef]
  15. Begum, S. Intelligent Driver Monitoring Systems Based on Physiological Sensor Signals: A Review. In Proceedings of the 16th International IEEE Conference on Intelligent Transportation Systems (ITSC 2013), The Hague, The Netherlands, 6–9 October 2013; pp. 282–289. [Google Scholar]
  16. Munla, N.; Khalil, M.; Shahin, A.; Mourad, A. Driver Stress Level Detection Using HRV Analysis. In Proceedings of the 2015 international conference on advances in biomedical engineering (ICABME), Beirut, Lebanon, 16–18 September 2015; pp. 61–64. [Google Scholar]
  17. Stanton, N.A.; Salmon, P.M. Human Error Taxonomies Applied to Driving: A Generic Driver Error Taxonomy and Its Implications for Intelligent Transport Systems. Saf. Sci. 2009, 47, 227–237. [Google Scholar] [CrossRef]
  18. Perumal, P.S.; Sujasree, M.; Chavhan, S.; Gupta, D.; Mukthineni, V.; Shimgekar, S.R.; Khanna, A.; Fortino, G. An Insight into Crash Avoidance and Overtaking Advice Systems for Autonomous Vehicles: A Review, Challenges and Solutions. Eng. Appl. Artif. Intell. 2021, 104, 104406. [Google Scholar] [CrossRef]
  19. Yeong, D.J.; Velasco-Hernandez, G.; Barry, J.; Walsh, J. Sensor and Sensor Fusion Technology in Autonomous Vehicles: A Review. Sensors 2021, 21, 2140. [Google Scholar] [CrossRef]
  20. Das, P. Risk Analysis of Autonomous Vehicle and Its Safety Impact on Mixed Traffic Stream; Rowan University: Glassboro, NJ, USA, 2018; ISBN 0355875748. [Google Scholar]
  21. Teoh, E.R.; Kidd, D.G. Rage against the Machine? Google’s Self-Driving Cars versus Human Drivers. J. Saf. Res. 2017, 63, 57–60. [Google Scholar] [CrossRef]
  22. Zhang, Z.; Liniger, A.; Dai, D.; Yu, F.; Van Gool, L. End-to-End Urban Driving by Imitating a Reinforcement Learning Coach. In Proceedings of the IEEE/CVF International Conference on Computer Vision, Montreal, BC, Canada, 11–17 October 2021; pp. 15222–15232. [Google Scholar]
  23. Martin, H.; Winkler, B.; Grubmüller, S.; Watzenig, D. Identification of Performance Limitations of Sensing Technologies for Automated Driving. In Proceedings of the 2019 IEEE International Conference on Connected Vehicles and Expo (ICCVE), Graz, Austria, 4–8 November 2019; pp. 1–6. [Google Scholar]
  24. Moradloo, N. The Role of Automated Vehicles in Enhancing Road Safety: A Comprehensive Evaluation of Operational Safety Challenges in Mixed-Traffic Environment. Ph.D. Thesis, University of Tennessee, Knoxville, TN, USA, 2024. Available online: https://trace.tennessee.edu/utk_graddiss/1137 (accessed on 16 April 2025).
  25. Favarò, F.M.; Nader, N.; Eurich, S.O.; Tripp, M.; Varadaraju, N. Examining Accident Reports Involving Autonomous Vehicles in California. PLoS ONE 2017, 12, e0184952. [Google Scholar] [CrossRef]
  26. Khattak, Z.H.; Fontaine, M.D.; Smith, B.L. Exploratory Investigation of Disengagements and Crashes in Autonomous Vehicles under Mixed Traffic: An Endogenous Switching Regime Framework. IEEE Trans. Intell. Transp. Syst. 2020, 22, 7485–7495. [Google Scholar] [CrossRef]
  27. Min, C.; Si, S.; Wang, X.; Xue, H.; Jiang, W.; Liu, Y.; Wang, J.; Zhu, Q.; Zhu, Q.; Luo, L. Autonomous Driving in Unstructured Environments: How Far Have We Come? arXiv 2024, arXiv:2410.07701. [Google Scholar]
  28. Liu, P.; Guo, Y.; Liu, P.; Ding, H.; Cao, J.; Zhou, J.; Feng, Z. What Can We Learn from the AV Crashes?—An Association Rule Analysis for Identifying the Contributing Risky Factors. Accid. Anal. Prev. 2024, 199, 107492. [Google Scholar] [CrossRef]
  29. ANSI D16.1–2007; Manual on Classification of Motor Vehicle Traffic Accidents. American National Standards Institute: Washington, DC, USA, 2007.
  30. Agrawal, R.; Mannila, H.; Srikant, R.; Toivonen, H.; Verkamo, A.I. Fast Discovery of Association Rules. Adv. Knowl. Discov. Data Min. 1996, 12, 307–328. [Google Scholar]
  31. Montella, A. Identifying Crash Contributory Factors at Urban Roundabouts and Using Association Rules to Explore Their Relationships to Different Crash Types. Accid. Anal. Prev. 2011, 43, 1451–1463. [Google Scholar] [CrossRef] [PubMed]
  32. Kohanpour, E.; Davoodi, S.R.; Shaaban, K. Analyzing Autonomous Vehicle Collision Types to Support Sustainable Transportation Systems: A Machine Learning and Association Rules Approach. Sustainability 2024, 16, 9893. [Google Scholar] [CrossRef]
  33. Kusano, K.D.; Gabler, H.C. Potential Effectiveness of Integrated Forward Collision Warning, Pre-Collision Brake Assist, and Automated Pre-Collision Braking Systems in Real-World, Rear-End Collisions. In Proceedings of the 22st International Technical Conference on the Enhanced Safety of Vehicles (ESV 2011), Washington, DC, USA, 13–16 June 2011. [Google Scholar]
  34. Cicchino, J.B. Effectiveness of Forward Collision Warning and Autonomous Emergency Braking Systems in Reducing Front-to-Rear Crash Rates. Accid. Anal. Prev. 2017, 99, 142–152. [Google Scholar] [CrossRef]
  35. Verret, R.M., Jr. The Influence of Selected Factors Impacting the Incidence and Severity of Accidents Involving Pedestrian/Bicyclists and Motorized Vehicles in Urban Areas of Louisiana; Louisiana State University and Agricultural & Mechanical College: Baton Rouge, LA, USA, 2019; ISBN 9798438709732. [Google Scholar]
  36. Berge, S.H.; de Winter, J.; Cleij, D.; Hagenzieker, M. Triangulating the Future: Developing Scenarios of Cyclist-Automated Vehicle Interactions from Literature, Expert Perspectives, and Survey Data. Transp. Res. Interdiscip. Perspect. 2024, 23, 100986. [Google Scholar] [CrossRef]
  37. Chao, Q.; Bi, H.; Li, W.; Mao, T.; Wang, Z.; Lin, M.C.; Deng, Z. A Survey on Visual Traffic Simulation: Models, Evaluations, and Applications in Autonomous Driving. In Proceedings of the Computer Graphics Forum; Wiley Online Library: Hoboken, NJ, USA, 2020; Volume 39, pp. 287–308. [Google Scholar]
  38. Nabors, D.; Goughnour, E.; Sawyer, M. Non-Motorized User Safety: A Manual for Local Rural Road Owners; Federal Highway Administration: Washington, DC, USA, 2012. [Google Scholar]
  39. Qu, Y.; Ou, Y.; Xiong, R. Low Illumination Enhancement for Object Detection in Self-Driving. In Proceedings of the 2019 IEEE International Conference on Robotics and Biomimetics (ROBIO), Dali, China, 6–8 December 2019; pp. 1738–1743. [Google Scholar]
  40. Saez-Perez, J.; Wang, Q.; Alcaraz-Calero, J.M.; Garcia-Rodriguez, J. Design, Implementation, and Empirical Validation of a Framework for Remote Car Driving Using a Commercial Mobile Network. Sensors 2023, 23, 1671. [Google Scholar] [CrossRef]
  41. Hu, X.; Lodewijks, G. Exploration of the Effects of Task-Related Fatigue on Eye-Motion Features and Its Value in Improving Driver Fatigue-Related Technology. Transp. Res. Part F Traffic. Psychol. Behav. 2021, 80, 150–171. [Google Scholar] [CrossRef]
Figure 1. The analytical framework.
Sustainability 17 04368 g001
Figure 2. (a) The elbow method applied to the AD dataset; (b) the elbow method applied to the HD dataset.
Sustainability 17 04368 g002
Figure 3. (a) Bimonthly comparison of traffic accidents; (b) monthly distribution of traffic accidents.
Sustainability 17 04368 g003
Figure 4. (a) Time distribution of accidents in autonomous driving; (b) time distribution of accidents in human driving.
Sustainability 17 04368 g004
Figure 5. Weather distribution of accidents in autonomous and human driving.
Sustainability 17 04368 g005
Figure 6. Crash type distribution of accidents in autonomous and human driving.
Sustainability 17 04368 g006
Figure 7. Directed Acyclic Graph of variables.
Sustainability 17 04368 g007
Table 1. Candidate contributing factors to AD crashes.
FactorVariableAbbreviationCategoryDefinitions
Vehicle
features
Vehicle type involvedVec_typeVEC1/VEC2/VEC3/VEC4Motor Vehicle/Non-Motorist/Animal/Object
Traffic conditions Month of yearMonthMON1/MON2/MON3/MON4/MON5/MON6January, February/March, April/May, June/July, August/September, October/November, December
Weather conditionWeatherWEA1/WEA2/WEA3/WEA4Clear/Cloudy/Raining or Snowing/Foggy or Smoky
Time of dayTimeTIM1/TIM2/TIM3/TIM407:00–11:00/11:00–14:00/14:00–18:00/18:00–07:00
Lighting conditionsLight_conCON1/CON2/CON3/CON4Daylight/Dawn or Dusk/Dark—Lighted/Dark—Not Lighted
Crash featureType of crashCrash_typeTYP1/TYP2/TYP3/TYP4/TYP5/TYP6/TYP7Angle/Front to Front/Front to Rear/Non-motor Vehicle/Rear to Side/Side Swipe/Rear to Rear
Vehicle damageDamageNONE/MINOR/MAJORNo damage/Minor damage/Major damage
Location of crashLocationLOC1/LOC2/LOC3/LOC4/LOC5Highway/Intersection/Parking Lot/Street/Traffic Circle
Table 2. Comparison of Apriori and FP-Growth.
SupportConfidenceExecution Time per Second
FP-GrowthApriori
AD DatasetHD DatasetAD DatasetHD Dataset
0.010.64.82314.14791.79941.6973
0.010.654.80354.23731.63891.7725
0.010.74.88174.23631.58711.7313
0.0250.64.43293.33790.82670.6812
0.0250.654.38483.31150.9240.6975
0.0250.74.45693.35570.82920.6819
0.050.63.82212.61750.36170.3176
0.050.653.77842.6810.36590.2715
0.050.73.72412.59950.35910.2652
0.0750.63.16362.09430.19910.1549
0.0750.653.24432.21410.180.1452
0.0750.73.34342.10340.1860.1455
0.10.62.80761.72710.08030.0773
0.10.652.75751.73760.09040.0788
0.10.72.77041.77720.07840.08
Table 3. List of the best 15 association rules for autonomous driving crashes.
No.AntecedentConsequentSupportConfidenceLift
1Time = 14:00–18:00, Crash_type = Non-motor VehicleVec_type = Non-Motorist0.0510.9069.504
2Vec_type = Non-Motorist, Location = StreetCrash_type = Non-motor Vehicle0.0661.0006.769
3Vec_type = Non-Motorist, Weather = Clear, Location = StreetCrash_type = Non-motor Vehicle0.0591.0006.769
4Time = 14:00–18:00, Vec_type = Non-MotoristCrash_type = Non-motor Vehicle0.0511.0006.769
5Vec_type = Non-Motorist, Weather = ClearCrash_type = Non-motor Vehicle0.0881.0006.769
6Vec_type = Non-MotoristCrash_type = Non-motor Vehicle0.0951.0006.769
7Vec_type = Non-Motorist, Light_con = DaylightCrash_type = Non-motor Vehicle0.0731.0006.769
8Location = Street, Vec_type = Non-Motorist, Light_con = DaylightCrash_type = Non-motor Vehicle0.0551.0006.769
9Vec_type = Non-Motorist, Weather = Clear, Light_con = DaylightCrash_type = Non-motor Vehicle0.0661.0006.769
10Time = 18:00–07:00Light_con = Dark—Lighted0.2700.8482.999
11Light_con = Dark—LightedTime = 18:00–07:000.2700.9542.999
12Time = 11:00–14:00Light_con = Daylight0.1901.0001.500
13Weather = Cloudy, Location = IntersectionLight_con = Daylight0.0531.0001.500
14Time = 14:00–18:00, Location = StreetLight_con = Daylight0.1001.0001.500
15Time = 07:00–11:00, Location = IntersectionLight_con = Daylight0.0740.9741.462
Table 4. List of the best 15 association rules for human driving crashes.
No.AntecedentConsequentSupportConfidenceLift
1Vec_type = Non-Motorist, Light_con = DaylightCrash_type = Non-motor Vehicle0.0581.0003.274
2Vec_type = Non-Motorist, Weather = ClearCrash_type = Non-motor Vehicle0.0771.0003.274
3Vec_type = Non-MotoristCrash_type = Non-motor Vehicle0.0961.0003.274
4Vec_type = ObjectCrash_type = Non-motor Vehicle0.1691.0003.274
5Vec_type = Non-Motorist, Location = IntersectionCrash_type = Non-motor Vehicle0.0521.0003.274
6Crash_type = Non-motor Vehicle, Light_con = Dark—LightedTime = 18:00–07:000.0640.9422.679
7Weather = Clear, Light_con = Dark—LightedTime = 18:00–07:000.1260.9232.624
8Light_con = Dark—Lighted, Location = IntersectionTime = 18:00–07:000.0760.9162.604
9Light_con = Dark—LightedTime = 18:00–07:000.1640.9132.597
10Location = Intersection, Light_con = Dark—Lighted, Vec_type = Motor VehicleTime = 18:00–07:000.0570.9102.588
11Light_con = Dark—Not LightedTime = 18:00–07:000.0880.9062.577
12Light_con = Dark—Lighted, Vec_type = Motor VehicleTime = 18:00–07:000.1000.8962.547
13Damage = No damage, Light_con = Dark—LightedTime = 18:00–07:000.0660.8902.532
14Crash_type = AngleLocation = Intersection0.1820.7451.713
15Crash_type = Side SwipeDamage = No damage0.0910.7341.520
Table 5. List of the best 10 association rules containing an antecedent for no damage in autonomous driving.
No.AntecedentConsequentSupportConfidenceLift
1Crash_type = Angle, Light_con = Dark—LightedDamage = No damage0.0781.0001.237
2Crash_type = Angle, Location = StreetDamage = No damage0.0831.0001.237
3Crash_type = Angle, Time = 18:00–07:00Damage = No damage0.0861.0001.237
4Crash_type = Angle, Time = 07:00–11:00Damage = No damage0.0651.0001.237
5Vec_type = Motor Vehicle, Weather = CloudyDamage = No damage0.0611.0001.236
6Location = Intersection, Weather = CloudyDamage = No damage0.0531.0001.236
7Time = 14:00–18:00, Weather = CloudyDamage = No damage0.0531.0001.236
8Location = Street, Time = 14:00–18:00Damage = No damage0.0960.9631.191
9Light_con = Dark—Lighted, Location = Street, Vec_type = Motor VehicleDamage = No damage0.0750.9341.155
10Crash_type = AngleDamage = No damage0.2550.9331.154
Table 6. List of the best 10 association rules containing an antecedent for no damage in human driving.
No.AntecedentConsequentSupportConfidenceLift
1Crash_type = Side SwipeDamage = No damage0.0910.7341.520
2Crash_type = Front to RearDamage = No damage0.1580.5701.179
3Weather = Raining or SnowingDamage = No damage0.0510.5441.126
4Vec_type = Motor VehicleDamage = No damage0.3710.5341.106
5Location = HighwayDamage = No damage0.0480.5341.104
6Time = 07:00–11:00Damage = No damage0.0900.5181.072
7Time = 14:00–18:00Damage = No damage0.1540.5071.050
8Time = 11:00–14:00Damage = No damage0.0830.5061.047
9Weather = CloudyDamage = No damage0.0640.5031.040
10Light_con = DaylightDamage = No damage0.3360.5011.037
Table 7. List of the best 5 association rules containing antecedents for minor damage in autonomous driving.
No.AntecedentConsequentSupportConfidenceLift
1Crash_type = Front to Rear, Time = 07:00–11:00Damage = Minor damage0.0310.5034.993
2Light_con = Daylight, Location = Street, Vec_type = Non-Motorist, Weather = ClearDamage = Minor damage0.0200.4274.239
3Light_con = Daylight, Location = Street, Vec_type = Non-MotoristDamage = Minor damage0.0200.3713.683
4Crash_type = Front to Rear, Location = StreetDamage = Minor damage0.0300.3083.056
5Location = Street, Vec_type = Non-MotoristDamage = Minor damage0.0200.3073.051
Table 8. List of the best 5 association rules containing antecedents for minor damage in human driving.
No.AntecedentConsequentSupportConfidenceLift
1Vec_type = Non-MotoristDamage = Minor damage0.0410.4252.641
2Crash_type = Non-motor Vehicle, Location = IntersectionDamage = Minor damage0.0260.3502.176
3Crash_type = Non-motor VehicleDamage = Minor damage0.0670.2181.355
4Location = Intersection, Time = 18:00–07:00Damage = Minor damage0.0270.2021.253
5Crash_type = Angle, Light_con = Daylight, Location = IntersectionDamage = Minor damage0.0270.2011.247
Table 9. List of the best 5 association rules containing antecedents for major damage in autonomous driving.
No.AntecedentConsequentSupportConfidenceLift
1Crash_type = Angle, Light_con = Daylight, Location = Highway, Time = 14:00–18:00Damage = Major damage0.0071.00033.646
2Crash_type = Non-motor Vehicle, Location = Street, Weather = CloudyDamage = Major damage0.0071.00033.646
3Vec_type = Non-Motorist, Weather = CloudyDamage = Major damage0.0071.00033.646
4Location = Traffic CircleDamage = Major damage0.0080.99833.593
5Crash_type = Side Swipe, Time = 11:00–14:00Damage = Major damage0.0070.99733.537
Table 10. List of the best 5 association rules containing antecedents for major damage in human driving.
No.AntecedentConsequentSupportConfidenceLift
1Crash_type = Front to Front, Time = 18:00–07:00Damage = Major damage0.0060.3592.984
2Time = 18:00–07:00, Vec_type = Non-MotoristDamage = Major damage0.0130.3242.693
3Light_con = Dark—Lighted, Vec_type = Non-MotoristDamage = Major damage0.0080.3172.637
4Crash_type = Front to FrontDamage = Major damage0.0120.2962.459
5Crash_type = Non-motor Vehicle, Light_con = Dark—LightedDamage = Major damage0.0160.2401.997
Disclaimer/Publisher’s Note: The statements, opinions and data contained in all publications are solely those of the individual author(s) and contributor(s) and not of MDPI and/or the editor(s). MDPI and/or the editor(s) disclaim responsibility for any injury to people or property resulting from any ideas, methods, instructions or products referred to in the content.

