Abstract
One of the main reasons for migration is the search for a better quality of life. The concept of quality of life is very broad, encompassing economic, social, political, and cultural factors. According to the World Migration Report 2022, 3.6 percent of the world’s population are migrants. This number is growing due to geopolitical reasons. Increasing migration flows affect the growth of the part of the population living in urban areas, that is, urbanisation. The scale of migration is growing along with the search for a better life. In Lithuania, according to the Department of Statistics, as well as throughout the world, the number of people living in cities is constantly growing; for comparison, a 3% growth has been observed over 4 years, in the European Union, according to the World Bank, 1%, and in the world—1%. The term urbanisation also describes social changes that are determined by the concentration of the population. To ensure quality of life, cities face challenges such as ensuring security, integration of migrants into society and the labour market, the functioning of the health and education system, and sustainable development of cities. Despite growing interest, the impact of migrant flows on the quality of life in cities has not been sufficiently studied in the world scientific literature. Most research is focused on the causes of migration, migrant integration, demographic changes, or labour market interactions. However, less attention is paid to how the dynamics of migrant flows affect the quality of life in cities. Comprehensive assessment is lacking. The goal is to assess the link between quality of life and the dynamics of migration flows in urbanised areas. The article, which conducted a systematic and comparative analysis of concepts published in the scientific literature, formed the concept of quality of life in urban areas, identified the factors that determine quality of life, and studied the link between the quality of life in the city and the dynamics of migration flows. This assessment will allow us to combine the factors that determine quality of life in terms of changes in migrant flows into a common system. To achieve this goal, statistical processing, correlation analysis, and CRITIC methods will be applied.
1. Introduction
The quality of life in a city is inseparable from the concept of a sustainable and competitive city, but increasing migration flows affect urbanisation. Migration can provide a positive impetus by stabilising the labour market, promoting innovation, and strengthening international relations, but at the same time, it can pose challenges such as the burden on the social service system, the growth of the shadow economy, or the immigration of working-age people from countries of origin, i.e., competition in the labour market. So, the question arises: how do we maintain and, at the same time, improve the quality of life in cities with increasing migration flows? Migration is not a new phenomenon. Migration, especially economic migration, has a history of more than three centuries. Nations and individuals migrated from one residential area to another since ancient times in search of better geopolitical conditions. This process had a significant impact on the history of mankind, the formation of nations, and the settlement of lands [1]. Due to the development of industry, the improvement of living conditions, and the growth of the economy, migration has become a frequent and intense phenomenon in the 21st century. However, it is important to mention that in modern society, the long-term migration is not a common factor, as it consists of different aspects—it begins with the formation of migration attitudes and potential and ends with the integration of immigrants in destination countries [2]. Modern migration is a dynamic factor that includes different moral and social factors. Some of the factors most commonly studied that determine migration factors are economic, sociodemographic, political security, and cultural [3].
For many years, the majority of immigrants (on average about 82%) were returning Lithuanians. The rest were EU citizens (3%) and non-EU citizens (15%). Since 2017, this trend has begun to change. In 2023, the share of returning Lithuanians amounted to 25%, the share of EU citizens decreased to 1%, and the share of non-EU citizens amounted to as much as 74%. The highest number of foreigners came from Ukraine and Belarus (approximately 40% of all immigrants) [4].
Many studies have been conducted in scientific sources on the impact of migrant flows: the impact of international student migration on economic growth was assessed [5], as well as the causes, trends, and consequences of migration [6], immigrant integration [7], emigration and reemigration [8], emigration processes [9,10,11], labour migration processes in Lithuania [12], and the integration of migrants into the country’s social environment [13]. However, despite growing interest, the impact of migrant flows on the quality of life in cities has not been sufficiently studied in the scientific literature. The questions arise: How do we comprehensively assess the impact of migrant flows on the quality of life in cities? What factors determine the quality of life in urban areas? Do and how do the dynamics of migration flows affect the quality of life in cities? How do cities address the challenges of ensuring quality of life?
The following hypotheses are made:
H1:
The dynamics of migration flows has a significant impact on changes in quality of life in urban areas.
H2:
There is a positive correlation between the factors that determine quality of life and migration flows.
H3:
Migration flows do not have a significant impact on the weights of the groups of factors that affect the quality of life in the city.
The planned assessment will allow one to combine the factors that determine the quality of life in urban areas into a general system, to assess changes in the quality of life in urban areas in terms of the dynamics of migrant flows, and to compare Lithuanian cities with each other.
2. Review of the Literature
The concept of quality of life is broad and has been defined in different ways. Some authors compare the concept of quality of life with satisfaction and self-realisation [14,15], associate it with a vibrant and competitive economy, a healthy environment, social well-being, and the ecology [16], and well-being of life is associated with health and the health system in the country [17]. Scientists distinguish areas of quality of life: travel, leisure, work, social relations, housing well-being, emotional reactions, and health [18], a concept that is evaluated in many dimensions (objective and subjective), covers all aspects of human life, and is based not only on a broad perspective of health, such as physical, psychological, and social functioning, but also on a person’s material and social well-being [19]. Scientists use the concepts of quality of life and well-being of life as synonyms in their research [20], although Starkauskienė emphasizes in her study that the concept of quality of life is used in a broad sense and includes macro- and micro-level factors. Additionally, the concepts of well-being, as well as satisfaction with life, are perceived in work as components of quality of life, for which objective and subjective micro-level indicators can be applied, respectively, to assess them [19]. Quality of life is associated with ecology and green spaces [21]. Much scientific research has been carried out to compare the quality of life between urban and rural areas [22,23,24,25,26]. The concept of quality of life has been examined in both the context of socioeconomic development of a city, region, or country and in the context of sustainable development and competitiveness. Such a wide range of use of the concept is determined by the fact that this concept is multi-criteria, and its assessment is possible by both quantitative and qualitative methods. Furthermore, the use of this concept is possible at different levels: in the context of an individual, a community, and a city, a region, or a country. Considering that this concept is closely related to the personal characteristics of each evaluator, his knowledge, competence, experience, and psychological mechanism that define the level of satisfaction with both external and internal conditions, it is difficult to provide a generally accepted definition of quality of life in a city. Such assessments on a scale ranging from ‘very unhappy’ to ‘very satisfied’ are based on a more subjective principle. A more objective concept of quality of life can be reflected in various economic and social indicators, which are usually obtained from statistical databases. However, the subjectivity factor is reflected in the selection of a set of these indicators. Thus, according to Janušauskaitė (2008), each person and (or) society can define the quality of life in their own way, taking into account their own quality of life formula, which will be individual and will include only the components or criteria of quality of life that are characteristic of them [27]. The World Health Organisation defines quality of life as an individual’s perception of their place in life, based on the culture and value system of their living environment, and linking this perception with personal goals, expectations, values, and things related to physical health, psychological state, level of independence, social relations, faith, and relationship with the environment [28]. EC (2013), when evaluating 79 European cities, treated quality of life as satisfaction of residents, which is determined by the infrastructure and services, convenience, environmental quality, and the personal situation of the citizen (financial, social, and employment) [29]. The multifaceted nature of the concept of quality of life led to the fact that the scientific literature provides not only different definitions, but also indicators to assess quality of life. Although scientists from different developed countries provide different indicators [20,30,31,32,33], the areas of research that are usually distinguished are the same: economic (e.g., the level of income of the population, entrepreneurship, economic activity, etc. are examined) [34,35,36] and social (e.g., the education and health system and satisfaction with them, personal health status, social satisfaction, etc., are examined) [16,37]. Scientists often combine economic and social fields in their research to present socioeconomic fields [31,38,39]. Political (for example, freedom of speech and decisions, government satisfaction, etc., are examined) [40,41], environmental (for example, pollution, development of physical infrastructure (most often transportation), etc. are examined) [16,42,43], cultural (for example, recreation and leisure priorities, ways of self-expression, values, etc., are examined) [44,45,46], and psychological climate [47,48] are examined. Thus, we take into account the fact that the scientific literature contains various concepts of quality of life and almost all areas that determine the sustainable competitiveness of a city, region, or country (see Table 1).
In the scientific literature, a sustainable city is defined as improving the quality of life of a city, including ecological, cultural, political, institutional, social, and economic components, without leaving a burden on future generations [34,49]. It is defined as the sum of economic, social, environmental, and institutional competitiveness [34]. Therefore, the quality of life in a city is inseparable from the concept of a sustainable city.
The most commonly used methods to assess quality of life are the following: public opinion surveys (Eurobarometer [50]), index systems, comprehensive fuzzy assessment, factor analysis method, analytical hierarchy process (AHP), factor analysis method, and other methods [26,51,52]. Many indices include economic, social, and environmental factors [26,53].

Table 1.
Factors determining the quality of life in the city.
Table 1.
Factors determining the quality of life in the city.
| Group | Factors |
| City infrastructure | Transport infrastructure Information technology and telecommunications infrastructure Urban waste sorting and disposal infrastructure Wastewater treatment system Social, cultural, and sports infrastructure Medical care infrastructure Science and study infrastructure Convenience of living in the city (housing, recreation, health care opportunities, and transportation) Tourist attraction of the city |
| Economical | Competitiveness of companies The attractiveness of the city’s investment activities Adaptation of the labour market to changing conditions Openness of the city economy Economic power of the city Wages Unemployment |
| Social | Human capital (qualifications and competencies) Population migration Urban demographics Population growth Life expectancy Gender equality Infant mortality Education and the educational system Poverty Community Crime |
| Environmental protection | Environmental pollution Green spaces |
| Political | Urban strategy, management efficiency, and interinstitutional relations between urban organisations Level of social burden on the city |
Source: table compiled by the author, based on Meidutė-Kavaliauskienė, I.; Činčikaitė, R. Integration of migrants into the country’s social environment: the case of Lithuania [54], Činčikaitė, R. The measurement of urban competitiveness in a complex way on the perspective of sustainable development [34]
The dynamics of migration flows are determined by the following reasons: social, economic, ethnic discrimination, political, racial discrimination, cultural, religion, and belief [54]. Studies have shown that in developed countries, immigration flows are twice as high as in middle or lower developed countries, where the latter face almost the highest emigration flows [55,56]. High rates of poverty and unemployment, low wages, and unbearable tax burdens can be considered motivating factors that determine the choice to seek a better life abroad [57]. High living costs, unfavourable living conditions, increased inflation, and high housing costs directly and strongly affect various forms of migration [58,59]. When wages in a country increased by 10%, the emigration of local residents decreased by 10.1% [60]. Studies confirmed that higher unemployment rates are associated with slightly higher migration flows [61]. A foreign scientific study conducted in the Croatian region (2018) indicated that when employment opportunities abroad increase by a percentage point, immigration flows increase accordingly and exceed the 8% threshold [62]. A scientific study conducted in Greece found that fiscal austerity in the country, that is, reducing public spending and increasing taxes in order to reduce the growth of public debt, respectively, leads to an increase in emigration rates of more than 12% [63].
The European Union and third countries use three main migration management models: readmission agreement, aid and foreign policy, and offshore settlement. The readmission agreement states that a migrant who illegally entered, is present in, or resides in another country will be sent/returned to the country from which he or she came in accordance with the laws of the country. Of course, this management model had little success, since in 2016, 46% of migrants who entered Europe illegally did not return to their countries of origin after being ordered to leave. Aid and foreign policy are less aggressive and help control migration by improving living conditions in the countries themselves. In order to reduce migrant flows, the European Union allocates funding, controls authorities to allow humanitarian organisations to enter the centres they control, encourages countries to sign the UN Refugee Convention, and improves the country’s economy and internal government factors. Maritime processing regulates migration flows by establishing asylum processing centres near the oceans. These centres process asylum applications from migrants arriving from other countries. If these applications are approved, migrants are transferred to the country in which they arrived; if not, they are returned to the countries they came from. However, the conditions in these camps are poor, detainees are often subjected to abuse and violence, and many suffer from poor mental health [64].
The development of a common migration policy in the European Union (EU) is linked to broader social, political, and professional processes that reflect a declining society. The better-off countries of western Europe face a number of challenges that affect their social integration mechanisms and political legitimacy. These include economic and financial globalisation, increased poverty, deterioration of living conditions in cities, the resurgence of racist and xenophobic parties and movements, voter alienation and political class, and the strengthening of multiculturalism. In such circumstances, migration is increasingly presented as a threat to public order, cultural identity, and the stability of the internal and labour market [65]. One of the most important negative examples is the so-called ‘brain drain’, where educated, highly qualified and educated workers are lost due to the free possibility of migration between countries of the European Union, resulting in the state losing demographic balance, a stable economic situation, and the results of investments in education and employee growth [66].
3. Methodology
Based on theoretical analysis, factors determining the quality of life in cities were identified (see Table 1), and comparative analysis, correlation-regression analysis, and in the third stage, the CRITIC method, were performed to determine the weight coefficients of the factors. These methods were chosen to achieve an objective, data-based criteria assessment and analysis of interrelationships, which avoids subjectivity and loss of information (as, for example, when applying methods such as PCA or AHP).
However, the first step is to perform a correlation analysis. The sample correlation coefficient indicates the strength of the linear relationship between two observed variables. In other words, it is a method that allows one to determine whether there is a relationship between the factors considered, which are expressed in quantitative indicators [67].
In the correlation coefficient formula:
Here:
- r—correlation coefficient;
- n—number of measured values;
- —selected sample value X;
- —selected sample value X;
- —sample mean X;
- —Y sample mean;
- —product of the mean square deviations of samples X and Y.
The correlations vary in shape, direction, and strength. The correlation answers the question of whether there is a linear relationship between variables, but does not explain why that relationship exists [68].
The criteria importance through intercriteria correlation (CRITIC) method [69] is a correlation method. Standard deviations of the ranked criterion values of the options in the columns, as well as the correlation coefficients of all paired columns, are used to determine the contrasts of the criteria [70].
Step 1:
Normalisation of the matrix elements is performed by applying (2) and (3):
- for the maximisation criterion:for the minimisation criterion:where = ; = .
After normalising the criteria of the initial decision matrix, all elements are reduced to interval values [0, 1], therefore, it can be stated that all criteria have the same indices.
Step 2: For criterion C_j (j = 1, 2, …, n), we define the standard deviation , which represents an alternative measure of the deviation of values when the criterion is the average value.
Step 3: From the normalised matrix we extract the vector = which contains the values of the alternatives = for the given criterion = .
The amount of data in criterion j, , is determined by combining the previously listed measures and as follows:
On the basis of the previous analysis, it can be concluded that a higher value of indicates a greater amount of data obtained from a given criterion, which in turn increases the relative importance of a given criterion for a specific decision-making process.
Step 4: The weights of the objective criterion are achieved by normalising the measures :
The authors of Diakoulaki and Deng recommend determining the weights of the criteria according to the values of the standard deviation of the vector, the expression (6) [71]
where represents the standard deviation defined in step 2.
4. Research
The website http://lietuvosfinansai.lt (accessed on 1 February 2025), managed by the Ministry of Finance, presents the quality of life index (QLI) of municipalities. The index consists of 40 indicators in six areas: material living conditions; entrepreneurship and business competitiveness of the population; health services; educational services; demography, civic, and social activity; and public infrastructure, quality of living environment, and safety. Using QLI (quality of life index) one can see the overall assessment of each municipality, individual areas, and indicators, compare municipalities with each other, or monitor changes in 2013–2022 [55].
According to the QLI of the municipalities in 2022, the Vilnius city municipality was the first, with an index of 1.0014 when the national average was 0.58. The municipality of Kaunas City remained in second place (0.797), Klaipėda city (0.779), the district of Kaunas (0.779), and the district of Kaunas (0.797); (0.774) (Klaipėda city and Kaunas district swapped places). When evaluating municipalities by individual areas, the best material living conditions in 2022 were as follows: first place—Vilnius city (0.375), second place—Kaunas district (0.35), and third place—Kaunas city (0.339); according to the values of the sub-index of entrepreneurship and business competitiveness of the population, the first place has been steadily occupied by the Vilnius city (0.3) municipality since 2013, followed by Mažeikiai district (0.216), and Klaipėda city (0.172); according to the values of the subindex of health services, Palanga city (0.093) municipality is the leader for the second year in a row, followed by Šiauliai city (0.074), and Kaunas city (0.074); according to the values of the sub-index of education services, Kaunas city (0.0638) takes the first place, and the following in 2021. The municipality of Pakruojis district (0.0627), which took the eleventh place in this area, is in third place—Marijampolė (0.0608), which has risen from the seventh position; according to the values of the demography, civic, and social activity subindex, the municipalities are ranked as follows: Neringa municipality, which maintains its leading position for the second year in a row (0.1367), Kaunas district (0.1197), and Vilnius district (0.117). According to the values of the public infrastructure, quality of living environment, and safety sub-index, Neringa municipality (0.1328) has been leading since 2014, with Birštonas in second place (0.1285), and Druskininkai in third place (0.101) [72].
In 2023, 63.9 percent of emigrants were between the ages of 15 and 44 years. Among the Lithuanian population, people of this age made up 36.1% [4]. Since the restoration of Lithuania’s independence, the population in the country decreased by almost 808 thousand. This is about 22% of the population in 1990. Due to natural population changes (births/deaths), the population decreased by 275 thousand and due to emigration by 484 thousand [4]. Figure 1 shows the change in migration flows in Lithuanian municipalities.
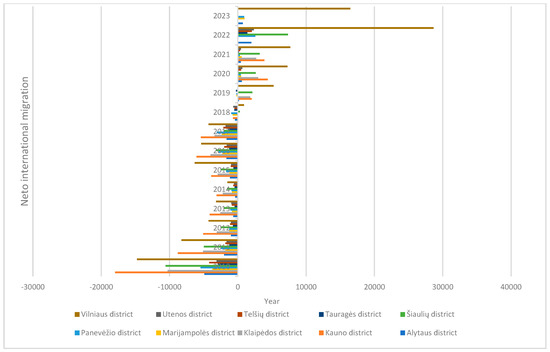
Figure 1.
Neto international migration by district, 2010–2023.
According to the data in Figure 1, the largest migration flows are observed in Vilnius and Kaunas municipalities. According to statistical data, between 2004 and 2016, on average, about 80% of the immigration flow was made up of Lithuanians returning from abroad and 20% of foreigners. In 2017–2022, this trend changed; in the aforementioned period, 50% of the immigration flow was made up of Lithuanians returning from abroad and 50% of foreigners, and from 2023, Lithuanians returning from abroad accounted for 25% and foreigners, 75% of all immigrants.
To determine the relationship between Y, the number of NET migrations, and indicators of quality of life in the city (see Table 2), a correlation analysis is performed (the Pearson correlation coefficient is calculated and statistical significance is checked).
Table 2.
Indicators of the quality of life in the city.
It should be noted that although the study did not identify missing data, some quality of life factors were described by limited or indirect indicators. This may affect the interpretation of the results, as the complexity of some phenomena is not fully reflected in the selected quantitative data. Due to these limitations, it can be argued that some aspects of quality of life were not fully operationalised, which may lead to a relative underestimate of the significance of some factors or an inadequate awareness of their relationship with the net migration indicator.
A correlation analysis (see Table 3) showed that there is no linear relationship in cities between net migration and the following indicators: air quality indicator (particle matter PM10 (µg/m3)), school-age children who do not attend school for social, psychological, or other reasons, per 1000 of the permanent school-age population and green space area per capita (m2/capita) (see Table 3). Linear correlation analysis (calculating the Pearson correlation coefficient) measures only linear dependence, i.e., if the relationship between variables is nonlinear, the correlation coefficient will be close to zero, even though the dependence actually exists.
Table 3.
Relationships between net migration and quality of life indicators.
Based on the data in Table 3, it was observed that not all indicators have the same relationship with the net migration rate in different cities. For example, an indicator such as the number of accidents in road traffic per 1000 inhabitants has a strong inverse relationship with the net migration rate only in the cities of Kaunas and Šiauliai. The economic indicator share of the employed population among the working-age population has a strong relationship only in Panevežys. From the results of the correlation analysis, it was observed that it is not possible to state the relationship of one indicator or another with the net migration rate; it is necessary to analyse the situation of each city separately because cities have differences between themselves, both social and economic.
Indirect connections, such as “improved roads” or “museums”, that may be indirectly related to migration and influence through other indicators, such as economy and security, also remain difficult to assess. Unfortunately, as the study also showed, a well-developed road network in a city, if there is no work, will not necessarily attract a flow of migrants. It turned out that factors such as greater use of transport do not have a linear relationship with net migration, it can be assumed that in smaller towns, residents travel to work or educational institutions by their own car or on foot, and from large cities, they move to surrounding areas due to the expensive price of real estate. The number of museums and the number of overnight stays in a city is not a reason to come for permanent residence, but rather a reason to attract a flow of tourists. Employment level is one of the reasons for coming to live, but it should be mentioned here that if we are talking about economic migrants, they choose a place to live based on the salary and not on the employment level, because employment does not reflect the average salary in that city. Often, highly qualified teachers work in institutions in different cities (especially in small Lithuanian towns). Therefore, their influence is also not direct. A higher number of accidents does not necessarily deter migrants—this may be a consequence of the intensity of the city, and not the cause of migration.
The negative correlation between net migration and the number of students in vocational training institutions per 1000 population can be based on the assumption that smaller Lithuanian cities have vocational schools, but not universities, and often after graduating, people leave for a big city or abroad. Another reason may be that with increasing migration from the region, there are fewer young people who are offered higher education, and in this case, a larger portion goes to vocational schools. This indicator, the number of inpatients per 1000 people, often indicates a city with an elderly population, often with health problems, known as a ‘disappearing’ city. It can be assumed that young people leave and the number of city residents is ageing. It is also necessary to assess that as the total population decreases, the number of patients can increase this indicator.
Factors such as turnover of companies, unemployment ratio, value added, and average wage, have a strong positive linear correlation with net migration because they directly reflect the economic viability of the city and the potential for quality of life, and this is what attracts migrants or stops the departure of residents. The higher the turnover, the greater the economic opportunities, which becomes a reason for immigration. People tend to go where there are more job opportunities and less competition, so the lower the unemployment rate, the greater the chance of getting a job, and this is another reason for immigration. Migration is more often to cities that create high added value because the quality of life is higher there. Higher average wages in the city are another strong reason for immigration.
However, it is important to emphasise that people do not make migration decisions solely on the basis of every small improvement or deterioration in quality of life. They often react only when quality of life reaches a certain critical threshold, and the decision is not determined by a single indicator, but by a complex. Therefore, it is necessary to evaluate it comprehensively.
The critic method was applied to determine which of the groups of factors that affect the quality of life in the city has the greatest weight (see Figure 2).
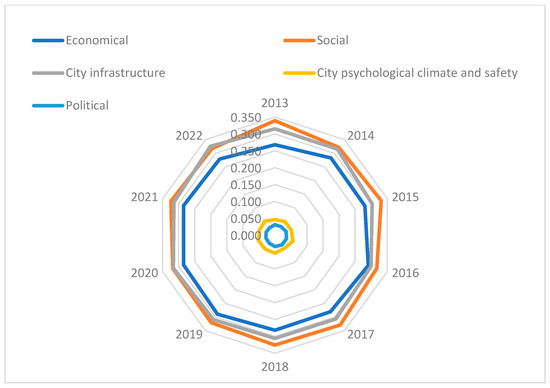
Figure 2.
Results of the critic method in the period 2013–2022.
Based on Figure 2, the change in weight coefficients was observed in the period 2013–2022. In 2016, factors of economic and urban infrastructure had a similar weight, and the gap between economic and social factors was found to be the largest in 2013, 2017, and 2018. Analysing the total weight requirements for all years, it was observed that there are no cardinal differences between the groups of factors (see Figure 3).
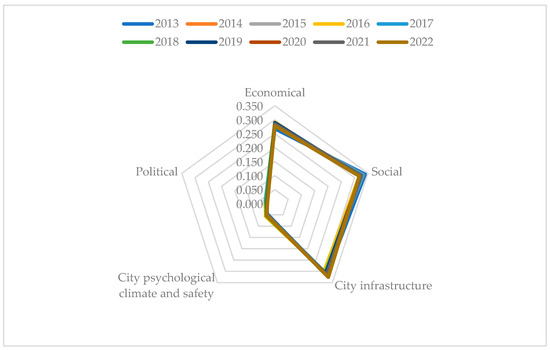
Figure 3.
Comparison of total weight coefficients by group.
According to Figure 3, social factors played an important role in the assessment of the quality of life in the city in 2017.
5. Discussion and Illusions
Cities are evaluated by different authors—very significant: competitiveness [34,36,73], modernity [13,74], and security [16,75,76]. Many assessment indices have been created: the urban quality of life index [77], urban green space indicator [78], global livability index [79], and environmental performance index (EPI) [80]. However, there is a lack of ranking for small cities (population less than 160 thousand inhabitants). A limitation of the study of small cities is the availability of data. Further research could include ranking small cities in terms of quality of life.
Various methods of assessing quality of life are observed in the scientific literature. However, the study showed that the same methods are used to assess the quality of life of both regions and cities. There is a lack of methods that comprehensively assess the sustainable development of cities, regions, and countries. The analysis of the scientific literature substantiated the importance of the quality of life in the city in the interrelationship between the urbanisation process, economic growth of cities, and competitiveness. The requirements for the quality of life of a modern city are inextricably linked to a vibrant and competitive economy, a healthy environment, social well-being, and ecology. It was determined how quality of life indicators are related to changing migration flows. It was noted that it is impossible to state that migration flows and one or another group of quality of life factors have an equal influence on all cities because they differ from each other. Although the quality of life index observed in Lithuanian cities changes (albeit slightly), the importance of factors varies slightly both in the aggregate indicator and when analysed annually.
The study confirms that migration factors are not equally important for all cities and their impact depends on the urban context, population composition, and structural economic indicators. This indicates the need to apply differentiated urban policies, taking into account the specific stage of the development of the city, as well as its strengths and weaknesses. A strong positive correlation was found between net migration and indicators such as business turnover, value added, average wage, and unemployment rate (with a negative correlation). These factors directly describe the economic viability of the city and the financial prospects of residents and therefore have the strongest influence on the decision to come or go. Social, infrastructure, and cultural conditions have an indirect or limited impact. Indicators such as improved road surface, number of museums, number of overnight stays, use of public transport, or frequency did not have a statistically significant linear relationship. This suggests that these factors are not sufficient in themselves to determine the decision to migrate, although additional elements of quality of life may be important. Some indicators reflect structural weakness rather than strength. The negative correlation between the number of students of vocational training or hospitalised patients shows that these indicators are often associated with cities that are shrinking, ageing, or with limited educational options. This indirectly signals the decline in cities or the low attractiveness for long-term residential migration. It is impossible to apply a universal quality of life model to all cities; therefore, it is necessary to assess the links between migration and quality of life from a local and dynamic perspective. In order to attract immigrants or slow down emigration, city authorities should identify factors that influence migration and purposefully strengthen or weaken them. According to the study, it was observed that cities should prioritise strengthening the attractiveness of the economic environment. To attract or retain residents, cities must invest in competitive jobs, promote entrepreneurship, increase the development of value-added sectors, and ensure adequate wages. It should be noted that some indicators that appear positive at first glance (e.g., availability of vocational training or inpatient treatment) may be a sign of declining regions. Therefore, a consistent interpretation of the indicators is required, taking into account the demographic and social structure.
Funding
This research received no external funding.
Institutional Review Board Statement
Not applicable.
Informed Consent Statement
Not applicable.
Data Availability Statement
The data presented in this study are available on request from the corresponding author.
Conflicts of Interest
The authors declare no conflict of interest.
References
- Siniavskaitė, E.; Andriušaitienė, D. A research of provisions of the lithuanian youth migration/lietuvos jaunimo migracinių nuostatų tyrimas. Moksl.—Liet. Ateitis 2015, 7, 210–220. [Google Scholar] [CrossRef]
- Tarptautinė migracijos organizacija europos migracijos tinklas lietuvos socialinių tyrimų centras. Verslo ir Investicijų Pritraukimas į Lietuvą: Migracijos ir Migracijos Politikos Vaidmuo; Tarptautinė Migracijos Organizacija (TMO): Vilnius, Lithuania; Europos Migracijos Tinklas (EMT): Vilnius, Lietuva, 2015. [Google Scholar]
- Shymanska, K.; Kurylo, M.; Karmaza, O.; Timchenko, G. Determinants of migration motives as a precondition for the migration flows formation. Probl. Perspect. Manag. 2017, 15, 352–364. [Google Scholar] [CrossRef]
- Migracijos Tendencijos. Available online: https://123.emn.lt/ (accessed on 1 February 2025).
- Griniūtė, V. Tarptautinių Studentų Migracijos Poveikio Ekonomikos Augimui Vertinimas; Vytauto Didžiojo Universitetas: Kaunas, Lithuania, 2024; Volume 6736. [Google Scholar]
- Karaša, D.; Čiegis, R. Migracijos priežastys, tendencijos ir pasekmės. Reg. Form. Dev. Stud. 2021, 1, 31–40. [Google Scholar] [CrossRef][Green Version]
- Agliari, E.; Barra, A.; Contucci, P.; Pizzoferrato, A.; Vernia, C. Social interaction effects on immigrant integration. Palgrave Commun. 2018, 4, 55. [Google Scholar] [CrossRef]
- Ette, A.; Décieux, J.P.; Erlinghagen, M.; Genoni, A.; Auditor, J.G.; Knirsch, F.; Kühne, S.; Mörchen, L.; Sand, M.; Schneider, N.F.; et al. German emigration and Remigration Panel Study (GERPS): Methodology and Data Manual of the Baseline Survey (Wave 1). 2020. Available online: https://orbilu.uni.lu/bitstream/10993/42875/1/GERPS-Manuskript_Final.pdf (accessed on 1 February 2025).
- Klüsener, S.; Stankūnienė, V.; Grigoriev, P.; Jasilionis, D. Emigration in a Mass Emigration Setting: The Case of Lithuania. Int. Migr. 2015, 4, 1–15. [Google Scholar]
- Vepšta, E.N.P.; Janušauskas, A.; Uleckas, A. Modern processes of migracion and there inflence on the labour market of lithuania. VADYBA 2009, 15, 2. [Google Scholar]
- Solnyškinienė, J.; Adamonienė, R. Migracijos procesus formuojančių veiksnių Lietuvoje vertinimas. Mykolo Riomerio Univ. 2017, 2035, 469–484. [Google Scholar]
- Karolis Žibas, E.L. Darbo migracijos procesai lietuvoje. Liet. Soc. Raida 2017, 6, 54–69. [Google Scholar]
- Navickienė, O.; Meidutė-Kavaliauskienė, I.; Činčikaitė, R.; Morkūnas, M.; Valackienė, A. Modernisation of a Country in the Context of Social Environmental Sustainability: Example of Lithuania. Sustainability 2023, 15, 3689. [Google Scholar] [CrossRef]
- Ward, N.; Brown, D.L. Placing the rural in regional development. Reg. Stud. 2009, 43, 1237–1244. [Google Scholar] [CrossRef]
- Rodríguez Bolívar, M.P. Analyzing the Influence of the Smart Dimensions on the Citizens’ Quality of Life in the European Smart Cities’ Context. In Smart Cities and Smart Governance: Towards the 22nd Century Sustainable City; Springer: Cham, Switzerland, 2021; pp. 239–256. [Google Scholar] [CrossRef]
- Činčikaitė, R.; Meidute-Kavaliauskiene, I. Assessment of Social Environment Competitiveness in Terms of Security in the Baltic Capitals. Sustainability 2021, 13, 6932. [Google Scholar] [CrossRef]
- Vaeztavakoli, A.; Lak, A.; Yigitcanlar, T. Blue and Green Spaces as Therapeutic Landscapes: Health Effects of Urban Water Canal Areas of Isfahan. Sustainability 2018, 10, 4010. [Google Scholar] [CrossRef]
- Mouratidis, K. How COVID-19 reshaped quality of life in cities: A synthesis and implications for urban planning. Land Use Policy 2021, 111, 105772. [Google Scholar] [CrossRef]
- Starkauskienė, V. Gyvenimo Kokybės Veiksniai ir jos Kompleksinio Vertinimo Modelis; Daktaro Disertacijos Santrauka VDU: Kaunas, Lithuania, 2011; ISBN 9789955127246. [Google Scholar]
- Uysal, M.; Sirgy, M.J.; Woo, E.; Kim, H.L. Quality of life (QOL) and well-being research in tourism. Tour. Manag. 2016, 53, 244–261. [Google Scholar] [CrossRef]
- Maas, J.; van Dillen, S.M.E.; Verheij, R.A.; Groenewegen, P.P. Social contacts as a possible mechanism behind the relation between green space and health. Health Place 2009, 15, 586–595. [Google Scholar] [CrossRef]
- Marans, R.W. Quality of Urban Life Studies: An Overview and Implications for Environment-Behaviour Research. Procedia—Soc. Behav. Sci. 2012, 35, 9–22. [Google Scholar] [CrossRef]
- Petrovič, F.; Maturkanič, P. Urban-Rural Dichotomy of Quality of Life. Sustainability 2022, 14, 8658. [Google Scholar] [CrossRef]
- Carta, M.G. Quality of Life and Urban / Rural Living: Preliminary Results of a Community Survey in Italy. Clin. Pract. Epidemiol. Ment. Health 2012, 8, 169–174. [Google Scholar] [CrossRef]
- Akbari, H.; Pomerantz, M.; Taha, H. Cool surfaces and shade trees to reduce energy use and improve air quality in urban areas. Sol. Energy 2001, 70, 295–310. [Google Scholar] [CrossRef]
- Ma, L.; Liu, S.; Fang, F.; Che, X.; Chen, M. Evaluation of urban-rural difference and integration based on quality of life. Sustain. Cities Soc. 2020, 54, 101877. [Google Scholar] [CrossRef]
- Janušauskaitė, G. Gyvenimo kokybės tyrimai: Problemos ir galimybės. Filos. Sociol. 2008, 19, 34–44. [Google Scholar]
- Quality of Care. Available online: https://www.who.int/health-topics/quality-of-care#tab=tab_1 (accessed on 1 February 2025).
- Quality of Life in European Cities. 2013. Available online: https://europa.eu/eurobarometer/surveys/detail/1035 (accessed on 1 February 2025).
- Pukeliene, V.; Starkauskiene, V. Quality of Life: Factors Determining its Measurement Complexity. Eng. Econ. 2011, 22, 147–156. [Google Scholar] [CrossRef]
- Kanzola, A.-M.; Papaioannou, K.; Papadaki, A.; Petrakis, P.E. Life Satisfaction and Social Identity: On the Socio-economic Determinants of Compliant Behaviour. Statut. Law Rev. 2025, 46, hmae055. [Google Scholar] [CrossRef]
- Dissou, Y.; Didic, S. Infrastructure and Growth. In Infrastructure and Economic Growth in Asia. Economic Studies in Inequality, Social Exclusion and Well-Being; Springer: Cham, Switzerland, 2013; pp. 5–45. [Google Scholar] [CrossRef]
- Richardson, M.; Hamlin, I. Nature engagement for human and nature’s well-being during the Corona pandemic. J. Public Ment. Health 2021, 20, 83–93. [Google Scholar] [CrossRef]
- Činčikaitė, R. Miestų Konkurencingumo Kompleksinis Vertinimas Remiantis Darnios Plėtros Principais; Vilnius Gediminas Technical University: Vilnius, Lithuania, 2013. [Google Scholar]
- Bruneckienė, J.; Činčikaitė, R. Šalies Regionų Konkurencingumo Vertinimas Regionų Konkurencingumo Indeksu: Tikslumo Didinimo Aspektas. Ekon. Ir Vadyb. 2009, 14, 700–709. [Google Scholar]
- Bruneckiene, J.; Činčikaitė, R.; Kilijonienė, A. The Specifics of Measurement the Urban Competitiveness at the National and International Level. Eng. Econ. 2012, 23, 256–270. [Google Scholar] [CrossRef]
- Synyayeva, L.; Bocharova, N.; Ahieieva, I.; Yarchuk, A. Managing of the Living Quality of Population in the Social Sphere. In Modern Development Paths of Agricultural Production; Springer International Publishing: Cham, Switzerland, 2019; pp. 571–581. [Google Scholar] [CrossRef]
- Lim, S.C.; Chan, Y.M.; Gan, W.Y. Social and Health Determinants of Quality of Life of Community-Dwelling Older Adults in Malaysia. Int. J. Environ. Res. Public Health 2023, 20, 3977. [Google Scholar] [CrossRef]
- Grbic, G.; Djokic, D.; Kocic, S.; Mitrasinovic, D.; Rakic, L.; Prelevic, R.; Krivokapic, Z.; Miljkovic, S. Influence of demographic and socioeconomic characteristics on the quality of life. Srp. Arh. Celok. Lek. 2011, 139, 360–365. [Google Scholar] [CrossRef]
- Prado-Lorenzo, J.-M.; García-Sánchez, I.-M.; Cuadrado-Ballesteros, B. Sustainable cities: Do political factors determine the quality of life? J. Clean. Prod. J. Clean. Prod. 2012, 21, 34–44. [Google Scholar] [CrossRef]
- Lane, R.E. Quality of Life and Quality of Persons. Polit. Theory 1994, 22, 219–252. [Google Scholar] [CrossRef]
- Orru, K.; Orru, H.; Maasikmets, M.; Hendrikson, R.; Ainsaar, M. Well-being and environmental quality: Does pollution affect life satisfaction? Qual. Life Res. 2016, 25, 699–705. [Google Scholar] [CrossRef] [PubMed]
- Vitkūnas, R.; Činčikaitė, R.; Meidute-Kavaliauskiene, I. Assessment of the Impact of Road Transport Change on the Security of the Urban Social Environment. Sustainability 2021, 13, 12630. [Google Scholar] [CrossRef]
- Scott, N.W.; Fayers, P.M.; Aaronson, N.K.; Bottomley, A.; de Graeff, A.; Groenvold, M.; Koller, M.; Petersen, M.A.; Sprangers, M.A.G. The relationship between overall quality of life and its subdimensions was influenced by culture: Analysis of an international database. J. Clin. Epidemiol. 2008, 61, 788–795. [Google Scholar] [CrossRef] [PubMed]
- Kuyken, W.; Orley, J.; Hudelson, P.; Sartorius, N. Quality of Life Assessment across Cultures. Int. J. Ment. Health 1994, 23, 5–27. [Google Scholar] [CrossRef]
- Diener, E.; Suh, E.M. Quality of Life of Cultures. Cult. Subj. Well-Being 2000, 54, 3–12. [Google Scholar]
- Weber, K.; Canuto, A.; Giannakopoulos, P.; Mouchian, A.; Meiler-Mititelu, C.; Meiler, A.; Herrmann, F.R.; Delaloye, C.; Ghisletta, P.; Lecerf, T.; et al. Personality, psychosocial and health-related predictors of quality of life in old age. Aging Ment. Health 2015, 19, 151–158. [Google Scholar] [CrossRef] [PubMed]
- Badri, M.A.; Alkhaili, M.; Aldhaheri, H.; Yang, G.; Albahar, M.; Alrashdi, A. Exploring the Reciprocal Relationships between Happiness and Life Satisfaction of Working Adults—Evidence from Abu Dhabi. Int. J. Environ. Res. Public Health 2022, 19, 3575. [Google Scholar] [CrossRef]
- Newman, W.G. Sustainability and cities: Extending the metabolism model. Landsc. Urban Plan. 1999, 44, 219–226. [Google Scholar] [CrossRef]
- “Eurobarometras”: 86 Proc. Lietuvių Teigiamai Vertina Gyvenimo Kokybę Savo Regione. Available online: https://lithuania.representation.ec.europa.eu/news/eurobarometras-86-proc-lietuviu-teigiamai-vertina-gyvenimo-kokybe-savo-regione-2024-03-26_lt (accessed on 1 February 2025).
- Zhou, G.; Liu, C.; Tang, C.; He, Y.; Wu, J.; He, L. Spatial pattern and influencing factors of quality of life in rural areas of Hunan province. Geogr. Res. 2018, 37, 2475–2489. [Google Scholar]
- Brauer, R.; Dymitrow, M. Quality of life in rural areas: A topic for the Rural Development policy? Bull. Geogr. Socio-Econ. Ser. 2014, 24–54. [Google Scholar] [CrossRef]
- Zhang, L.; Zhu, T.; Qian, F.; Xu, J.; Dorje, G.; Zhao, Z.; Guo, F.; Li, Y. Iridoid glycosides isolated from Scrophularia dentata Royle ex Benth. and their anti-inflammatory activity. Fitoterapia 2014, 98, 84–90. [Google Scholar] [CrossRef] [PubMed]
- Meidutė-Kavaliauskienė, I.; Činčikaitė, R. Integration of Migrants Into the Country’s Social Environment: The Case of Lithuania. Bus. Theory Pract. 2023, 24, 571–583. [Google Scholar] [CrossRef]
- Biswas, M.; Ozker, A.N.; Prasad, S.; Deka, R.J.; Patel, M. Understanding The Nexus Between Economic Opportunities and Migration Patterns: Empirical Insights. Libr. Prog.-Libr. Sci. Inf. Technol. Comput. 2024, 44, 215–221. [Google Scholar]
- Rayevnyeva, O.; Stryzhychenko, K.; Matúšová, S. Impact of Migration Processes on GDP. Eng. Proc. 2023, 39, 86. [Google Scholar] [CrossRef]
- Simpson, N.B. Demographic and economic determinants of migration. IZA World Labor 2022, 373, 1–11. [Google Scholar] [CrossRef]
- Baizan, P.; González-Ferrer, A. What drives Senegalese migration to Europe? The role of economic restructuring, labor demand, and the multiplier effect of networks. Demogr. Res. 2016, 35, 339–380. [Google Scholar] [CrossRef]
- Smith, A. Labour migration, mass unemployment and the state: Class, gender and work in the Land Settlement Association in inter-war rural England. J. Rural Stud. 2025, 114, 103498. [Google Scholar] [CrossRef]
- Ma, S.; Li, X.; Wu, X. Minimum wage and internal labor migration: Evidence from China. J. Econ. Behav. Organ. 2024, 226, 106695. [Google Scholar] [CrossRef]
- Mtiraoui, A. Interaction between Migration and Economic Growth through Unemployment in the Context of Political Instability in the MENA Region. Int. J. Econ. Financ. Issues 2024, 14, 204–215. [Google Scholar] [CrossRef]
- Drazenovic, I.; Kunovac, M.; Pripuzic, D. Dynamics and determinants of emigration: The case of Croatia and the experience of new EU member states. Public Sect. Econ. 2018, 42, 415–447. [Google Scholar] [CrossRef]
- Bandeira, G.; Caballé, J.; Vella, E. Emigration and fiscal austerity in a depression. J. Econ. Dyn. Control 2022, 144, 104539. [Google Scholar] [CrossRef]
- Scazzieri, B.L.; Springford, J. How the EU and Third Countries Can Manage Migration How the EU and Third Countries Can Manage Migration; Center for European Reform: Londone, UK, 2017. [Google Scholar]
- Huysmans, J. The European Union and the securitization of migration. JCMS J. Common Mark. Stud. 2000, 38, 751–777. [Google Scholar] [CrossRef]
- Dumitrescu, A.L. The Phenomenon of Migration In The European Union. Rev. Econ. Mond. J. Glob. Econ. 2018, 10, 82–96. [Google Scholar]
- Pabedinskaitė, A.; Činčikaitė, R. Kiekybiniai Modeliavimo Metodai; Vilnius Gediminas Technical University: Vilnius, Lithuania, 2016. [Google Scholar] [CrossRef]
- Čekanavičius, G.; Murauskas, V. Taikomoji Regresinė Analizė Socialiniuose Tyrimuose. 2014. Available online: http://www.statistika.mif.vu.lt/wp-content/uploads/2014/04/regresine-analize.pdf (accessed on 1 February 2025).
- Diakoulaki, D.; Mavrotas, G.; Papayannakis, L. Determining objective weights in multiple criteria problems: The critic method. Comput. Oper. Res. 1995, 22, 763–770. [Google Scholar] [CrossRef]
- Žižovic, M.; Miljkovic, B.; Marinkovic, D. Objective methods for determining criteria weight coefficients:a modificationof the critic method. Decis. Mak. Appl. Manag. Eng. 2020, 3, 149–161. [Google Scholar] [CrossRef]
- Deng, H.; Yeh, C.H.; Willis, R.J. Inter-company comparison using modified TOPSIS with objective weights. Comput. Oper. Res. 2000, 27, 963–973. [Google Scholar] [CrossRef]
- Gyvenimo Kokybės Indeksas—Kuriose Savivaldybėse Situacija Geriausia 2023 m. Available online: https://finmin.lrv.lt/lt/naujienos/gyvenimo-kokybes-indeksas-kuriose-savivaldybese-situacija-geriausia-2023-m/ (accessed on 1 February 2025).
- Bruneckiene, J.; Guzavicius, A.; Cincikaite, R. Measurement of Urban Competitiveness in Lithuania. 2010, Volume 21, pp. 493–508. Available online: https://etalpykla.vilniustech.lt/handle/123456789/129962 (accessed on 1 February 2025).
- Navickienė, O.; Valackienė, A.; Činčikaitė, R.; Meidute-Kavaliauskiene, I. A Theoretical Model of the Development of Public Citizenship in a Sustainable Environment: Case of Lithuania. Sustainability 2023, 15, 3469. [Google Scholar] [CrossRef]
- Kahler, M. Economic security in an era of globalization: Definition and provision. Pacific Rev. 2004, 17, 485–502. [Google Scholar] [CrossRef]
- Curiel, R.P.; Bishop, S. Modelling the fear of crime. Proc. R. Soc. A Math. Phys. Eng. Sci. 2017, 473, 20170156. [Google Scholar] [CrossRef]
- Garau, C.; Pavan, V. Evaluating Urban Quality: Indicators and Assessment Tools for Smart Sustainable Cities. Sustainability 2018, 10, 575. [Google Scholar] [CrossRef]
- van den Bosch, M.A.; Mudu, P.; Uscila, V.; Barrdahl, M.; Kulinkina, A.; Staatsen, B.; Swart, W.; Kruize, H.; Zurlyte, I.; Egorov, A.I. Development of an urban green space indicator and the public health rationale. Scand. J. Public Health 2016, 44, 159–167. [Google Scholar] [CrossRef] [PubMed]
- Giap, T.K.; Thye, W.W.; Aw, G. A new approach to measuring the liveability of cities: The Global Liveable Cities Index. World Rev. Sci. Technol. Sustain. Dev. 2014, 11, 176. [Google Scholar] [CrossRef]
- Hsu, A.; Zomer, A. Environmental Performance Index. In Wiley StatsRef: Statistics Reference Online; Wiley: Hoboken, NJ, USA, 2016; pp. 1–5. [Google Scholar] [CrossRef]
Disclaimer/Publisher’s Note: The statements, opinions and data contained in all publications are solely those of the individual author(s) and contributor(s) and not of MDPI and/or the editor(s). MDPI and/or the editor(s) disclaim responsibility for any injury to people or property resulting from any ideas, methods, instructions or products referred to in the content. |
© 2025 by the author. Licensee MDPI, Basel, Switzerland. This article is an open access article distributed under the terms and conditions of the Creative Commons Attribution (CC BY) license (https://creativecommons.org/licenses/by/4.0/).