1. Introduction
Greenhouse gas emissions (GHG) are one of the most important challenges for sustainable development in the climate and economic aspects of the European Union nowadays. Greenhouse gases are components of the Earth’s atmosphere. Their physicochemical properties cause the trapping of solar energy in this atmosphere. These include gases such as carbon dioxide (CO
2), methane (CH
4), nitrous oxide (N
2O), and more minor trace gases such as nitrogen trifluoride (NF
3), hydrofluorocarbons and hydrofluorinated greenhouse gases (HFCs), perfluorocarbons (PFCs) and sulfur hexafluoride (SF
6) [
1,
2]. Carbon dioxide accounts for about 76% of emissions, methane about 16%, nitrous oxide 6%, and fluorinated industrial gases 2% of emissions [
3,
4].
Sources of greenhouse gas emissions can be of natural essence or result from human activities. Natural sources of emissions include forest and peatland fires, volcanic eruptions, respiration of living organisms, decomposition of organic matter, gas exchange in the oceans (carbon dioxide emissions) [
5,
6,
7,
8], swamps and peatlands, subsea methane hydrates, decomposition of organic matter in soils and oceans (methane emissions) [
9,
10,
11,
12], and biological processes in soils and oceans, and forest and steppe fires (nitrous oxide emissions) [
13,
14,
15].
Unfortunately, human activity (anthropogenic emissions) is responsible for a larger share of gas emissions. The literature lists such significant pollution sources as energetics [
16], transportation [
17,
18], industry [
19], agriculture [
20], animal farming [
21,
22,
23], waste management [
24,
25,
26] and other demographics [
27,
28,
29,
30]. The burning of fossil fuels (coal, oil, natural gas) is primarily responsible for carbon dioxide emissions [
3], but so is deforestation, which releases carbon dioxide stored in vegetation into the atmosphere and reduces the ability of ecosystems to absorb it [
31]. Cattle farming [
32,
33], landfills, and gas and oil extraction are mainly responsible for methane emissions. In addition, nitrous oxide emissions are mainly from agriculture [
34,
35].
Increasing concentrations of GHG are leading to global warming and climate change. Concerned about the climate, the European Union, in 2019, launched a comprehensive European Green Deal strategy [
36], which aimed to create an economy in the EU countries generating significantly less greenhouse gas emissions by promoting sustainable development with the conservation of natural resources. The key objectives of the European Green Deal consisted of reducing greenhouse gas emissions by at least 55% by 2030 (compared to 1990 levels), sustainable transport, industry, agriculture, and forestry, decarbonizing the energy sector, and increasing energy efficiency. It should lead to making the EU climate-neutral by 2050. To achieve the above goals in 2021, the European Commission has announced a legislative package on climate and energy called “Fit for 55”. It contains the main climate goals of the EU Green Deal [
37,
38]. The package is a set of relevant legislative proposals covering minimizing final energy consumption while increasing the share of renewable energy sources in the overall energy mix. The financial participation of the European Union countries, the European Commission, and the European Investment Bank in climate change financing under the United Nations Framework Convention (UNFCCC) has also become an important issue [
39].
The European Commission, in its “Fit for 55” package, has committed EU Member States to develop sustainable policies through legislation. The above actions result in the unquestionable development of renewable energy sources in EU countries [
40,
41,
42,
43,
44,
45]. In Poland, the Minister of Climate and Environment issued the document “Energy Policy of Poland until 2040” (PEP2040), along with its update, covering the optimal use of indigenous energy resources, development of energy markets, implementation of nuclear energy, development of renewable energy sources and improvement of energy efficiency of the economy [
46,
47]. The government of Poland has implemented a series of programs under the title “My Electricity” to encourage its residents to invest in renewable energy sources (RES). This initiative, currently in its sixth edition, was initiated in 2019. Specifically, it has encouraged citizens to adopt photovoltaic systems on a broader scale. Another tool employed was introducing thermal modernization tax credits (the “Clean Air” program). Local governments have also initiated programs to provide support for these investments. Implementing these policies has substantially increased the popularity of renewable energy systems, particularly photovoltaics, in Poland. [
41,
42,
48].
Changes in the volume of greenhouse gas emissions have been studied in the literature according to different factors and periods. Most often, they were concerned with the impact of factors such as economic growth, energy consumption, and the share of renewable energy sources on greenhouse gas emissions (or CO
2 itself). For example, analyses conducted in Malaysia from 1986 to 2021 showed that energy consumption, economic growth, and non-renewable energy sources positively impact carbon dioxide (CO
2) emissions [
49]. On the other hand, a study in South Korea [
50], based on data from 1990 to 2021, showed that using renewable energy and technological innovation reduces greenhouse gas emissions. An interesting study was presented in the paper [
51], where the relationship between CO
2 emissions and energy consumption, mortality, life expectancy, health indicators, and GDP in the five countries with the highest carbon emissions (the US, Russia, Japan, China, and India) was examined utilizing data from 1975 to 2015. Based on the results, it was revealed that the correlations of CO
2 emissions with GDP (in the analyzed countries except the USA, there is a positive correlation; for the USA negative correlation), life expectancy (for the USA negative correlation, the rest of the countries—positive), fossil fuel energy consumption (Russia non-significant correlation, Japan: negative, the rest of the countries positive correlation), energy consumption (strong positive correlation), and mortality rate (USA: positive correlation, the rest of the countries: negative correlation). In contrast, the paper [
52] presents an analysis of the impact of renewable energy consumption (negative correlation), GDP economic growth (negative correlation), population growth (negative correlation), globalization, and financial development (both insignificant variables) on carbon dioxide emissions in selected G7 countries, namely: France, Germany, Canada, Italy, and the UK, between 1990 and 2020. The study [
53], in turn, confirmed some instability in the strength and direction of the dependence of GHG emissions on GDP from country to country. These results may also confirm the concepts of decoupling or the environmental Kuznets curve (EKC). Decoupling represents the distortion between the rate of environmental damage and economic growth in each period [
54,
55]. EKC refers to the relationship between economic development and environmental degradation. According to the theory, initially, economic growth is accompanied by an increase in the negative impact on the environment up to a certain point, from which the impact begins to decrease with further economic growth [
56].
Concerning European countries, a study [
57] based on a model of the dependence of the share of renewable energy, energy intensity of economies, and GDP growth on gas emissions confirmed the significance of the impact of these factors in the EU-28 countries in 2004–2013 (share of renewable energy: negative dependence, energy intensity of economies: positive dependence, GDP growth: positive dependence. The paper [
58], in turn, examined the factors influencing greenhouse gas emissions and their effects in EU member states in 2010–2019, confirming the existence of relationships between greenhouse gas emissions and GDP (positive relationship), renewable energy (negative relationship), household final energy consumption (positive relationship) and waste generation (positive relationship). Debates about the depletion of natural resources and economic growth, the impact of human activity on the climate and the need to reduce greenhouse gas emissions have brought to one conclusion: the need to address sustainability and the challenges of environmental constraints [
59].
After analyzing the literature, we became curious about what has had, and continues to have, the most significant impact on greenhouse gas emissions since the beginning of the European Union across the total combined area of all the countries that currently belong to it. For the sake of comparison, it was also decided to look at Poland, whose economy—due to its geopolitical layout—is characterized by such features as high dependence on coal, a large share of heavy industry, high potential for CO
2 absorption by forests and very dynamic development of RES in the recent decade [
60,
61]. Therefore, the article aims to examine the level of GHG emissions concerning factors such as the share of renewable energy, the volume of GDP, the final consumption of solid fossil fuels, the final consumption of energy by households and in the industrial sector, as well as forest area, and determine their impact on this volume in the European Union and Poland separately. Thus, the study fills a gap in identifying the cross-sectoral determinants of greenhouse gas emissions in the EU, focusing specifically on Poland since the beginning of the European Union. It offers a comparative and policy-relevant approach to understanding the relationship between economic activity, energy consumption, forest land use, and emissions. Calculations were made for the total area of the current 27 EU countries and Poland separately for the period 1990–2022 for comparative purposes.
The following research questions were posed to address the above objective:
RQ1: What was the impact of the share of energy from renewable sources in the domestic production of electricity and heat in the EU countries in the years studied on the volume of GHG emissions?
RQ1a: What was the impact of the share of energy from renewable sources in the domestic production of electricity and heat in Poland in the years studied on the volume of GHG emissions?
RQ2: What was the impact of GDP, solid fossil fuel consumption, household energy consumption, industrial sector energy consumption, and forest area in EU countries in the years studied on the volume of GHG emissions?
RQ2a: What was the impact of GDP, solid fossil fuel consumption, household energy consumption, industrial sector energy consumption, and forest area in Poland in the years studied on the volume of GHG emissions?
The following hypotheses were formulated corresponding to the given research questions:
H1: There is a significant correlation between the EU’s share of energy from renewable sources and GHG emissions.
H1a: There is a significant correlation between Poland’s share of energy from renewable sources and GHG emissions.
H2.1: There is a significant correlation between the EU’s GDP volume and GHG emissions.
H2.1a: There is a significant correlation between GDP volume and GHG emissions in Poland.
H2.2: There is a significant correlation between the EU’s solid fossil fuel consumption and GHG emissions.
H2.2a: There is a significant correlation between solid fossil fuel consumption and GHG emissions in Poland.
H2.3: There is a significant correlation between the EU’s household energy consumption and GHG emissions.
H2.3a: There is a significant correlation between household energy consumption and GHG emissions in Poland.
H2.4: There is a significant correlation between the EU’s industrial sector energy consumption and GHG emissions.
H2.4a: There is a significant correlation between industrial sector energy consumption and GHG emissions in Poland.
H2.5: There is a significant correlation between the EU’s forest area and GHG emissions.
H2.5a: There is a significant correlation between forest area and GHG emissions in Poland.
3. Results
First, the variables collected were analyzed in terms of their basic statistics for the 27 EU countries in the aggregate and separately for Poland (
Table 2).
3.1. Greenhouse Gas Emissions—Characteristics
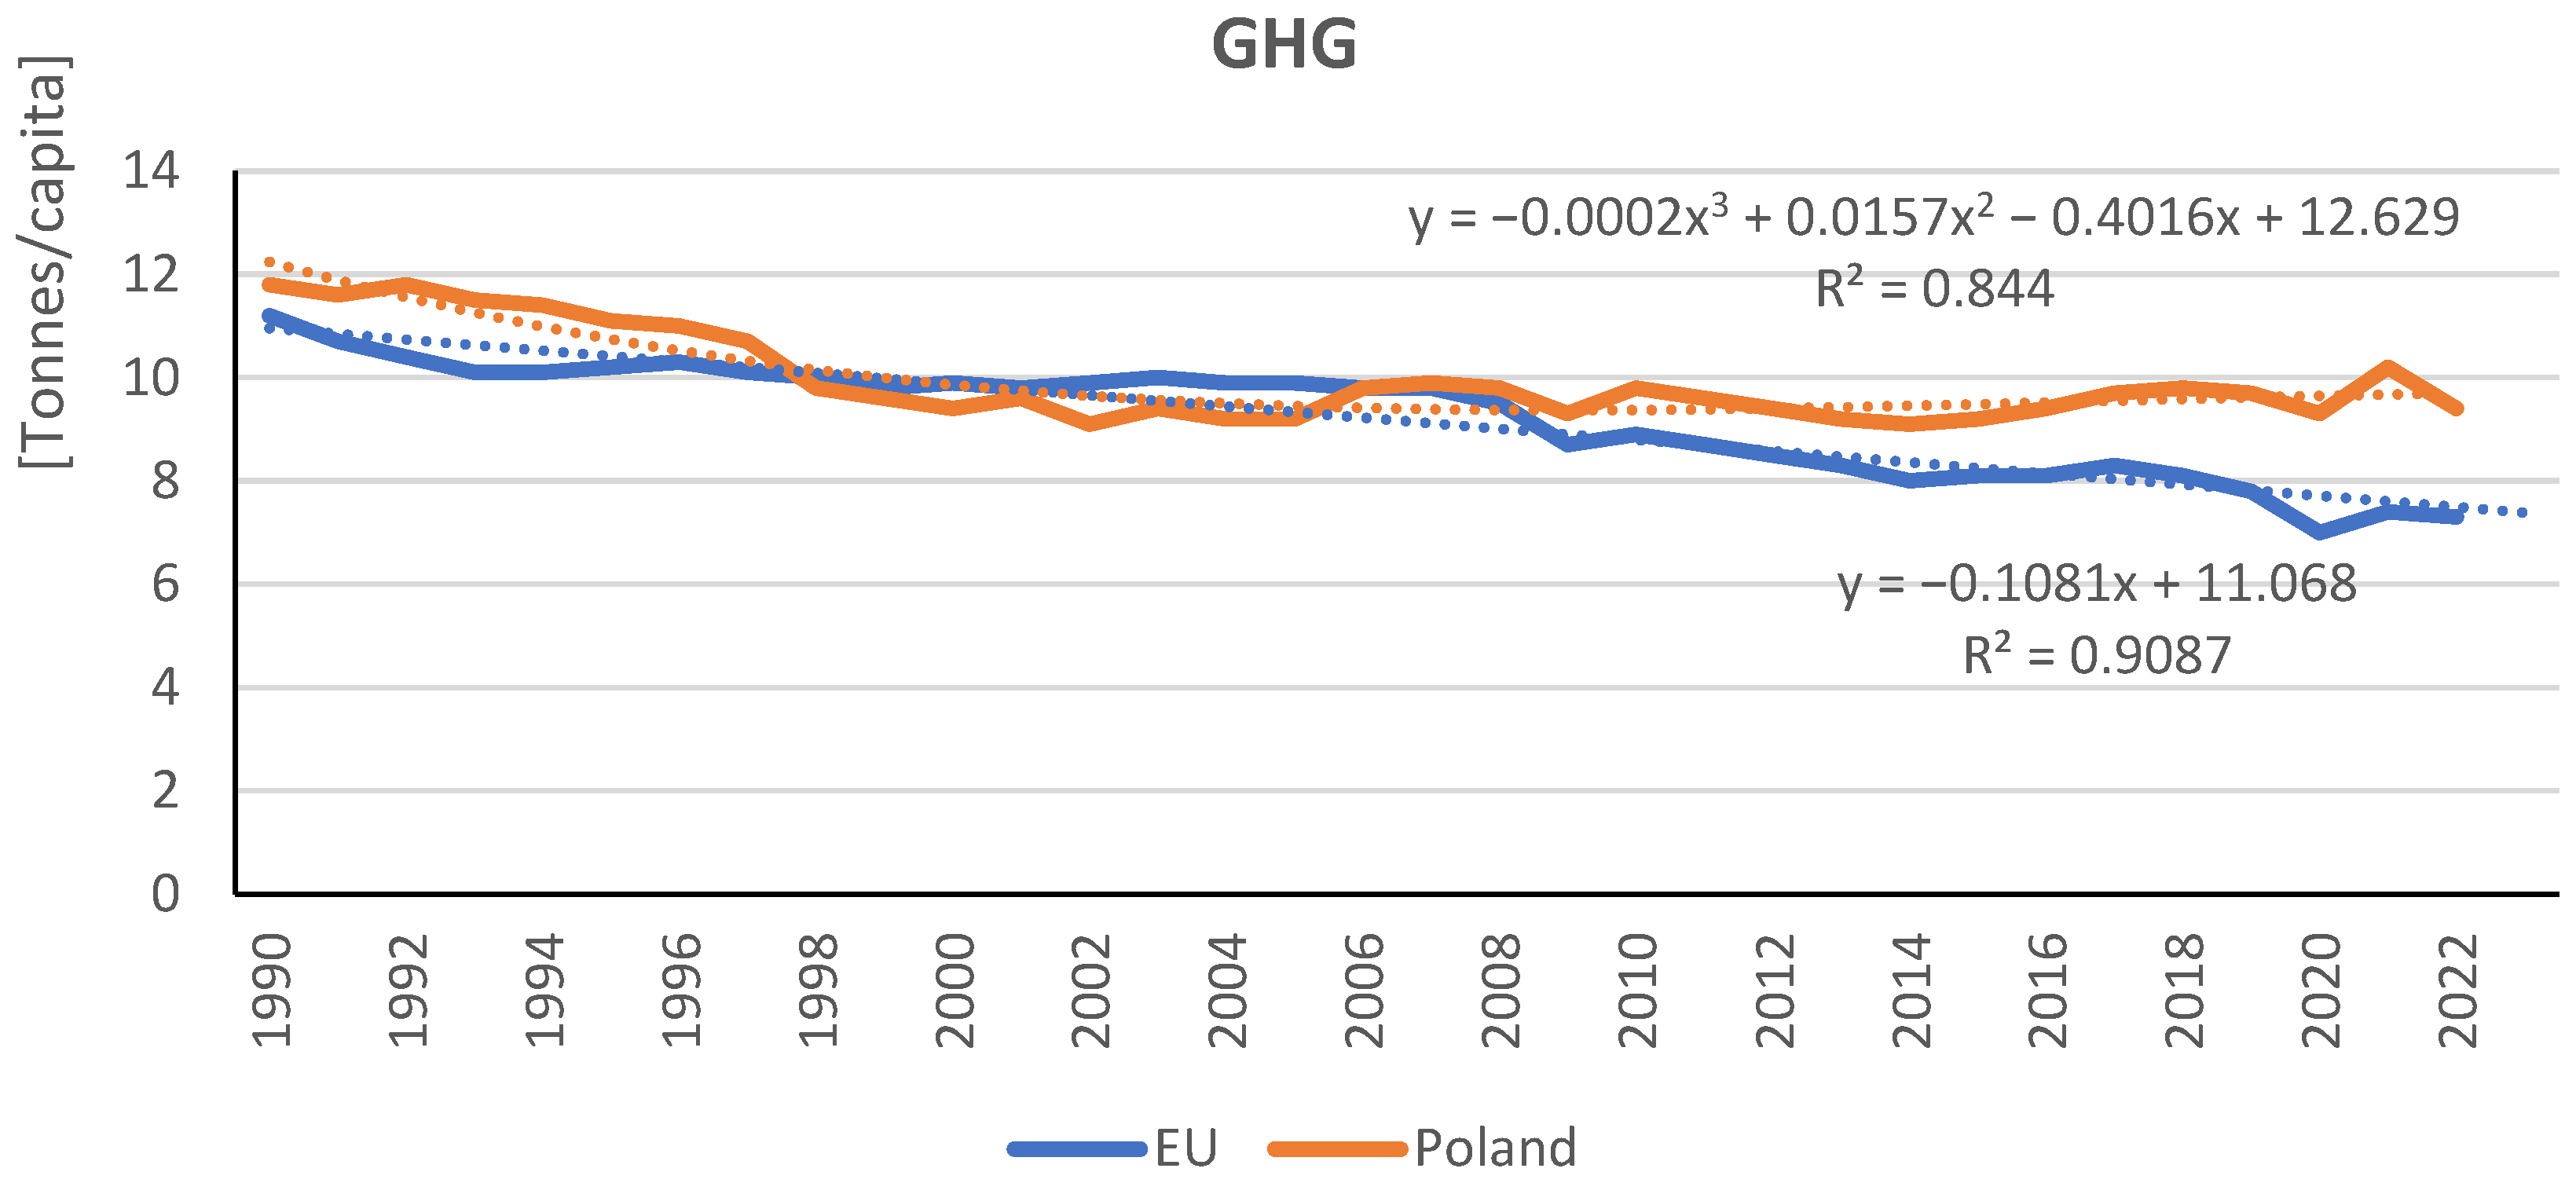
GHG emissions in the EU varied between 7 and 11.2 tons per capita in the years under review (in Poland, between 9.1 and 11.8). With an average of 9.23 tons/capita (PL: 9.96) with a standard deviation of 1.1 (PL: 0.86), resulting in a coefficient of variation of 11.9% (PL: 8.7%). Emissions in the European Union fell by 34.8% over the period under review, with an average annual decrease of 1.3%. In Poland, on the other hand, this decrease was lower, 20.3%, with an average annual reduction of 0.7%.
Figure 1 presents graphs of the values of the analyzed variable for 1990–2022, along with the trend lines (dash lines).
Regarding the European Union population, greenhouse gas emissions declined steadily over the study period and could be described by a linear trend with a good fit (R2 = 0.91; F = 308.7, p-value = 0.000). However, after an initial decline in greenhouse gas emissions for Poland, this process slowed down around 2000 and remained relatively constant. For this, a better fit was a polynomial trend of the 3rd degree (R2 = 0.84; F = 52.3, p-value = 0.000).
3.2. Share of Renewable Energy and Its Impact on GHG Emissions
In order to answer the first two research questions (RQ1 and RQ1a), the time series of the shares of renewable energy in the total energy production of the EU and Poland were analyzed (
Figure 2).
It can be noted that both series were highly dynamic—they are best described by quadratic trends (EU: R
2 = 0.98, F = 829.1,
p-value = 0.000; PL: R
2 = 0.96, F = 425.6,
p-value = 0.000). The share of RES energy has increased steadily over the years studied (cf.
Table 2). In the European Union, it increased by 296% (from 10.75% to 42.63%), with an average year-on-year increase of 4.3%. However, in Poland, this increase was as high as 1535% (from 0.85% to a high of 21.79%), with an average year-on-year increase of 8.8%.
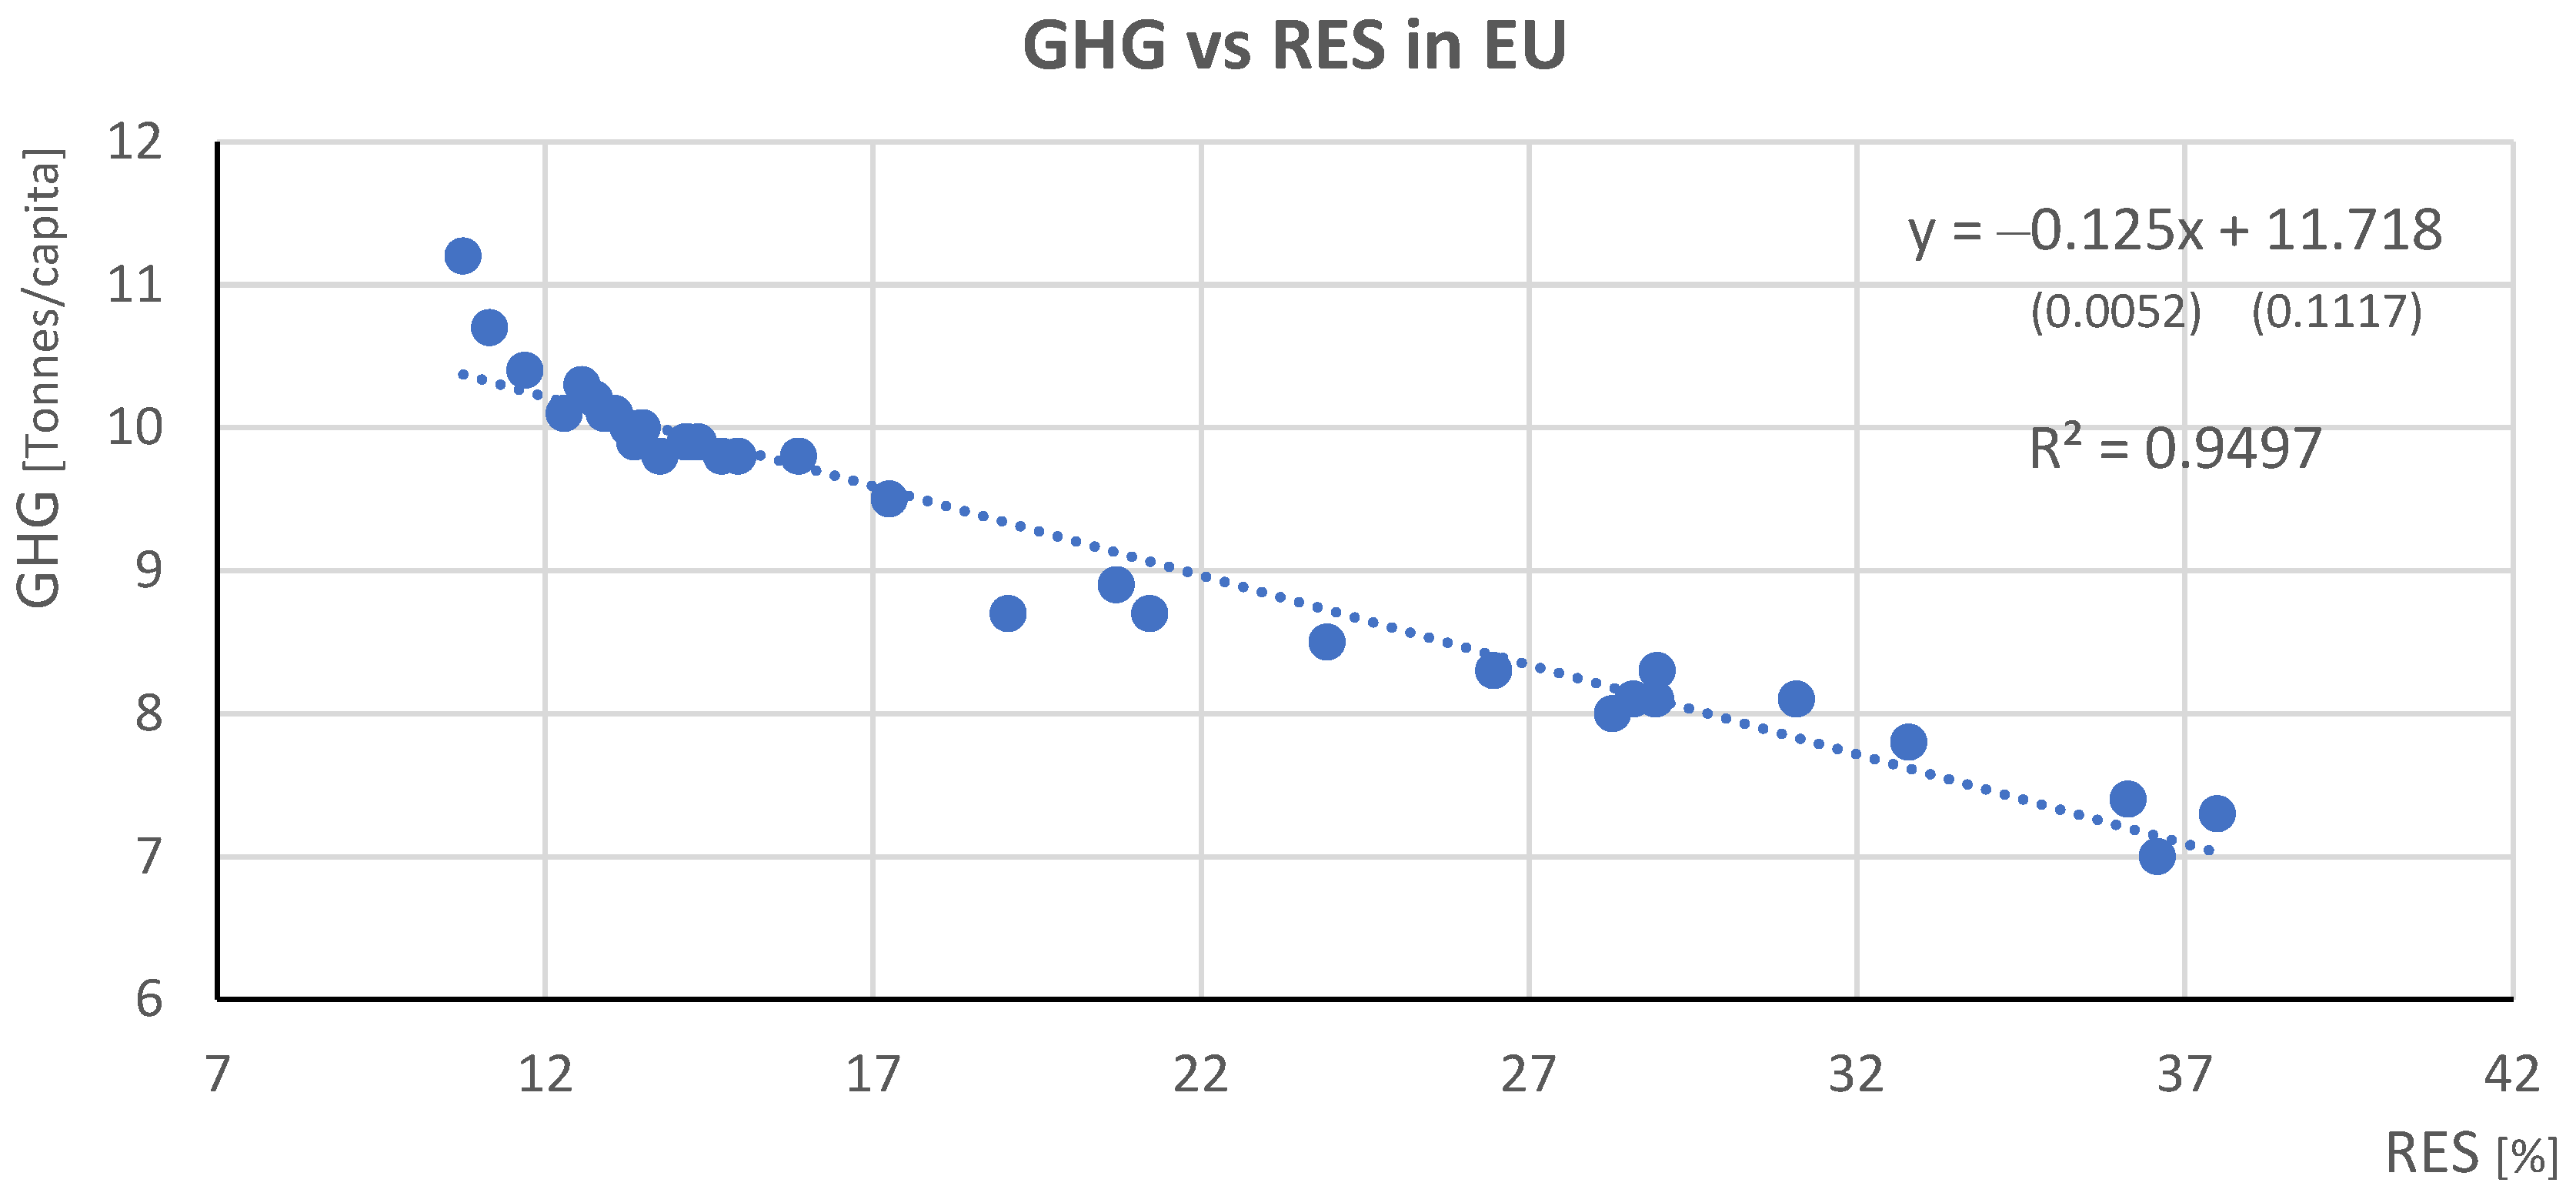
In order to investigate the dependence of the amount of greenhouse gas emissions on the share of RES in energy production in the European Union (RQ1), a scatter plot of these variables was created (
Figure 3). It shows a firm, linear relationship between the variables studied. The Pearson linear correlation coefficient, r, was calculated to confirm this and test the H1 hypothesis. It amounted to −0.97 (
p-value = 0.000), which implies a very high linear negative relationship, confirming the impact of RES on emission reductions. As the share of RES increased, GHG emissions decreased. The equation of the regression line has been included in the graph. Its high coefficient of determination (R
2 = 0.95, F = 585.3,
p-value = 0.000) confirmed that RES had an almost 95% impact on EU GHG emission variability. The slope of the regression line shows that an increase in the share of RES of 1% on average was accompanied by an average decrease in emissions of approximately 0.125 tons per capita.
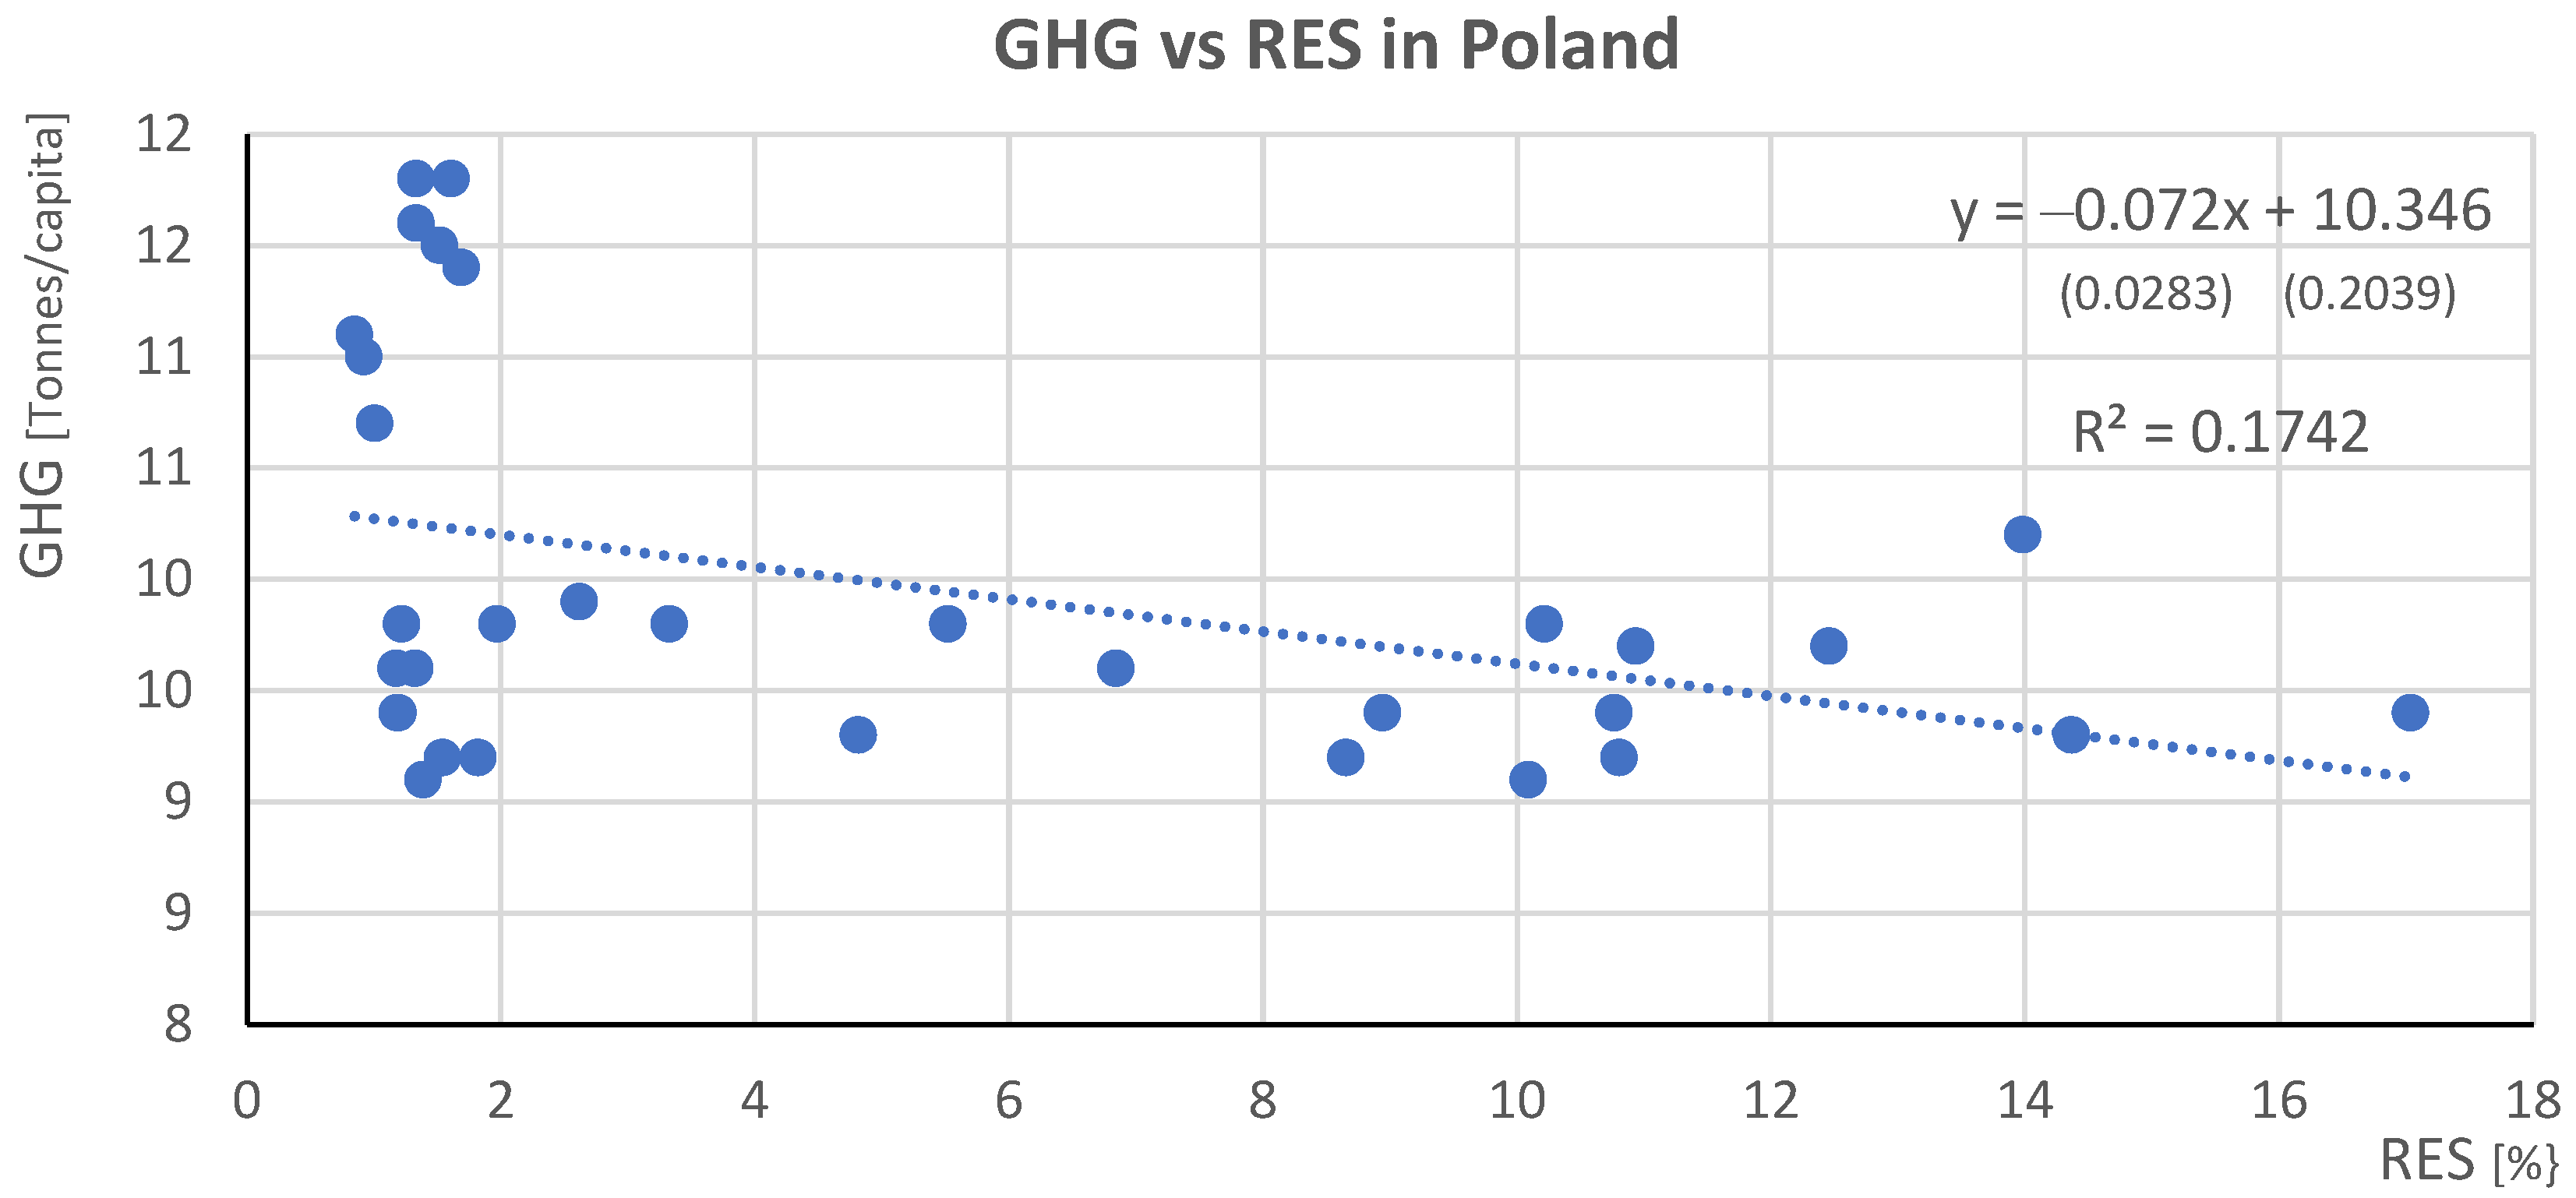
A similar analysis was carried out for Poland (to RQ1a and to test the H1a hypothesis), obtaining the results shown in
Figure 4.
The correlation was much lower this time, albeit significant: r = −0.42 (p-value = 0.016). This also confirmed that a decrease in emissions accompanied the increase in RES. However, because of a too low (in terms of the modulus) correlation coefficient, the estimated regression line should not be interpreted this time (R2 = 0.17, F = 5.54, p-value = 0.016), as it only explains 17% of the GHG emissions development. At this stage, it could be concluded that other factors could have had a much more significant impact on GHG emissions in Poland.
For comparison,
Table 3 summarizes the correlation coefficients of the share of renewable energy and GHG emissions for all 27 EU countries.
As observed, the linear correlation did not occur in six countries: Austria, Bulgaria, Croatia, Estonia, Finland, and Lithuania.
In the following section, to answer research questions RQ2 and RQ2a, the results of the analyses on the influence of other factors on GHG emissions in the EU and Poland have been presented.
3.3. GDP and Its Impact on GHG Emissions
In the European Union, GDP per capita for 1995–2023 ranged from EUR 14,957 to 38,310 per person, while the range for Poland was 2832 to 20,377 (cf.
Table 2). In the EU, GDP per year grew by an average of 3.4%, with a total increase of 156%. The average growth rate in Poland was much higher, at 7.3% year-on-year, giving a total increase of 620%.
Figure 5 shows how the variable under study evolved in the EU and Poland.
This time, the exponential trends best described the GDP per capita values in the EU and Poland (EU: R2 = 0.97, F = 954.1, p-value = 0.000; PL: R2 = 0.97, F = 964.3, p-value = 0.000).
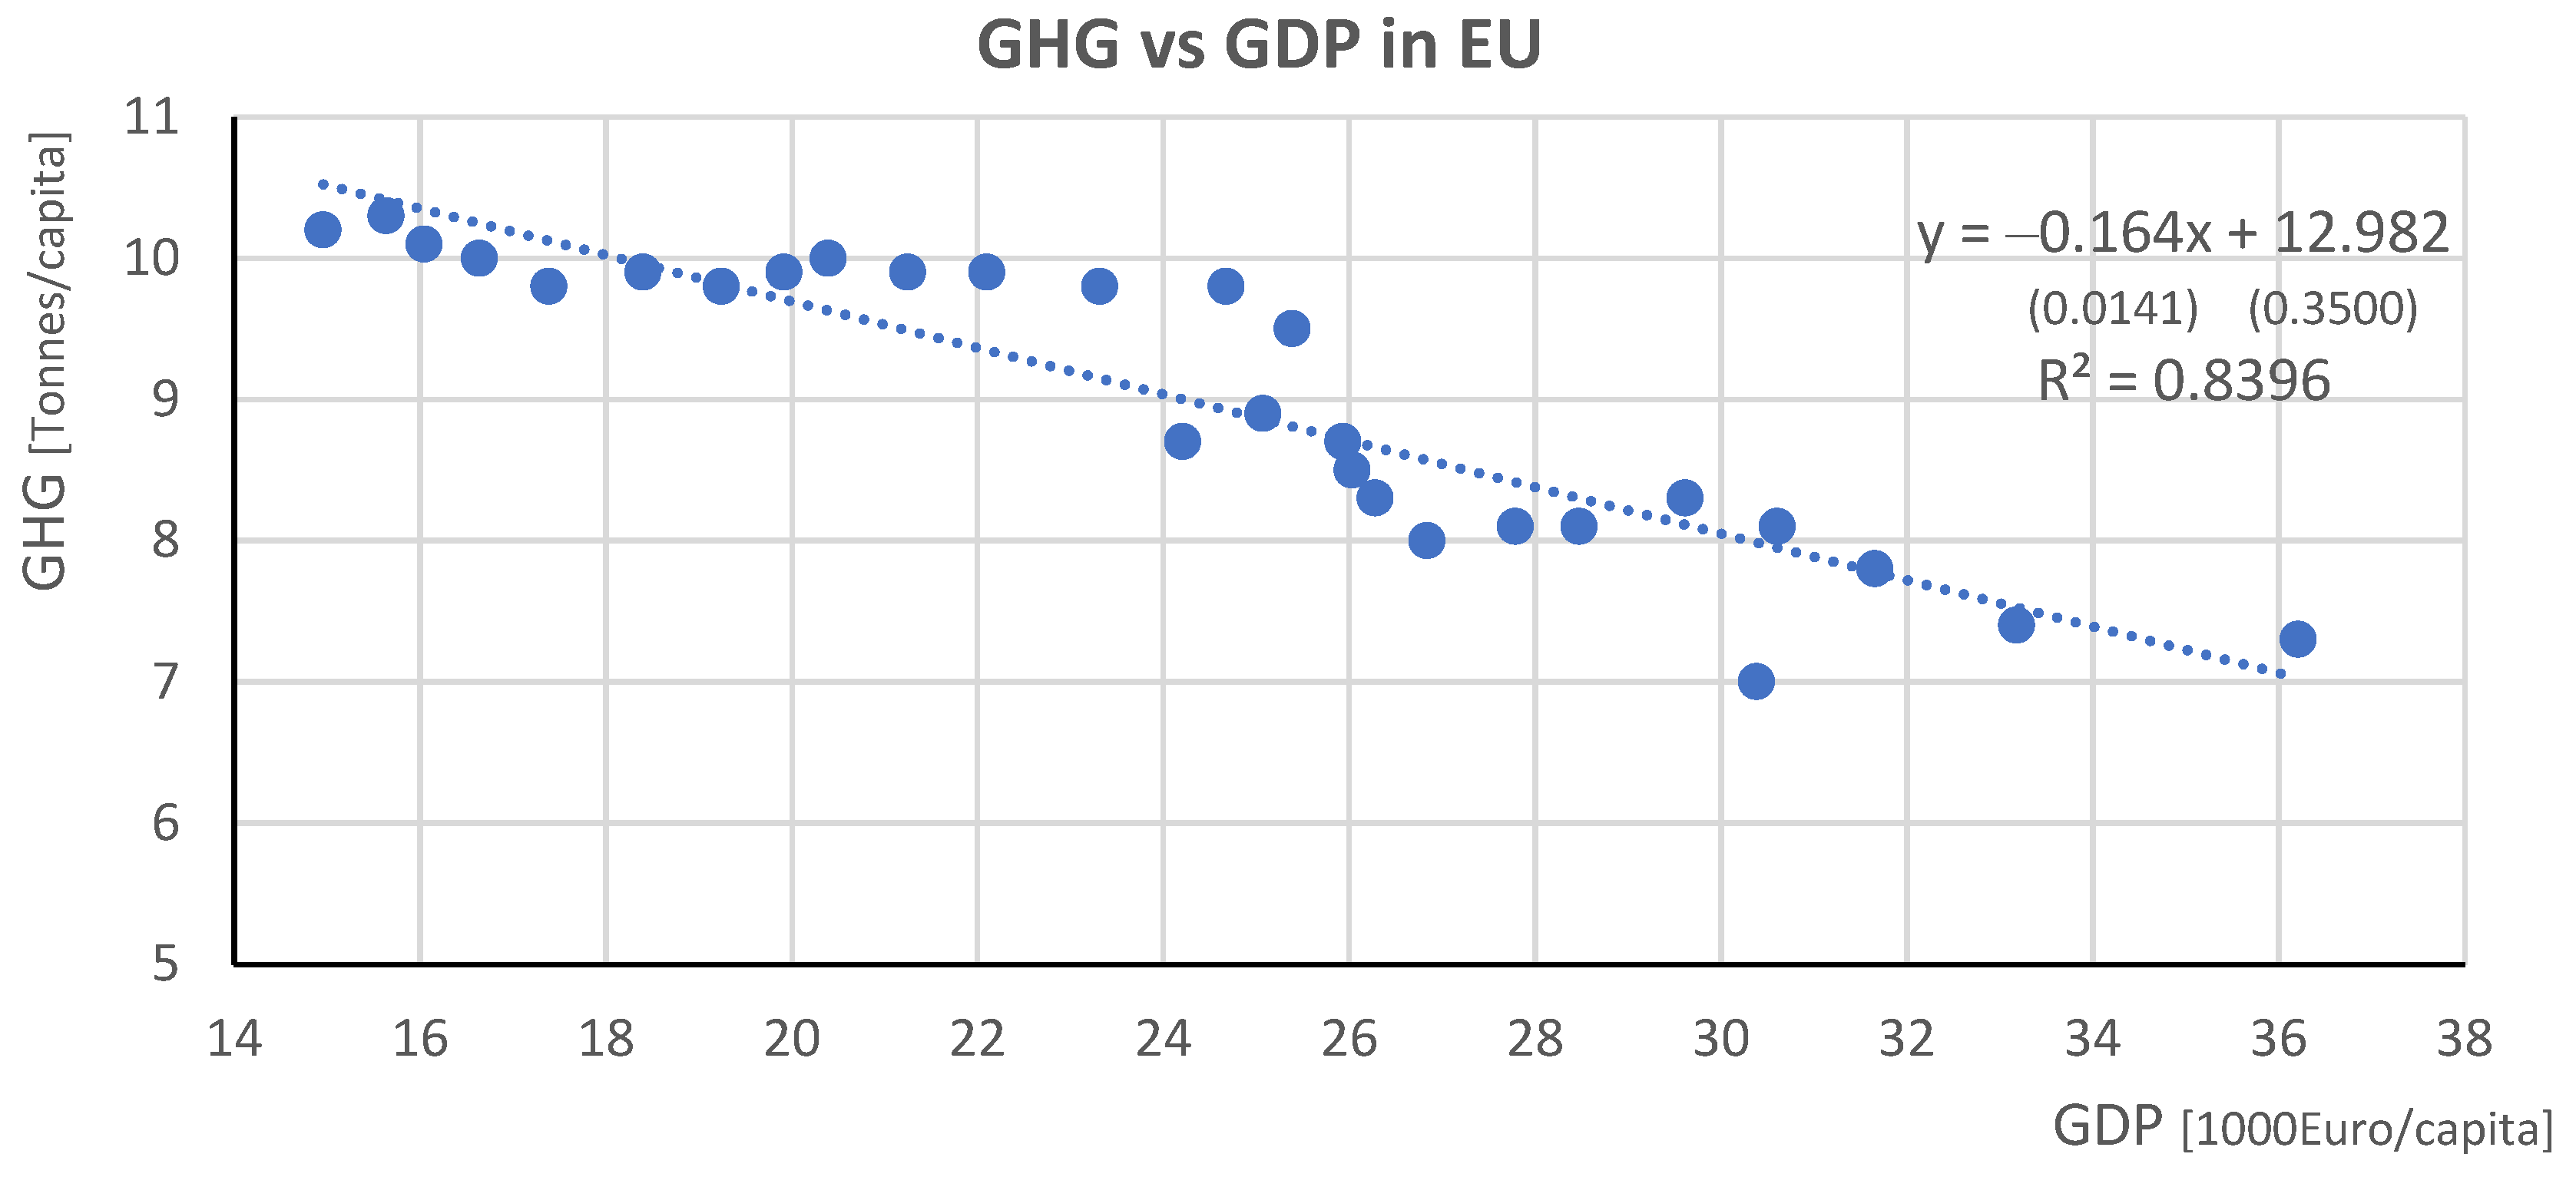
In the next step, to test hypothesis H1, we examined whether there was a correlation between the level of GDP per capita and the amount of GHG emissions. As a result, the Pearson correlation coefficient was obtained at r = −0.92 (
p-value = 0.000), indicating a significant negative correlation between the study variables. A scatter plot of the variables in question with the regression line plotted has been provided in
Figure 6.
The estimated regression line explained 84% of the variability (R2 = 0.84, F = 136.1, p-value = 0.000). Interpreting its slope showed that each increase in GDP by an average of 1000 euros/capita was accompanied by an average decrease in emissions of 0.164 tons per person. This might indicate that an affluent society may be paying more attention to environmental protection.
In contrast, a correlation between GHG and GDP was not present during the period considered in Poland, as the correlation coefficient, which amounted to −0.32, was insignificant (p-value = 0.096 > 0.05). Thus, hypothesis H1a was rejected.
Table 4 summarizes the correlation coefficients of GDP and GHG emissions for all 27 EU countries for comparison.
This time, the relationship studied was insignificant in seven countries (Austria, Estonia, Finland, Greece, Lithuania, Poland, and Portugal).
3.4. Final Fossil Fuel Consumption and Its Impact on GHG Emissions
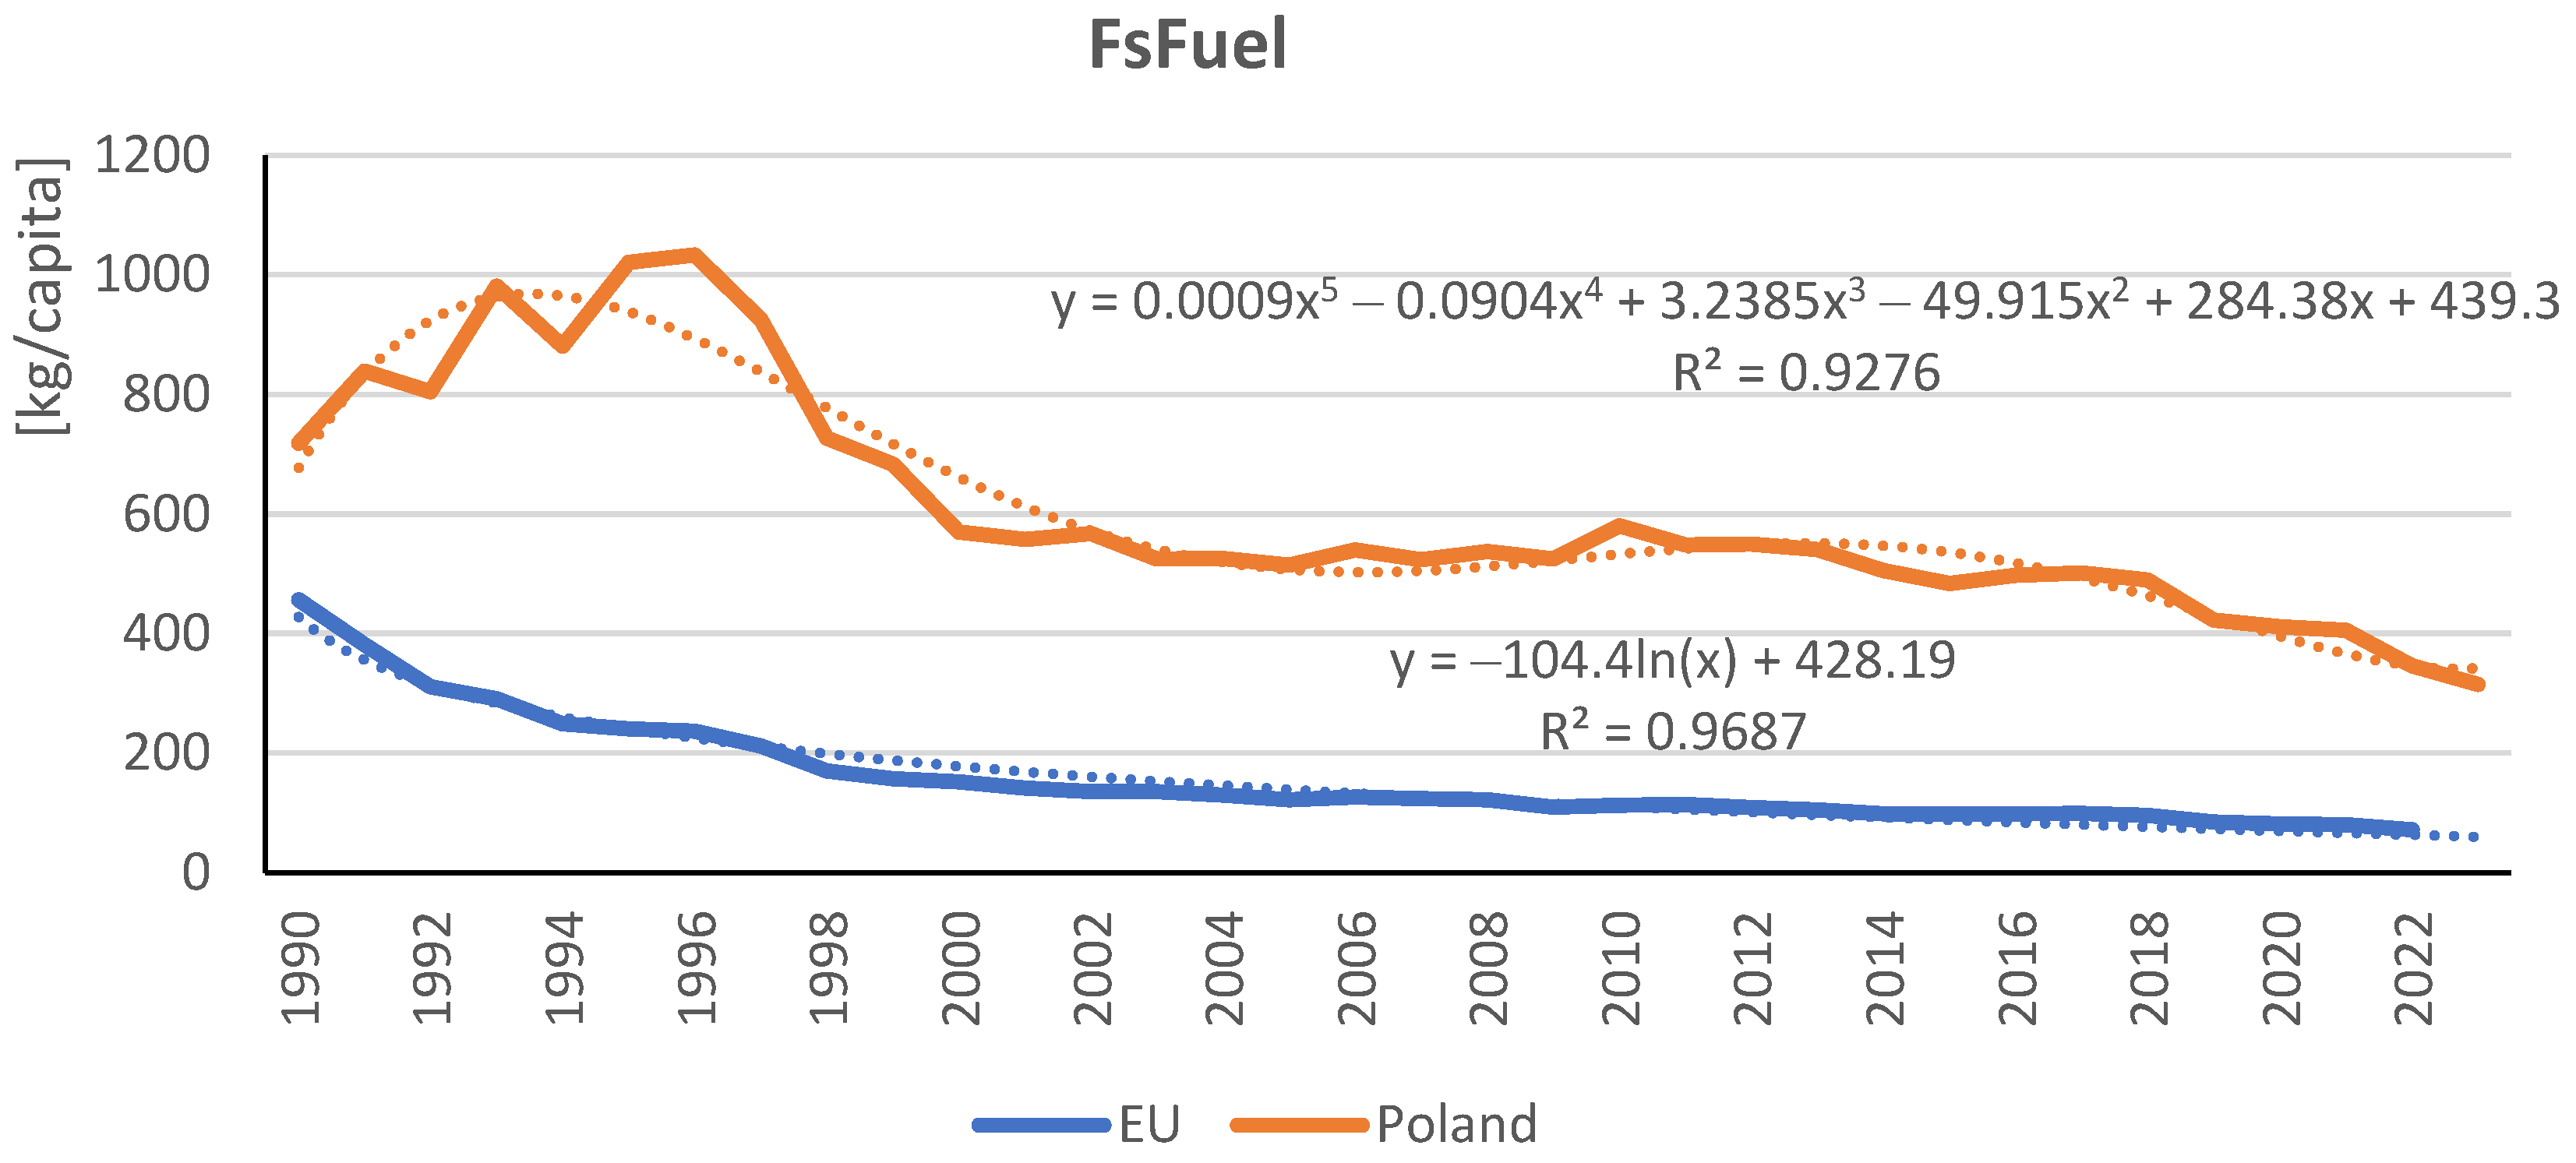
The following analysis looked at the final consumption of fossil fuels and its impact on the phenomenon under study. The consumption of fossil fuels in the EU countries ranged from 71.64 to 465.55 kg per capita. In Poland, on the other hand, it was from 315.25 to 1033.43 KG/person. At the same time, the volume decreased over time. In the EU, by an average of 5.6% year on year (84% in total), and in Poland, by 2.5% year on year (56% in total).
Figure 7 presents the study variable for the EU and Poland.
Regarding the EU, the final consumption of fossil fuels followed a logarithmic trend (R2 = 0.97, F = 960.3, p-value = 0.000). In contrast, the situation in Poland itself was different. After an initial increase in this consumption (until approximately 1996), it fell sharply, remaining relatively flat for some time (from 2000) before starting to fall slightly again (from around 2013). Due to this turbulence, the best-fitting trend for this period appeared to be a polynomial trend of the 5th degree (R2 = 0.93, F = 71.7, p-value = 0.000).
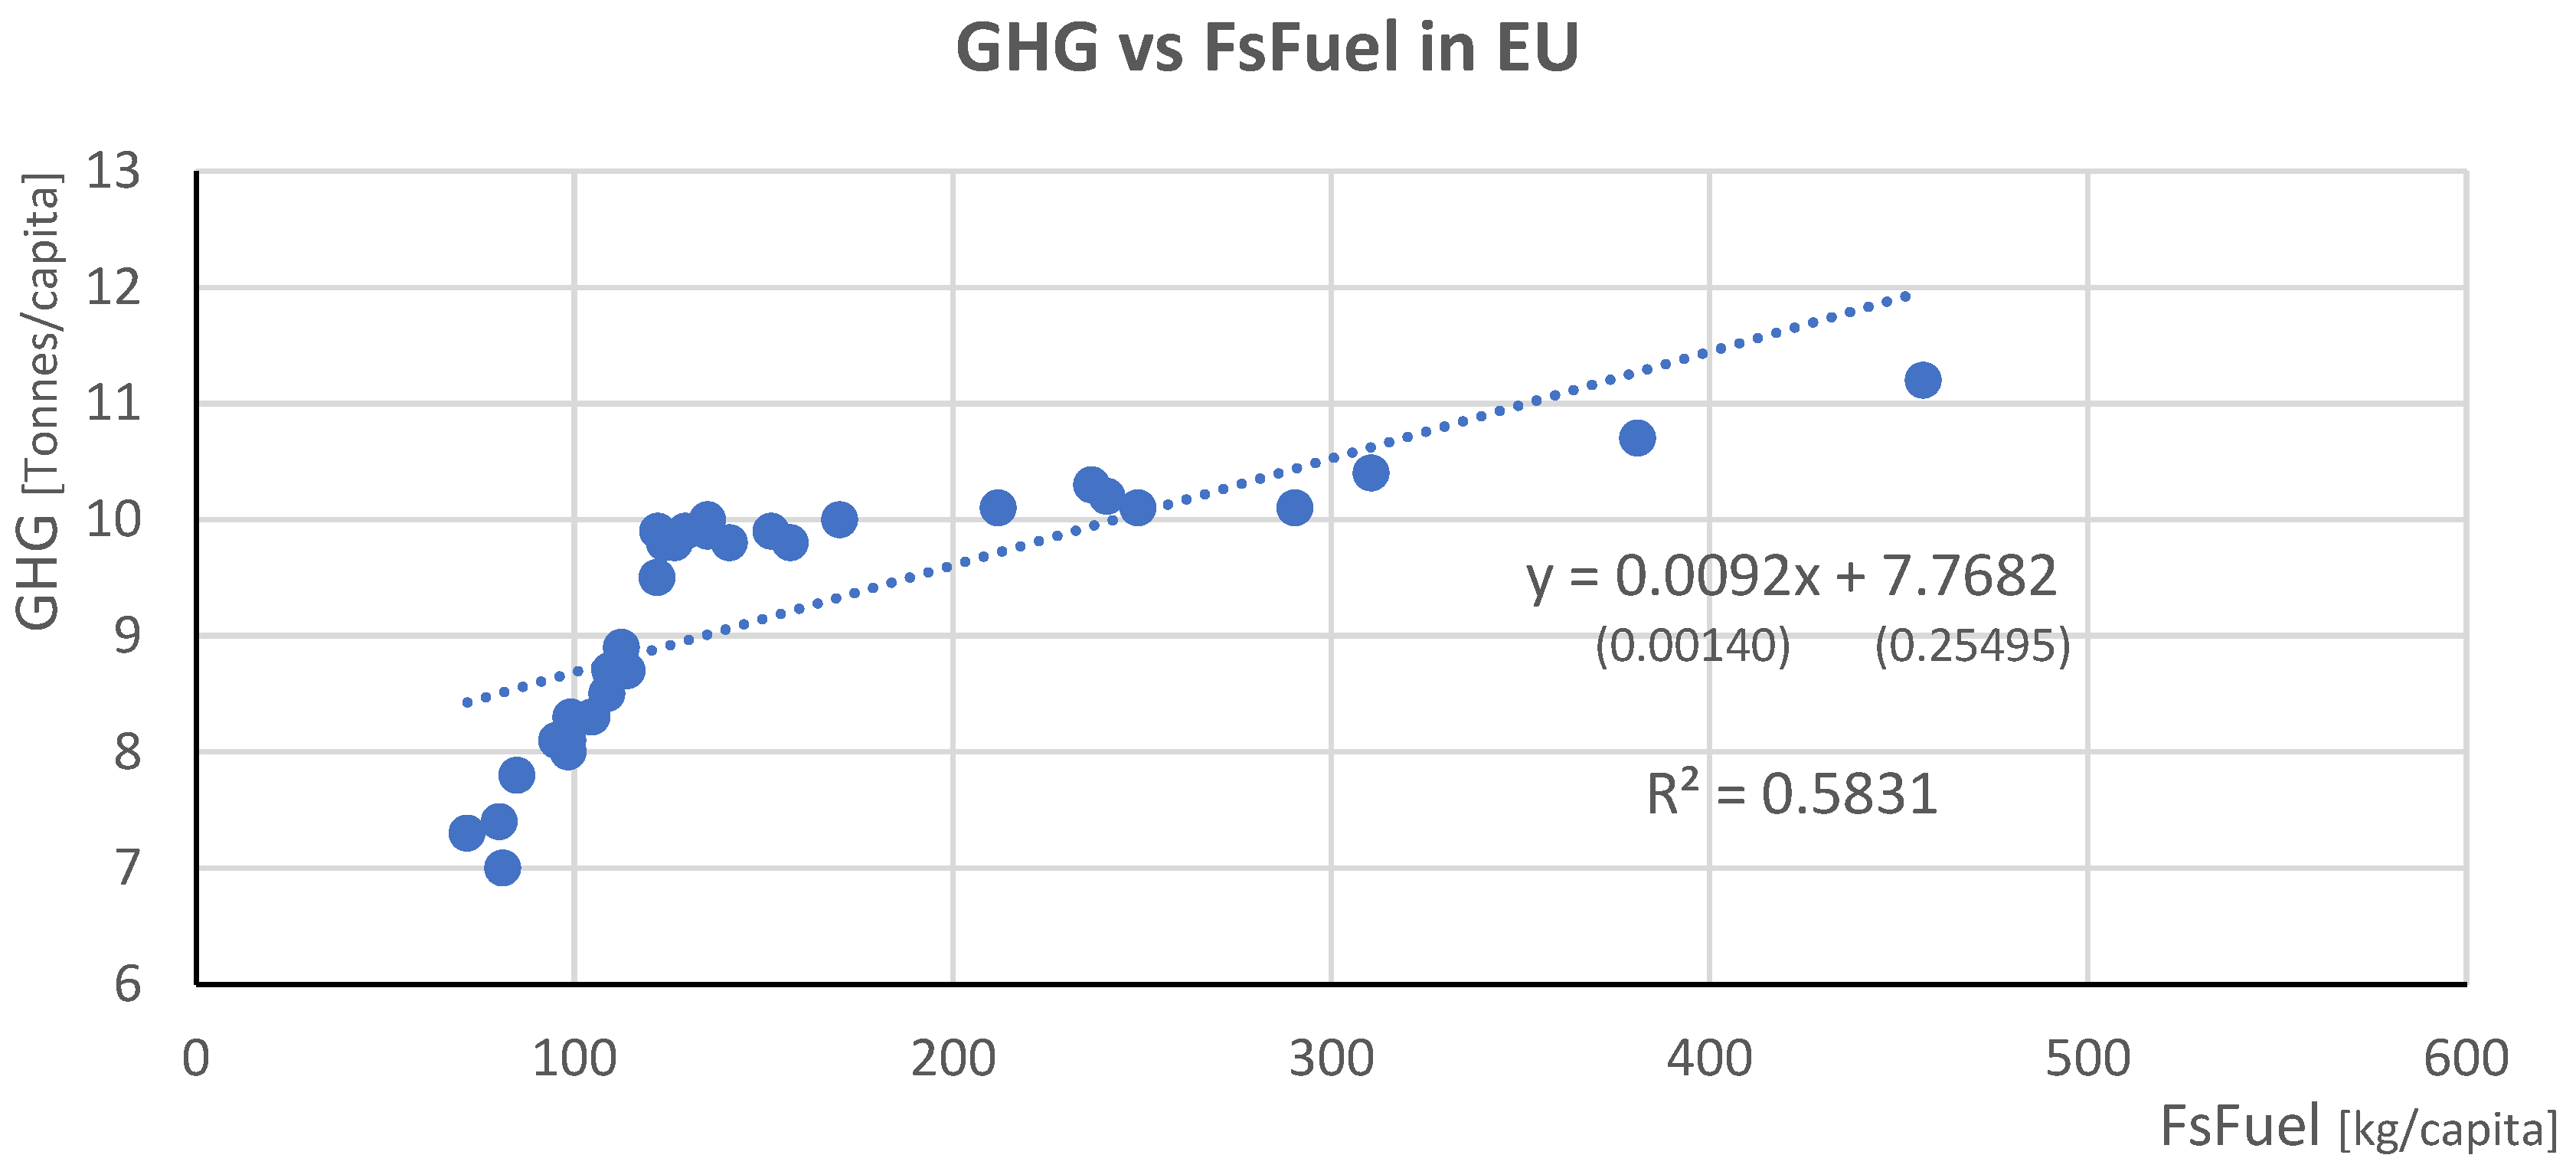
Pearson’s linear correlation coefficients for the EU and Poland confirmed a high positive significant relationship (EU: r = 0.76, p-value = 0.000; PL: r = 0.79, p-value = 0.000). As a result, hypotheses H2 and H2a were confirmed.
Figure 8 and
Figure 9 show scatter plots of the study variable and GHG emissions in the EU and Poland.
The regression line for the EU only described 58% of the variability (R2 = 0.58, F = 43.4, p-value = 0.000). Consequently, it can be said that its fit was slightly worse than in previous cases. There could likely be a curvilinear relationship here that would describe the phenomenon to a greater extent. On the other hand, and most relevant to this analysis, the graph confirmed a visibly positive relationship. As fossil fuel consumption increased, greenhouse gas emissions also increased.
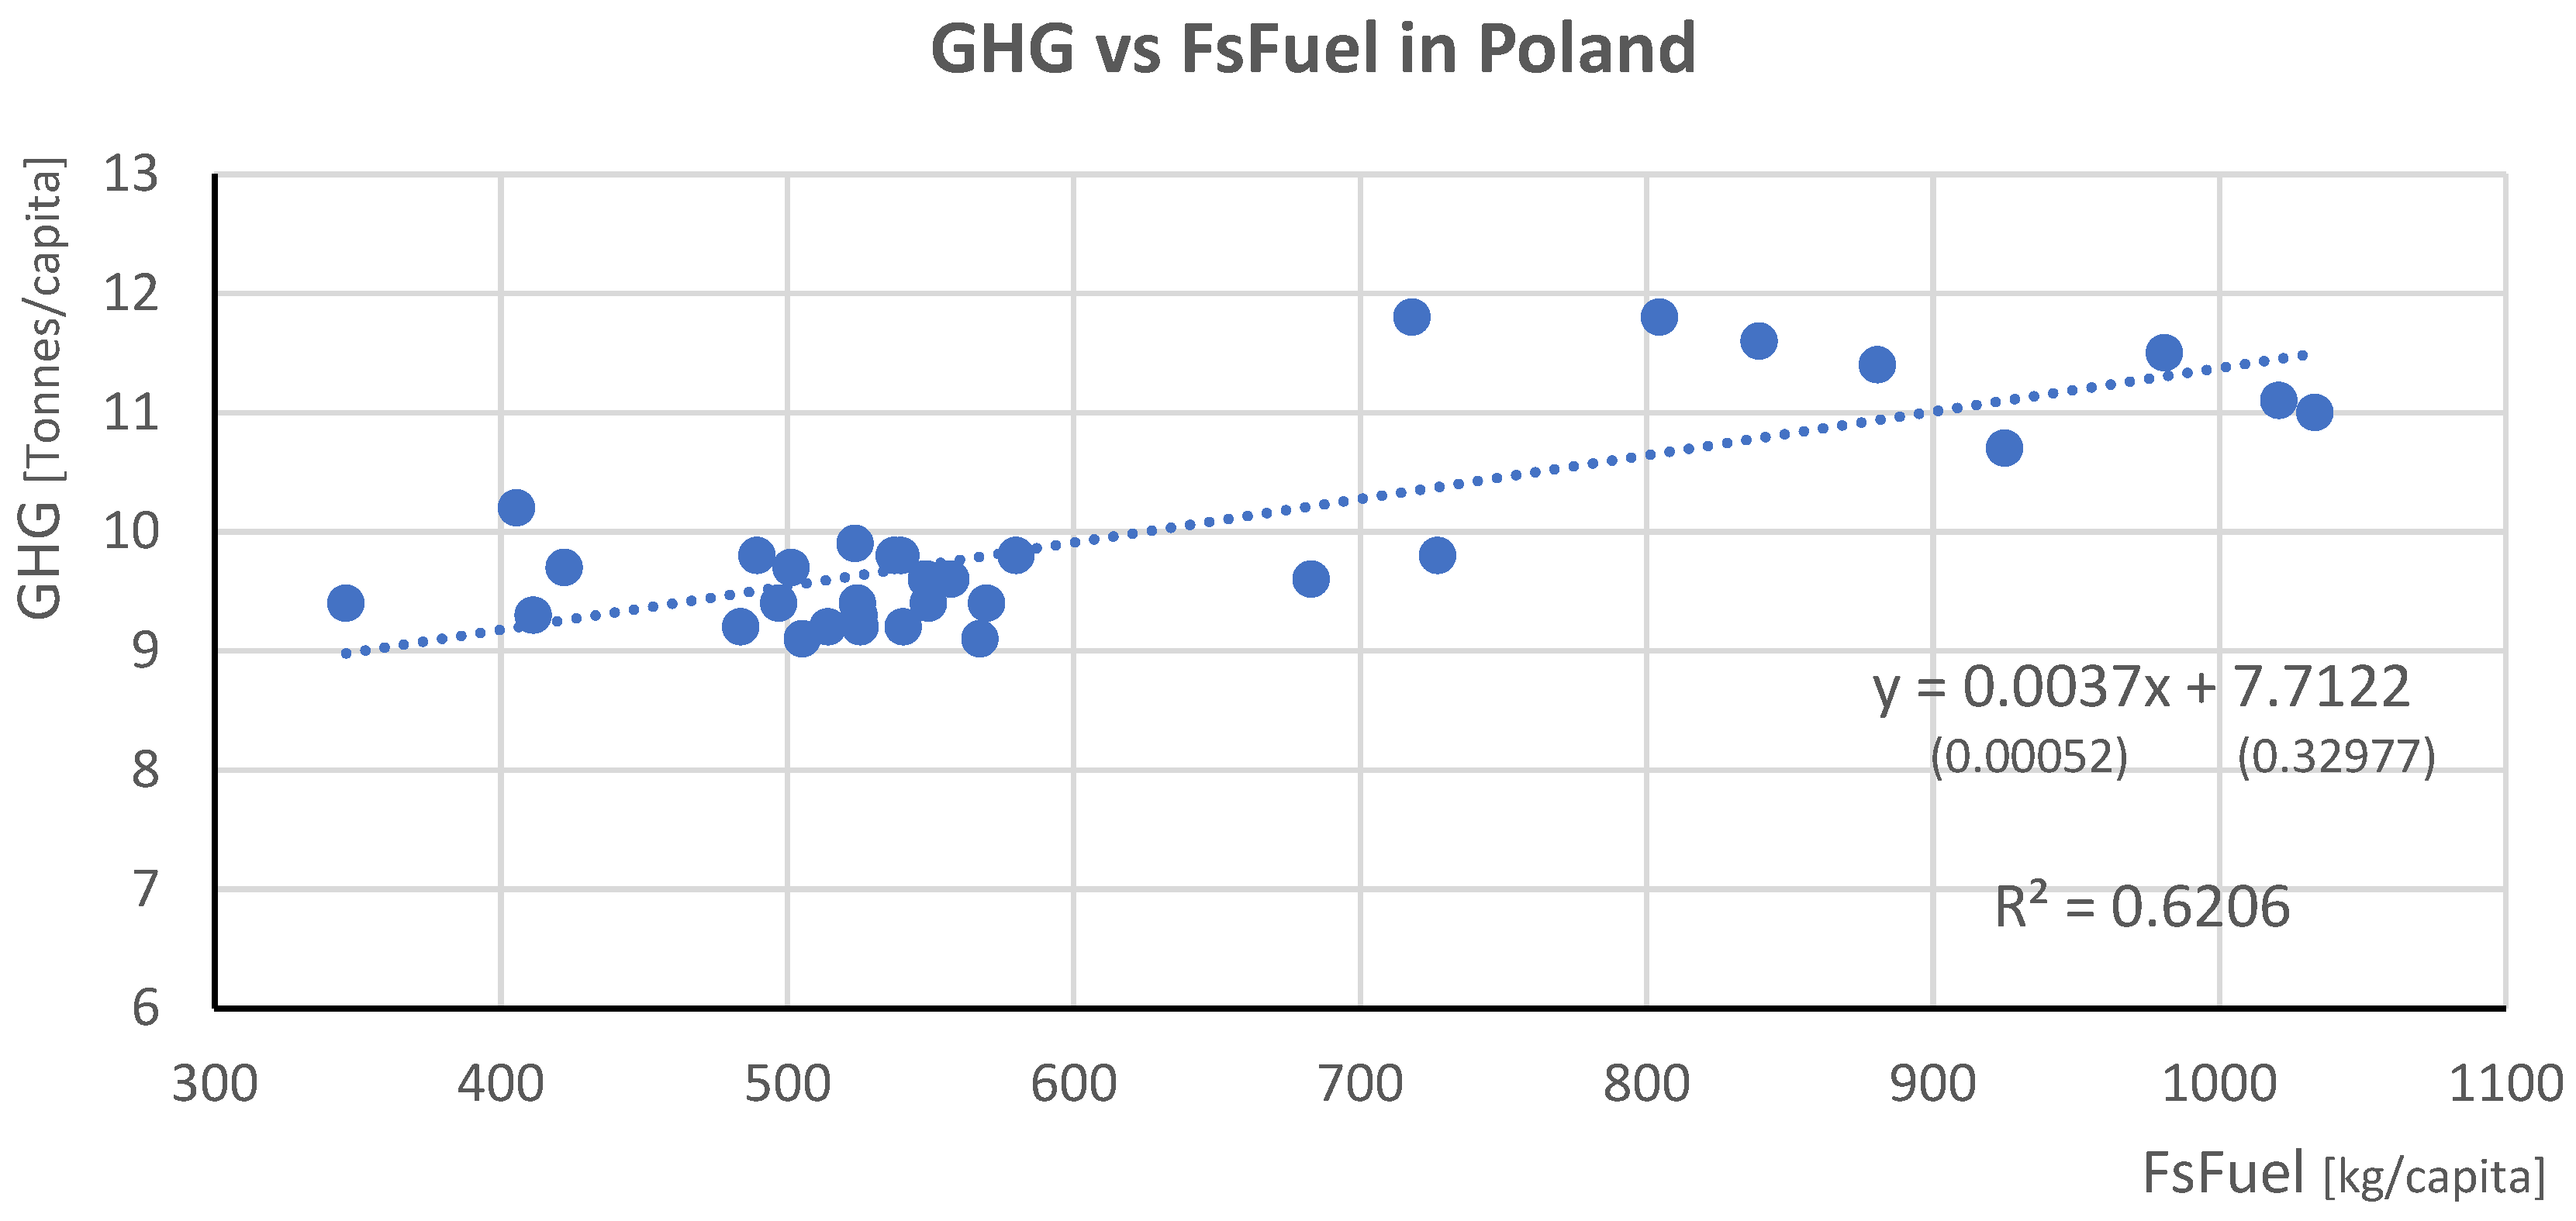
The graph for Poland also revealed the positive nature of the relationship between the variables under study. This time, the regression formula explained 62% of the phenomenon under study (R2 = 0.62, F = 50.7, p-value = 0.000).
The correlation coefficients of final fossil fuel consumption and GHG emissions for all 27 EU countries are summarized for comparison in
Table 5.
This time, in as many as 10 countries, the correlation between the variables studied did not occur. These include Austria, Bulgaria, Croatia, Cyprus, Finland, Latvia, Malta, Slovenia, and Spain.
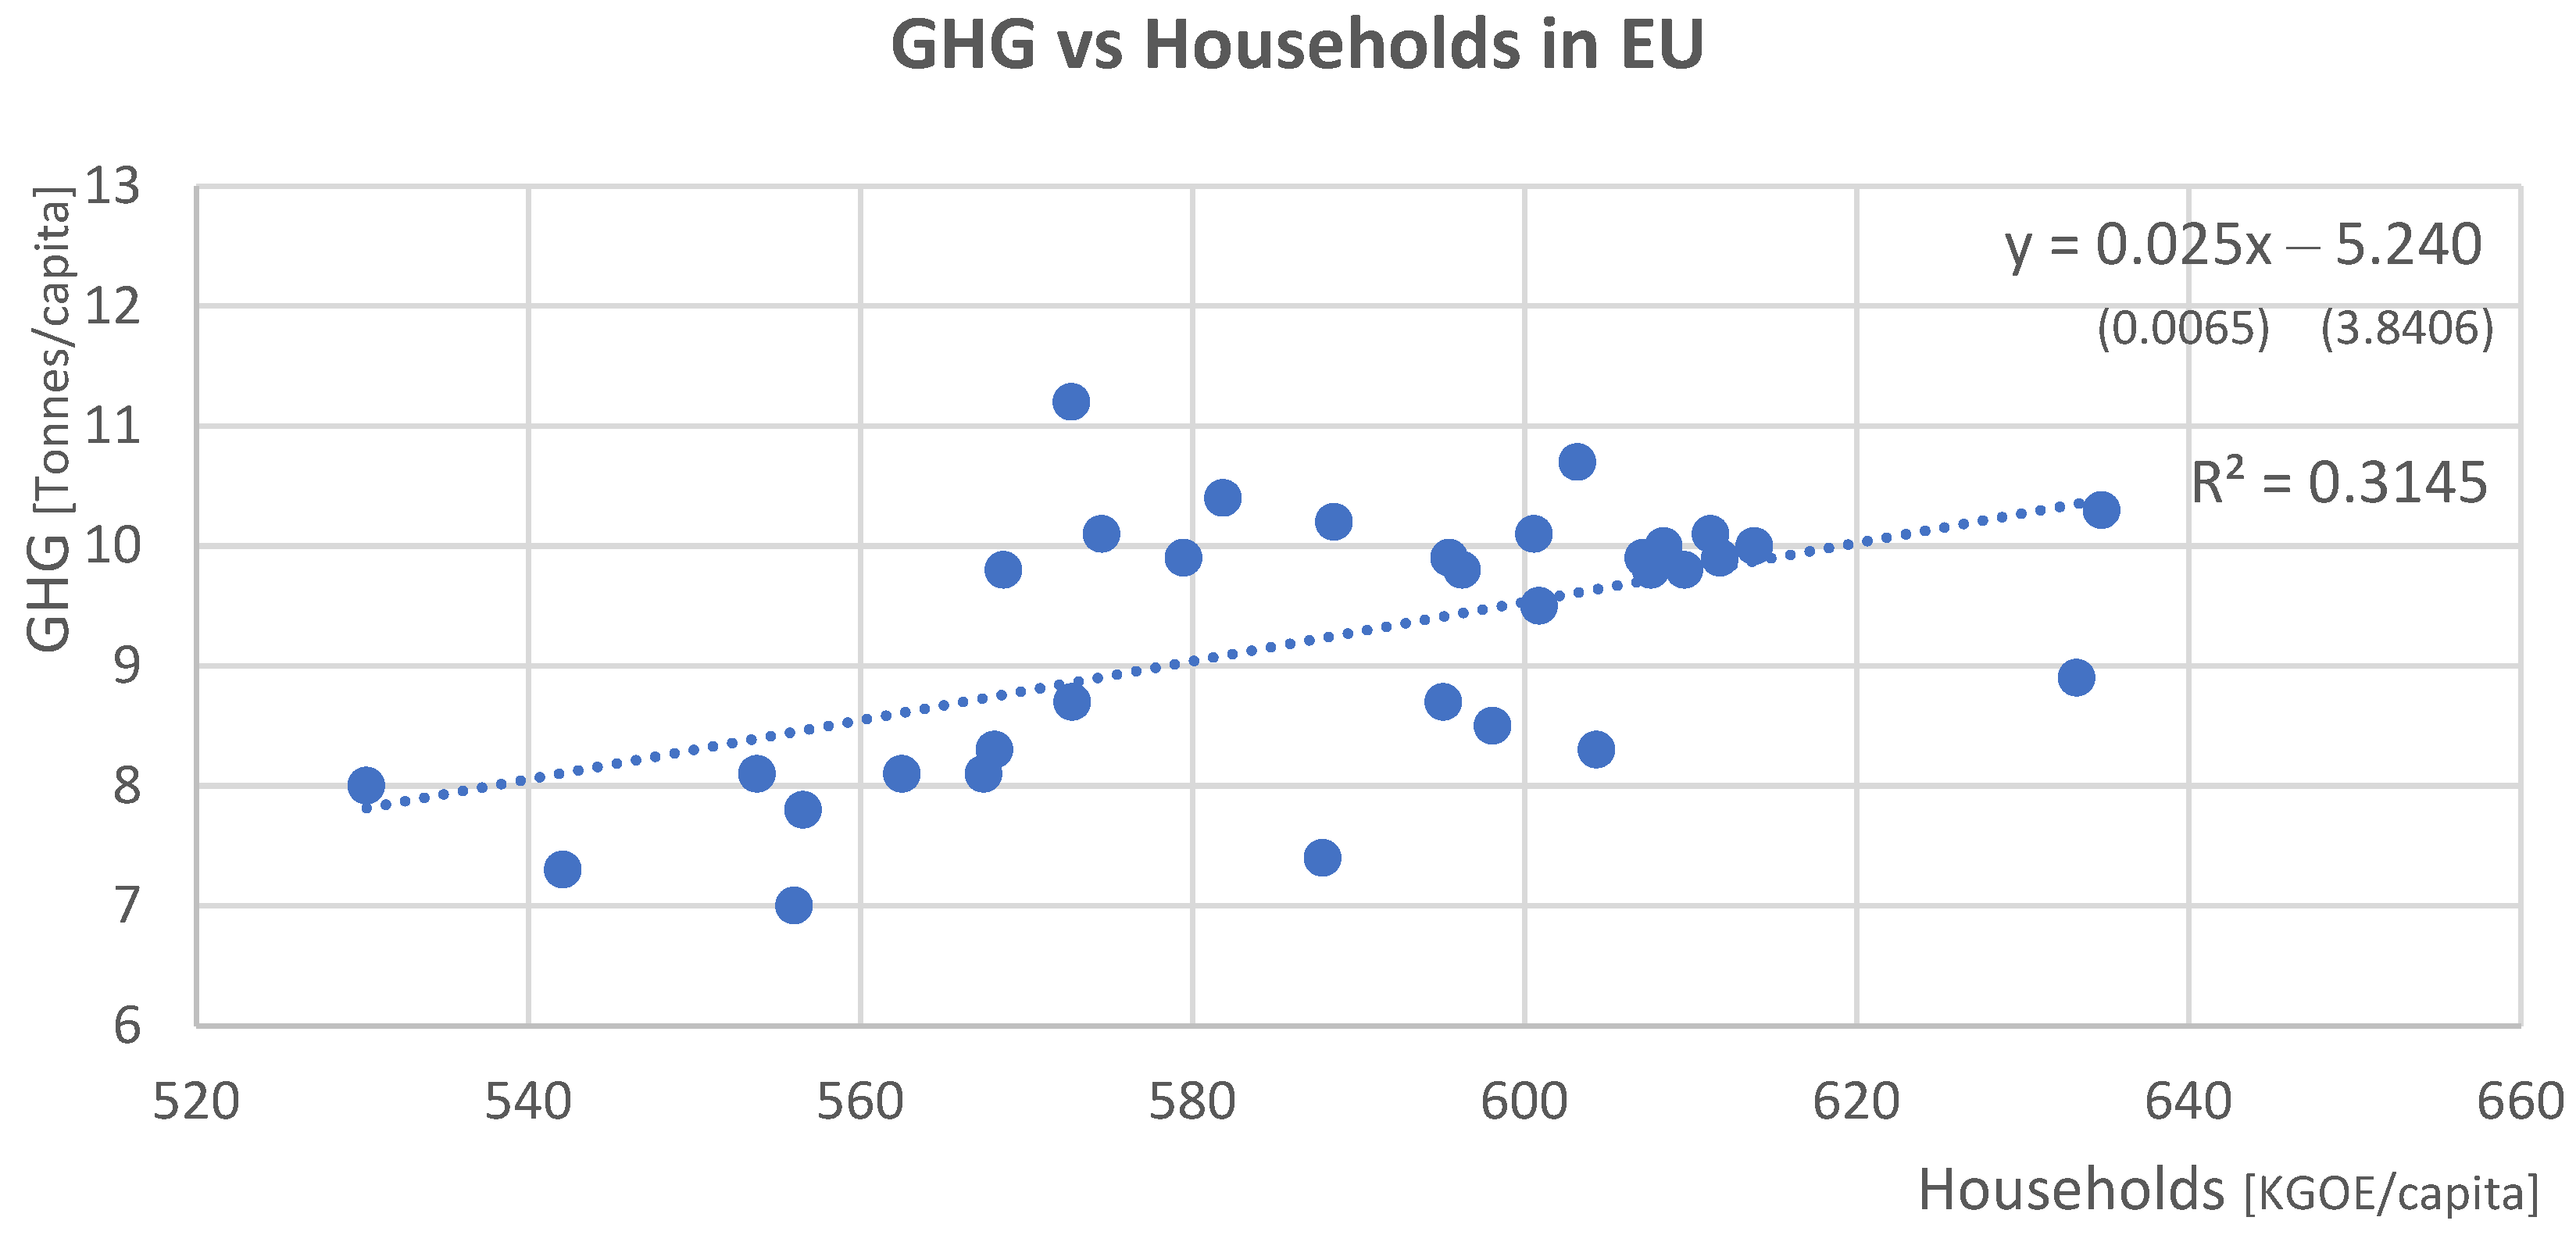
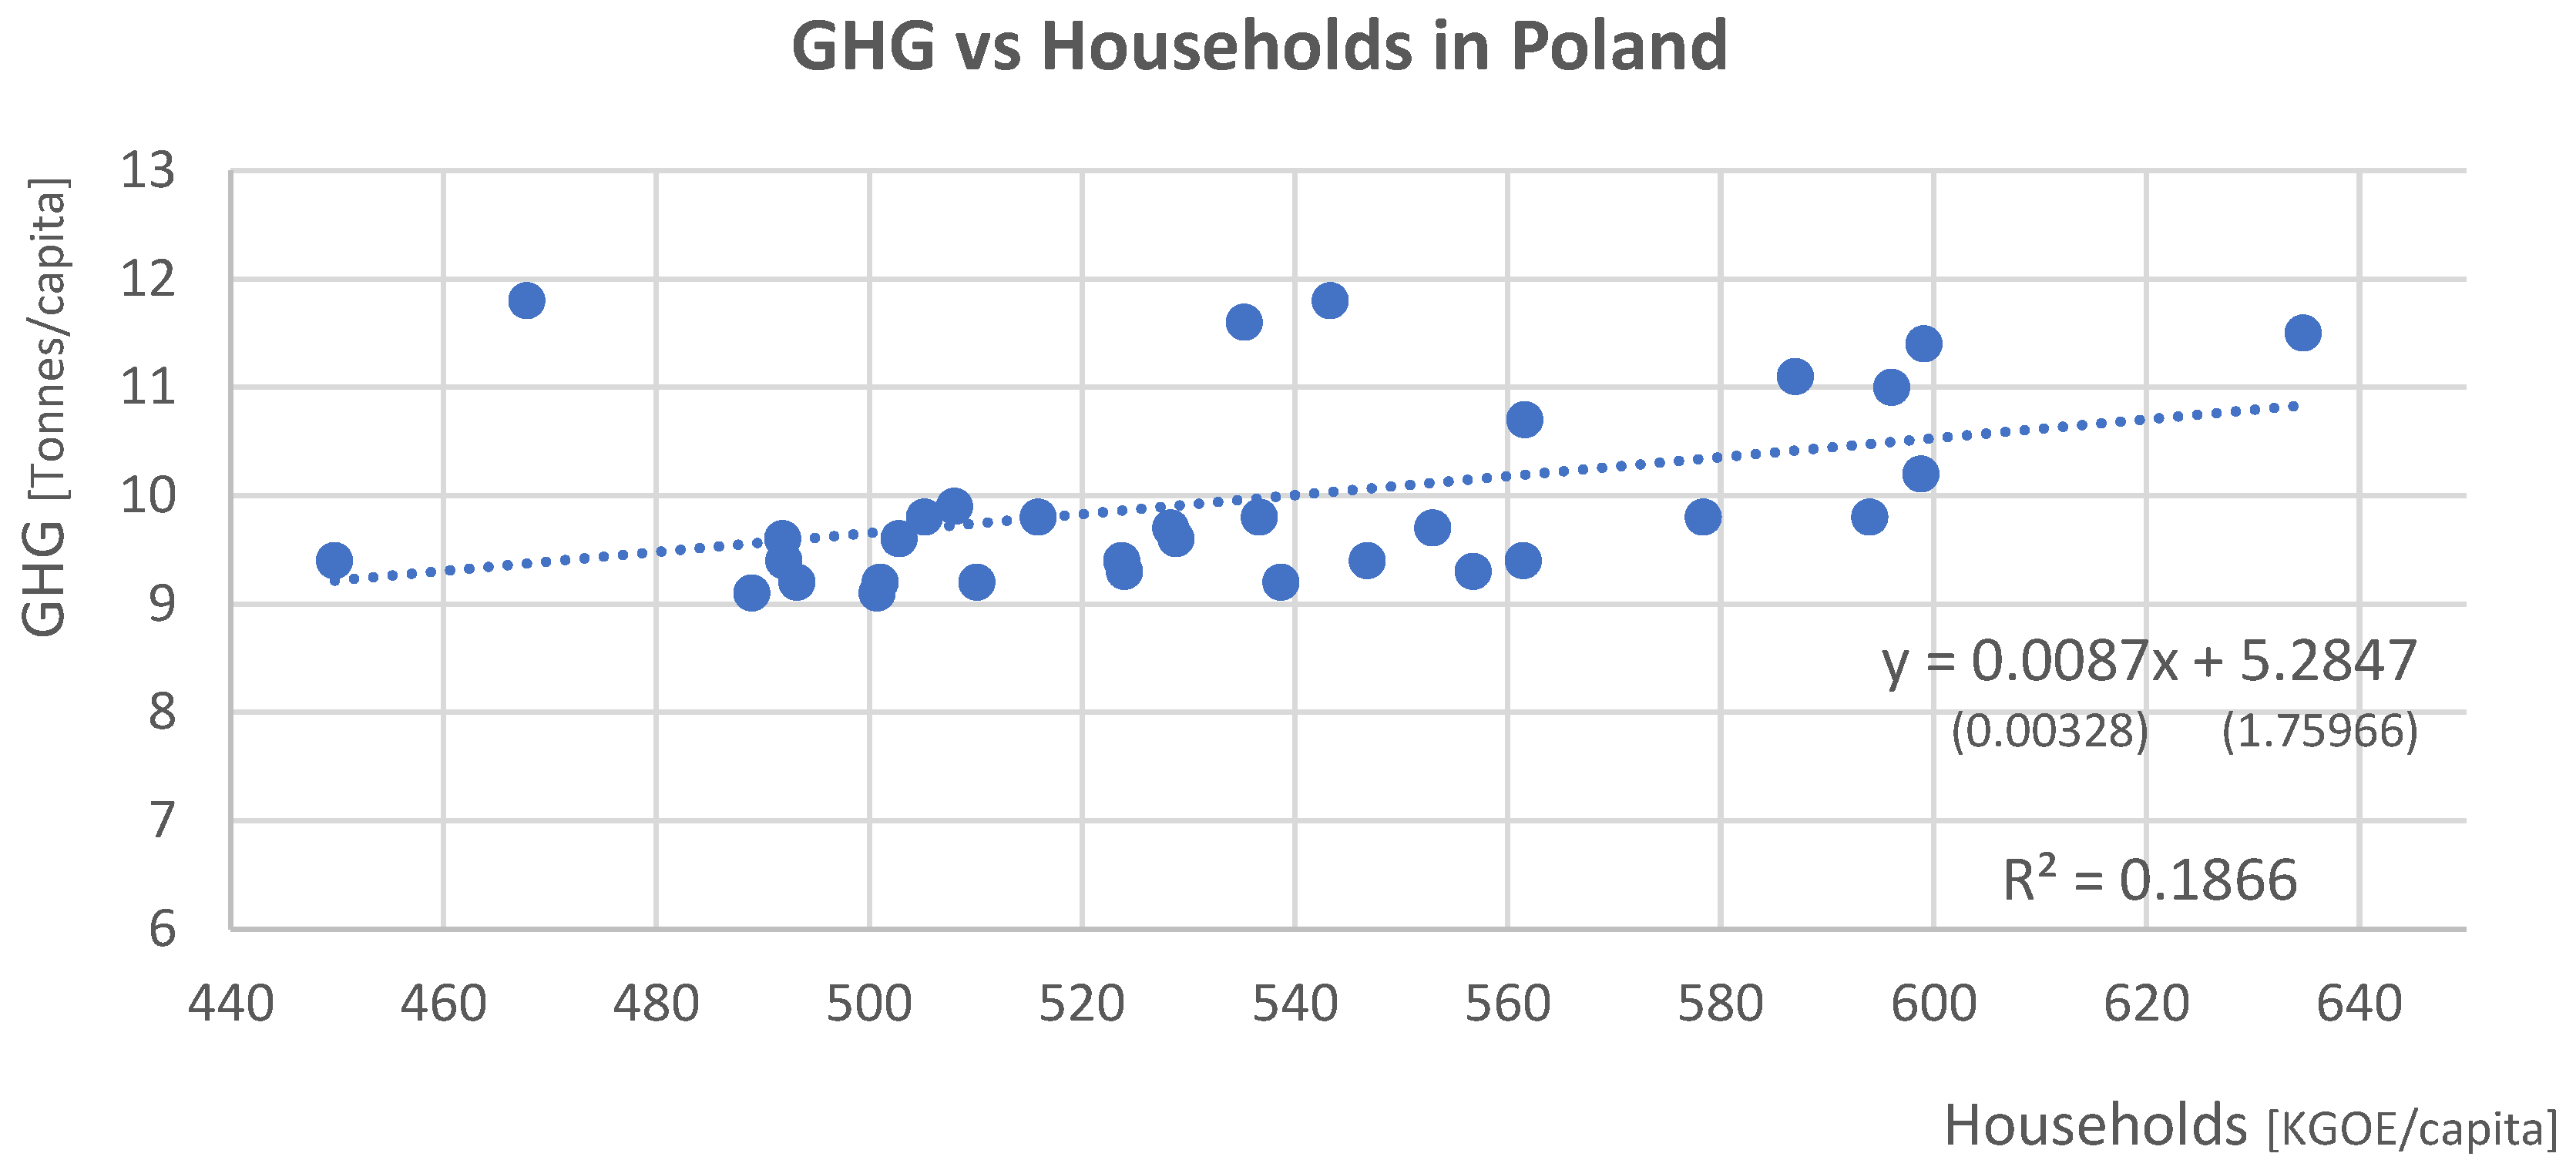
3.5. Final Energy Consumption in Households and Its Impact on GHG Emissions
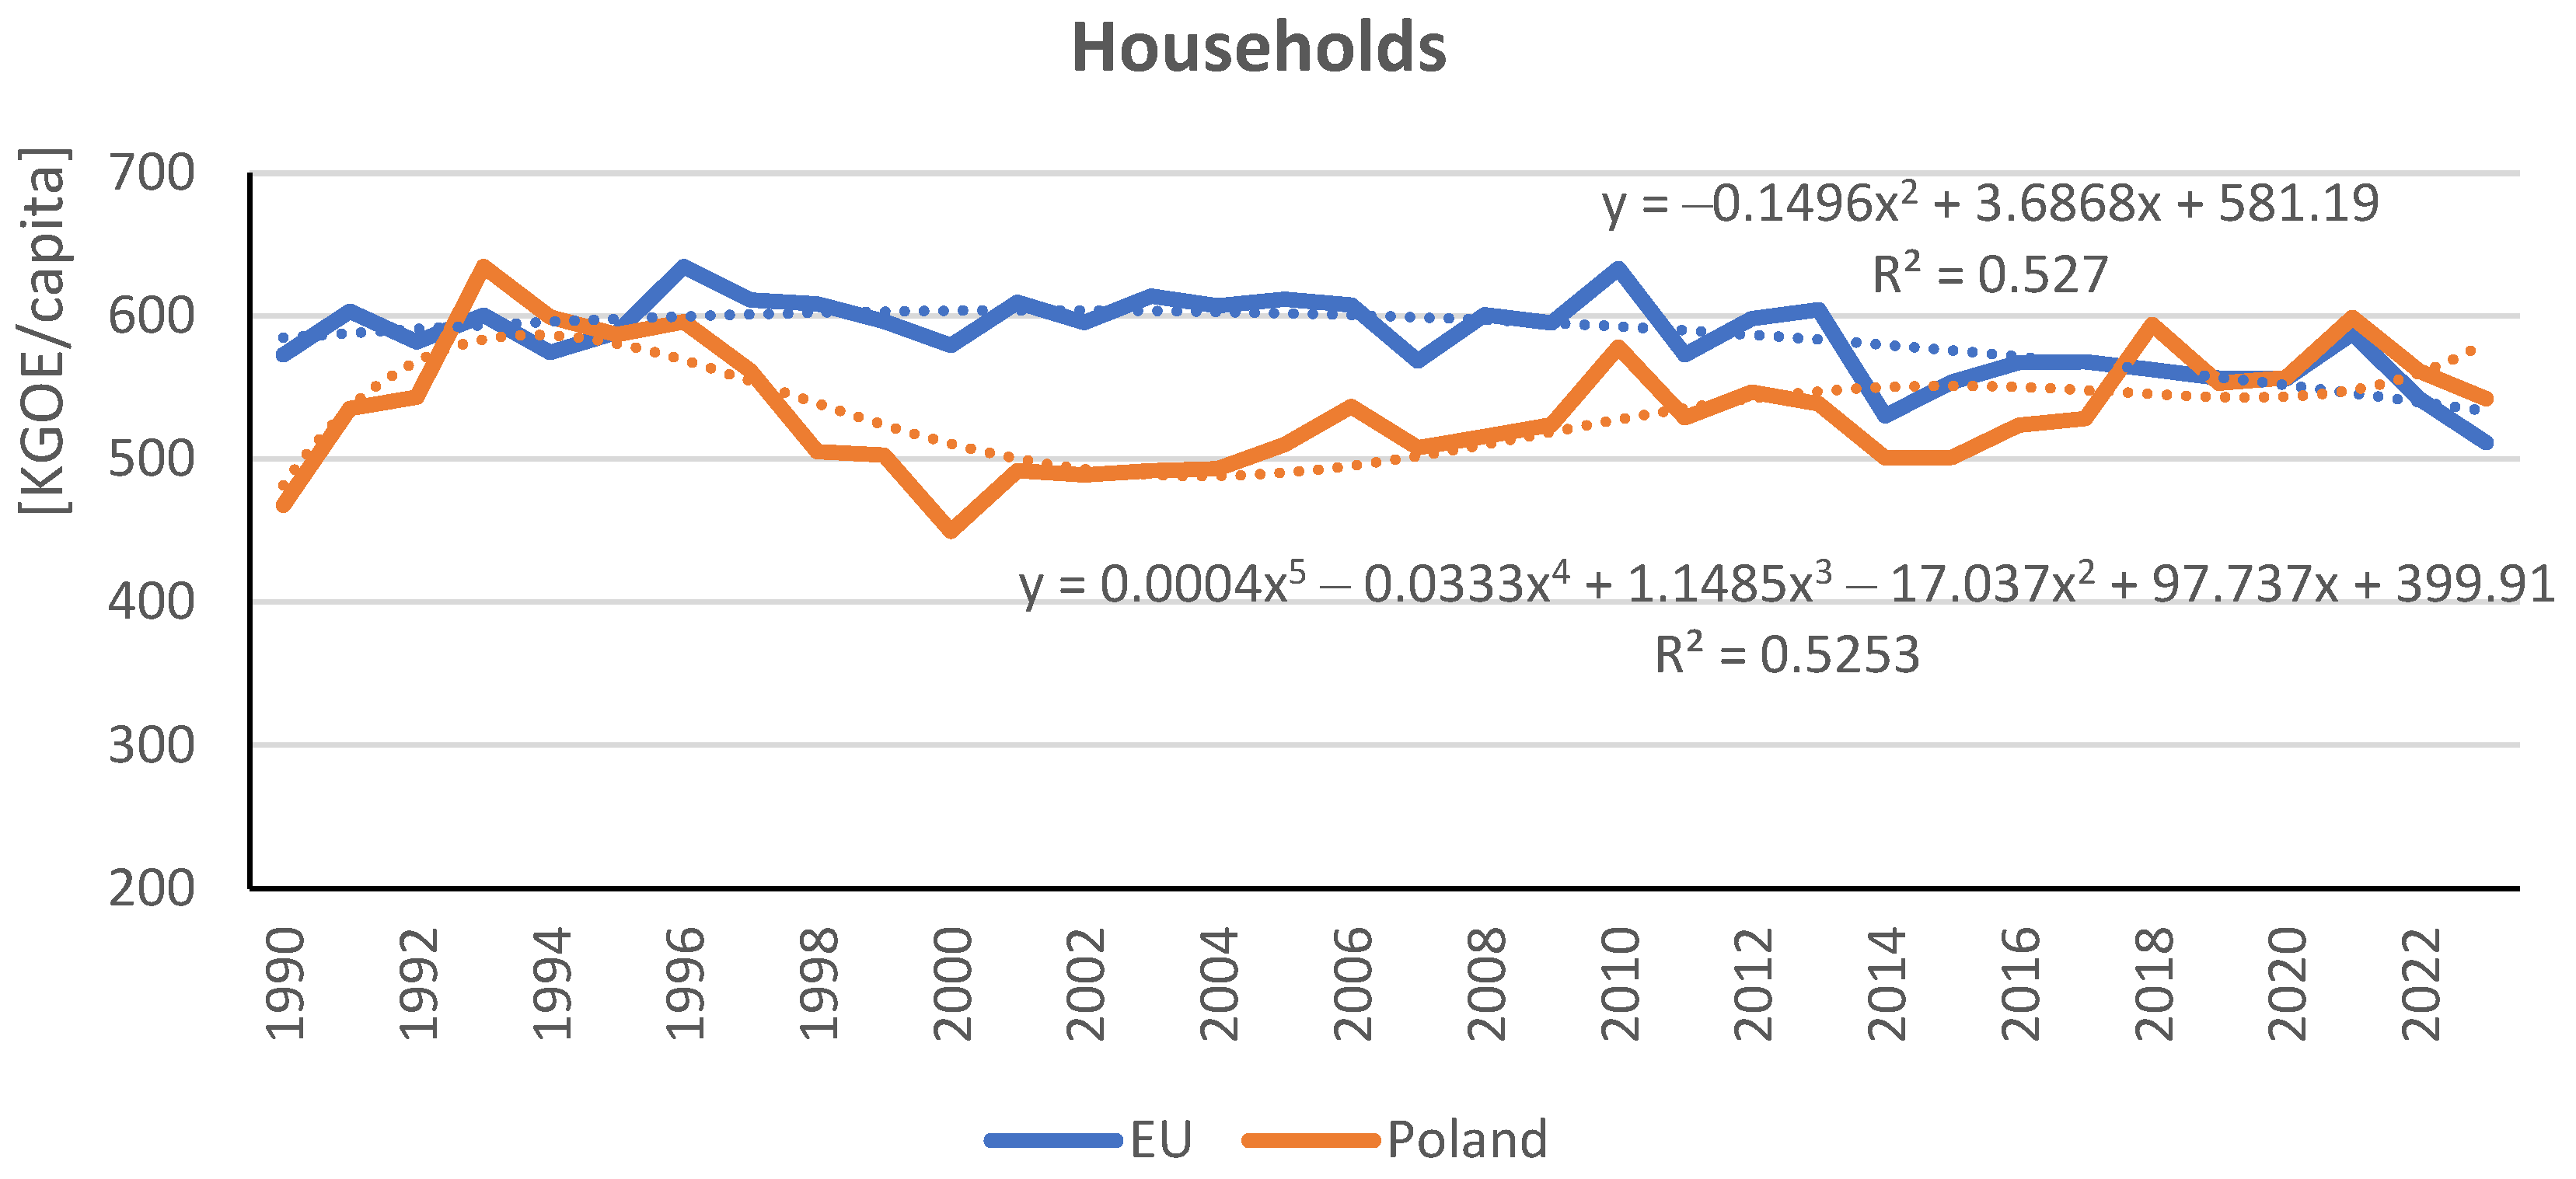
Household final energy consumption was identified as another variable suspected of influencing emissions.
Figure 10 shows how this variable changed (per capita) in all EU countries and Poland.
In the EU, household energy consumption ranged from 511.61 to 634.77; in Poland, it ranged from 449.78 to 634.77. At this point, household energy consumption showed very low variability in the EU countries (4.8%; Poland: 7.8%). Therefore, no increasing or decreasing trends could be distinguished. The best-fitting trends here were for the EU a quadratic trend (R
2 = 0.53, F = 17.3,
p-value = 0.000), and for Poland a 5th-degree polynomial trend (R
2 = 0.53, F = 6.2,
p-value = 0.001). Household energy consumption showed a significant positive correlation with GHG emissions (hypotheses H3 and H3a), which was moderate for the EU (r = 0.56,
p-value = 0.001) and low for Poland (r = 0.43,
p-value = 0.012). An attempt was made to calculate the parameters of a regression line as in previous cases (
Figure 11 and
Figure 12).
However, despite the apparent positive correlation, both regression lines do not meet the requirements of a good fit to the empirical data due to too low levels of determination coefficients (EU: R2 = 0.31, F = 14.2, p-value = 0.001, and the intercept is not significant: p = 0.182; PL: R2 = 0.19, F = 7.1, p-value = 0.012).
Table 6 summarizes the correlation coefficients of household final energy consumption and GHG emissions for all 27 EU countries for comparison.
In 11 countries, there was no significant correlation between household final energy consumption and GHG emissions. These include Bulgaria, Cyprus, Czechia, Estonia, Finland, Hungary, Italy, Latvia, Lithuania, Malta, and Spain.
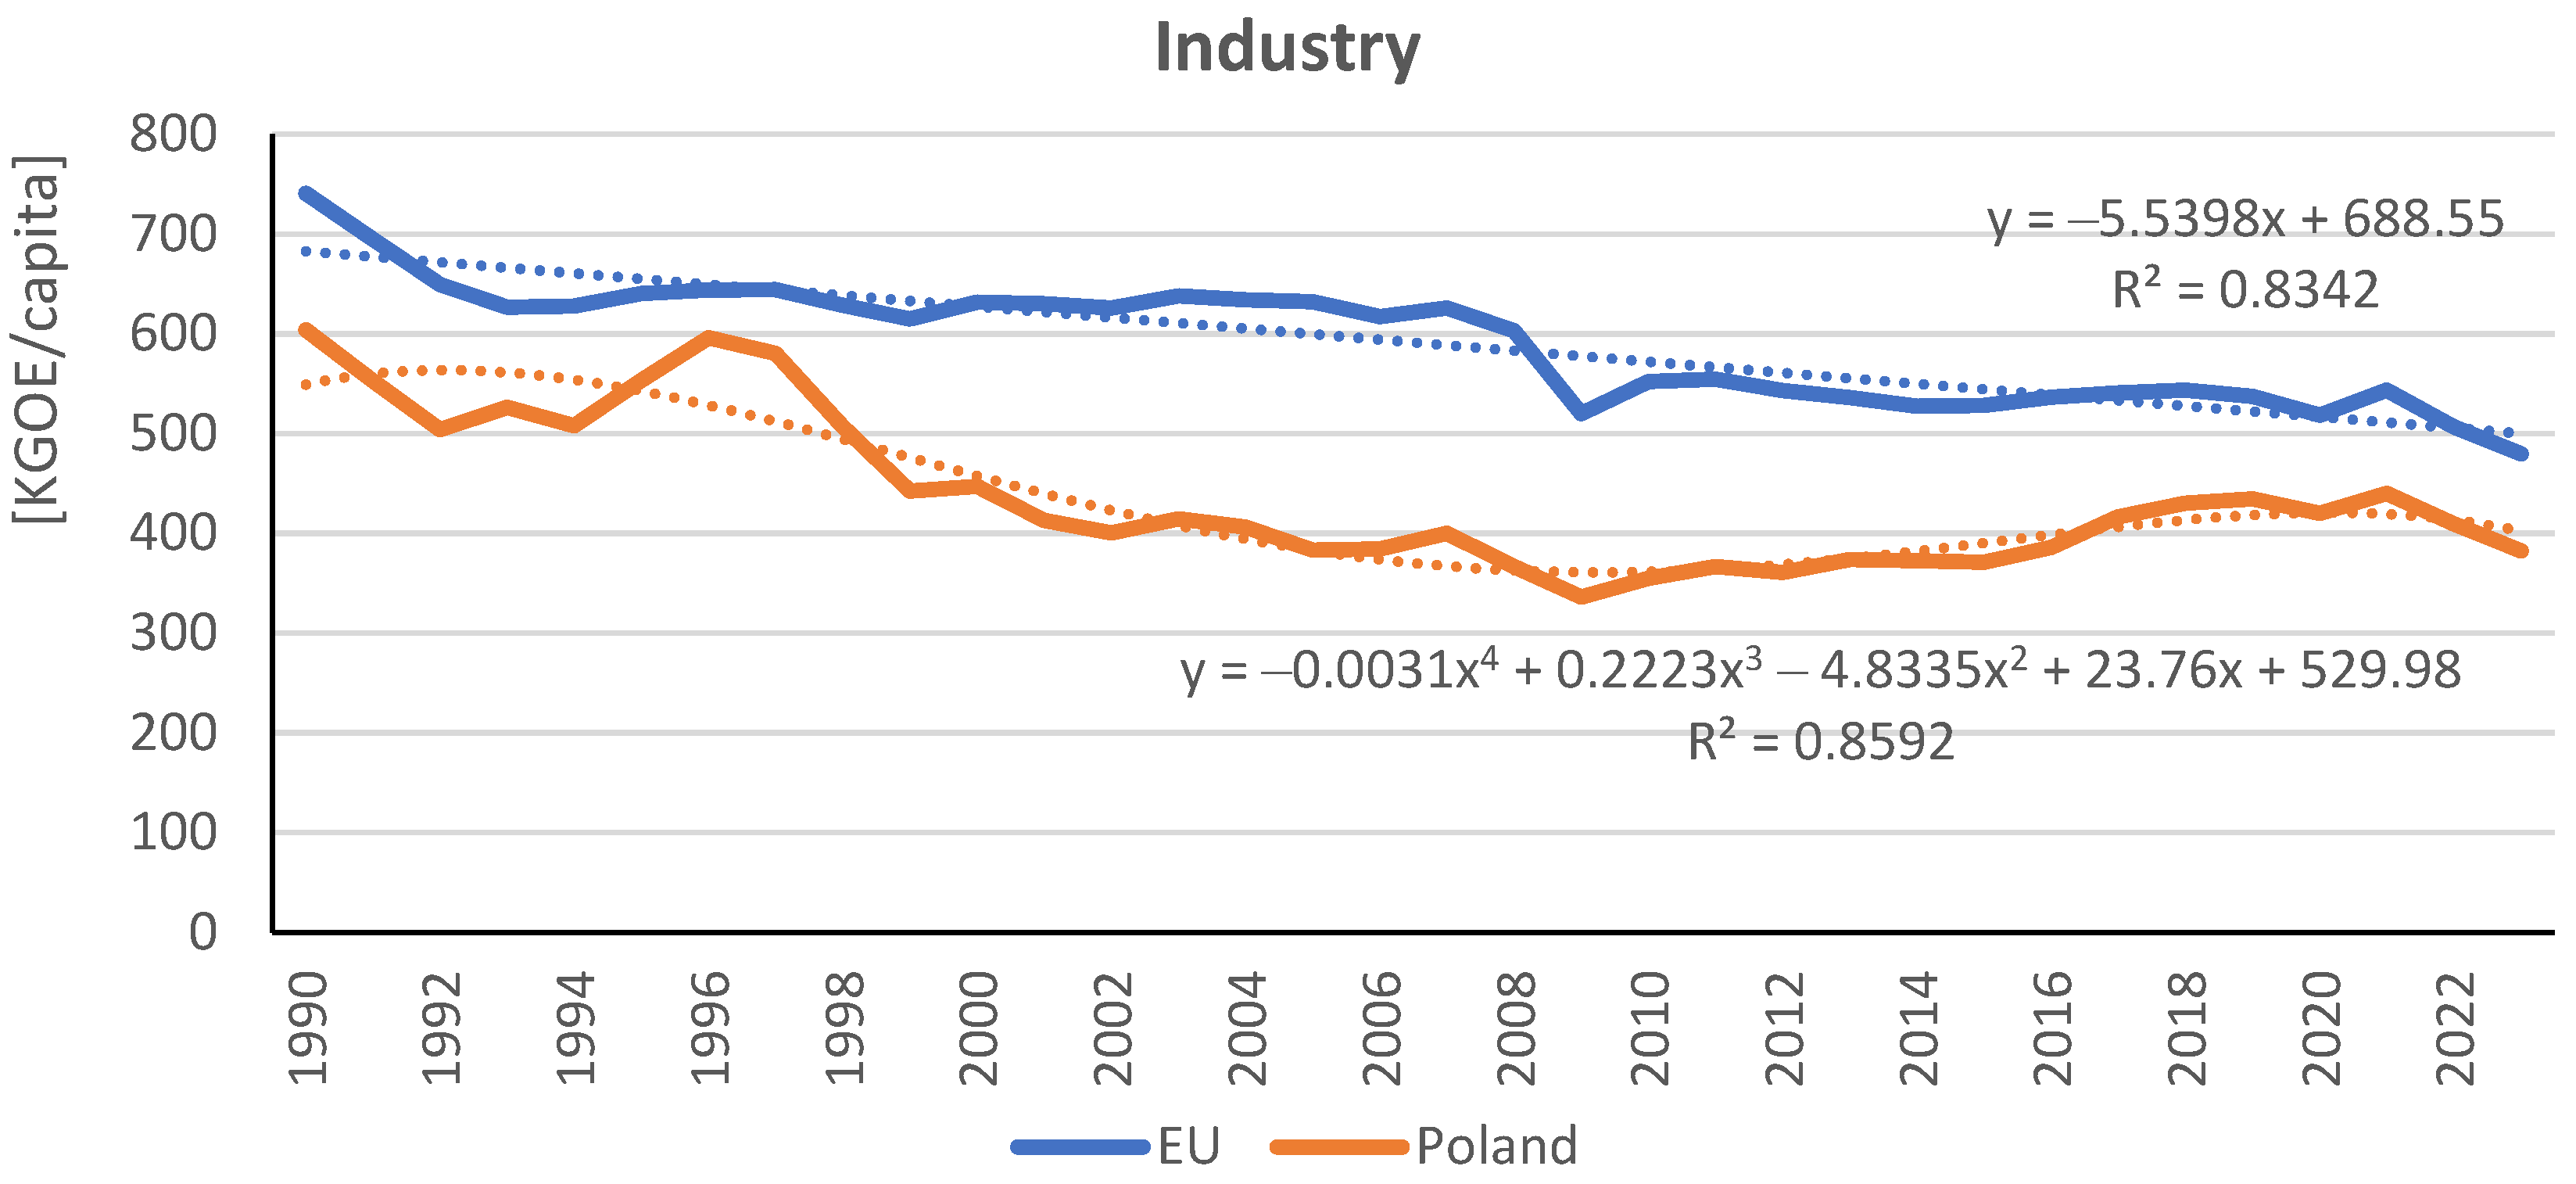
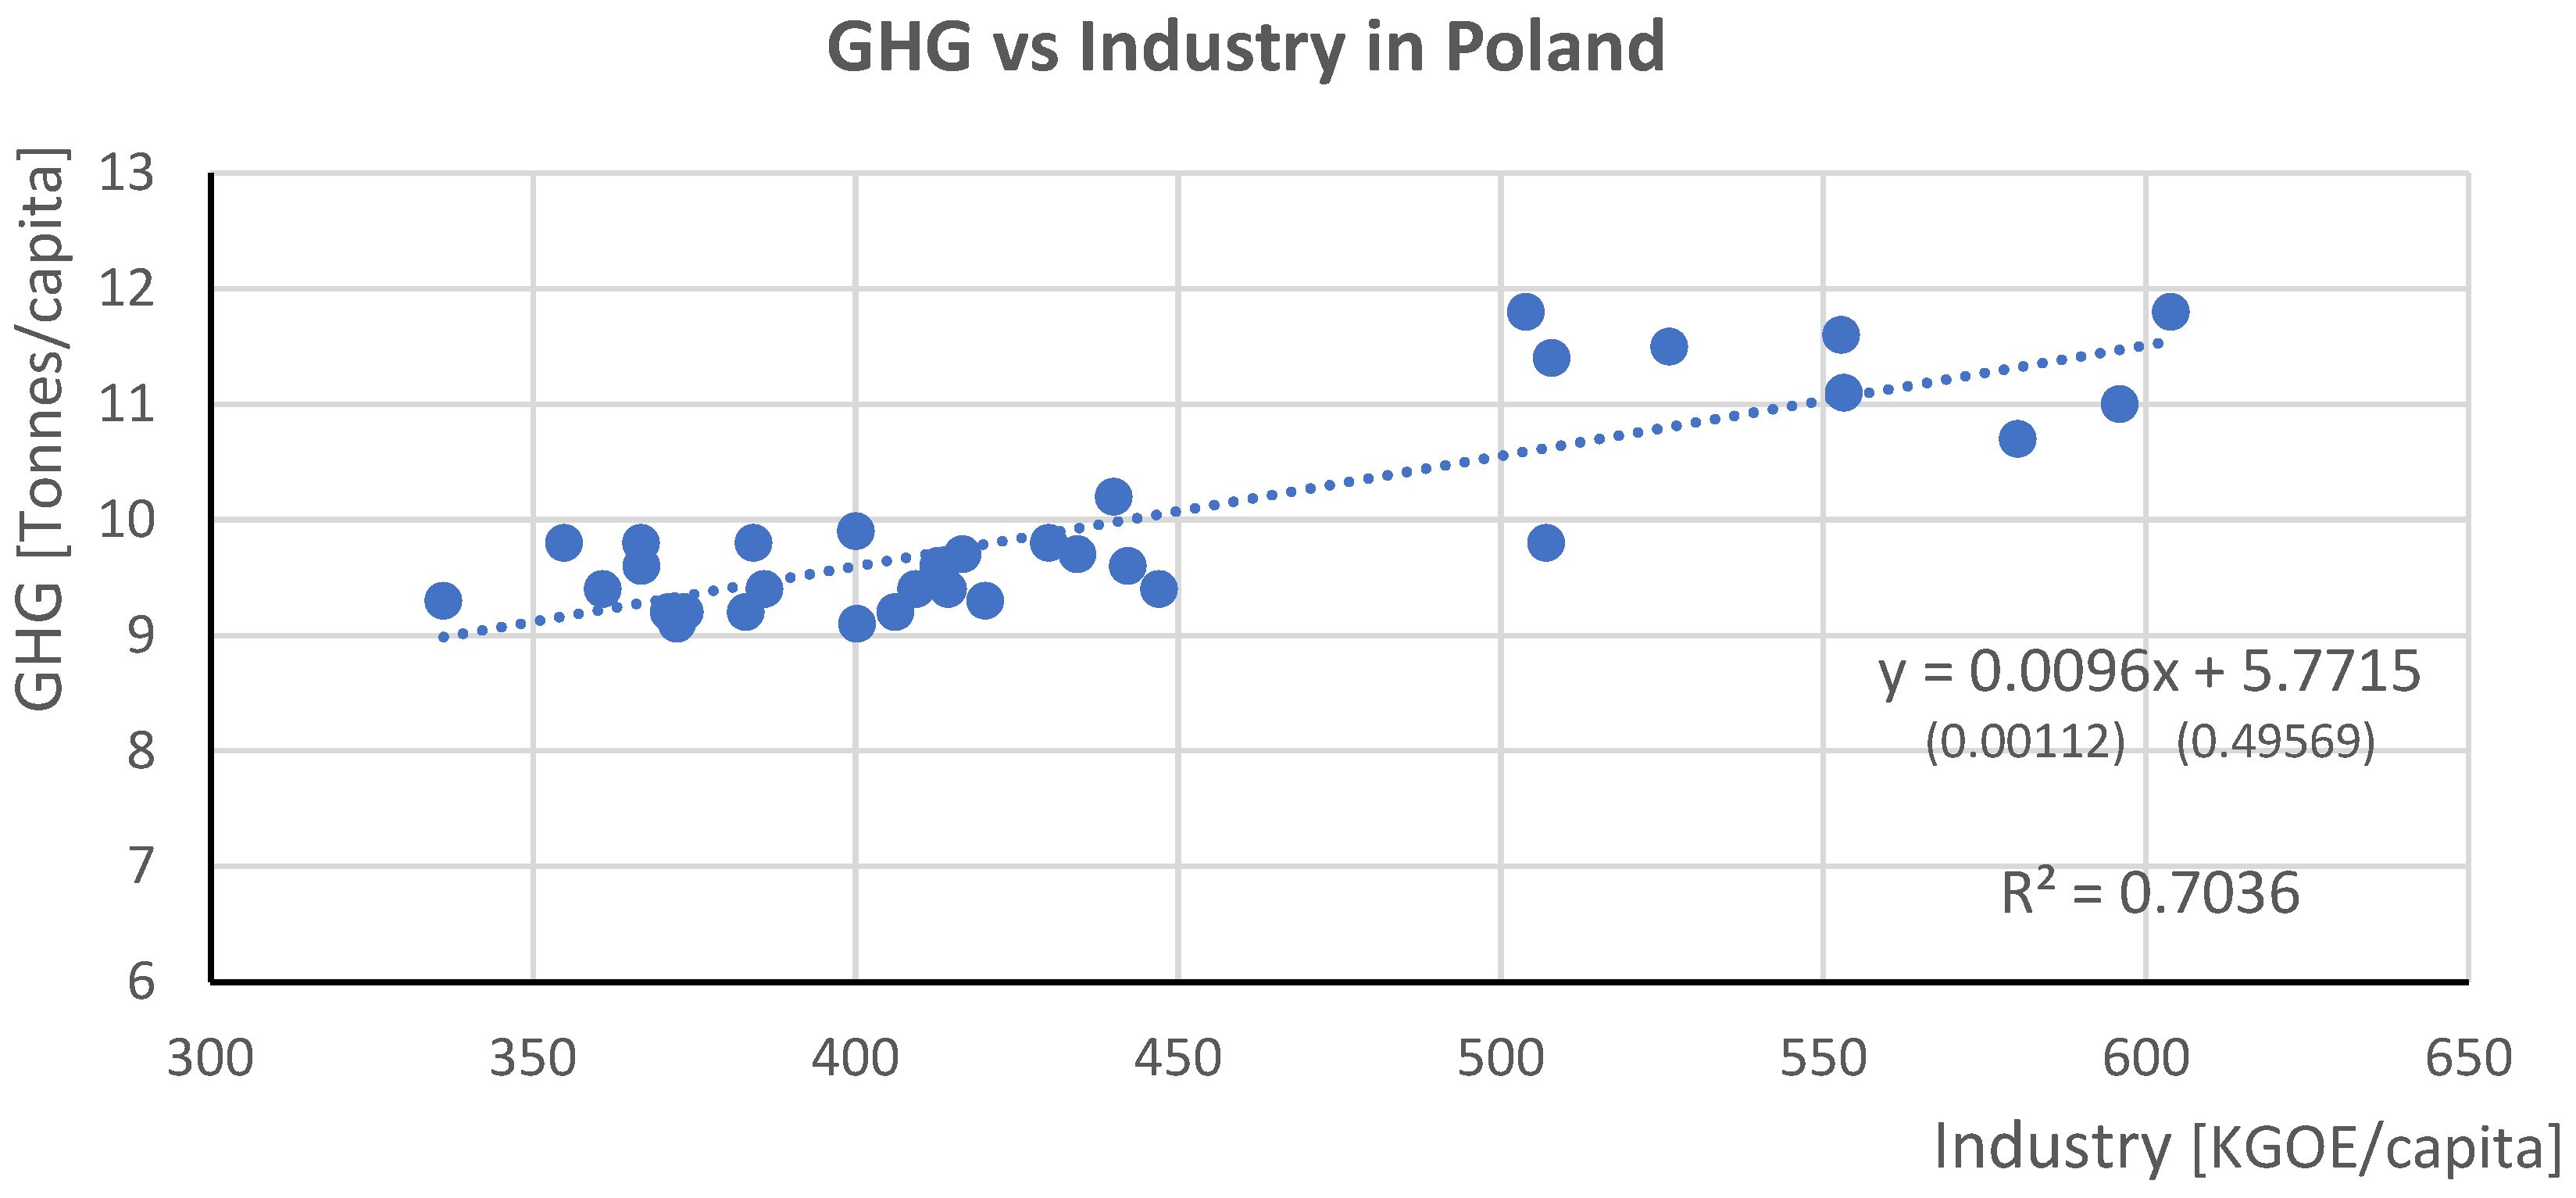
3.6. Final Energy Consumption in the Industry and Its Impact on GHG Emissions
Similarly, data were collected for the EU and Poland’s final energy consumption in industry (
Figure 13).
In both cases, energy consumption showed an apparent downward trend. In the EU, it fell by 35.3% (with a year-on-year decrease of 1.3%), and in Poland by 36.7% (with an average annual decrease of 1.4%). In the EU, it ranged from 479.67 to 740.92 KTOE/capita, and in Poland, from 336.11 to 603.9. For the EU countries, the data were relatively well approximated by a linear trend (R2 = 0.83, F = 161.0, p-value = 0.000), while in Poland, by a 4th-degree polynomial (R2 = 0.86, F = 44.2, p-value = 0.000).
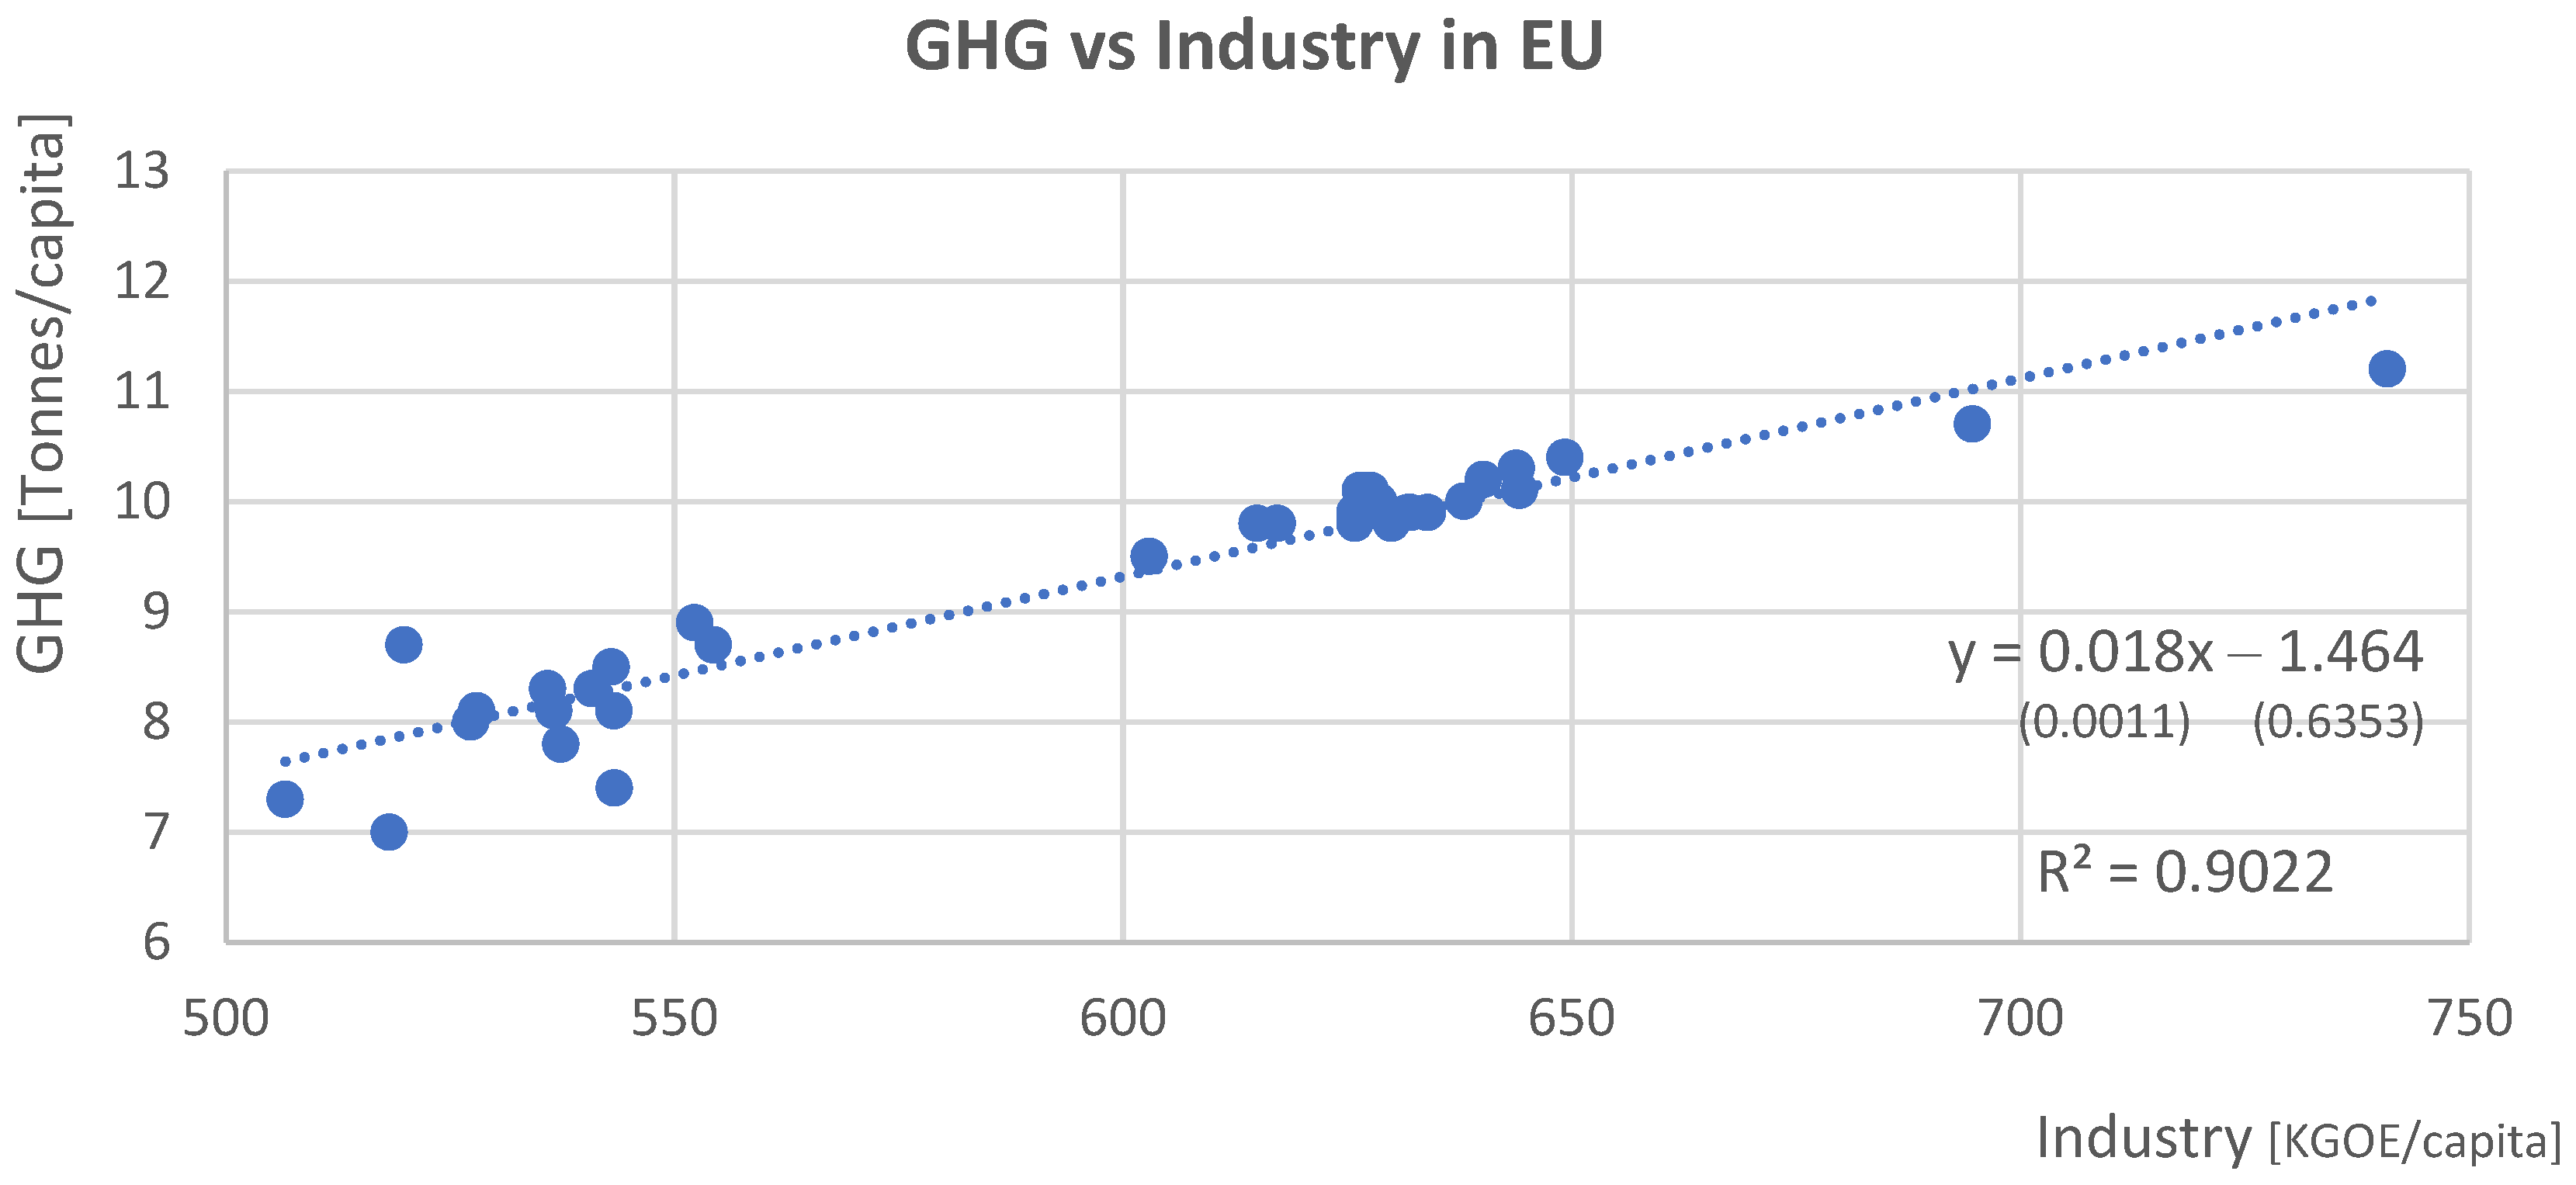
This time, the variable under study was highly positively correlated with GHG emissions, both for the EU (very high: 0.95,
p-value = 0.000) and for Poland (0.84,
p-value = 0.000). Consequently, hypotheses H4 and H4a were confirmed. Scatter plots of these variables with regression lines are shown below (
Figure 14 and
Figure 15).
Due to the good fit of the regression line to empirical data (UE: R2 = 0.90, F = 286.0, p-value = 0.000; PL: R2 = 0.70, F = 73.6, p-value = 0.000), it can be concluded that, for EU countries, an average decrease in industrial energy consumption of 1000 KTOE (per capita) was accompanied by an average decrease in greenhouse gas emissions of approximately 18 tons of CO2 equivalent per capita. Similarly, in Poland, a decrease in energy consumption of 1.000 KTOE/capita was accompanied by a decrease in harmful emissions of 9.6 tons/capita on average.
This time, the results of the correlation coefficients of the studied characteristics are summarized in
Table 7, along with an assessment of their significance.
This time, in almost all countries, the correlation was significant. The exceptions were Malta and Slovenia.
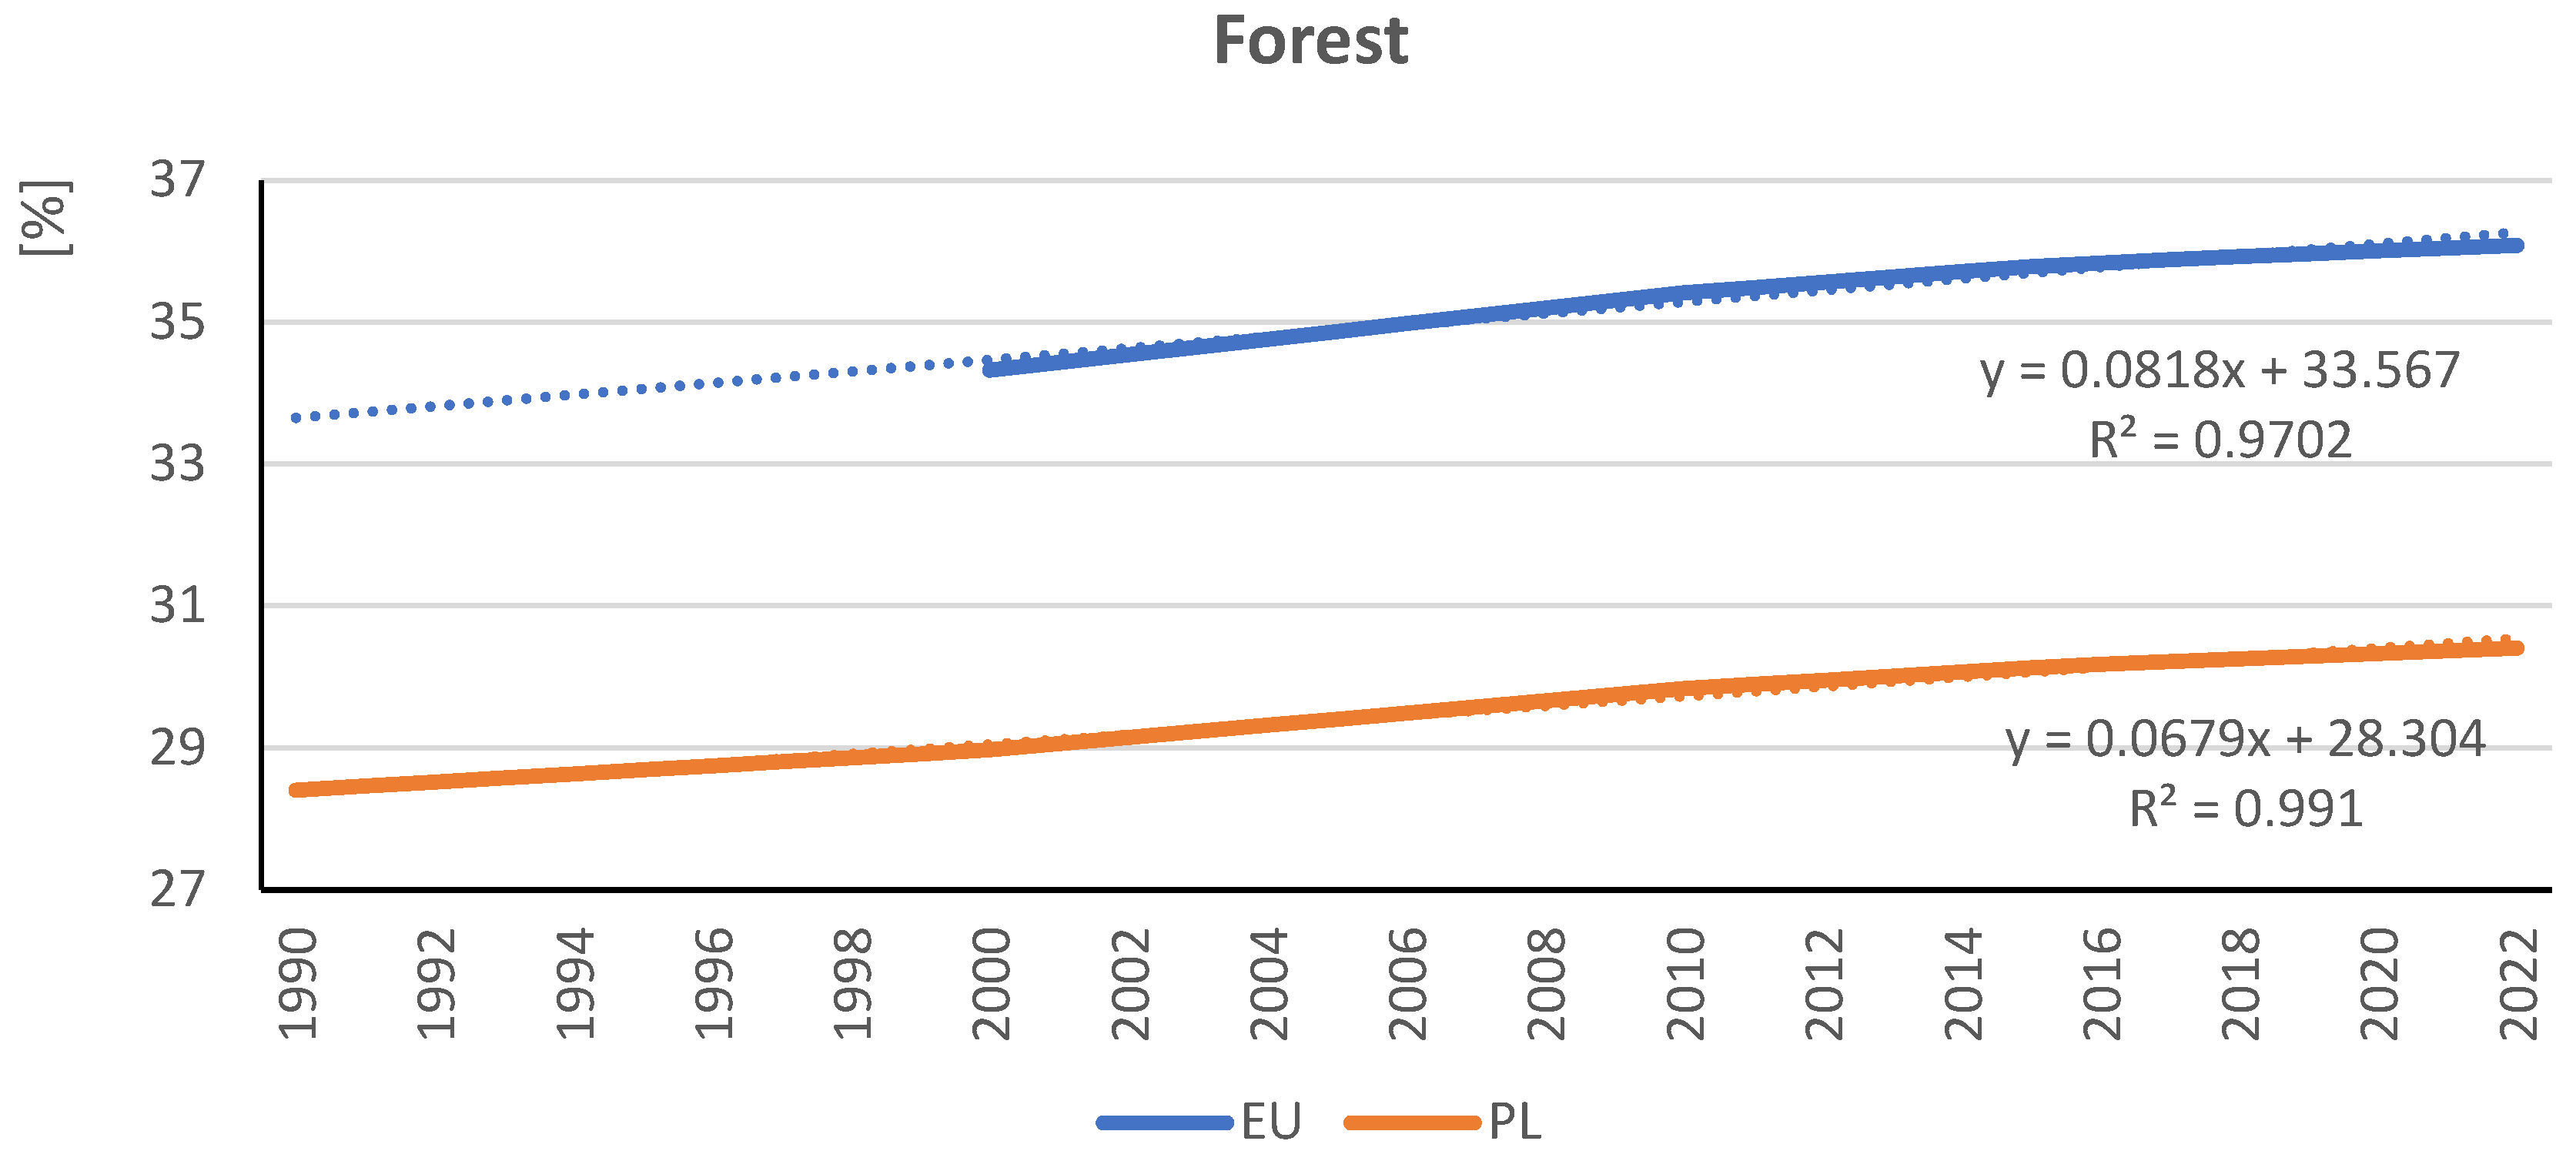
3.7. The Forest Area and Its Impact on GHG Emissions
Finally, to complete the analysis, data were collected on the percentage of forest area in the EU countries and Poland. Data for Poland alone covered the period from 1990 to 2022; however, due to data gaps in individual EU countries, data for the 27 countries aggregated was only presented from 2000 onwards (
Figure 16).
There were visibly evident trends towards increasing forest area in the EU and Poland. However, this growth was very slow (which shall be a direct result of the specificity of the variable under study). In the EU countries, the total area covered ranged from 34.32% to 36.08% (PL: 28.41 to 30.4%), showing a total increase of 5.1% (PL: 7.0%). In both cases, this represented an average annual percentage increase in forest area of 0.2% over the period under review (for the EU since 2000). Furthermore, the levels of the variables in the years under study were best described by linear trends with a high fit level (UE: R2 = 0.97, F = 683.3, p-value = 0.000; PL: R2 = 0.99, F = 3397.2, p-value = 0.000).
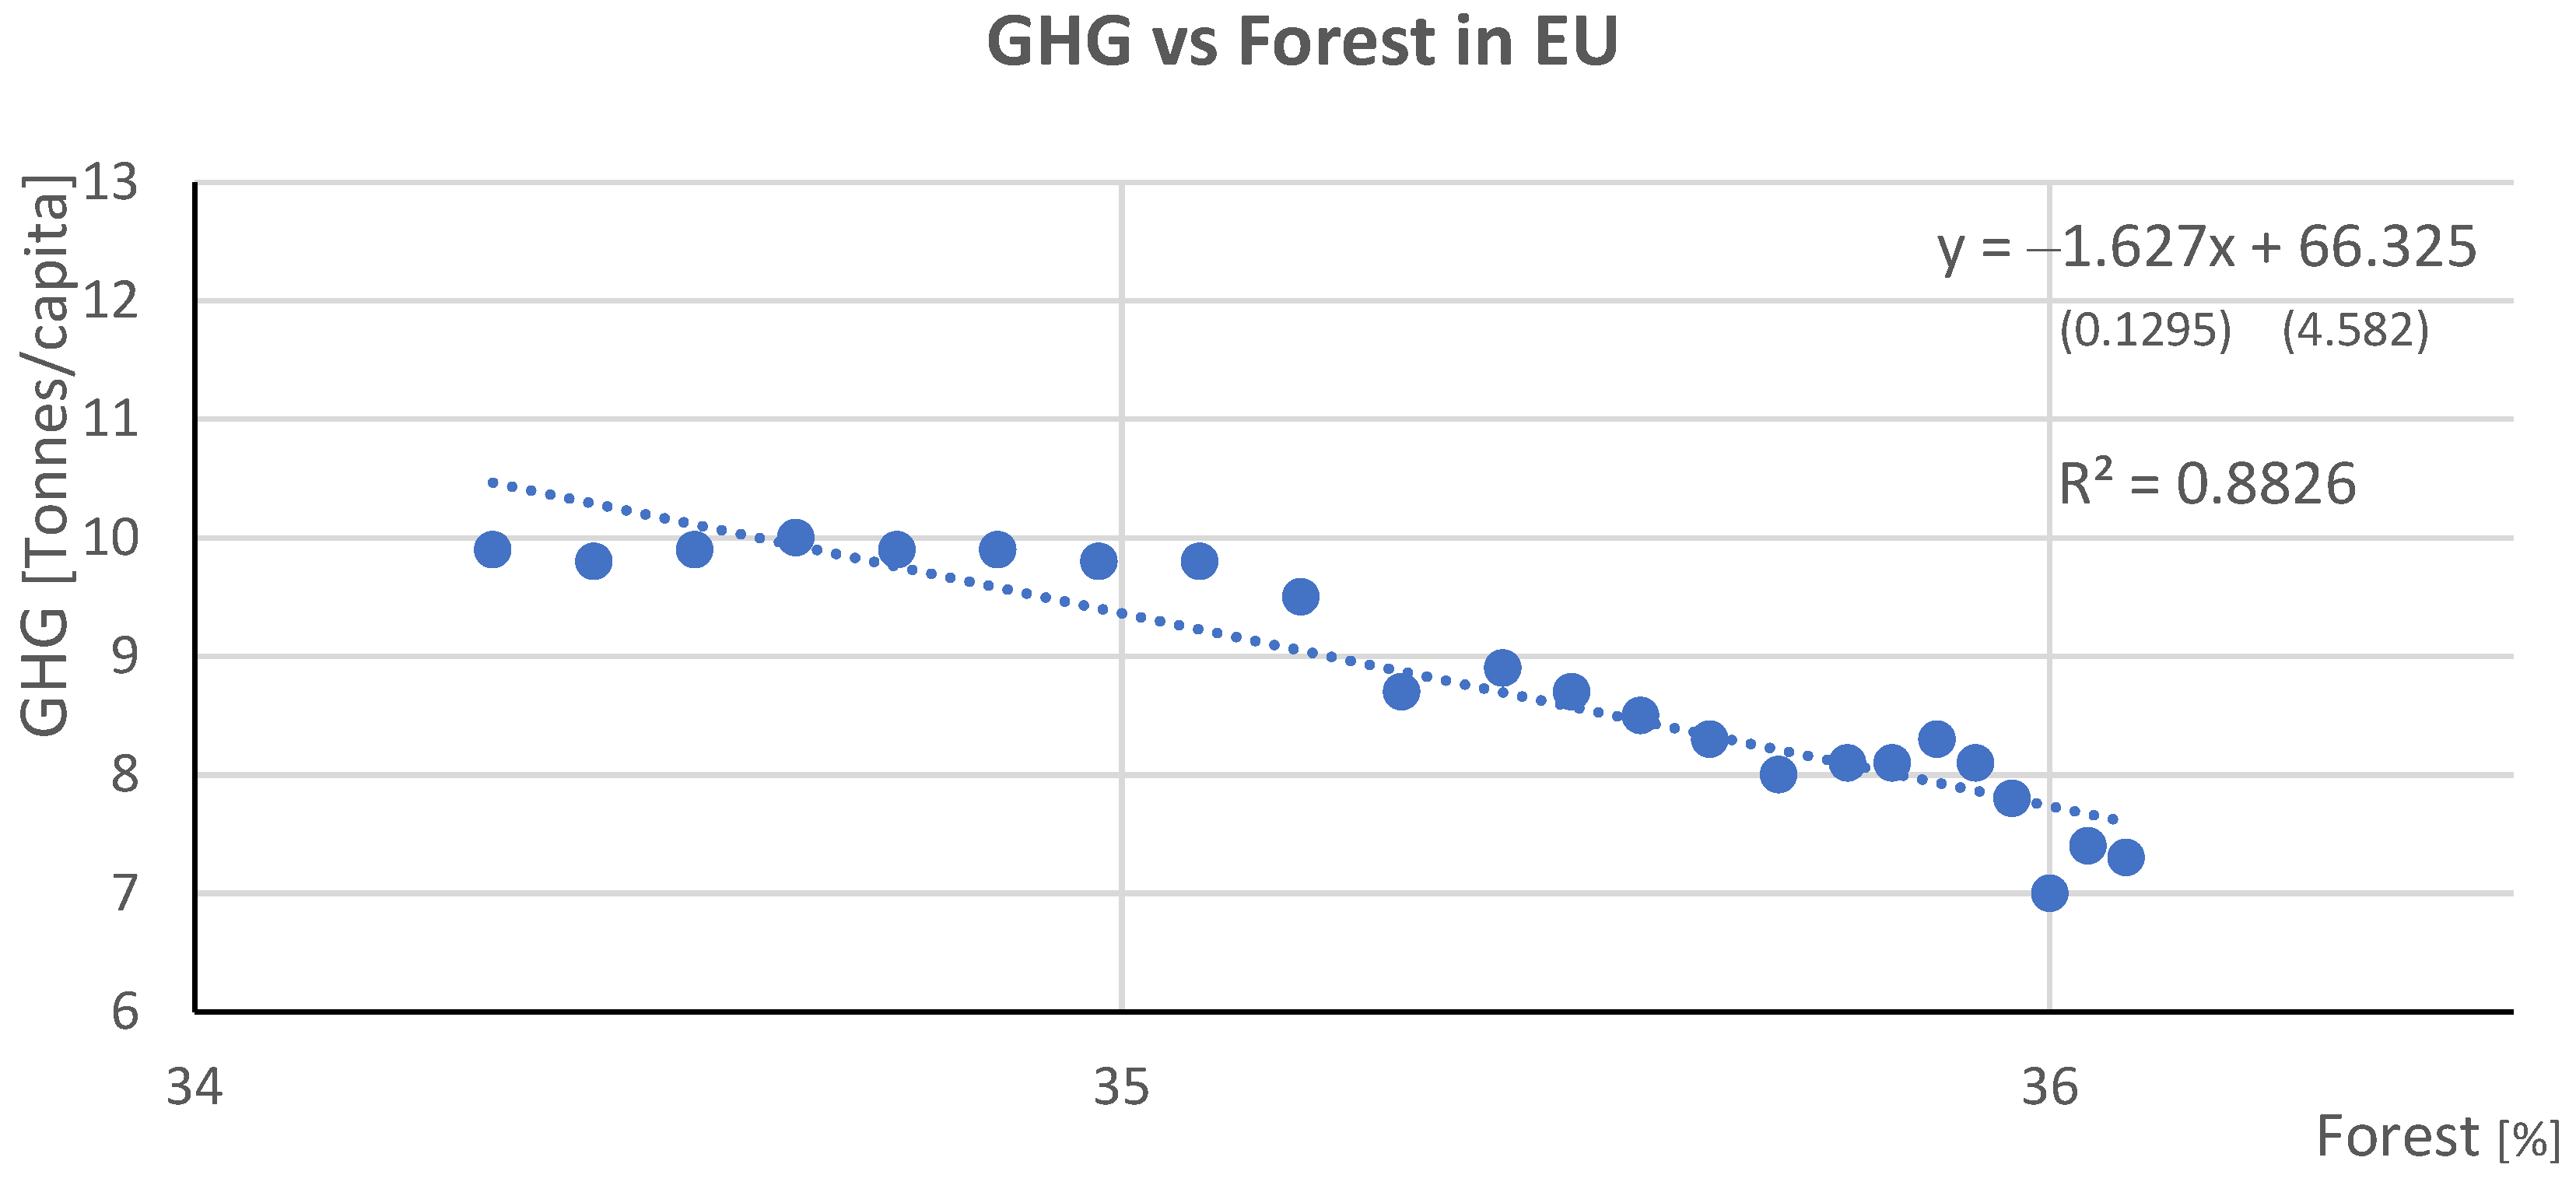
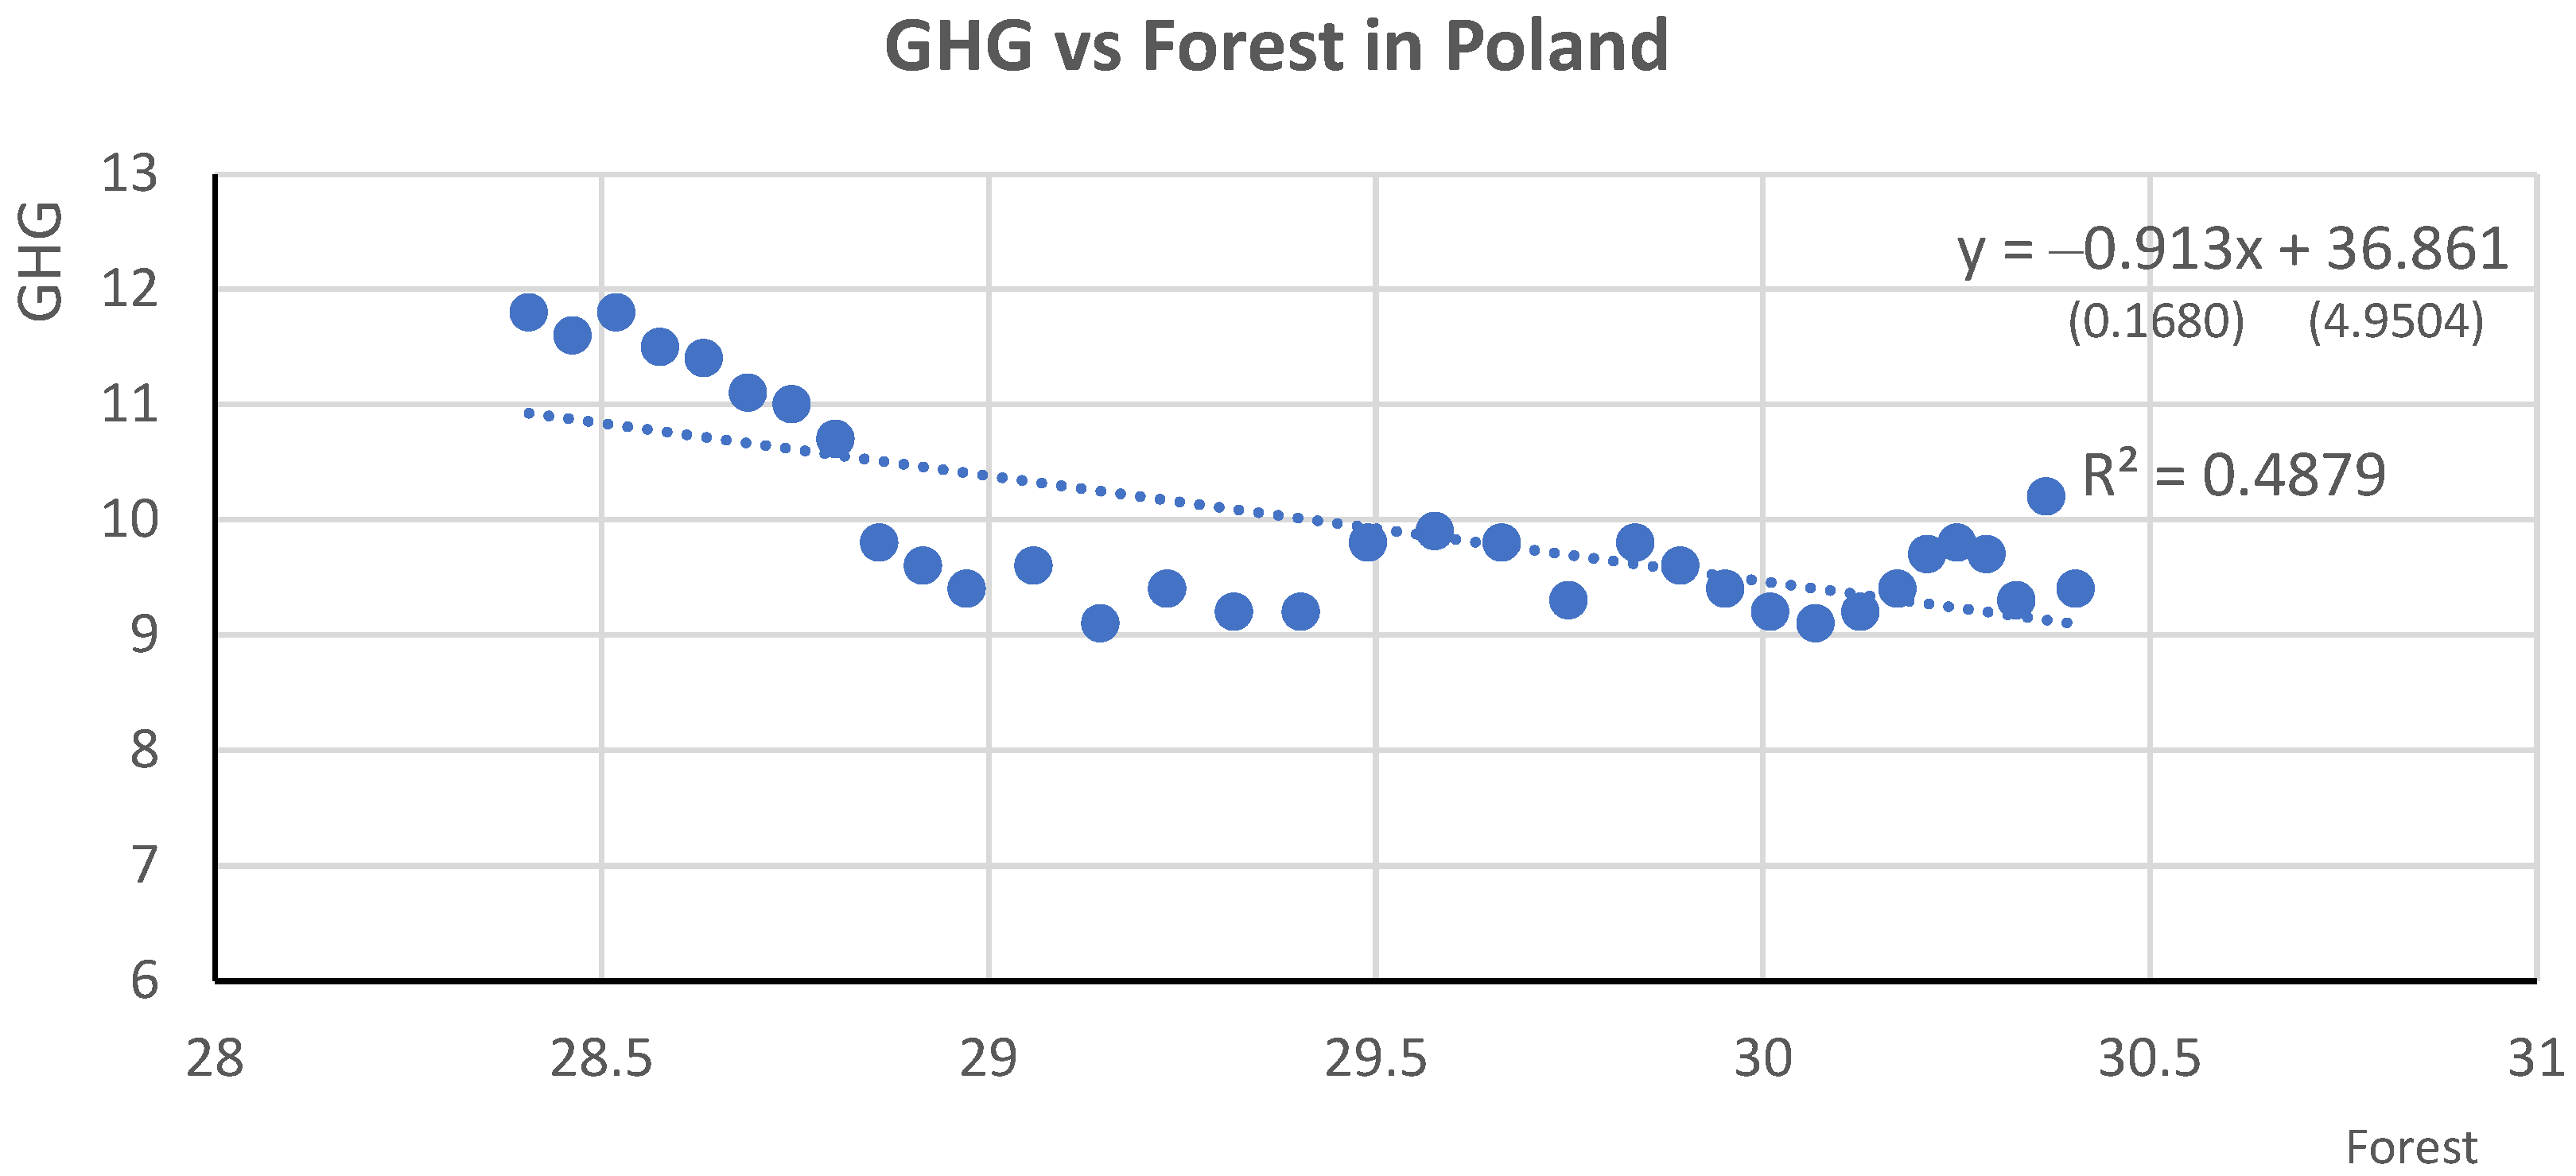
The forest area variable was very highly negatively correlated with the GHG emissions variable for the EU over the period 2000–2022: the correlation coefficient was −0.94 (p-value = 0.000), which confirmed hypothesis H5. It indicated that a decrease in GHG emissions accompanied an increase in forest area. In Poland (1990–2022), there was a negative but moderate correlation between the variables studied: the correlation coefficient was −0.70 (p-value = 0.000), confirming hypothesis H5a.
The following two graphs (
Figure 17 and
Figure 18) present scatter plots for the EU and Poland with regression lines.
The model for the EU showed a high fit: it explained 88% of the variation (R2 = 0.88, F = 157.9, p-value = 0.000). Therefore, the results may indicate that an increase in forest area in the European Union of around 1% was accompanied by an average decrease in GHG emissions of around 1.6%.
As far as Poland is concerned, a negative linear relationship was also evident in the graph. However, the regression line was less well fitted: such a model, although significant, explained 49% of the variability (R2 = 0.49, F = 29.5, p-value = 0.000).
For comparison, Pearson correlation coefficients for all European countries are presented in
Table 8.
Regarding forest area, the correlation with GHG emissions was significant for 19 countries, except for Austria, Bulgaria, Croatia, Cyprus, Finland, Latvia, Slovenia, and Spain.
4. Discussion
There was an undeniable downward trend in GHG emissions in the countries studied over the period under review, following a decline in the use of fossil fuels and industrial final energy consumption. These phenomena were accompanied by economic growth, a dynamic increase in the share of RES in the energy mix, and a slight but steady increase in forest area. On the other hand, final household energy consumption could only be described by polynomial trends of the second (EU) and fifth (PL) degrees, with downward trends for the EU and no clear downward or upward trends for Poland. For the EU as a whole, RES (−0.975), final industrial energy consumption (0.95), forest area (−0.939), and GDP (−0.916) were correlated with GHG emissions to the highest degree. In contrast, for Poland, industrial energy consumption (0.839), fossil fuel consumption (0.788), and forest area (−0.7), respectively. The share of RES ranked only fifth (−0.417) for Poland.
Table 9 and
Table 10 summarize the results of the analysis carried out.
The studies, although carried out for different time frames and geographical areas, confirmed the results found in the literature to a large extent. The findings were consistent concerning the share of renewable energy [
50,
57,
58] and final energy consumption in households [
58] and in industry [
3,
19,
49]. Also, the size of the forest area—as a counterbalance to deforestation—was in line with the theses in the literature [
31].
However, the results for the EU did not always coincide with those of individual member countries regarding the existence of correlations. Also, a rather interesting result arrived in the context of GDP. For the EU as a whole, GDP was negatively correlated with GHG emissions. A decrease in GHG emissions accompanied an increase in GDP in the EU. Thus, in Poland and six other countries, the correlation was insignificant. The results for the EU followed those obtained for the USA by [
51] (as opposed to the other countries studied there: Russia, Japan, China, and India) and [
52] (for France, Germany, Canada, Italy, and the UK). However, they were the opposite of those obtained by, e.g., [
57,
58]. At the same time, the study [
57] considered not the size of GDP itself but its percentage increase from year to year, which should change the interpretation. That confirms a certain non-stability in the strength and direction of the dependence of GHG emissions on GDP, as shown in [
53]. An explanation could be the assumption that as the wealth of a country increases, more funds are directed towards sustainability solutions. For example, the article [
55] showed a positive relationship between GDP and investment in photovoltaic installations in the EU. It supports the decoupling and environmental Kuznets curve hypotheses [
55,
56]. That may also imply that GDP growth on some level can reduce greenhouse gas emissions, depending on structural and technological changes.
5. Conclusions
Research findings can support EU climate and energy policy by identifying country-specific emission factors. As far as the EU is concerned, the most important factor favoring a decrease in GHG emissions is the share of renewable energy and industrial consumption. A good solution, therefore, would be an effective migration of industry to the use of RES. In Poland, on the other hand, among the factors studied, industry and, despite the dynamic development of RES, the consumption of fossil fuels still had the most significant impact. Action should be further intensified to reduce fossil fuels, especially in industry. Thus, in both cases, increased investment in energy efficiency would also be a reasonable implication. Also, regarding forest areas, the results confirmed that a systematic afforestation policy yields positive results. Therefore, we believe that policies such as afforestation of marginal agricultural land, protection of organic soils, and adaptive forestry can complement climate strategies. Because the final use of fossil fuels had a very significant impact on GHG emissions, it would be worth considering intensifying specific policy mechanisms that could accelerate the decarbonization of the economies, such as RES support systems, pricing schemes, support for energy retrofitting of residential and industrial buildings, and increasing the share of green investments in industrial and fiscal policies. Environmental politics are important in both industry and households. The role played by technological innovation (such as advances in renewable energy, carbon capture technologies, energy storage, or hydrogen industrial technologies) in reducing greenhouse gas emissions cannot be underestimated either.
The results concerning the influence of GDP on GHG emissions should also become the subject of future research regarding the decoupling and environmental Kuznets curve hypotheses. At a certain point, spending more resources on environmental protection reduces GHG emissions. That implies a negative correlation of emissions with GDP for highly developed countries and the opposite for poorer countries. Poland is probably ranked somewhere in the middle. However, it is worth noting that a low but significant negative correlation could be found by assuming a slightly higher significance level (at 0.1 instead of 0.05). Thus, economic growth there has reached a certain point in terms of the EKC theory, from which the GDP’s negative impact on GHG emission has begun to decrease. In addition, it is worth noting that Poland has seen a kind of boom in renewable energy sources over the past decade, particularly photovoltaics. An extensive system of subsidies for residents investing in green energy sources has undoubtedly contributed to this. It has resulted in a significant increase in the share of RES in the energy mix, reducing the consumption of fossil fuels.
Additionally, the variations in the correlation results obtained for each country were noteworthy. The answer would be the different degrees of development of a country. Consequently, conducting more extensive analyses to identify these correlations would be valuable. Future research should include dynamic panel models and qualitative policy analysis to understand interactions’ effects better. It is particularly important due to the variation in outcomes observed among individual countries.
In the context of further analysis of GHG emissions phenomena, it would also be necessary to examine the influence of climate policies on GHG emission reductions by comparing different regulatory strategies and subsidies for RES in the EU and non-EU countries. Moreover, it would be beneficial to analyze the long-term economic impact of the energy transition. Another aspect worth considering would be to test the correlation between the use of technological innovation in reducing GHG emissions and the consequences of public investment in sustainable development, identifying the sectors that make the best use of resources for green transformation.
Combining extant findings with forthcoming research endeavors could facilitate a more profound comprehension of the mechanisms for mitigating greenhouse gas emissions. The identification of effective strategies for more sustainable development would support the transition towards a circular economy.


