Article

Economic Structural Adjustment Promoting Sustainable Growth in Shanghai: A Two-Decade Study (2004–2023)

1
School of Finance, Shanghai University of Finance and Economics, Shanghai 200433, China
2
School of Geographical Sciences, University of Bristol, Bristol BS8 1SS, UK
3
College of Surveying and Geo-Informatics, Tongji University, Shanghai 200092, China
*
Author to whom correspondence should be addressed.
Sustainability 2025, 17(10), 4318; https://doi.org/10.3390/su17104318
Submission received: 2 April 2025 / Revised: 26 April 2025 / Accepted: 7 May 2025 / Published: 9 May 2025
(This article belongs to the Special Issue Regional Economics, Policies and Sustainable Development)

Abstract

:
This study investigates the structural transformation of Shanghai’s economy (2004–2023), analyzing the interplay between industrial shifts and sustainable growth. While prior work has focused on short-term trends or isolated sectors, we provide the first comprehensive analysis of Shanghai’s two-decade transition from manufacturing to services, leveraging annual nominal GDP data and three forecasting models (Autoregressive Integrated Moving Average model ARIMA, Support Vector Machine SVM, and Grey Model GM). Our findings reveal that the tertiary sector’s contribution surged from 50.8% to 75.2% of GDP, driven by finance, technology, and real estate, while the secondary sector declined to 24.6%. The autoregressive integrated moving average ARIMA(1,1) model outperformed alternatives (mean absolute percentage error 2.97%), projecting GDP growth to CNY 60,321.54 trillion by 2026. Crucially, we demonstrate that Shanghai’s structural evolution aligns with advanced urban economies (e.g., New York, Tokyo), yet retains distinct industrial resilience due to China’s dual-circulation policy. These results challenge assumptions about manufacturing decline, instead highlighting a rebalancing toward high-value-added sectors. The study contributes (1) a validated framework for forecasting urban GDP in policy-stabilized economies and (2) empirical evidence for prioritizing tertiary innovation in sustainable development strategies. Policymakers and researchers can leverage these insights to navigate trade-offs between growth, equity, and environmental goals in rapidly urbanizing regions.

1. Introduction

Under the complex background of rapid globalization and technological advancement, economic growth has become an important indicator for measuring the development level of a country or region [1,2,3,4,5,6]. However, traditional economic growth, often accompanied by excessive resource consumption and environmental degradation, has triggered global challenges such as resource shortages, pollution, climate change, and social inequality, jeopardizing both ecological sustainability and long-term economic stability [7,8,9]. In response, the paradigm of sustainable economic growth has emerged, prioritizing the balance between meeting current needs and safeguarding future generations’ capabilities [10,11]. This shift underscores the urgency for governments to reconcile economic expansion with resource efficiency, environmental protection, and social equity [12].
Sustainable economic growth has become a common goal for global development, from the green transformation in developed countries to the sustainable development strategies in developing nations, and initiatives by international organizations to active responses from the business community [11,13]. More countries and regions have begun to recognize the importance of economically sustainable growth, incorporating it into national strategies and policy frameworks [14,15,16]. As the world’s second-largest economy, China has strategically emphasized economic structural adjustment to drive high-quality development [9,17]. Over the past two decades, its industrial structure has shifted dramatically: the tertiary sector’s contribution to GDP surged from 28.7% in 1952 to 56.2% in 2024, while the primary sector dwindled to 6.8%, calculated based on the 2024 National Bureau of Statistics of China [18].
Shanghai, as the nation’s economic powerhouse and a global financial hub, exemplifies this transformation [3,12,19]. This evolution aligns with global trends observed in advanced urban economies like New York and Tokyo, yet retains unique characteristics shaped by China’s dual-circulation policy and localized innovation strategies. While prior studies have explored isolated aspects of Shanghai’s economic growth—such as the role of high-tech industries [19,20] or urbanization impacts—a comprehensive analysis of its two-decade structural transition remains absent. Existing works often focus on short-term trends or sector-specific dynamics, neglecting the interplay between industrial rebalancing, policy frameworks, and sustainable outcomes. For example, Shen & Zhao [21] innovatively evaluate both direct effects (e.g., GDP growth, industrial upgrades) and indirect spillovers (e.g., entrepreneurship ecosystems, green technology adoption) of Shanghai’s innovation policies, revealing nonlinear growth patterns.
To address these gaps, this study seeks to answer three pivotal questions:
  • How has Shanghai’s industrial structure evolved from 2004 to 2023, and what drivers underpin its transition toward a service-dominated economy?
  • Which sectors (primary, secondary, and tertiary) have been most critical to sustaining GDP growth?
  • What is the projected trajectory of Shanghai’s GDP under different forecasting models, and which approach offers the highest predictive accuracy for policy formulation?
Therefore, it is great valuable for investigating the history procedure of industrial structural adjustment in Shanghai, which not only concerns Shanghai’s own economic sustainability but also has significant impacts on the national and even global economic landscape. In this contribution, based on the Shanghai GDP and various industrial component datasets over the period from 2004 to 2023, we analyzed the relationship between industrial structure and economic growth in Shanghai over the past two decades, which provided the valuable perspectives on the dynamics of economic development in the context of globalization and technological change. It contributes to a deeper understanding of the policy levers available to guide industrial evolution and supports evidence-based decision-making for future economic planning. Furthermore, this investigation highlights the importance of balancing short-term economic gains with long-term sustainability goals, and it underscores the role of institutional reforms in facilitating this transition, which can be referenced for other relevant rapidly developing cities and regions with similar transformations. Additionally, we further forecast the future Shanghai GDP in future three years.
By integrating longitudinal GDP data with advanced forecasting techniques (ARIMA, SVM, GM), this study provides the first holistic examination of Shanghai’s structural shifts, offering empirical insights into the synergies and trade-offs between economic growth, industrial resilience, and sustainability. Our findings aim to inform policymakers on optimizing resource allocation, fostering high-value-added industries, and navigating demographic and environmental challenges in rapidly urbanizing contexts. The rest of this manuscript is organized as follows: Section 2 briefly introduces the adopted datasets and predicted models. The results and analysis are presented in Section 3. Conclusion and discussions are provided in Section 4.

2. Adopted Datasets and Prediction Models

2.1. Adopted Datasets

Due to the unavailability of real GDP data adjusted for price deflators—particularly the historical inflation indices for Shanghai’s three industry sectors—this study analyzes Shanghai’s economic growth over the past two decades (2004–2023) using annual nominal GDP totals and their components from three industries and twelve segmented fields. The raw nominal GDP data (2004–2023) were obtained from the Shanghai Municipal Bureau of Statistics https://tjj.sh.gov.cn/ (accessed on 1 January 2025). Sectoral contributions (e.g., primary, secondary, tertiary industries) were calculated by aggregating the official subsector data, adjusted for consistency with China’s national accounting standards [18]. Notably, the total GDP contains three industry components: primary industry (i.e., agriculture, forestry, fishing, mining, and oil extraction, etc.), secondary industry (i.e., manufacturing, construction, and energy production, etc.), and tertiary industry (known as service industry), respectively. The twelve segmented fields specifically include industry and construction (belonging to secondary industry), wholesale and retail industry, transportation, storage and postal services, accommodation and catering, information transmission, software and information technology services, finance and real estate (belonging to tertiary industry).

2.2. Prediction Models

To forecast Shanghai’s future GDP, this study employs three widely used predictive models. The mean absolute prediction error (MAPE) serves as the evaluation metric for comparing model performance. Following a comprehensive assessment of these econometric approaches, the most accurate model will be selected, and its projections will constitute the final GDP estimates for Shanghai.
(a) Grey Forecast Model (GM)
The GM(1,1) model is extensively utilized in the field of economics for short-term forecasting, trend analysis, and policy evaluation [22]. Its effectiveness is particularly notable in scenarios with limited historical data, as it can perform reliably even with a small number of data points. However, the accuracy of the GM(1,1) model’s predictions may be influenced by the characteristics of the data and the assumptions underlying the modelling process [23]. Consequently, it is recommended to validate the model using out-of-sample data and to benchmark its performance against alternative forecasting methods to ensure robustness.
(b) AutoRegressive Integrated Moving Average (ARIMA) Model
Compared with the GM(1,1), the ARIMA model is another commonly used method for forecasting the economics, finance, sales forecasting, stock market analysis, and more, especially for the data series with clearly temporal dependencies, trends, or seasonal patterns [24]. One thing that should be noted is that ARIMA models assume linearity in the relationships within the data and may not perform well with highly nonlinear or complex time series.
(c) Support Vector Machine (SVM) Model
Compared with the above-mentioned two traditional predicted models, the SVM method is a supervised learning model used for classification and regression analysis [25]. They are particularly well-suited for high-dimensional spaces and are effective in cases where the number of dimensions exceeds the number of samples. SVM has a strong theoretical foundation based on statistical learning theory, which includes the principle of structural risk minimization. By finding an optimal hyperplane and utilizing the kernel trick, SVM can effectively process the linear and nonlinear relationships in the data series. Despite some limitations, SVM remains a popular choice in machine learning for its strong performance and theoretical grounding.

3. Results and Analysis

3.1. Analysis of Shanghai’s Total GDP and Its Components

Figure 1 illustrates the annual GDP trends of Shanghai from 2004 to 2023, highlighting the contributions of the three major industries: Primary, secondary, and tertiary, along with the total GDP. Over the past two decades, Shanghai’s total GDP has demonstrated a consistent upward trajectory. Starting at just under CNY 1 trillion in 2004, it surged to nearly CNY 5 trillion by 2023, underscoring the city’s remarkable economic growth. Throughout this period, the tertiary industry has emerged as the dominant sector, with its contribution to GDP increasing steadily and surpassing the other industries by 2020. In contrast, the secondary industry has experienced relatively slower growth. The primary industry, while maintaining stability, has contributed the least to GDP, reflecting minimal growth. This pattern aligns with the typical economic transition observed in developing cities, where primary sector activities gradually diminish in prominence. The specific detailed data can be referenced in Table A1.
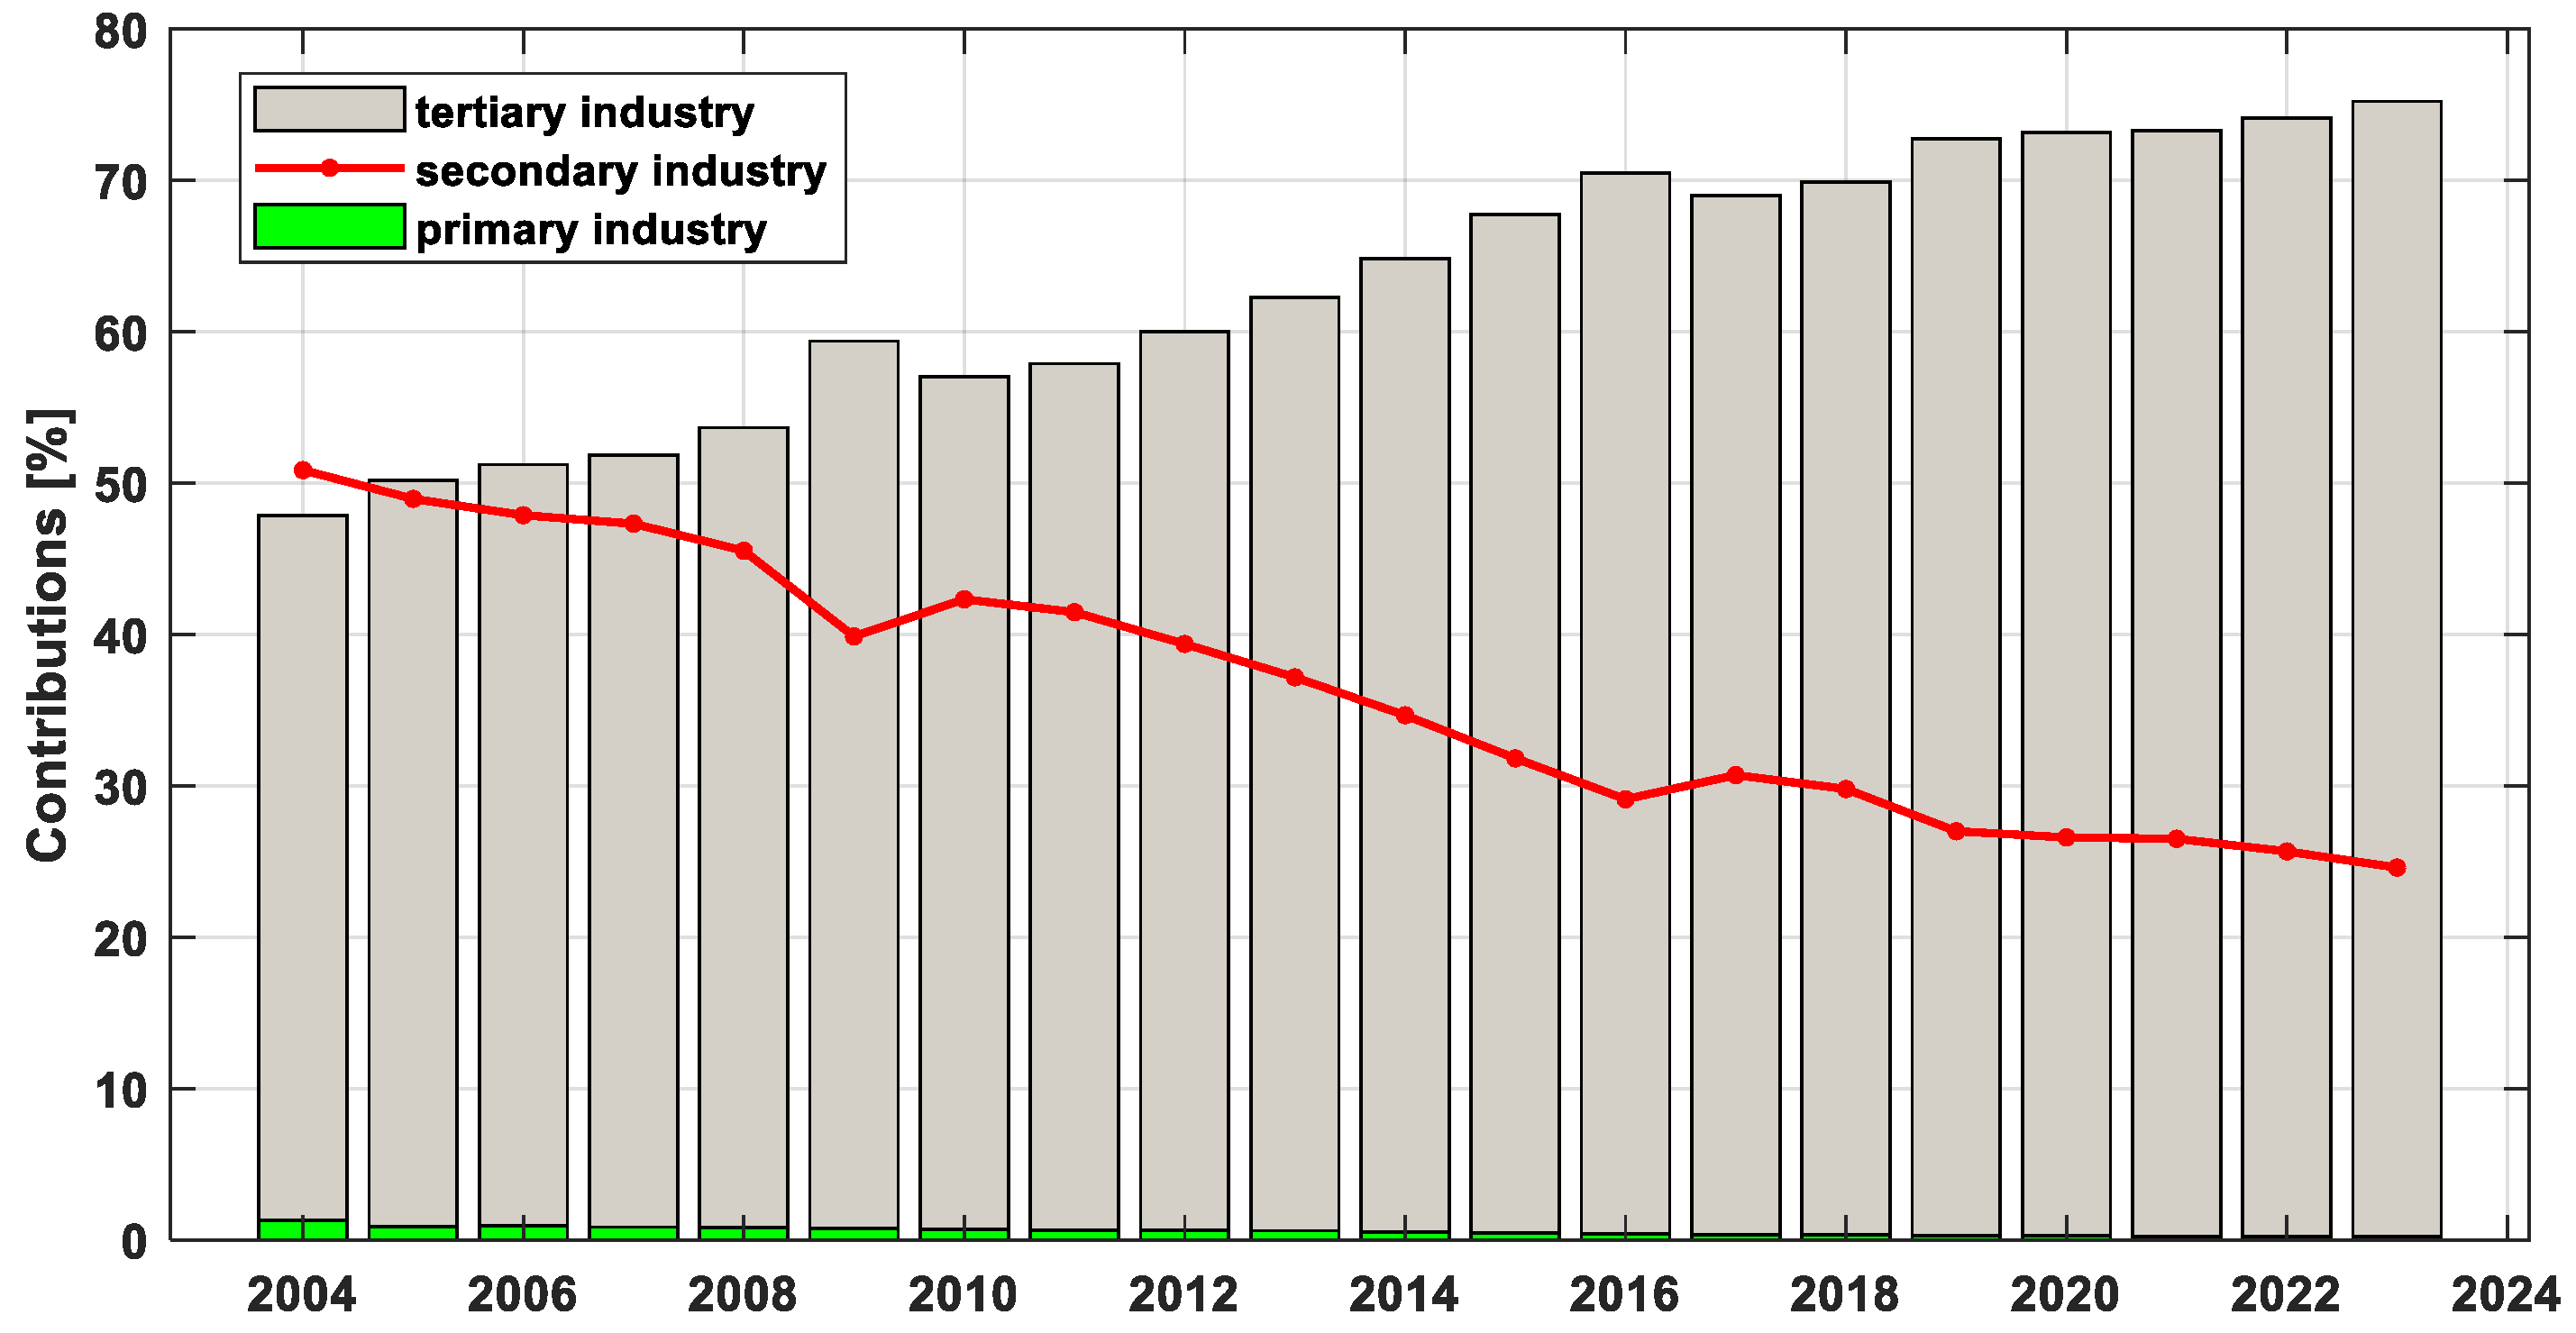
Figure 2 presents a comprehensive series of pie charts that depict the evolving contributions of the primary, secondary, and tertiary industries to Shanghai’s total GDP from 2004 to 2023. This visual representation provides valuable insights into the structural transformation of Shanghai’s economy over nearly two decades. The tertiary industry emerges as a consistently dominant force, underscoring its pivotal role in the region’s economic landscape. The secondary industry, while initially substantial, demonstrates a gradual decline over the period, potentially indicative of evolving economic priorities or the impact of technological innovations that diminish reliance on traditional manufacturing and industrial activities. Conversely, the primary industry maintains a modest and stable presence, highlighting its limited influence within Shanghai’s broader economic framework. This stability likely stems from the sector’s maturity and its inherent resistance to rapid fluctuations compared to the more dynamic secondary and tertiary sectors. Collectively, these trends reflect an economy in transition, with the tertiary sector—encompassing services and knowledge-based industries—assuming an increasingly critical role. The observed contraction in the secondary industry may be driven by factors such as increased automation, outsourcing, or a strategic pivot towards higher value-added economic activities. Meanwhile, the primary industry’s marginal contribution and steady performance suggest that agriculture and raw material extraction play a relatively minor role in Shanghai’s economic trajectory.
For the year 2005, a significant milestone was reached in Shanghai’s economic development, as the tertiary industry’s contribution to the city’s GDP surpassed that of the secondary industry for the first time. In 2004, the economic landscape of Shanghai was already characterized by a strong service-oriented economy, with the tertiary sector accounting for 50.8% of the city’s GDP. The secondary industry followed closely at 47.9%, while the primary industry represented a mere 1.3% of the total GDP. This distribution clearly demonstrates that even at the beginning of the observation period, Shanghai’s economy was predominantly driven by service and manufacturing sectors, with agriculture playing a negligible role. The subsequent years witnessed a consistent expansion of the tertiary sector, reaching its peak contribution of 62.2% in 2013. Concurrently, the secondary industry experienced fluctuations but generally showed a declining trend, reflecting the relative decrease in the significance of manufacturing and construction activities. Throughout this transformative period, the primary industry maintained its minimal presence, consistently accounting for less than 2% of the city’s GDP.
This analysis of Shanghai’s economic structure reveals a clear trajectory of development, marked by the growing dominance of the service sector and the gradual transition from a manufacturing-based to a service-oriented economy. The data underscores Shanghai’s evolution into a modern, post-industrial economy, aligning with global trends of urban economic development. Since 2014, the tertiary industry’s share has stabilized within the 60–70% range, demonstrating its dominant role in Shanghai’s economic structure. Concurrently, the secondary industry has exhibited a steady decline, with its contribution decreasing to 24.6% by 2023. This persistent trend underscores the city’s ongoing economic transition from manufacturing-oriented activities to service-based sectors, aligning with the typical developmental trajectory of advanced urban economies. Meanwhile, the primary industry has maintained a minimal presence, consistently accounting for less than 1% of the economic output. This marginal share reflects Shanghai’s highly urbanized character and the limited scale of its agricultural sector, which is disproportionate to its substantial population and sophisticated economic framework.
In 2023, the tertiary industry’s contribution peaked at 75.2%, marking a historic high, while the secondary industry’s share hit a record low of 24.6%. The primary industry remained marginal, accounting for a mere 0.2%. These figures highlight the overwhelming dominance of the tertiary sector in Shanghai’s economy, a phenomenon driven by the city’s pivotal role as a global financial, trade, and services hub. Over the past two decades, the rising prominence of the tertiary industry mirrors global economic patterns, where service sectors expand as economies mature. This transformation reflects significant advancements in infrastructure, education, and technology, which have catalyzed the growth of high-value sectors such as finance, information technology, and professional services. Notably, the decline in the secondary industry’s share does not necessarily signify a reduction in manufacturing or construction output. Rather, it points to the relative expansion of the tertiary sector and underscores Shanghai’s strategic shift toward advanced manufacturing and industrial modernization. This evolution aligns with the city’s broader economic goals of fostering innovation, enhancing productivity, and transitioning to a knowledge-based economy. The data thus captures not only Shanghai’s economic restructuring but also its alignment with global trends in urban development and industrial transformation.
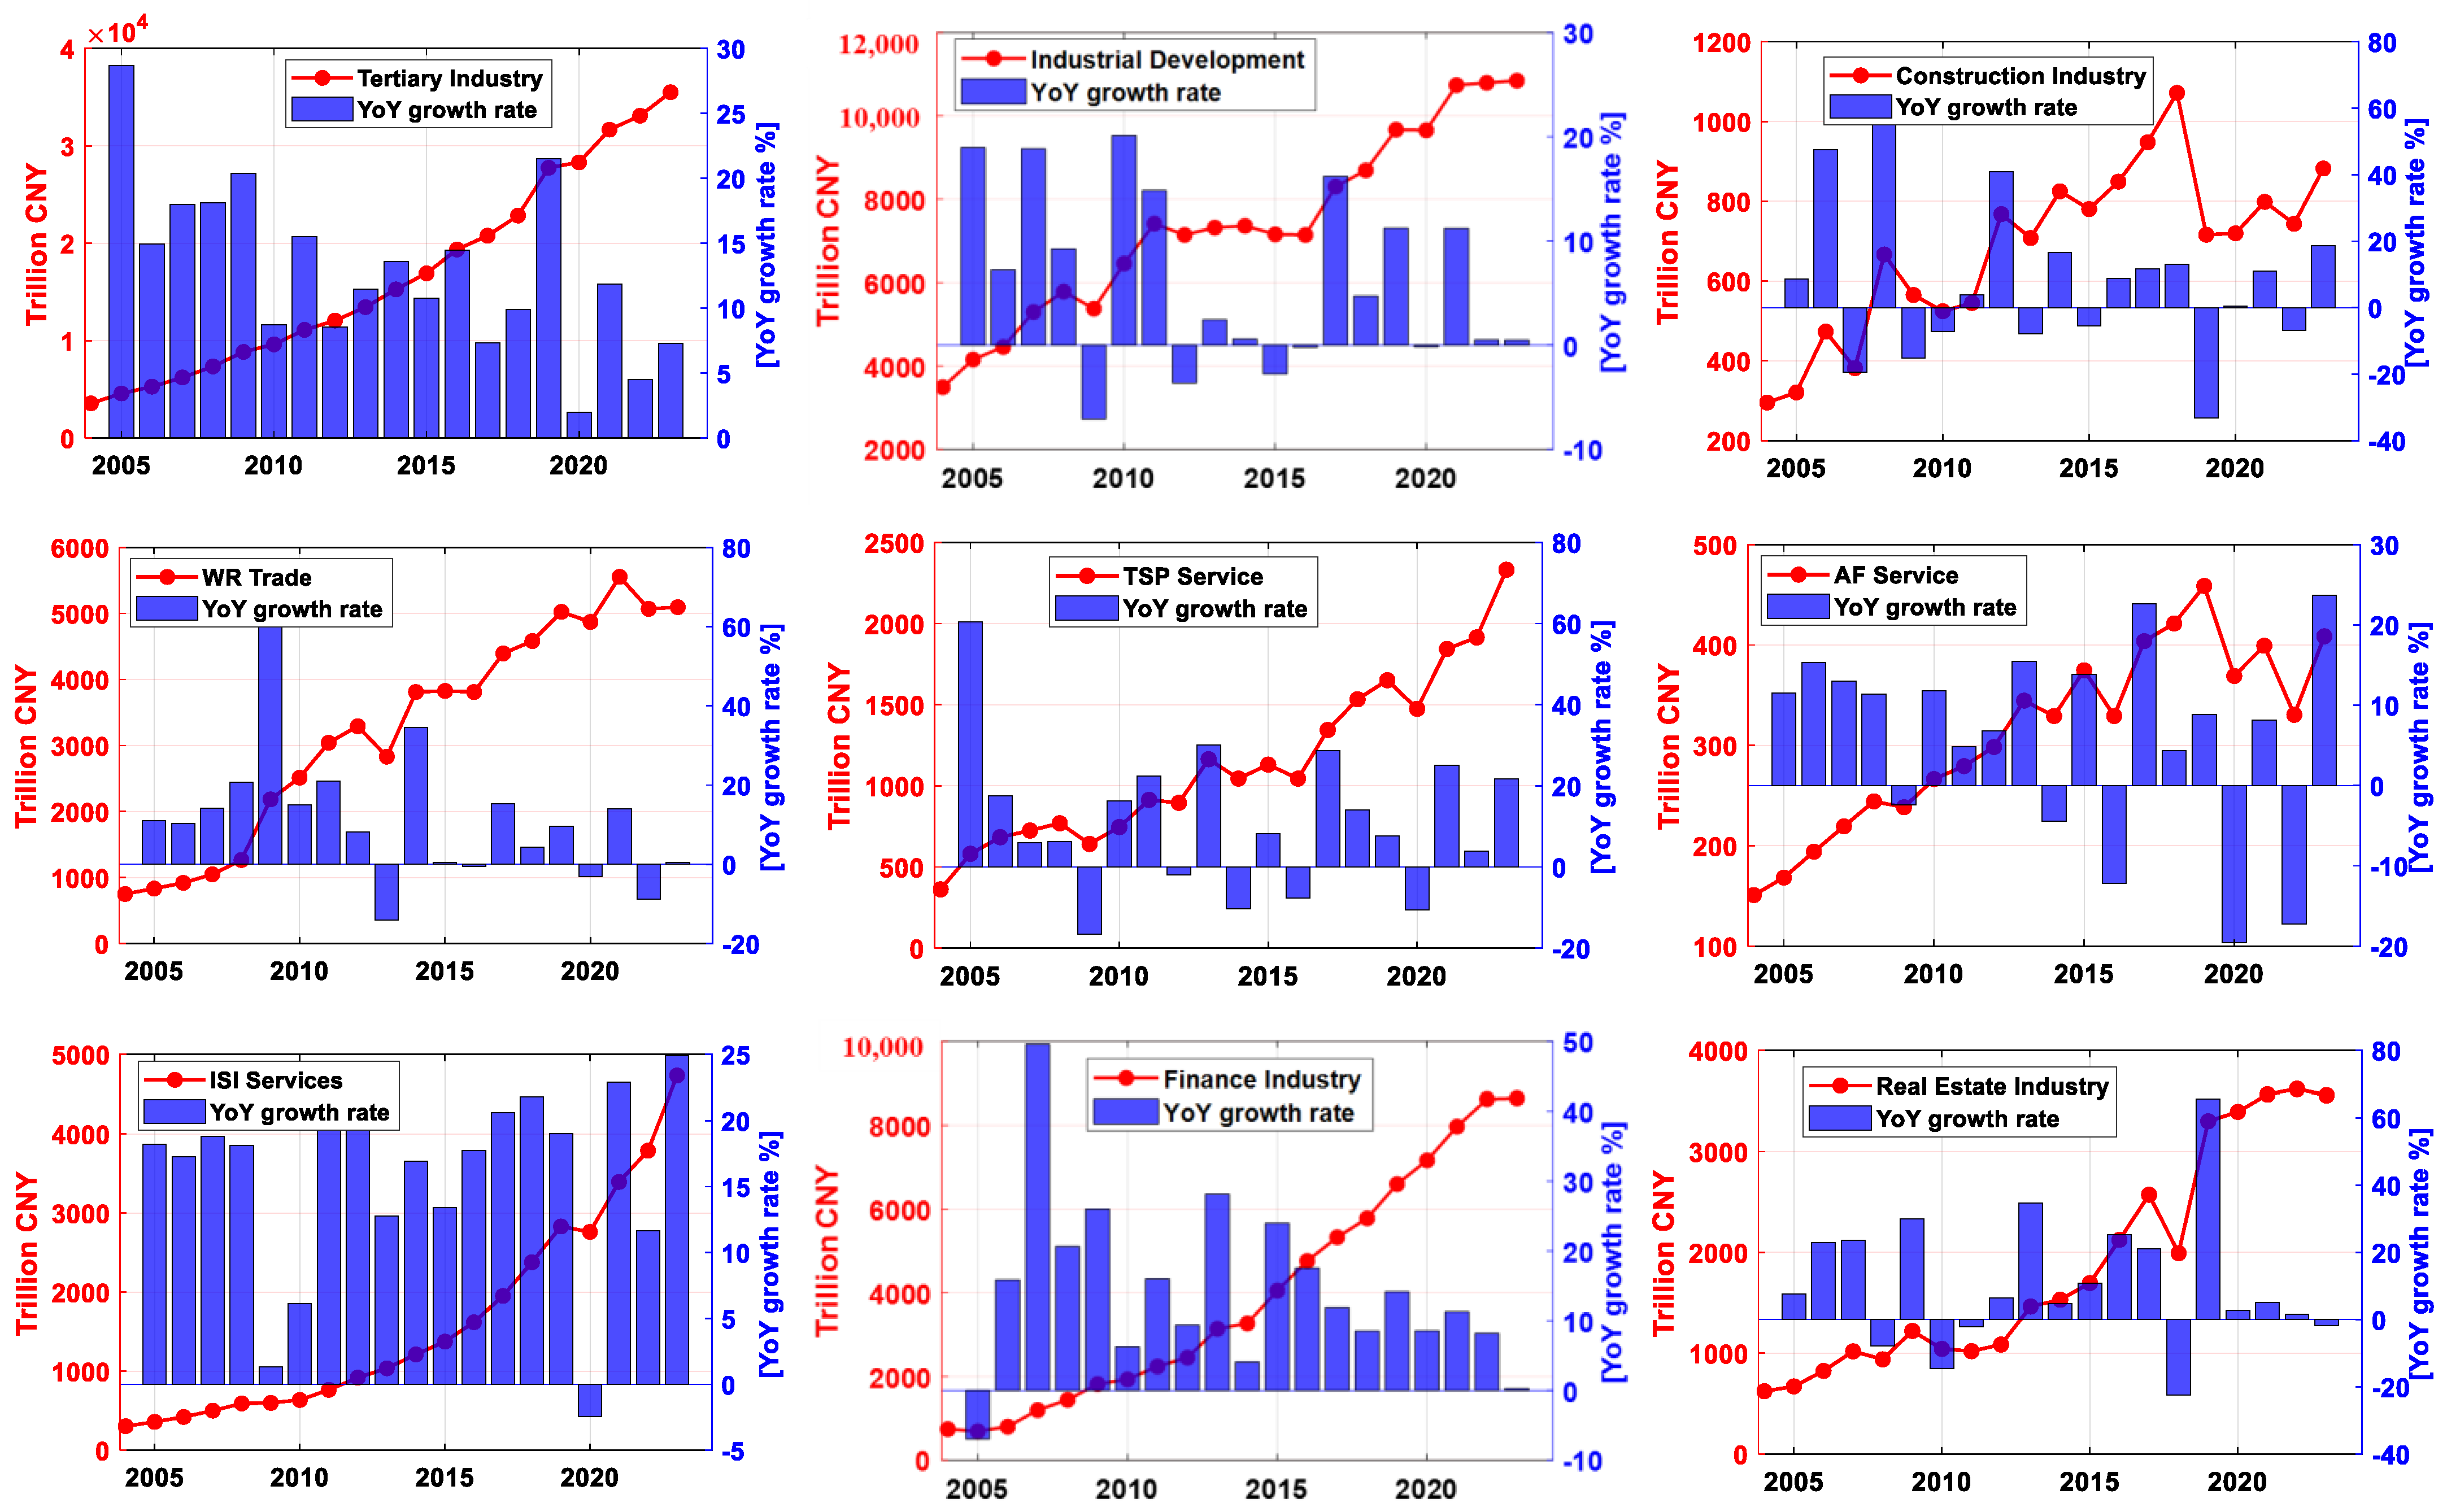
Figure 3 presents a comprehensive analysis of Shanghai’s economic growth from 2004 to 2023, highlighting both the total GDP and its distribution among the primary, secondary, and tertiary industries, together with the corresponding Year-over-Year growth rates. The figure further breaks down the secondary industry into industrial development and construction, and the tertiary industry into wholesale and retail (WR) trade, transportation, storage, and postal (TSP) services, accommodation and food (AF) services, information transmission, software, and information technology (ISI) services, finance, and real estate, providing a detailed perspective on the city’s economic evolution. Shanghai’s total GDP growth exhibited a phased transition from high-speed expansion (2004–2012: average 13.32% YoY) to moderated growth (2013–2019: average 9.63% YoY), followed by pandemic-induced volatility (2020–2023: average 5.54% YoY). The post-2012 deceleration aligns with China’s broader economic rebalancing, emphasizing quality over quantity. Notably, the tertiary sector consistently outpaced secondary and primary industries, rising from 47.9% of GDP in 2004 to 75.2% by 2023, underscoring Shanghai’s shift toward a service-oriented economy. The primary sector remained negligible (just 0.2% of GDP for 2023), while the secondary sector’s share declined from 50.8% to 24.6%, reflecting deindustrialization trends.
For the total GDP, Shanghai’s GDP exhibited a dynamic growth trajectory marked by cyclical fluctuations and structural transitions for the period from 2004 to 2023. From 2004 to 2011, the economy sustained a high annualized mean growth rate of 14.67%, fueled by export-oriented manufacturing, infrastructure expansion, and foreign direct investment inflows following China’s WTO accession. A notable inflection point occurred during the 2008–2009 global financial crisis, when YoY growth plummeted to 8.78% (2009), reflecting vulnerabilities in external demand. Post-2012, growth stabilized at 5~10%, driven by the service sector’s rise (67.8% of GDP by 2015) and policy initiatives such as the Shanghai Free Trade Zone (2013), which enhanced financial liberalization. However, post-2018 deceleration emerged, with YoY growth declining to 3.33% in 2022 due to compounded pressures: U.S.-China trade tensions disrupted supply chains, stringent pandemic controls suppressed consumption, and real estate sector deleveraging reduced fixed-asset investment [26,27,28,29,30].
From 2004 to 2023, the primary industry exhibited a declining yet structurally significant role in its economic landscape, reflecting broader trends of urbanization and economic diversification. The sector’s GDP contribution remained marginal, accounting for 0.2–1.3% of total GDP, consistent with Shanghai’s transition to a service and innovation-driven economy. Notably, YoY growth rates fluctuated within a narrow band (±20%), with intermittent contractions post-2015 due to accelerated land conversion for urban development and environmental regulations restricting agricultural expansion. A pivotal decline occurred in 2021 (–3.48% YoY), aligning with pandemic-induced labor shortages and supply chain disruptions, though partial recovery ensued by 2022 through precision agriculture adoption and agritech investments. Policy interventions, such as the 2016 “Ecological Agriculture Promotion Plan”, marginally stabilized output but failed to reverse the long-term contraction trajectory. These trends underscore the inherent tension between metropolitan expansion and primary sector sustainability, highlighting Shanghai’s strategic prioritization of high-value industries over traditional agrarian activities.
The secondary industry, encompassing industrial development and construction, has demonstrated cyclical growth patterns shaped by macroeconomic shifts, policy interventions, and external shocks. Historically driven by industrial manufacturing, the sector exhibited robust expansion during the export-led phase (2004–2012), with industrial growth averaging 9.81% YoY and peaking at 9.24% in 2008 amid strong global demand. However, post-2012 deceleration (3.39% YoY average) mirrored China’s economic rebalancing and rising labor costs, culminating in a near-stagnation of 0.52% YoY during 2022’s pandemic lockdowns. Parallel trends emerged in the construction sector, which displayed acute policy sensitivity, surging to 74.69% YoY growth in 2008 due to post-crisis infrastructure stimulus, then contracting by −6.88% YoY in 2022 under real estate deleveraging pressures. Both subsectors mirrored broader GDP trajectories, with synchronized downturns during the 2009 financial crisis and 2020 pandemic, underscoring their vulnerability to macroeconomic shocks. While industrial growth increasingly relied on advanced manufacturing (e.g., semiconductors, electric vehicles) to offset traditional sector declines, construction faced structural challenges from cyclical real estate volatility and shifting priorities toward green infrastructure. These dynamics highlight the interdependence of Shanghai’s secondary industry with global trade flows, domestic policy frameworks, and economic resilience strategies, necessitating balanced innovation incentives and stability mechanisms to mitigate cyclical disruptions.
The tertiary industry, the cornerstone of its modern economy, has undergone transformative growth and structural diversification, evolving from 47.9% of GDP in 2004 to 75.2% by 2023. The sector’s expansion reflects strategic shifts toward high-value services, though subsector performance remains heterogeneous. Within the specific segments, the WR trade sector achieved a notable growth peak in 2009. Although growth has since moderated, the sector has remained on a positive trajectory, demonstrating its resilience and enduring significance to the economy. WR trade, historically a dominant contributor, transitioned from double-digit growth (2004–2011) to moderated gains (post-2018), disrupted by e-commerce penetration and pandemic-induced consumption shifts (−3.05% YoY in 2020). Similarly, the ISI services sector has maintained relatively stable growth, showcasing its potential for sustained expansion and its role as a cornerstone of the modern economy. In contrast, ISI services emerged as a growth engine for most years, fueled by digital transformation and AI adoption. Finance industry maintained resilient growth, bolstered by Shanghai’s role as a global financial hub, though 2022 bond market turbulence temporarily dampened momentum (+8.19% YoY). However, the finance industry’s growth has been more volatile, with significant peaks in 2015 and 2020 [31]. These fluctuations can be linked to market dynamics and regulatory changes that impact the financial sector.
The real estate industry, despite some fluctuations, has generally maintained positive growth, reflecting the dynamism of Shanghai’s property market and the city’s ongoing urban development efforts [32]. The sector’s performance serves as an indicator of the city’s economic vitality and its ability to attract investments in infrastructure and housing. The real estate industry, once a hypergrowth sector (+25.28% YoY in 2016), stagnated post-2020 (+2.81% YoY) amid deleveraging policies and liquidity crises. This divergence underscores the sector’s dual reliance on innovation-driven segments and vulnerability to traditional industries (TSP, AF services). Policy initiatives, including the Shanghai Free Trade Zone and green finance incentives, have catalyzed modernization, yet challenges persist in balancing sectoral resilience with sustainable growth imperatives. The TSP services, tied to port activity and logistics, faced stagnation post-2018 due to regional competition and 2020 lockdowns (+3.86% YoY), while AF services struggled with cyclical sensitivity, plummeting −19.55% YoY in 2020 and recovering by 2023 (+23.67% YoY). The growth of Shanghai’s AF services sector is closely tied to the city’s increasing prominence as a top tourist destination, drawing both leisure and business travelers.
According to the above analysis, the tertiary sector, which serves as the cornerstone of Shanghai’s economy, has been instrumental in driving GDP growth, with its diverse segments playing critical roles. The expansion of the wholesale and retail trade sector reflects a vibrant consumer market and the increasing scale of the retail industry. Similarly, the growth in transportation, storage, and postal services highlights advancements in logistics, which have enhanced trade efficiency. Over the years under review, the tertiary industry has maintained a stable and positive growth trajectory, signaling the growing dominance of the service sector in the economy. Specifically, the wholesale and retail trade, information transmission, software, and information technology services, finance, and real estate sectors have demonstrated particularly strong growth, underscoring their robust and expanding presence. However, the transportation, storage, and postal services, along with accommodation and food services, have experienced more variable growth rates. The year 2020 was a notable exception, as both sectors saw a sharp decline in growth, likely due to pandemic-related travel restrictions and reduced consumer spending. This variability underscores the tertiary industry’s sensitivity to external shocks, such as the COVID-19 pandemic, which disproportionately affected sectors reliant on discretionary spending and mobility.
In summary, the analysis of Figure 3 reveals the transformative trajectory of Shanghai’s economy over the past two decades. The tertiary industry, particularly sectors such as information technology, finance, and real estate, has emerged as the primary engine of the city’s economic growth. While the secondary industry remains significant, it exhibits greater volatility and faces challenges stemming from market dynamics and regulatory shifts. The minimal contribution of the primary industry underscores Shanghai’s transition toward a more service-oriented and technologically advanced economy. These trends suggest that Shanghai’s future economic development will continue to hinge on the expansion and innovation within the tertiary sector. Policymakers and business leaders should prioritize creating a conducive environment for technological advancement, financial services, and high-value-added industries to sustain economic growth and reinforce Shanghai’s position as a leading global city [12].

3.2. Future GDP Prediction of Shanghai

In Section 3.1, we analyzed in depth the total GDP of Shanghai and its potential causes over the period from 2004 to 2023. Here, we forecast the future GDP of Shanghai with three commonly used prediction models, including GM(1,1) [22,23], ARIMA(1,1) [24], and SVM [25]. Firstly, to validate the performances of three commonly used models for predicting Shanghai’s GDP, we select the total GDP (2004–2021) data as the fitting series to predict the total GDP over the 2022–2023 period. The evaluation indexes of mean absolute predicted error and relative error are used to evaluate the prediction performances of three models. According to the statistical results shown in Table 1, we can find that the actual Shanghai total GDPs were CNY 44,652.80 trillion and CNY 47,218.66 trillion for 2022 and 2023, respectively. For the GM(1,1) model, the predicted GDPs were CNY 46,426.99 trillion and CNY 49,833.09 trillion for 2022 and 2023, with an average relative error of 4.76% with respect to actual GDP. For the SVM model, the relative errors were 6.73% and 10.35% for 2022 and 2023, with an average relative error of 8.54%. Compared with the two above-mentioned models, the ARIMA(1,1) model performed the best in predicting Shanghai’s GDP, with the lowest average absolute error (CNY 1364.19 trillion) and relative error (2.97%). The GM(1,1) model had the second-best prediction accuracy, while the SVM model had the largest prediction error.
Then we just use the ARIMA model to predict the Shanghai GDP for the period from 2024 to 2026. Table 2 presents the predicted and actual GDP (just for 2024) for Shanghai for the years 2024, 2025, and 2026. The GDP is categorized into primary, secondary, and tertiary industries, with further subdivisions within the secondary and tertiary sectors. Compared with primary and secondary industry, the tertiary industry encompasses various services such as WR trade, TSP services, AF services, ISI services, finance industry, real estate industry, and so on. For 2024, the recalculation of the tertiary sector led to a significant increase (CNY 4185.81 trillion) in GDP, mainly dominated by the contributions of virtual rent, e-commerce economy, and other factors which were firstly included in total GDP. Note that the virtual rent here refers to a form of economic value extracted through control over digital or intangible assets, platforms, or infrastructures in a virtual environment, which is analogous to traditional economic rent (e.g., land rent) but applies to digital ecosystems where ownership or monopolistic access to data, algorithms, network effects, or virtual spaces generates recurring revenue without direct production of goods or services. The corrective CNY 4185.81 trillion is specifically including CNY 1495.87 trillion for WR trade, CNY 104.52 trillion for AF services, CNY 2029.03 trillion for the real estate industry, and others for the leasing and business services. Considering that these increase GDP were included in GDP first time, here to keep consistent with the comparison of actual GDP in year 2024, we directly added them to the corresponding predicted total GDP, tertiary sector, WR trade, AF services and real estate industry, and then evaluated the predicted future Shanghai GDP and the corresponding sectors.
For the total GDP, the predicted GDP for 2024 is CNY 53,770.10 trillion, with the actual GDP calculated as CNY 53,926.71 trillion by adding back what was firstly included in GDP, resulting in a relative error of 0.31%. The predictions for 2025 and 2026 are CNY 56,135.72 trillion and CNY 60,321.54 trillion, respectively. About the primary industry, the predicted GDP component for 2024 is CNY 96.0374 trillion, with an actual GDP of CNY 99.70 trillion, showing a relative error of 3.67%, with the stable predictions CNY 96.0329 and CNY 96.0326 trillion for 2025 and 2026, respectively. The secondary industry includes industrial development and construction. The predicted GDP for industrial development in 2024 is CNY 11,068.78 trillion, with an actual GDP of CNY 10,910.88 trillion, resulting in a relative error of 1.45%. The construction industry’s predicted GDP for 2024 is CNY 833.85 trillion, with an actual GDP of CNY 893.45 trillion, showing a higher relative error of 6.70%.
The predicted GDP for the whole tertiary industry is CNY 41,848.53 trillion, close to CNY 42,189.84 trillion for the actual GDP for 2024, with a relative error of 0.81%. The predicted GDP for WR trade in 2024 is CNY 5182.26 trillion, with an actual GDP of CNY 6590.22 trillion, resulting in a relative error of 1.30%. The finance industry’s predicted GDP for 2024 is CNY 9043.56 trillion, with an actual GDP of CNY 8072.73 trillion, showing a relatively large error of 12.03%. After adding the contribution of virtual rent CNY 2029.03 trillion for the real estate industry, the predicted value is CNY 5595.71 trillion, close to the actual value of CNY 5584.21 trillion for 2024, with a relative error of 0.20%. Overall, the results highlight the predicted and actual GDP for various sectors in Shanghai, along with the relative errors, providing insights into the accuracy of the predictions and the economic trends in the region.

4. Discussions

The findings of this study illuminate Shanghai’s remarkable economic transformation over the past two decades, offering critical insights into the interplay between industrial restructuring, policy frameworks, and sustainable growth. The tertiary sector’s dominance—rising from 50.8% to 75.2% of GDP—reflects a globalized urban economy increasingly reliant on high-value services such as finance, technology, and real estate. Shanghai’s tertiary sector contribution (75.2% of GDP) remains proportionally lower than New York (86.7%) and Tokyo (85.1%) when measured by PPP-adjusted USD (World Bank, 2023), reflecting divergent developmental stages and policy frameworks [33]. However, unlike these cities, Shanghai’s transition is uniquely accelerated by China’s dual-circulation policy, which emphasizes domestic innovation alongside global integration [34]. This policy-driven shift challenges the conventional view that service-led economies emerge solely through market forces, as highlighted in previous studies [1,11,35]. Our findings thus provide empirical evidence for the role of institutional frameworks in shaping urban economic trajectories—a dimension underexplored in prior comparative analyses [3,19,36,37].
Shanghai’s structural transformation has been catalyzed by targeted policy interventions, such as the establishment of the Shanghai Free Trade Zone (2013), which accelerated financial liberalization and attracted foreign direct investment (FDI). The city’s integration into global value chains, particularly post-China’s WTO accession, initially fueled export-led manufacturing growth. However, post-2012 deceleration (average 9.63% YoY GDP growth) mirrors China’s broader shift toward “high-quality development”, prioritizing technological innovation and environmental sustainability over sheer output expansion. The resilience of the tertiary sector during the COVID-19 pandemic (e.g., IT services growing at 15% YoY) highlights its adaptability and underscores the importance of digitalization in sustaining economic momentum amid external shocks. These findings align with studies emphasizing the role of policy agility and technological adoption in urban economic resilience [11,12,38].
The superior performance of the ARIMA(1,1) model (MAPE 2.97%) not only validates its applicability to policy-stabilized economies but also addresses a key limitation in existing studies. For instance, Smith & Johnson [2] relied on linear regression for sectoral growth projections, which may overlook temporal dependencies. Similarly, Wang et al. [5] emphasized machine learning’s potential but lacked empirical validation in urban contexts. By integrating ARIMA with sector-specific error analysis (e.g., 12.03% error in finance subsectors), this study advances methodological rigor in economic forecasting, particularly for nonlinear sectors influenced by external shocks [24,25].
While Shanghai’s growth has been impressive, its sustainability implications warrant scrutiny. The marginalization of the primary sector (0.2% of GDP by 2023) reflects urbanization pressures and land-use conflicts, raising questions about food security and rural-urban equity. Similarly, the real estate sector’s volatility—exacerbated by speculative investments and regulatory crackdowns—highlights risks of over-reliance on asset-driven growth. Despite these challenges, the rise of green finance and digital services signals opportunities for aligning economic growth with environmental goals. For instance, the projected GDP growth to CNY 54,315.54 billion by 2026 could be channeled toward renewable energy infrastructure and circular economy initiatives, as advocated in global sustainability frameworks [10,13]. However, the feasibility of such initiatives hinges on addressing methodological limitations inherent in current economic analyses, particularly the reliance on nominal GDP metrics and the exclusion of environmental externalities—a gap we further explore in the following part.
This study’s reliance on nominal GDP data, rather than inflation-adjusted metrics, may overstate growth magnitudes, particularly in high-inflation periods. Additionally, the exclusion of informal economy contributions and environmental externalities (e.g., carbon emissions) limits the holistic assessment of sustainable development. Similar challenges are highlighted in global frameworks: the 2022 Organization for Economic Co-operation and Development (OECD) economic outlook demonstrates that PPP-adjusted multi-currency analyses can be used for equitable policy design in urban-rural contexts, though localized currency metrics remain essential for operational implementation [39]. Future research should incorporate real GDP or PPP-GDP data, sectoral carbon intensity metrics, and socioeconomic indicators (e.g., income inequality, labor market dynamics) to evaluate trade-offs between growth and sustainability.
Furthermore, investigating the impact of emerging trends—such as AI-driven automation, population aging, and geopolitical tensions—on Shanghai’s economic trajectory could provide deeper insights into long-term resilience. The rise of green finance in Shanghai mirrors global sustainability agendas such as the UN Sustainable Development Goals (SDGs) [40] and the ‘rapid decarbonization’ roadmap proposed by Rockström et al. [10]. However, our analysis reveals a critical tension: while Shanghai’s GDP growth is increasingly channeled toward renewable energy (projected CNY 60,321.54 billion by 2026), the marginalization of the primary sector (0.2% of GDP) raises concerns about rural-urban equity—a challenge less emphasized in developed economies’ sustainability frameworks [13]. This duality underscores the need for context-specific policies, as advocated in China’s 14th Five-Year Plan [14], to balance growth with inclusivity.
This study contributes to the literature in three key ways: From the temporal scope, unlike prior works focusing on short-term trends (e.g., Shen & Zhao [21] on 5-year policy impacts), our two-decade analysis captures structural shifts in Shanghai’s economy, offering longitudinal insights into industrial resilience. At the methodological integration scale, by comparing ARIMA, SVM, and GM models, we provide a validated framework for forecasting GDP in policy-driven contexts—addressing a gap identified in Wang et al. [5]. Moreover, for the policy–praxis nexus, we empirically demonstrate how China’s dual-circulation policy reshapes economic priorities, challenging assumptions about passive deindustrialization in globalization studies [1,3]. These contributions position Shanghai as a critical case for understanding hybrid economies that blend state-led and market-driven dynamics.

5. Conclusions

Over the past two decades (2004–2023), Shanghai has undergone a profound economic transformation, shifting from a manufacturing-driven economy to a service-dominated one, with the tertiary sector’s GDP contribution surging from 50.8% to 75.2%, whose GDP rising from just under CNY 1 trillion in 2004 to over CNY 5 trillion in 2023. This structural evolution aligns with global trends observed in advanced urban economies like New York and Tokyo but retains distinct characteristics shaped by China’s dual-circulation policy and localized innovation strategies. The secondary sector’s decline to 24.6% reflects not industrial stagnation but strategic rebalancing toward advanced manufacturing and value chain modernization, while the primary sector remained marginal (0.2% of GDP by 2023), underscoring Shanghai’s urbanized, post-industrial trajectory. The study leverages three forecasting models (ARIMA, SVM, GM) to analyze GDP trends, revealing that the ARIMA(1,1) model achieved superior accuracy (mean absolute error: 2.97%), projecting Shanghai’s GDP to reach CNY 60,321.54 trillion by 2026. Key drivers of growth include finance, technology, and real estate, though subsector performance varied significantly. The tertiary sector demonstrated resilience during external shocks (e.g., the COVID-19 pandemic), highlighting the critical role of digitalization and policy agility in sustaining economic momentum.
Shanghai’s structural adjustment underscores the importance of institutional reforms, such as the Shanghai Free Trade Zone and green finance incentives, in fostering innovation and global competitiveness. However, challenges persist, including over-reliance on real estate, primary sector marginalization, and vulnerability to macroeconomic shocks. To ensure sustainable growth, policymakers must prioritize tertiary innovation (e.g., fintech, AI, green technologies), diversify economic drivers beyond real estate, and address equity-environmental trade-offs through affordable housing and rural-urban integration. This study contributes a validated framework for forecasting urban GDP in policy-stabilized economies and empirical insights into industrial rebalancing. Limitations include reliance on nominal GDP data and the exclusion of environmental externalities. Future research should integrate real GDP metrics, carbon intensity analyses, and socioeconomic indicators to holistically assess sustainability. By navigating these challenges, Shanghai’s experience offers a blueprint for rapidly urbanizing regions seeking to harmonize growth with equity and ecological resilience.

Author Contributions

Conceptualization, D.W. and F.W.; methodology, D.W.; validation, D.W., F.W.; formal analysis, Y.Z.; data curation, D.W.; writing-original draft preparation, D.W.; writing-review and editing, F.W. and Y.Z.; supervision, F.W. All authors have read and agreed to the published version of the manuscript.

Funding

This work is funded by the Natural Science Foundation of China (42374017).

Institutional Review Board Statement

Not applicable.

Informed Consent Statement

Not applicable.

Data Availability Statement

The annual GDP of Shanghai and its industry component datasets (2004–2024) are publicly available on the website of the Shanghai Municipal Bureau of Statistics (https://tjj.sh.gov.cn/sjfb/index.html, accessed on 1 January 2025). Detailed sectoral calculations are provided in Table A1.

Acknowledgments

We acknowledge the Shanghai Bureau of Statistics for providing the annual economic total GDP and the corresponding industry data. The authors are grateful to the editor and three anonymous reviewers for their comprehensive and insightful comments, which have led to the improved presentation of the results.

Conflicts of Interest

The authors declare no conflicts of interest.

Abbreviations

GDPGross Domestic Product
FDIForeign Direct Investment
MAEMean Absolute Error
WRWholesale and Retail
TSPTransportation, Storage, and Postal
AFAccommodation and Food
ISIInformation Transmission, Software, and Information Technology

Appendix A

Table A1. The adopted economic datasets of Shanghai GDP, three industry components, and eight main impact factors [Trillion CNY].
IndexTotal GDPPrimary IndustrySecondary IndustryTertiary IndustrySecondary IndustryTertiary Industry
Industrial DevelopmentConstruction IndustryWR TradeTSP ServicesAF ServicesISI ServicesFinance IndustryReal Estate Industry
20047450.2796.713788.223565.343492.89295.33751.30362.44150.88303.84741.68622.59
20059143.9579.654475.924588.384155.23320.69833.95581.27168.31359.21689.87670.23
200610,296.9793.814929.205273.964456.04473.16919.43683.61194.08421.31799.37824.10
200712,001.16101.845677.506223.835295.9381.601049.34724.58219.36500.651195.721018.4
200813,698.15111.806235.927350.435784.99666.621266.37769.64244.26591.421442.6939.17
200914,900.93113.825939.968847.155374.91565.052183.86642.13238.36599.261817.851220.92
201016,872.42114.507139.969618.316456.78524.372512.89746.41266.45636.031931.731042.5
201119,195.69124.947959.6911,111.067414.77544.923040.99913.60279.34763.862240.471019.68
201220,101.33127.807912.7712,060.767145.02767.753291.93895.31298.40918.832450.361085.96
201321,602.12129.288027.7713,445.077319.79707.982831.231164.24344.581036.323140.461462.44
201423,560.00124.268164.7915,271.897362.84825.103809.311044.46329.281211.833268.431530.96
201524,964.99109.787940.6916,914.527160.25780.443826.421130.88374.821374.514052.231696.02
201627,466.15109.477994.3419,362.347145.02849.323809.311044.46329.281618.584762.52124.78
201730,133.8698.999251.4020,783.478303.54947.864393.361344.24403.831952.145328.522571.38
201832,679.87104.379732.5422,842.928694.951071.754581.491533.36421.462377.65781.631992.52
201938,155.32103.8810,299.1627,752.289670.68716.165023.231650.44458.862830.116600.63300.72
202038,700.58103.5710,289.4728,307.549656.51719.644869.891474.82369.142760.67166.263393.4
202143,214.8599.9711,449.3231,665.5610,738.8798.495554.031843.46399.313392.887973.253564.49
202244,652.8096.9511,458.4333,097.4210,794.54743.575068.51914.53330.453788.568626.313619.21
202347,218.6696.0911,612.9735,509.610,846.16882.255094.522331.48408.664732.038646.863555.18
202453,926.7199.7011,637.5742,189.4410,910.88893.456590.222003.02513.186062.338072.735584.21
Note. Second industry: Industrial development and construction industry; tertiary industry: wholesale and retail (WR) trade; transportation, storage, and postal (TSP) services; Accommodation and food (AF) services; Information transmission, software, and information technology (ISI) services; Finance industry; and Real estate industry. The datasets are derived from the publicly available annual reports of the Shanghai Municipal Bureau of Statistics (2004–2024), accessible via https://tjj.sh.gov.cn/sjfb/index.html (accessed on 1 January 2025).

References

  1. Chen, S.; Zhang, X. Economic growth and industrial structure optimization in Shanghai. China Ind. Econ. 2017, 1, 4–16. [Google Scholar]
  2. Smith, J.; Johnson, P. Industrial restructuring and environmental quality: Evidence from developed economies. J. Environ. Econ. Manag. 2018, 93, 1–20. [Google Scholar]
  3. Wang, S.; Li, J. The role of foreign direct investment in Shanghai’s economic growth. Int. Bus. Res. 2021, 14, 150–160. [Google Scholar]
  4. World Bank. World Development Report 2023: Navigating Global Economic Challenges. 2023. Available online: https://www.worldbank.org/en/publication/wdr2023 (accessed on 1 January 2025).
  5. Wang, D.; Zhang, Z.; Wang, F.; Qiu, X. Quantification of the short-term impact of economic shock events on the gross domestic product of 31 provinces in China from 2005 to 2022. SN Bus. Econ. 2024, 4, 86. [Google Scholar] [CrossRef]
  6. Wang, Q.; Chen, S.; Yi, H. A Two-Stage Evaluation of China’s New Energy Industrial Policy Package. Sustainability 2024, 16, 8264. [Google Scholar] [CrossRef]
  7. Liu, W. An empirical analysis of economic structural transformation and air pollution prevention in Shanghai. Urban Dev. Stud. 2019, 26, 45–52. [Google Scholar]
  8. Li, M. Research on the relationship between economic structural adjustment and air quality changes in Beijing, Shanghai, and Guangzhou. J. Environ. Sci. 2020, 40, 234–245. [Google Scholar]
  9. Xu, W.; Wang, M. How Do Financial Development and Industrial Structure Affect Green Total Factor Energy Efficiency: Evidence from China. Energies 2024, 17, 389. [Google Scholar] [CrossRef]
  10. Rockström, J.; Gaffney, O.; Rogelj, J.; Meinshausen, M.; Nakicenovic, N.; Schellnhuber, H.J. A roadmap for rapid decarbonization. Science 2017, 355, 1269–1271. [Google Scholar] [CrossRef]
  11. United Nations. Transforming our World: The 2030 Agenda for Sustainable Development. 2015. Available online: https://sdgs.un.org/sites/default/files/publications/21252030%20Agenda%20for%20Sustainable%20Development%20web.pdf (accessed on 1 January 2025).
  12. Zhou, P.; Li, X. The effect of government policy on economic growth in Shanghai. Public Adm. Dev. 2023, 33, 85–95. [Google Scholar]
  13. Steffen, W.; Rockström, J.; Richardson, K.; Lenton, T.M.; Folke, C.; Liverman, D.; Summerhayes, C.P.; Barnosky, A.D.; Cornell, S.E.; Crucifix, M.; et al. Trajectories of the Earth System in the Anthropocene. Proc. Natl. Acad. Sci. USA 2018, 115, 8252–8259. [Google Scholar] [CrossRef] [PubMed]
  14. Government of China. China’s 14th Five-Year Plan for National Economic and Social Development and the Long-Range Objectives Through the Year 2035. 2021. Available online: https://www.ndrc.gov.cn/xxgk/zcfb/ghwb/202103/t20210323_1270124.html (accessed on 1 January 2025). (In Chinese)
  15. World Bank. The Changing Wealth of Nations 2021: Managing Assets for the Future. 2021. Available online: https://hdl.handle.net/10986/36400 (accessed on 1 January 2025).
  16. World Economic Forum. The Future of Growth Report 2024; World Economic Forum: Geneva, Switzerland, 2024; Available online: https://www3.weforum.org/docs/WEF_Future_of_Growth_Report_2024.pdf (accessed on 1 January 2025).
  17. Holz, C.A. China’s economic growth 1978–2025: What we know today about China’s economic growth tomorrow. World Dev. 2008, 36, 1665–1691. [Google Scholar] [CrossRef]
  18. National Bureau of Statistics of China. 2024. Available online: https://www.stats.gov.cn/sj/ (accessed on 1 January 2025).
  19. Zhang, J.; Chen, H. The impact of high-tech industries on economic growth in Shanghai. J. Shanghai Jiao Tong Univ. (Sci.) 2022, 27, 55–65. [Google Scholar]
  20. Shanghai Municipal Government. Shanghai’s 14th Five-Year Plan for Economic and Social Development and the Long-Range Objectives through the Year 2035; Shanghai Municipal Government: Shanghai, China, 2021. Available online: https://www.shanghai.gov.cn/2035nyjmbgy/# (accessed on 1 January 2025).
  21. Shen, J.; Zhao, X. Innovation-driven development strategy and economic growth in Shanghai. Sci. Technol. Manag. Res. 2019, 39, 34–42. [Google Scholar]
  22. Wang, Y.; Wang, S. A novel grey prediction model and its application in economic forecasting. Math. Comput. Model. 2012, 55, 1380–1386. [Google Scholar]
  23. Deng, J.L. Control problems of grey systems. Syst. Control Lett. 1982, 1, 288–294. [Google Scholar]
  24. Box, G.E.P.; Jenkins, G.M.; Reinsel, G.C. Time Series Analysis: Forecasting and Control. J. Time Ser. Anal. 2010, 31, 303. [Google Scholar] [CrossRef]
  25. Chang, C.C.; Lin, C.J. LIBSVM: A library for support vector machines. ACM Trans. Intell. Syst. Technol. (TIST) 2011, 2, 1–27. [Google Scholar] [CrossRef]
  26. Han, A.; Li, M.; Gao, Z. Analysis of Economic Resilience Measurement and Influencing Factors under the Impact of the Epidemic. Stat. Decis. 2021, 37, 85–89. [Google Scholar] [CrossRef]
  27. Jena, P.R.; Majhi, R.; Kalli, R.; Managi, S.; Majhi, B. Impact of COVID-19 on GDP of major economies: Application of the artificial neural network forecaster. Econ. Anal. Policy 2021, 69, 324–339. [Google Scholar] [CrossRef]
  28. Xiao, J.; Shen, T.; Ling, Y. The Impact and Countermeasures of the COVID-19 on Regional Economic Development: Summary of the 15th Symposium of “Chinese Regional Economists of 50 Forum”. Reg. Econ. Rev. 2020, 4, 140–145. [Google Scholar] [CrossRef]
  29. Zhu, Q.; Sun, M.; Yang, W. Assessment of the Impact of COVID-19 Epidemic on China’s Economy: Empirical Analysis based on the GTAP Model. Stat. Decis. 2020, 36, 91–96. [Google Scholar] [CrossRef]
  30. Li, W.; Zan, W. An empirical analysis of the impact of the COVID-19 pandemic on China’s GDP. Hebei Enterp. 2022, 5, 24–26. [Google Scholar] [CrossRef]
  31. He, C.; Wang, Y. The impact of financial development on economic growth: Evidence from Shanghai. Financ. Econ. Res. 2018, 43, 12–23. [Google Scholar]
  32. Ouyang, J. The impact of changes in housing prices on China’s economy. Dean Fr. 2024, 1, 1–4. [Google Scholar] [CrossRef]
  33. World Bank. Global Urban Economic Development Report. 2020. Available online: https://documents.worldbank.org/en/publication/documents-reports (accessed on 1 January 2025).
  34. Gu, X. Evolutionary Characteristics and Development Pathways of Shanghai’s Economy under the Dual Circulation Strategy. Mod. Bus. Trade Ind. 2022, 43, 18–20. [Google Scholar] [CrossRef]
  35. Liu, J. The Study of the Optimization of Industrial Structure and Population Size–Taking Shanghai as an Example. World J. Soc. Sci. 2014, 1, p72. [Google Scholar] [CrossRef]
  36. Liu, Z.; Fang, Y.; Ma, L. A Study on the Impact of Population Age Structure Change on Economic Growth in China. Sustainability 2022, 14, 3711. [Google Scholar] [CrossRef]
  37. Ma, X. The relationship between industrial structure and economic growth—Take Shanghai as an example. Foreign Econ. Relat. Trade 2021, 4, 75–79. (In Chinese) [Google Scholar]
  38. Li, H.; Zhang, Y. The influence of urbanization on economic growth: A case study of Shanghai. Urban Stud. 2020, 27, 78–89. [Google Scholar]
  39. Organization for Economic Co-operation and Development OECD. OECD Economic Outook, Volume 2022 Issue 2; OECD Publishing: Paris, France, 2022. [Google Scholar] [CrossRef]
  40. The Sustainable Development Goals Report 2023. Available online: https://unstats.un.org/sdgs/report/2023/ (accessed on 1 January 2025).
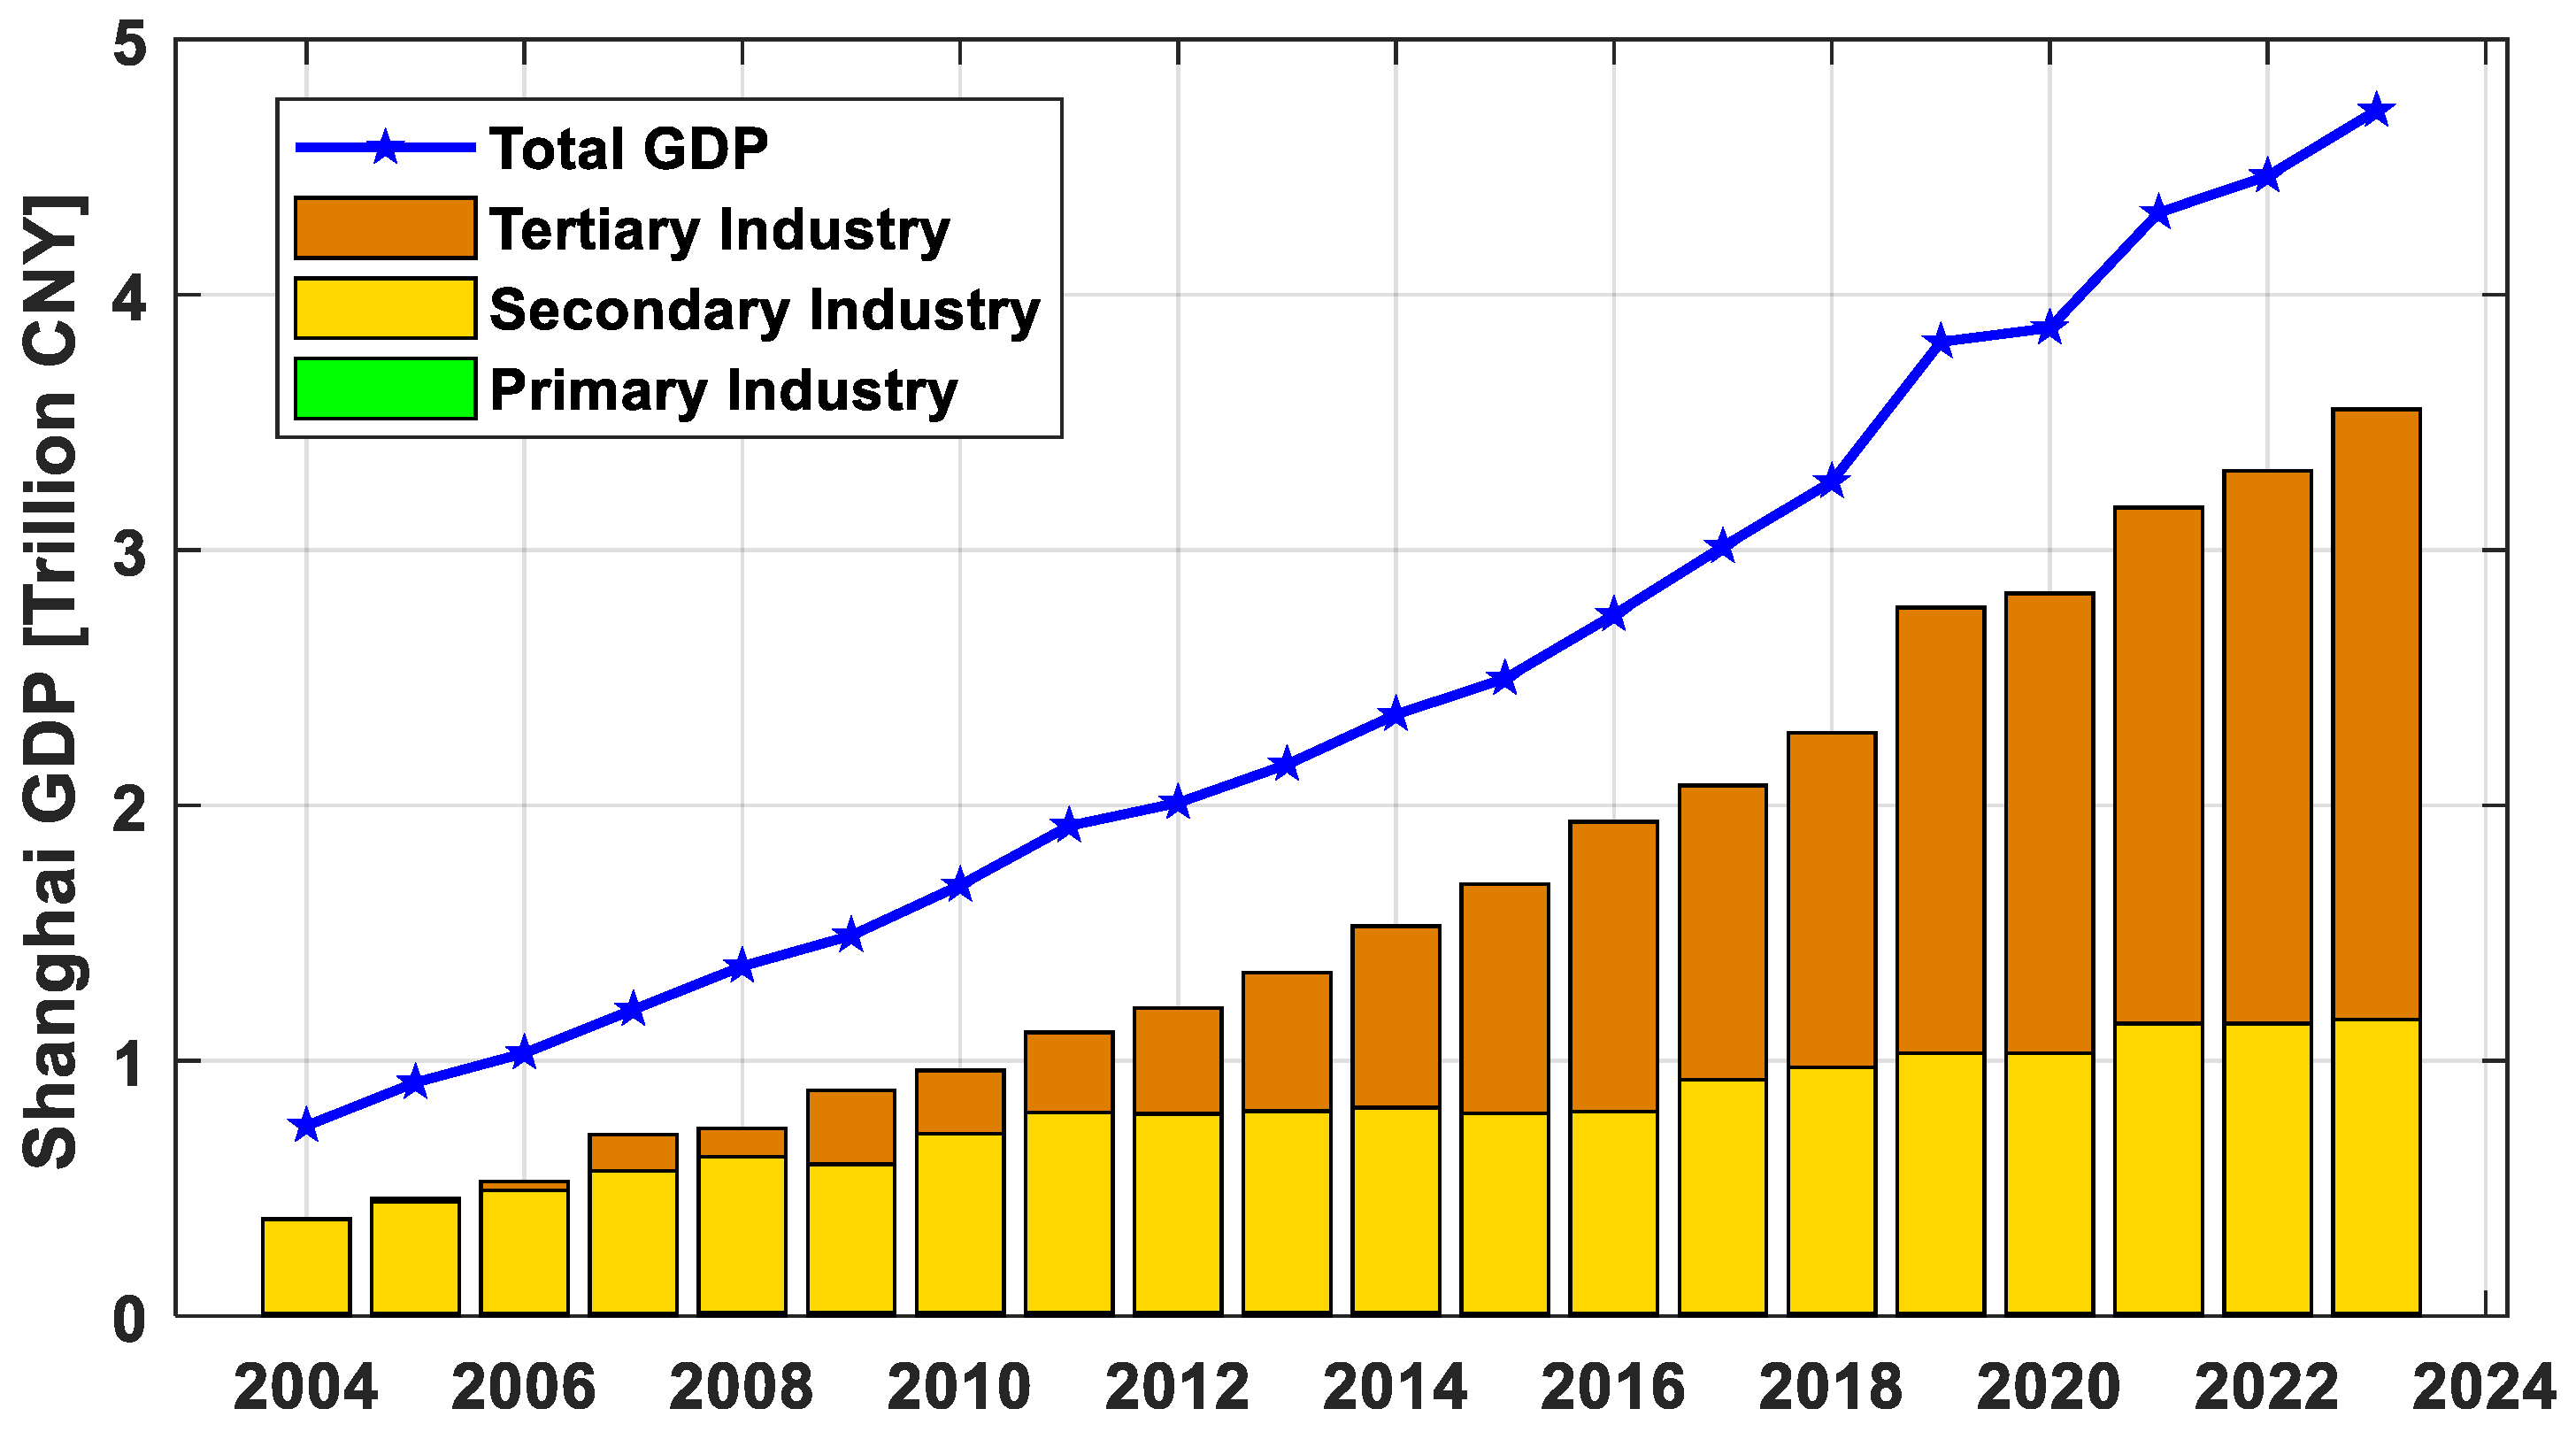
Figure 1. The yearly total GDP of Shanghai and its components of three industry components over the period from 2004 to 2023 (Source: Shanghai Municipal Bureau of Statistics, 2004–2023).
Sustainability 17 04318 g001
Figure 2. The contributions of three industries to the total GDP of Shanghai over the period from 2004 to 2023 (Source: Shanghai Municipal Bureau of Statistics, 2004–2023).
Sustainability 17 04318 g002
Figure 3. The Year-over-Year (YoY) growth rates of Shanghai’s total GDP, three industry components (primary, secondary, and tertiary industry), and the corresponding components of secondary and tertiary industry. Second industry: Industrial development and construction industry; Tertiary industry: Wholesale and Retail (WR) trade, transportation, storage, and postal (TSP) services, accommodation and food (AF) services, information transmission, software, and information technology (ISI) services, finance industry, and real estate industry. (Source: Shanghai Municipal Bureau of Statistics, 2004-2023).
Sustainability 17 04318 g003aSustainability 17 04318 g003b
Table 1. The predicted economic GDP of Shanghai using three commonly used models [Trillion CNY].
YearTrue GDPGM(1,1)SVMARIMA(1,1)
PredictionDifferenceRelative Error (%)PredictionDifferenceRelative Error (%)PredictionDifferenceRelative Error (%)
202244,652.8046,426.991774.193.9747,660.153007.356.7345,938.231285.432.88
202347,218.6649,833.092614.435.5452,105.814887.1510.3548,661.611442.953.06
Evaluation indexMean absolute error2194.314.763947.258.541364.192.97
Note. Source: Shanghai Municipal Bureau of Statistics, 2004–2023.
Table 2. The predicted GDP of Shanghai by the ARIMA model [Trillion CNY].
Index202420252026
PredictionTrue GDPRelative Error (%)PredictionPrediction
0Total GDP53,770.1053,926.710.2956,135.7260,321.54
1Primary96.037499.703.6796.032996.0326
2Secondary11,859.1911,637.571.9012,095.0312,320.91
3Tertiary41,848.5342,189.840.8144,001.6546,154.06
2-1Industrial development11,068.7810,910.881.4511,281.5011,484.76
2-2Construction industry833.85893.456.70840.27839.42
3-1WR Trade6678.136590.221.336598.426670.82
3-2TSP Services2219.062003.0210.782317.362231.41
3-3AF Services453.84513.1811.56513.58453.84
3-4ISI Services5335.246062.3311.995938.456541.66
3-5Finance Industry9043.568072.7312.039436.039824.32
3-6Real Estate Industry5595.715584.210.205589.855592.92
Note. Second industry: Industrial development and construction industry; tertiary industry: wholesale and retail (WR) trade, transportation, storage, and postal (TSP) services, accommodation and food (AF) services, information transmission, software, and information technology (ISI) services, finance industry, and real estate industry. (Source: Shanghai Municipal Bureau of Statistics, 2004–2023).
Disclaimer/Publisher’s Note: The statements, opinions and data contained in all publications are solely those of the individual author(s) and contributor(s) and not of MDPI and/or the editor(s). MDPI and/or the editor(s) disclaim responsibility for any injury to people or property resulting from any ideas, methods, instructions or products referred to in the content.