1. Introduction
Apples (
Malus domestica) are one of the most important fruit species cultivated worldwide. In 2024, apple production in Poland reached 3.4 million tons, making it the largest apple producer in the European Union and placing it fourth in the world, after China, the United States, and Turkey [
1]. Such a scale of production highlights the crucial role of apples in both the national and global agricultural sectors. At the same time, there is growing consumer awareness of the importance of a healthy diet, including fruit consumption, with particular emphasis on apples grown using organic methods due to their perceived health benefits. In Poland, according to the Ministry of Agriculture and Rural Development, the area of organic apple orchards is steadily increasing, currently covering approximately 5500 hectares, producing about 172,000 tons of apples annually. Only France, Italy, and Germany in the European Union have larger areas of organic apple orchards.
Apples, due to their pleasant taste, nutritional value, long shelf life, and ease of cultivation and harvesting, are among the most commonly consumed fruits worldwide [
2]. However, due to the limited number of apple clones/cultivars suitable for organic farming, there is a need to search for new clones/cultivars that are more resistant to diseases such as
Venturia inaequalis, the most harmful disease affecting apple trees in temperate climates [
3,
4,
5]. In addition to disease resistance, new apple clones should exhibit optimal levels of acidity, appropriate sugar content, and a high concentration of phenolic compounds. These compounds, such as flavonoids, phenolic acids, and anthocyanins, are bioactive organic substances found in apples that offer significant health benefits. Studies have shown that quercetin and chlorogenic acid, which belong to this group of compounds, have strong antioxidant properties that may help reduce the risk of chronic diseases, including cardiovascular diseases and cancer [
6,
7,
8,
9,
10]. It would therefore be beneficial to identify apple varieties with high levels of polyphenols when developing new apple breeds. Additionally, the presence of polyphenolic compounds in apples is closely related to the color of the flesh. Cultivars with red flesh, which contain higher amounts of anthocyanins (flavonoids), have higher concentrations of phenolic compounds exhibiting antioxidant and anti-inflammatory properties [
9,
11]. Different apple clones can vary in their content of bioactive compounds, which impacts their health and flavor value [
12]. This variability can be exploited in breeding programs, as phenolic compounds—particularly flavonoids and anthocyanins—are promising biochemical markers for the selection of clones with enhanced nutritional value and functional properties. The identification of genotypes with elevated levels of specific phenolics, such as quercetin and chlorogenic acid, may support the development of apple varieties better suited for health-oriented consumer demands and functional food markets.
The health value of apples is also dependent on various factors, such as environmental conditions, including temperature, sunlight exposure, and orchard management practices [
13]. For example, apples grown in regions with higher sunlight exposure typically have higher levels of phenolic compounds compared to those grown in more shaded areas. The use of organic farming methods, which avoid synthetic fertilizers and pesticides, may also lead to higher levels of bioactive compounds in apples, as plants are subjected to natural stresses that stimulate their production [
14]. Therefore, the selection of suitable apple clones and their cultivation under organic farming conditions may contribute to increasing the content of valuable phenolic compounds in the fruit.
Sugars such as glucose, fructose, and sucrose are the main components responsible for the sweetness of apples and play a key role in determining the flavor of the fruit [
2]. The sugar content also affects their storage potential, as higher sugar levels can improve the fruit’s shelf life during storage and transport. Organic acids, particularly malic acid, are responsible for the characteristic sourness of apples, which is an important element in the overall flavor profile of different cultivars. High acid content may reduce consumer acceptance of apples for direct consumption, but such characteristics are of greater importance in industrial processing, because high acidity is a desirable parameter due to the conferred increase in the stability of the processed product [
11,
15]. High-acidity apples are preferred in processing because their distinctive flavor remains stable after heat treatment and storage. Natural acidity also helps preserve processed products by limiting the growth of microorganisms and allowing for a reduction in the addition of preservatives. As a result, products such as juices, purees, and mousses have a more intense flavor and a longer shelf life.
In the context of breeding new apple clones/cultivars, particular attention should be paid to their chemical composition, as it significantly influences their flavor, nutritional value, and health properties. Research on polyphenolic compounds and antioxidant activity in different apple clones/cultivars indicates significant differences between new and older cultivars, which could serve as a guideline for selecting clones/cultivars with improved health properties [
16]. Moreover, the analysis of the chemical composition of apples is also essential for optimizing cultivation conditions, particularly in organic farming systems, where restrictions on the use of synthetic fertilizers and pesticides may affect the concentrations of bioactive substances in the fruit.
The objective of this study was to assess the quality of apples from new breeding clones based on an analysis of their chemical composition, including sugar levels, organic acids, and phenolic compounds, and the flesh color parameters of the fruit, combined with image analysis. Therefore, the relationships between chemical properties (measured destructively) and color characteristics with image textures (measured nondestructively) of four new apple clones, ‘Free Redstar’ × ‘Melfree’, ‘Free Redstar’ × ‘Ariwa’, ‘Free Redstar’ × ‘Rajka’, and ‘Free Redstar’ × ‘Rubinola’, were determined. The combination of destructive and nondestructive methods will allow for a detailed understanding of the factors influencing apple quality. It can contribute to the development of new apple clones/cultivars with optimal taste, nutritional value, and resistance to common apple tree diseases. It was assumed that there are relationships between the parameters extracted from images and the chemical properties and color parameters of new apple clones. This work describes our research into whether a nondestructive approach based on image analysis can be applied for estimating the content of sugars and acids, total polyphenol content (TPC), and color parameters of different white-fleshed apple clones (‘Free Redstar’ × ‘Melfree’, ‘Free Redstar’ × ‘Ariwa’, ‘Free Redstar’ × ‘Rajka’, and ‘Free Redstar’ × ‘Rubinola’).
2. Materials and Methods
2.1. Raw Material
The research was conducted on the fruit of four new apple clones, one of whose parents was the cultivar (cv.), ‘Free Redstar’. The apples came from the Ecological Experimental Orchard of the National Institute of Horticultural Research (InHort) located in Nowy Dwór-Parcela near Skierniewice, central Poland (51°52′11.1′′ N 20°14′50.2′′ E). New apple clones under the numbers J-2004-01 (168/2—‘Free Redstar’ × ‘Melfree’), J-2004-04 (143/3—‘Free Redstar’ × ‘Ariwa’), J-2004-07 (7/13—‘Free Redstar’ × ‘Rajka’), and J-2004-08 (8/13—‘Free Redstar’ × ‘Rubinola’) were bred at the Department of Horticultural Crop Breeding of InHort (National Institute of Horticultural Research, Skierniewice, Poland). Scab-resistant cultivars were selected to obtain new breeding clones. The obtained 1-year-old trees on the M.9 (Malling 9) rootstock were planted in a random block arrangement, the so-called split-block, in four repetitions of four trees per plot in the autumn of 2021. This study used a Randomized Complete Block Design (RCBD), in which all genotype combinations tested were randomly distributed within each block. This type of experimental design is widely used in field experiments to minimize the influence of environmental variability (e.g., soil diversity or microclimate), which allows for more reliable and repeatable results. Basic maintenance treatments were carried out in the experimental plots, including weed control, organic fertilization (cattle manure), and tree irrigation (automatically controlled drip system). The trees were trained in the form of a spindle, and pruning and shaping were performed annually. Tree protection against diseases and pests was carried out using agents permitted for use in organic orchards.
In the study, 16 trees were planted for each clone, resulting in 4 repetitions with 4 trees per repetition. The yield was collected from all trees, and the mean value was then calculated. The results were determined as the average yield per tree. Fruit firmness for each clone was measured on a sample of 25 fruits. Measurements were taken using a GY-03 penetrometer (Step System, Nuremberg, Germany) with a head diameter of 11 mm. For each fruit, two measurements were performed: one on the side of the blush and one on the opposite side, after making a slight incision on the skin. Yield (kg tree−1) and fruit firmness (kg cm−2) were used as the basis for evaluating the genotypic diversity in terms of productivity and firmness (which may influence fruit quality).
A total of 25 apples of each clone were selected to measure image textures, color parameters, and chemical characteristics. The clones were of uniform maturity and size and without visible damage. Exemplary images of apples are presented in
Figure 1. Before measurements, each apple was washed with portable water and naturally air-dried. The images and color parameters of apple clones were obtained at ambient temperature (22 ± 2 °C) to ensure consistent environmental conditions. Before experiments, apples were cut into 5 mm thick slices to obtain sections. Directly after cutting each apple, slices were used for color measurements, then placed on the scanner scene to acquire color images, and after that, the same slices were used for chemical analysis.
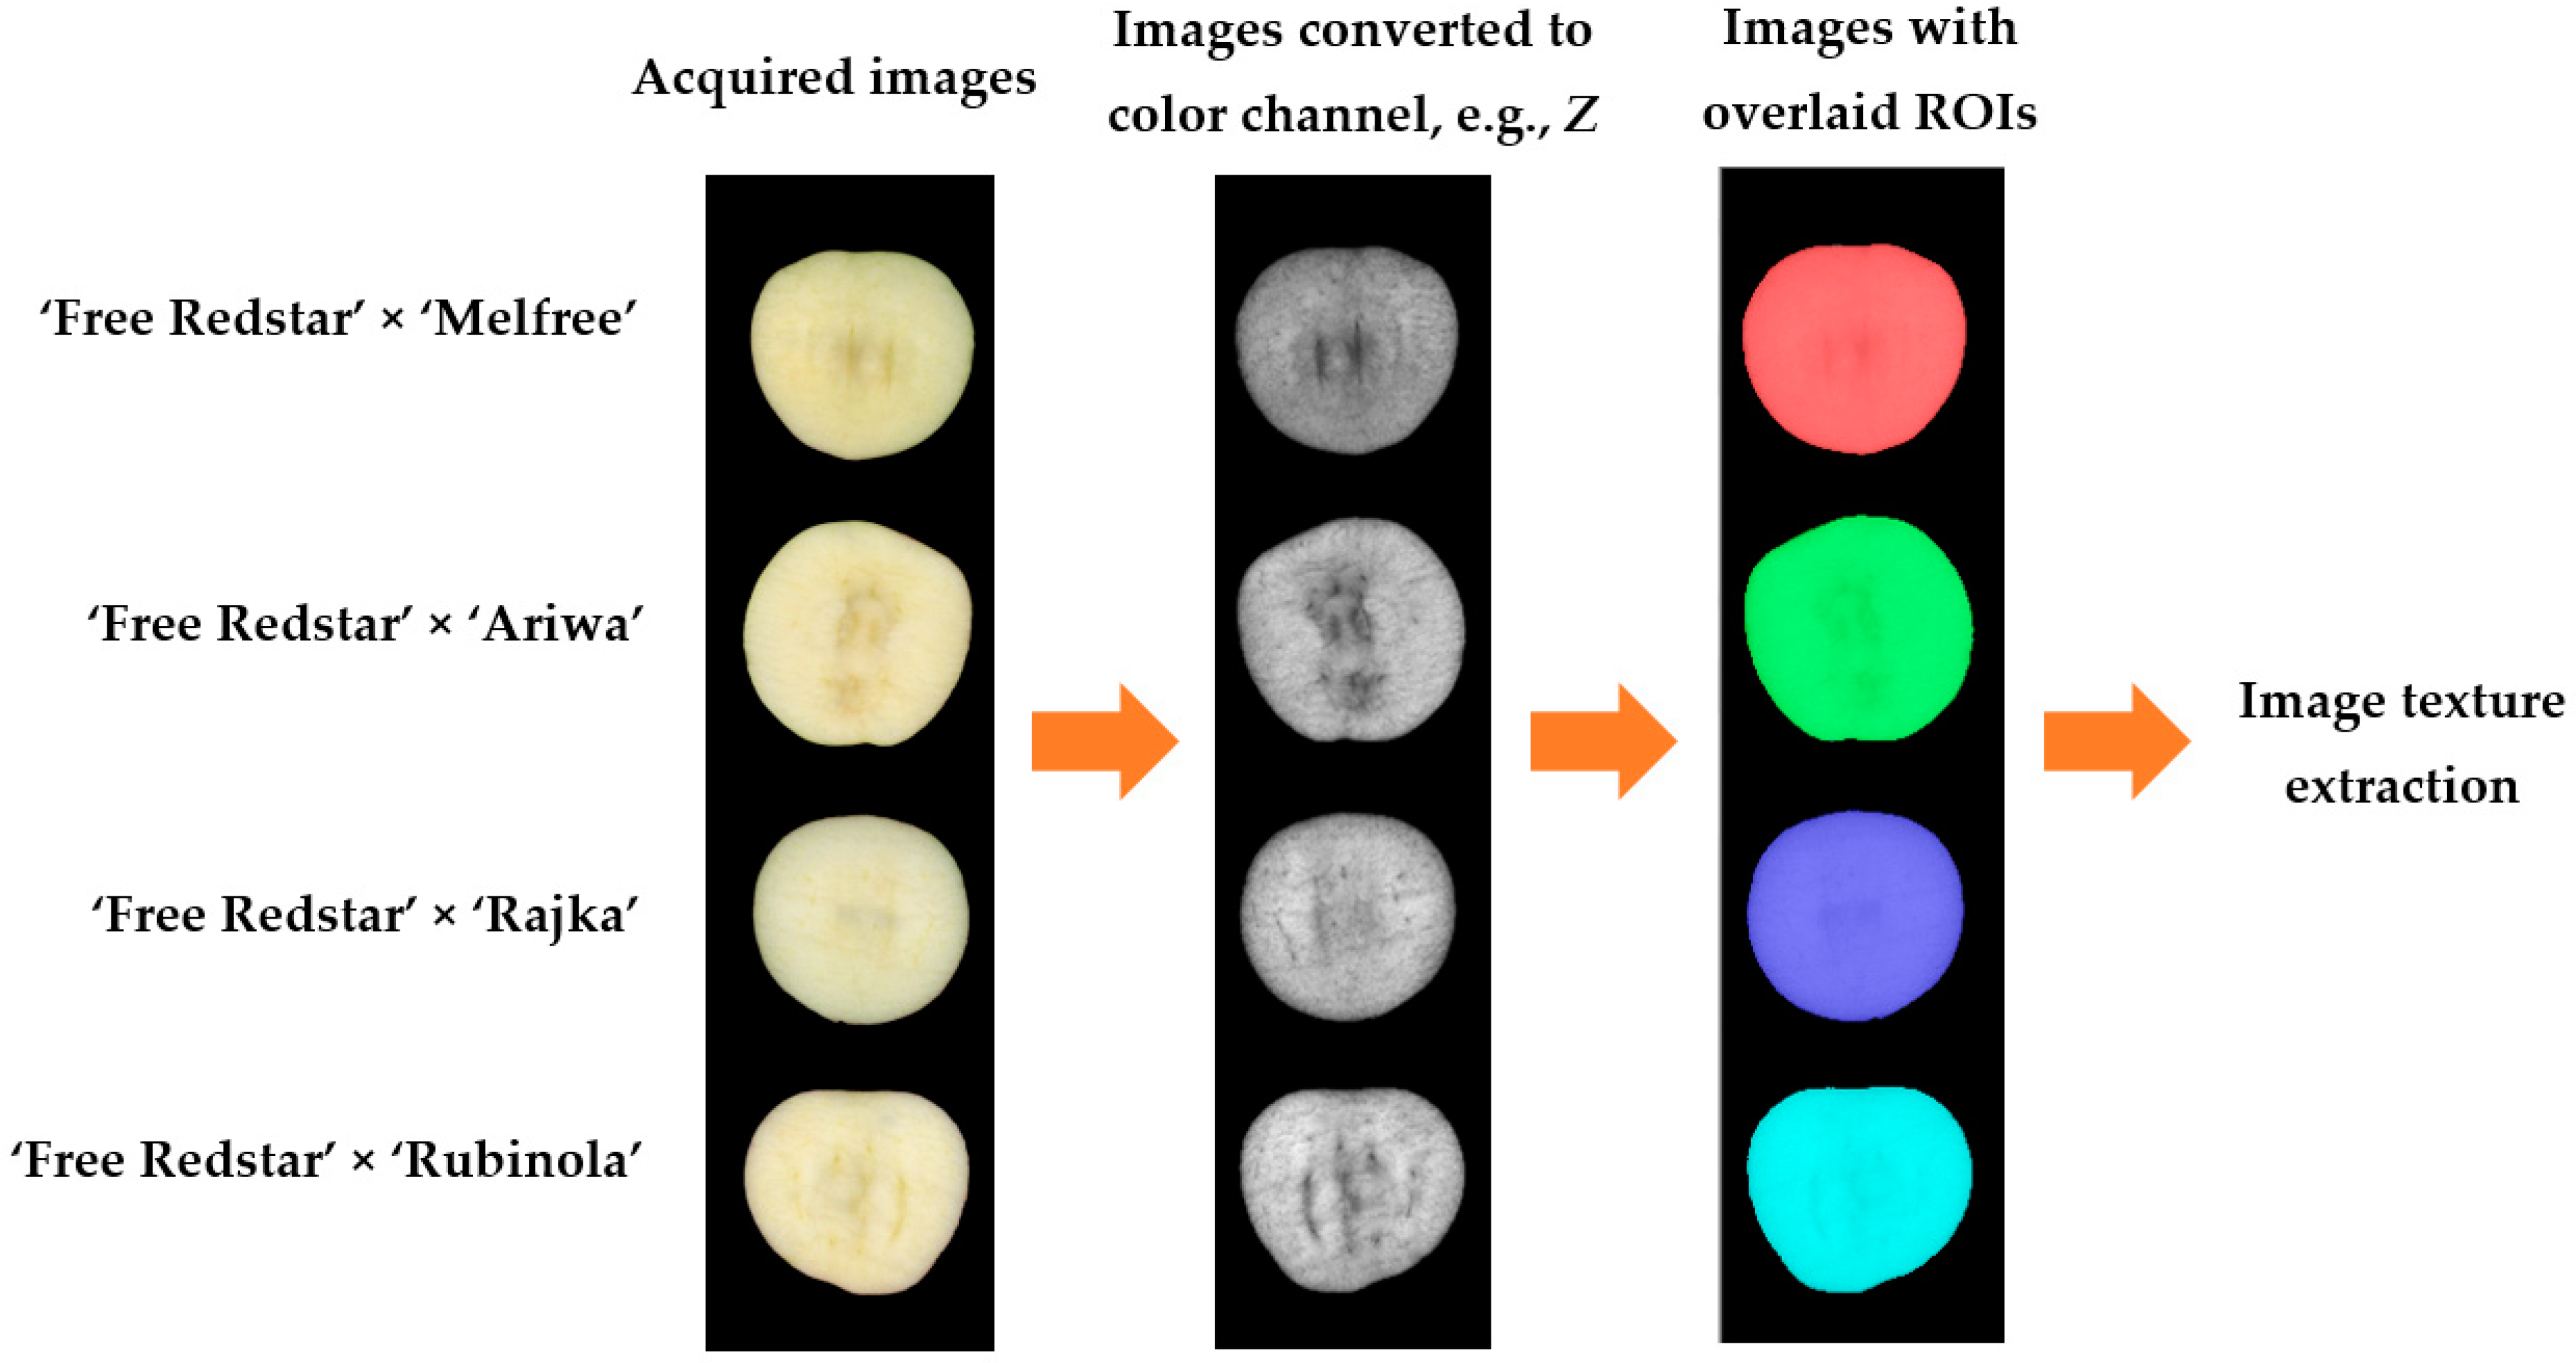
2.2. Image Analysis
The images were acquired using a flatbed scanner (Epson Perfection, Epson, Suwa, Nagano, Japan). Scanning was performed at a resolution of 1200 dpi, and the files were saved in TIFF format. Two slices for each apple were scanned. As a result, image analysis was performed with 50 repetitions for each apple clone. The images were then processed using Mazda software, version 4.7 (Łódź University of Technology, Institute of Electronics, Łódź, Poland) [
17,
18,
19]. For the cross-sections, the regions of interest (ROIs) covered the entire section area, excluding the skin. These images were converted into individual color channels:
R,
B,
G,
L,
b,
a,
U,
V,
S,
Y,
X, and
Z. Texture features, including those derived from the run-length matrix, co-occurrence matrix, histogram, gradient map, Haar autoregressive model, and wavelet transform were computed. Finally, 2172 texture features for each apple slice were extracted from the images of apple clones in 12 color channels, including 181 textures for each color channel. All extracted image textures were used in final correlation analysis. Then, the four textures most strongly correlated with each chemical or color parameter were selected. The image processing procedure is shown in
Figure 2.
2.3. Color Parameters
Color measurements were performed using a portable spectrophotometer (Konica MinoltaCM-2600d, Chiyoda, Tokyo, Japan), which was calibrated by zero calibration and using a standard white calibration tile provided by the manufacturer. The spectrophotometer was set to measure color using the CIE 10° Standard Observer and the D65 illuminant (Konica MinoltaCM-2600d, Chiyoda, Tokyo, Japan), which simulates daylight. The aperture size of the spectrophotometer was set to 6 mm to ensure consistent measurement areas. For each apple slice, two distinct color measurements were taken from the fruit flesh at different locations: the middle and bottom regions of the slice. The spectrophotometer was positioned in direct contact with the apple slice surface to ensure uniform illumination. Before each measurement, the measurement head was cleaned to avoid any residual contaminants that could affect the readings. Each reading was recorded automatically by the spectrophotometer’s software, which provided CIE L*, a*, and b* values. The color parameters collected for each apple included the following: L*—lightness (scale from 0—black to 100—white); a*—red–green (positive values represented red; negative values represented green); and b*—yellow–blue (positive values represented yellow; negative values represented blue). The measurements were performed in 50 repetitions.
2.4. Chemical Measurements
For the chemical analysis, apples were finely sliced and frozen, after which they were powdered and stored at −20 °C.
2.4.1. Dry Matter
Dry matter was determined by the weight-drying method in accordance with PN-90/A-75101/03. The apples were dried at 70 °C under vacuum (3 kPa) to a constant weight. The results are expressed in %.
2.4.2. Acidity
Active acidity (pH) and titratable acidity expressed as citric acid were determined according to PN-EN-12147:2000 using a titrator (SI Analytics, TitroLine 7000, SI Analytics, Weilheim, Germany). The titrant used was 0.1 M NaOH. The results of titratable acidity were expressed in %. All measurements were performed in duplicate.
2.4.3. Total Polyphenol Content
The total polyphenol content (TPC) was measured by a spectrophotometric method [
20]. The apples were homogenized with 70% ethanol. Next the homogenate was centrifuged for 10 min at 20,000 rpm, following the mixture of 0.4 mL supernatant with 1.6 mL of sodium carbonate solution (7.5%). Then, 2 mL of Folin–Ciocalteu phenol reagent was added and the mixture was shaken. After incubation for 30 min at an ambient temperature and darkness, the absorbance was read against the prepared blank at 765 nm. The polyphenol content was expressed as mg of gallic acid equivalents (GAE) in mg 100 g
−1 fresh weight (FW) of the analyzed apples.
2.4.4. Analysis of Sugars
The analysis of total sugars (sucrose, glucose, fructose, and sorbitol) was determined by high-performance liquid chromatography (Agilent 1200 HPLC system (Altium, Warsaw, Poland), equipped with a differential refractometric detector), using an Aminex HPX-87C (300 mm × 7.5 mm) column (Bio-Rad Laboratories, Hercules, CA, USA) with a precolumn. The isocratic flow was 0.6 mL min−1, column temperature was 80 °C, and the mobile phase was 0.1 mM edetate calcium disodium (Ca-EDTA). The apples were dissolved in redistilled water, homogenized, and purified on a Waters SepPak PLUS C18 filter (Waters, MA, USA). The sugars were quantified by a calibration curve for sucrose, glucose, fructose, and sorbitol, and the results were expressed in g kg−1 FW.
2.4.5. Analysis of Acids
The content of L-ascorbic, malic, and citric acid was determined by high-performance liquid chromatography (Agilent 1200 HPLC system, equipped with a diode-array detector). Separation was performed using a Supelco LC-18 column (250 mm × 4.6 mm; 5 μm) (Sigma-Aldrich Chemie GmbH, Darmstadt, Germany) with a precolumn according to IFU (Instructions for Use) procedures. The isocratic flow was 0.8 mL min−1, the column temperature was 30 °C, and the mobile phase was 1% phosphate-buffered solution KH2PO4, pH 2.5. The detection of L-ascorbic acid was by absorbance at 244 nm and 210 nm for malic and citric acid. The apples were dissolved in 6% HPO3, homogenized, and filtered. The acids were quantified by a calibration curve for L-ascorbic, malic, and citric acids, and the results were expressed in mg 100 g−1 FW.
2.5. Statistical Analysis
Mean values and standard deviations (±) were calculated for each parameter for each clone in duplicate, and the results were subjected to statistical analysis to determine the significance of differences between the groups. Statistical analysis was carried out using STATISTICA 13.3 (StatSoft Polska Sp. z o.o., Kraków, Poland, TIBCO Software Inc., Palo Alto, CA, USA) through a one-way analysis of variance (ANOVA). Before performing pairwise mean comparisons, the distribution’s normality and variance homogeneity were checked. Based on obtained results, it was decided to perform the analysis using Tukey’s test at a significance level of p < 0.05. Furthermore, the linear relationships between texture characteristics and other parameters, such as color and chemical characteristics, with Pearson’s correlation coefficients (R) at a significance level of p < 0.05 were determined.
3. Results
3.1. Yield and Fruit Firmness of Apple Clones
The results for yield showed significant differences between the tested clones (
Table 1). The highest yield was achieved by the ‘Free Redstar’ × ‘Ariwa’ clone (2.7 ± 0.58 kg tree
−1), which statistically differed from the other clones. This clone stood out with the highest productivity compared to the other genotypes. The ‘Free Redstar’ × ‘Rajka’ clone (2.0 ± 0.49 kg tree
−1), which had an intermediate yield, showed a significant difference from ‘Free Redstar’ × ‘Ariwa’, but did not differ statistically from the ‘Free Redstar’ × ‘Melfree’ (1.2 ± 0.55 kg tree
−1) and ‘Free Redstar’ × ‘Rubinola’ (1.6 ± 0.42 kg tree
−1) clones, which had lower yields. The ‘Free Redstar’ × ‘Melfree’ clone exhibited the lowest yield, which was significantly different from the other clones.
Regarding fruit firmness, the ‘Free Redstar’ × ‘Ariwa’ clone showed the highest value (7.0 ± 0.29 kg cm−2), making it the firmest clone in the study. This value significantly differed from the other clones, which exhibited lower fruit firmness values. The ‘Free Redstar’ × ‘Rubinola’ clone (6.6 ± 0.71 kg cm−2) had a firmness comparable to that of ‘Free Redstar’ × ‘Ariwa’, although with greater variability (larger standard deviation). The ‘Free Redstar’ × ‘Melfree’ (5.9 ± 0.59 kg cm−2) and ‘Free Redstar’ × ‘Rajka’ (4.8 ± 0.30 kg cm−2) clones exhibited medium fruit firmness, with the ‘Free Redstar’ × ‘Rajka’ clone having the lowest firmness, and its fruits being significantly softer compared to the other clones.
Statistical analysis revealed significant differences between the clones in terms of both yield and fruit firmness. The ‘Free Redstar’ × ‘Ariwa’ clone emerged as the best in both traits, combining the highest yield with the highest fruit firmness, making it the most productive clone in the study. The ‘Free Redstar’ × ‘Rajka’ clone exhibited an average yield and low fruit firmness, which may indicate its suitability for producing apples with lower firmness. The ‘Free Redstar’ × ‘Rubinola’ clone showed an average yield and high fruit firmness, although with greater variability, suggesting the need to account for genotypic variability in production. The ‘Free Redstar’ × ‘Melfree’ clone had the lowest yield and medium fruit firmness, but with high variability, which may indicate lower stability for this clone in production systems.
3.2. Selected Image Texture Parameters of Apple Clones
The results in
Table 2 present the comparison of selected image texture parameters of four different apple clones, such as the ‘Free Redstar’ × ‘Melfree’, ‘Free Redstar’ × ‘Ariwa’, ‘Free Redstar’ × ‘Rajka’, and ‘Free Redstar’ × ‘Rubinola’. Statistically significant differences in means were observed in some cases. For YHPerc01 values, the ‘Free Redstar’ × ‘Ariwa’ clone showed the highest mean value (83.05) and created a separate homogeneous group from the other three clones with lower means. The highest SHSkewness (0.872) was found in the ‘Free Redstar’ × ‘Ariwa’ clone, followed by ‘Free Redstar’ × ‘Rajka’ (0.460) and ‘Free Redstar’ × ‘Melfree’ with the lowest value of 0.035. These clones were in three separate groups, whereas the ‘Free Redstar’ × ‘Rubinola’ clone with an SHSkewness of 0.169 was in the same group as ‘Free Redstar’ × ‘Melfree’ and ‘Free Redstar’ × ‘Rajka’. All clones were characterized by statistically different aHSkewness. ‘Free Redstar’ × ‘Rajka’ exhibited the highest value of 4.760 and ‘Free Redstar’ × ‘Ariwa’ demonstrated the lowest value of 0.384. In the case of bHPerc99, only ‘Free Redstar’ × ‘Rajka’, with the lowest value of 155.48, was statistically significantly different from other apple clones. The image texture XHPerc01 was found to be the highest for ‘Free Redstar’ × ‘Ariwa’ (75.59), which created a separate homogeneous group with ‘Free Redstar’ × ‘Melfree’ with the lowest value (53.05). The ‘Free Redstar’ × ‘Ariwa’ clone was also characterized by the highest bHKurtosis (1.486) and ‘Free Redstar’ × ‘Melfree’ by the lowest value of this texture (0.197). For aATeta2, ‘Free Redstar’ × ‘Rajka’ had the lowest value (0.093), which was significantly different from values found for ‘Free Redstar’ × ‘Ariwa’ (0.147) and ‘Free Redstar’ × ‘Rubinola’ (0.152).
3.3. Color Parameters of Different Apple Clones
The results in
Table 3 compare the color parameters (L*, a*, b*) of different apple clones: ‘Free Redstar’ × ‘Melfree’, ‘Free Redstar’ × ‘Ariwa’, ‘Free Redstar’ × ‘Rajka’, and ‘Free Redstar’ × ‘Rubinola’. The L* values for the apple clones ranged from 72.84 for ‘Free Redstar’ × ‘Melfree’ to 79.29 for ‘Free Redstar’ × ‘Rubinola’, indicating varying degrees of lightness. The ‘Free Redstar’ × ‘Rubinola’ clone showing the highest lightness was in the same homogeneous group with ‘Free Redstar’ × ‘Rajka’. These higher L* values meant lighter, whiter flesh. For a* values, which indicate the red–green color component, the results for the clones varied from positive values (red) in ‘Free Redstar’ × ‘Ariwa’ (1.50), ‘Free Redstar’ × ‘Melfree’ (1.39), and ‘Free Redstar’ × ‘Rubinola’ (1.10), which created one homogeneous group, to a negative value, indicating a shift towards green coloration for ‘Free Redstar’ × ‘Rajka’ (−0.62), which was a separate group with a statistically different result from other clones. The b* values, representing the yellow–blue color component, differed significantly between some clones. The ‘Free Redstar’ × ‘Melfree’ clone was characterized by the highest b* value (24.63), indicating a more yellowish flesh. It was followed by ‘Free Redstar’ × ‘Ariwa’ with the b* value of 20.54. The statistically significantly lowest values were found for ‘Free Redstar’ × ‘Rajka’ (17.31) and ‘Free Redstar’ × ‘Rubinola’ (17.60).
3.4. Chemical Properties of Apple Clones
The four ‘Free Redstar’ clones were analyzed for dry mass content, sugar content (
Table 4), organic acid content, and total polyphenol content (TPC) (
Table 5) by means of the ABTS assay, expressed as gallic acid equivalents (GAE). The results showed subtle but interesting differences in the chemical properties of the clones. ‘Free Redstar’ × ‘Rajka’ exhibited the lowest dry mass % at 12.7, while ‘Free Redstar’ × ‘Ariwa’ had the highest at 14.7. ‘Free Redstar’ × ‘Rajka’ also had the lowest sugar content, at 112.4 g kg
−1, while ‘Free Redstar’ × ‘Ariwa’ was found to have the highest sugar content at 132.7 g kg
−1. A key contributor to the high sugar content discovered in the ‘Free Redstar’ × ‘Ariwa’ clone was the significantly higher sucrose content than the other clones, between 1.6- and 2.6-fold greater than the other clones. ‘Free Redstar’ × ‘Melfree’, meanwhile, had a significantly higher glucose content than the other clones—between 1.7- and 2-fold greater.
‘Free Redstar’ × ‘Rajka’ also had the highest total organic acid content, with 39.0 mg 100 g−1 of fresh material, while the other clones were fairly consistent at 550.6–582.5 mg 100 g−1. This is largely due to the very high levels of malic acid and in spite of relatively low levels of ascorbic acid (ca. 3-fold lower). TPC is fairly consistent in the tested clones; ‘Free Redstar × Melfree’ had the lowest at 215.2 mg 100 g−1, while ‘Free Redstar × ‘Ariwa’ was found to have the highest at 260.7 mg 100 g−1. ‘Free Redstar’ × ‘Rajka’ and ‘Free Redstar’ × ‘Rubinola’ were found to have TPCs between these values which were not statistically different from one another.
3.5. Relationships Between Chemical Properties and Color Parameters with Image Features of New Clones of Apples
The relationships between the content of sugars (sucrose, glucose, fructose, sorbitol, and total sugars) and acids (L-ascorbic acid, malic acid, citric acid, and total acid), the total polyphenol content (TPC), and color parameters (L*, a*, and b*) with selected image textures of different apple clones (‘Free Redstar’ × ‘Melfree’, ‘Free Redstar’ × ‘Ariwa’, ‘Free Redstar’ × ‘Rajka’, and ‘Free Redstar’ × ‘Rubinola’) were determined considering Pearson’s correlation coefficients (R). For each analyzed chemical and color parameter, the four strongest correlations with selected image textures were selected and correlation coefficients (R) are presented in this paper.
The R values for the relationships between sugars and texture features of different apple clones, ‘Free Redstar’ × ‘Melfree’, ‘Free Redstar’ × ‘Ariwa’, ‘Free Redstar’ × ‘Rajka’, and ‘Free Redstar’ × ‘Rubinola’, are shown in
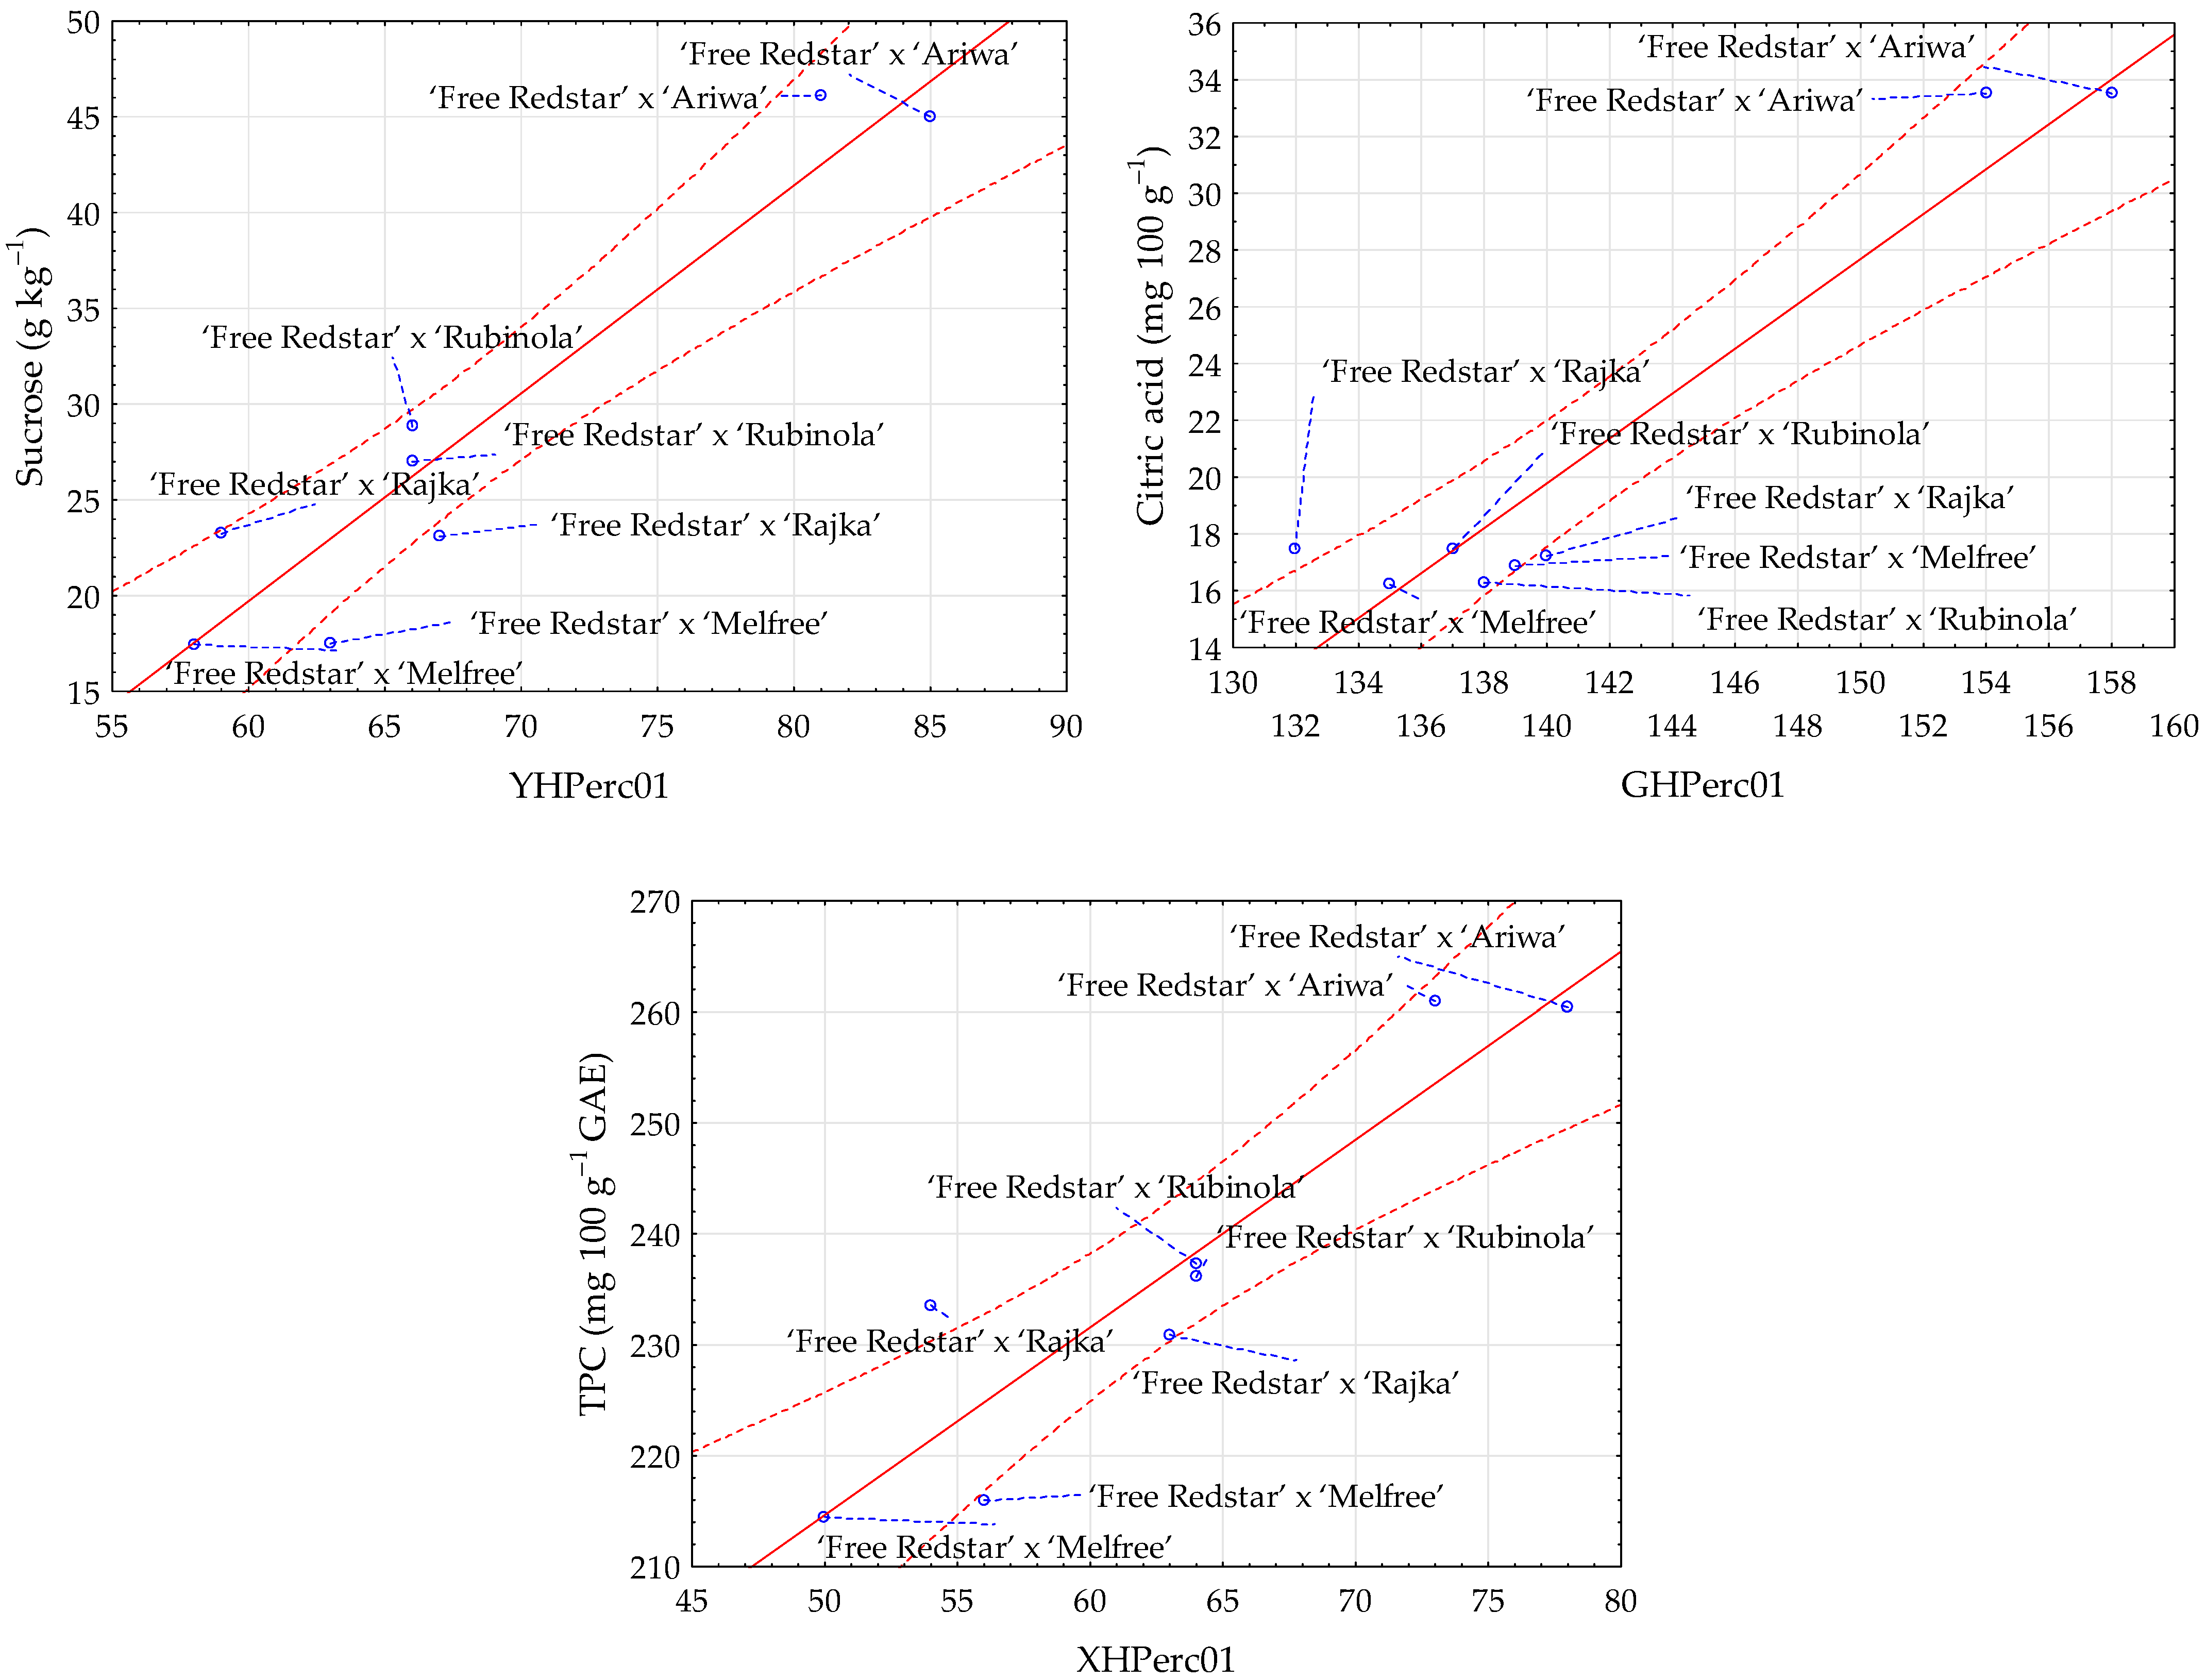
Table 6. It was found that correlations depended on sugars. The highest R values were determined for sucrose and sorbitol. Sucrose showed strong positive correlations with several image texture parameters, such as YHPerc01 (R = 0.946), LHPerc01 (R = 0.938), and XHPerc01 (R = 0.928). These positive correlations suggest that apples with higher sucrose content are characterized by higher values of analyzed image texture parameters. Sorbitol, a sugar alcohol, was strongly negatively correlated with image textures bHDomn01 (R = −0.946), bHMean (R = −0.945), and bHPerc50 (R = −0.940) and slightly less positively correlated with image texture UHMean (0.902). The correlation between glucose and texture parameters was also statistically significant and high, especially with bHPerc50 (R = 0.846), bHMean (R = 0.826), and BHMean (R = −0.824). The fructose content was also strongly positively and negatively correlated with image textures, such as bHPerc50 (R = 0.850), bHDomn01 (R = 0.832), and SHSkewness (R = −0.831). Total sugars demonstrated a strong negative correlation with aHSkewness (R = −0.881) and a positive correlation with US4RNGLevNonU (R = 0.865).
Strong correlations with high R values were also found for the relationships between acids and TPC with image textures of different apple clones: ‘Free Redstar’ × ‘Melfree’, ‘Free Redstar’ × ‘Ariwa’, ‘Free Redstar’ × ‘Rajka’, and ‘Free Redstar’ × ‘Rubinola’ (
Table 7). The R parameter reached 0.953 for the correlation between the content of citric acid and texture GHPerc01. Citric acid was also strongly negatively correlated with SS5SZ1SumEntrp (−0.941). Moreover, positive and negative correlations were observed between L-ascorbic acid and image textures, especially bHPerc99 (0.909) and RSGVariance (−0.904). Slightly weaker correlations for acids were noted between total acids and image textures with R reaching −0.889 for bHPerc99 and between malic acid and textures with R of up to −0.884 for bHPerc99. In the case of TPC, the positive and negative correlations with image features were found with R reaching 0.921 with texture XHPerc01, 0.904 with YHPerc01, and −0.842 with US5SZ3SumEntrp.
The strong relationships between image parameters with physical and chemical properties of apple clones ‘Free Redstar’ × ‘Melfree’, ‘Free Redstar’ × ‘Ariwa’, ‘Free Redstar’ × ‘Rajka’, and ‘Free Redstar’ × ‘Rubinola’ were also confirmed graphically. Scatter plots enabling the visualization of selected relationships are presented in
Figure 3.
Also, color parameters L*, a*, and b* were strongly correlated with image texture features of apple clones: ‘Free Redstar’ × ‘Melfree’, ‘Free Redstar’ × ‘Ariwa’, ‘Free Redstar’ × ‘Rajka’, and ‘Free Redstar’ × ‘Rubinola’ (
Table 8). In the case of parameter L*, the correlation coefficient (R) values reached −0.907 (texture ZS5SV1Correlat) and 0.905 (ZS5SV1DifVarnc), while for parameter a*, they reached 0.945 (aATeta2) and −0.944 (RS5SV3DifVarnc), and for parameter b*, they reached 0.923 (XSGKurtosis) and 0.919 (YS4RVLngREmph).
4. Discussion
The obtained results revealed that image texture parameters were strongly correlated with sugar, acid, and TPC, as well as color parameters. Positive and negative relationships were observed. These findings highlight the importance of texture–chemical and texture–color interactions in determining apple quality. They indicated that chemical properties may influence the structure of apple flesh, which were reflected in texture characteristics. Also, color influences the visual aspects of the flesh. For example, the abundance of anthocyanidins is positively correlated with red/purple coloration. Therefore, by examining the image parameters, it is possible to obtain information about the structure of the flesh of apple clones but also insight into the chemical and color characterization of clones.
Image textures can be applied for differentiation purposes, and in previous studies, they were used, for example, for the discrimination of different apple cultivars [
21]. The textural characteristics in the images are determined by the spatial variations in pixel brightness intensity. The images often exhibit subpatterns of pixel brightness distribution and dispersion, which reflect attributes like smoothness, color, roughness, size, granulation, directivity, and brightness in the textures. Textures can provide crucial information about the structure of the analyzed objects. The quantitative assessments of textural features offer valuable insights into object quality. However, only a subset of selected image texture features is significant for distinguishing classes. As a result, it is necessary to eliminate some features to focus on the most relevant textural parameters [
17,
18,
19,
22]. In this study, the application of image analysis enabled detailed quantification of apple flesh surface characteristics. The texture parameters, which were computed from images of apple flesh, offer valuable information about the structural complexity and visual appeal of different apple clones. Also, the high degree of correlation between textural features and chemical components of the fruit, particularly sucrose, sorbitol, and citric acid, may enable the estimation of these chemical properties based on textual parameters. This may be because chemical properties may influence the structure of food products [
23,
24,
25].
Different apple genotypes may also differ in other properties, such as color, total antioxidant activity, pH, dry matter, the total content of soluble solids, and the content of acids, sugars, and phenols [
26]. The color of apple flesh and the susceptibility to browning are cultivar-specific and related to the chemical composition of apples [
27]. Furthermore, flesh color is a factor influencing consumer acceptance of apples [
28].
The chemical analysis of the four clones exhibited very low standard deviation across the board for sugar, acid, and TPC analysis, giving a high degree of confidence in the results. At the same time, the clones exhibited statistically significant differences in all investigated chemical components with the exception of sorbitol.
The application of image texture analysis for clone discrimination and estimation of physicochemical properties can be beneficial. The analysis is performed in an objective, inexpensive, and fast manner. However, it also has some limitations, which may be related to the image acquisition procedure or the creation of the data set. Results may depend on the imaging device. Imaging with a digital camera takes less time than acquiring each high-resolution scan. However, using a scanner provides the same lighting conditions for each scan, while using a digital camera introduces a possible experimental variable of irregular ambient lighting. Image acquisition must be performed under the same lighting conditions, preferably in a dark room to avoid the influence of sunlight. Furthermore, to obtain reliable results, it is necessary to build an appropriate data set. Textural parameters for each apple clone should be extracted from images acquired using the same imaging device under the same conditions. Imaging should also be performed in an appropriate number of repetitions to provide a large data set, which requires providing a large number of apples. Further studies may include more apple clones or other fruit species and additional chemical and physical parameters to further investigate these relationships between image textures and physicochemical properties.
5. Conclusions
Based on the analysis, the ‘Free Redstar’ × ‘Ariwa’ clone seems to be the most promising, showing high fruit yield and firmness, as well as high quality and low variability of traits. Such properties make it particularly suitable for commercial cultivation in both intensive and organic systems, where yield stability and quality are key. The stability and resistance of this clone also indicate its great potential as a parent in breeding programs aimed at improving yield reliability and fruit texture. The ‘Free Redstar’ × ‘Rajka’ and ‘Free Redstar’ × ‘Rubinola’ clones can be valuable alternatives, offering producers the possibility of matching the variety to specific needs, e.g., preferences for fruit firmness (important for longer storage) or yield efficiency in less intensive conditions. These genotypes can be successfully used in breeding programs aimed at different market requirements or specific climatic and soil conditions. In turn, the observed yield instability of the ‘Free Redstar’ × ‘Melfree’ clone may limit its usefulness in intensive systems. Nevertheless, this clone may find application in low-input or experimental agroecological systems, where other features, e.g., resistance to biotic stresses, may be appreciated. The obtained results provide practical advice for the selection of clones and constitute a valuable basis for further breeding work and the development of sustainable orchard management.
The study provides valuable information on the yield and quality of fruit of different apple clones, but various factors may influence the results. The sample size of 16 trees per clone, although sufficient for statistical analysis, may limit the ability to generalize the results to larger orchards. The genetic background of the clones is also an important factor, as are environmental conditions such as soil composition, microclimate, and seasonal changes. All of these factors can affect the chemical composition of the fruit and overall yield. Future studies that include larger numbers of trees and take into account the influence of environmental conditions will provide a more detailed understanding of how different clones perform under different growing conditions.
Additionally, the comparative analysis of the four apple clones, ‘Free Redstar’ × ‘Melfree’, ‘Free Redstar’ × ‘Ariwa’, ‘Free Redstar’ × ‘Rajka’, and ‘Free Redstar’ × ‘Rubinola’, revealed distinct differences in image textures, color, and chemical properties, with notable implications for apple quality. Statistically significant differences in texture parameters were observed across clones, mainly in aHSkewness, SHSkewness, and bHKurtosis, indicating diverse textural profiles. Similarly, the clones differed in their color properties, especially L* and b* parameters, creating three homogeneous groups, and chemical compounds. The significant correlations of image texture features with various sugars, acids, TPC, and color parameters of different apple clones were demonstrated. Sucrose, sorbitol, citric acid, and a* parameter were characterized by the strongest correlations with texture features. Overall, the findings revealed that each clone presented unique qualities, reflected in image texture, color, and chemical properties, and these properties were related. It can provide valuable information on apple quality for apple breeding and consumer preferences. This research has shown a high-level correlation between textural features and total polyphenol, sugar, and acid content of four apple clones of the ‘Free Redstar’ geneline. The results presented in this paper have provided interesting insights into the relationships between apple fruit texture and chemical composition within four clones of the ‘Free Redstar’ cultivar. Given these results, we intend to perform further experiments to further explore these relationships across other apple genelines and other fruit species. Indeed, TPC is a rather general determination of polyphenol content, and we also plan to investigate whether particular polyphenols have a particularly strong correlation with apple flesh texture. As the relationships between the parameters extracted nondestructively from images and the chemical and color features of apple clones have been confirmed, a quality assessment, including the estimation of physicochemical properties of fruit, can be applied in future breeding programs.
Author Contributions
Conceptualization, E.R.; methodology, E.R. and N.J.D.; software, E.R. and N.J.D.; validation, E.R.; formal analysis, E.R., N.J.D. and M.P.; investigation, E.R., N.J.D., P.B., M.P. and M.L.; resources, P.B., M.P. and M.L.; data curation, E.R., N.J.D. and M.P.; writing—original draft preparation, E.R., N.J.D. and M.P.; writing—review and editing, E.R., N.J.D., P.B., M.P. and M.L.; visualization, E.R., N.J.D. and M.P.; supervision, E.R.; project administration, P.B.; funding acquisition, P.B. All authors have read and agreed to the published version of the manuscript.
Funding
The research was carried out in the frame of a subsidy from the Ministry of Agriculture and Rural Development special-purpose—Task 7.1: “Improving methods of organic cultivation of fruit plants”.
Institutional Review Board Statement
Not applicable.
Informed Consent Statement
Not applicable.
Data Availability Statement
The original contributions presented in the study are included in the article. Further inquiries can be directed to the corresponding author.
Acknowledgments
The authors are grateful to the technical staff of the Fruit and Vegetable Storage and Processing Department of the National Institute of Horticultural Research in Skierniewice, Poland, for their technical support.
Conflicts of Interest
The authors declare no conflicts of interest.
References
- USDA. 2024. Available online: https://www.fas.usda.gov/sites/default/files/2024-12/fruit.pdf (accessed on 17 March 2025).
- Arnold, M.; Gramza-Michalowska, A. Recent Development on the Chemical Composition and Phenolic Extraction Methods of Apple (Malus domestica)—A Review. Food Bioprocess Technol. 2024, 17, 2519–2560. [Google Scholar] [CrossRef]
- Jankowski, P.; Masny, S. Influence of moisture on maturation rate of the Venturia inaequalis (Cooke) Wint. ascospores in central Poland. J. Plant Dis. Prot. 2020, 127, 155–163. [Google Scholar] [CrossRef]
- Michalecka, M.; Masny, S.; Leroy, T.; Puławska, J. Population structure of Venturia inaequalis, a causal agent of apple scab, in response to heterogeneous apple tree cultivation. BMC Evol. Biol. 2018, 18, 5. [Google Scholar] [CrossRef]
- Sokolova, O.; Moročko-Bičevska, I. Screening of Venturia inaequalis virulence and resistance of Malus genotypes to apple scab using in vitro methodology. Rural. Sustain. Res. 2022, 48, 79–90. [Google Scholar] [CrossRef]
- Mattioli, R.; Francioso, A.; Mosca, L.; Silva, P. Anthocyanins: A Comprehensive Review of Their Chemical Properties and Health Effects on Cardiovascular and Neurodegenerative Diseases. Molecules 2020, 25, 3809. [Google Scholar] [CrossRef]
- Starzec, A.; Raj, D.; Fecka, I. Właściwości prozdrowotne owoców jabłoni domowej w świetle najnowszych badań naukowych (Malus × domestica Borkh.). Farm. Polska 2020, 76, 137–148. [Google Scholar] [CrossRef]
- Średnicka–Tober, D.; Barański, M.; Kazimierczak, R.; Ponder, A.; Kopczyńska, K.; Hallmann, E. Selected Antioxidants in Organic vs. Conventionally Grown Apple Fruits. Appl. Sci. 2020, 10, 2997. [Google Scholar] [CrossRef]
- Ropelewska, E.; Szwejda–Grzybowska, J.; Lewandowski, M.; Mieszczakowska–Frąc, M. The Estimation of Phenolic Compounds, Sugars, and Acids of the Cultivar and Clones of Red-Fleshed Apples Based on Image Features. Foods 2025, 14, 1138. [Google Scholar] [CrossRef]
- Khan, H.; Ullah, H.; Aschner, M.; Cheng, W.S.; Akkol, E.K. Neuroprotective Effects of Quercetin in Alzheimer’s Disease. Biomolecules 2020, 10, 59. [Google Scholar] [CrossRef]
- Ropelewska, E.; Lewandowski, M. The Changes in Color and Image Parameters and Sensory Attributes of Freeze-Dried Clones and a Cultivar of Red-Fleshed Apples. Foods 2024, 13, 3784. [Google Scholar] [CrossRef]
- Zucoloto, M.; Ku, K.M.; Kushad, M.M.; Sawwan, J. Bioactive compounds and quality characteristics of five apples cultivars. Ciência Rural. 2015, 45, 1972–1979. [Google Scholar] [CrossRef]
- Drogoudi, P.; Michalidis, Z.; Pandelidis, G. Peel and flesh antioxidant content and harvest quality characteristics of seven apple cultivars. Sci. Hortic. 2008, 115, 149–153. [Google Scholar] [CrossRef]
- Adamczyk, M.; Rembiałkowska, E. Porównanie wybranych wyróżników jakościowych jabłek z produkcji ekologicznej i konwencjonalnej. Żywność Nauka Technol. Jakość 2005, 2, 9–21. [Google Scholar]
- Shevchuk, L.; Grynyk, I.; Levchul, L.; Babenko, S.; Podpriatov, H.; Kondratenko, P. Fruit Quality Indicators of Apple (Malus domestica Borkh.) Cultivars Bred in Ukraine. J. Hortic. Res. 2021, 29, 95–106. [Google Scholar] [CrossRef]
- Wojdyło, A.; Oszmiński, J.; Laskowski, P. Polyphenolic Compounds and Antioxidant Activity of New and Old Apple Varieties. J. Agric. Food Chem. 2008, 56, 5095–5100. [Google Scholar] [CrossRef]
- Szczypiński, P.M.; Strzelecki, M.; Materka, A. Mazda-a software for texture analysis. In Proceedings of the 2007 International Symposium on Information Technology Convergence (ISITC2007), Jeonju, Republic of Korea, 23–24 November 2007; pp. 245–249. [Google Scholar] [CrossRef]
- Szczypiński, P.M.; Strzelecki, M.; Materka, A.; Klepaczko, A. MaZda—A software package for image texture analysis. Comput. Methods Programs Biomed. 2009, 94, 66–76. [Google Scholar] [CrossRef]
- Strzelecki, M.; Szczypiński, P.; Materka, A.; Klepaczko, A. A software tool for automatic classification and segmentation of 2D/3D medical images. Nucl. Instrum. Methods Phys. Res. Sect. A Accel. Spectrometers Detect. Assoc. Equip. 2013, 702, 137–140. [Google Scholar] [CrossRef]
- Tsao, R.; Yang, R. Optimization of a new mobile phase to know the complex and real polyphenolic composition: Towards a total phenolic index using high-performance liquid chromatography. J. Chromatogr. A 2003, 1018, 29–40. [Google Scholar] [CrossRef]
- Ropelewska, E. The application of image processing for cultivar discrimination of apples based on texture features of the skin, longitudinal section and cross-section. Eur. Food Res. Technol. 2021, 247, 1319–1331. [Google Scholar] [CrossRef]
- Ropelewska, E. The use of seed texture features for discriminating different cultivars of stored apples. J. Stored Prod. Res. 2020, 88, 101668. [Google Scholar] [CrossRef]
- Baur, D.A.; Toney, H.R.; Saunders, M.J.; Baur, K.G.; Luden, N.D.; Womack, C.J. Carbohydrate hydrogel beverage provides no additional cycling performance benefit versus carbohydrate alone. Eur. J. Appl. Physiol. 2019, 119, 2599–2608. [Google Scholar] [CrossRef]
- Feng, S.; Bi, J.; Ma, Y.; Yi, J. Effects of pectin and glucose on the texture properties and microstructures of freeze-dried restructured fruits: Pectin-glucose sponge as a model. Food Struct. 2023, 37, 100344. [Google Scholar] [CrossRef]
- Li, L.; Huan, Y.; Shi, C. Effect of sorbitol on rheological, textural and microstructural characteristics of peanut butter. Food Sci. Technol. Res. 2014, 20, 739–747. [Google Scholar] [CrossRef]
- Vieira, F.G.K.; Borges, G.D.S.C.; Copetti, C.; Amboni, R.D.D.M.C.; Denardi, F.; Fett, R. Physico-chemical and antioxidant properties of six apple cultivars (Malus domestica Borkh) grown in southern Brazil. Sci. Hortic. 2009, 122, 421–425. [Google Scholar] [CrossRef]
- Kidoń, M.; Radziejewska-Kubzdela, E.; Biegańska-Marecik, R.; Kowalczewski, P.Ł. Suitability of Apples Flesh from Different Cultivars for Vacuum Impregnation Process. Appl. Sci. 2023, 13, 1528. [Google Scholar] [CrossRef]
- Kim, K.; Chun, I.J.; Suh, J.H.; Sung, J. Relationships between sensory properties and metabolomic profiles of different apple cultivars. Food Chem. X 2023, 18, 100641. [Google Scholar] [CrossRef]
| Disclaimer/Publisher’s Note: The statements, opinions and data contained in all publications are solely those of the individual author(s) and contributor(s) and not of MDPI and/or the editor(s). MDPI and/or the editor(s) disclaim responsibility for any injury to people or property resulting from any ideas, methods, instructions or products referred to in the content. |
© 2025 by the authors. Licensee MDPI, Basel, Switzerland. This article is an open access article distributed under the terms and conditions of the Creative Commons Attribution (CC BY) license (https://creativecommons.org/licenses/by/4.0/).


 ,
, 
