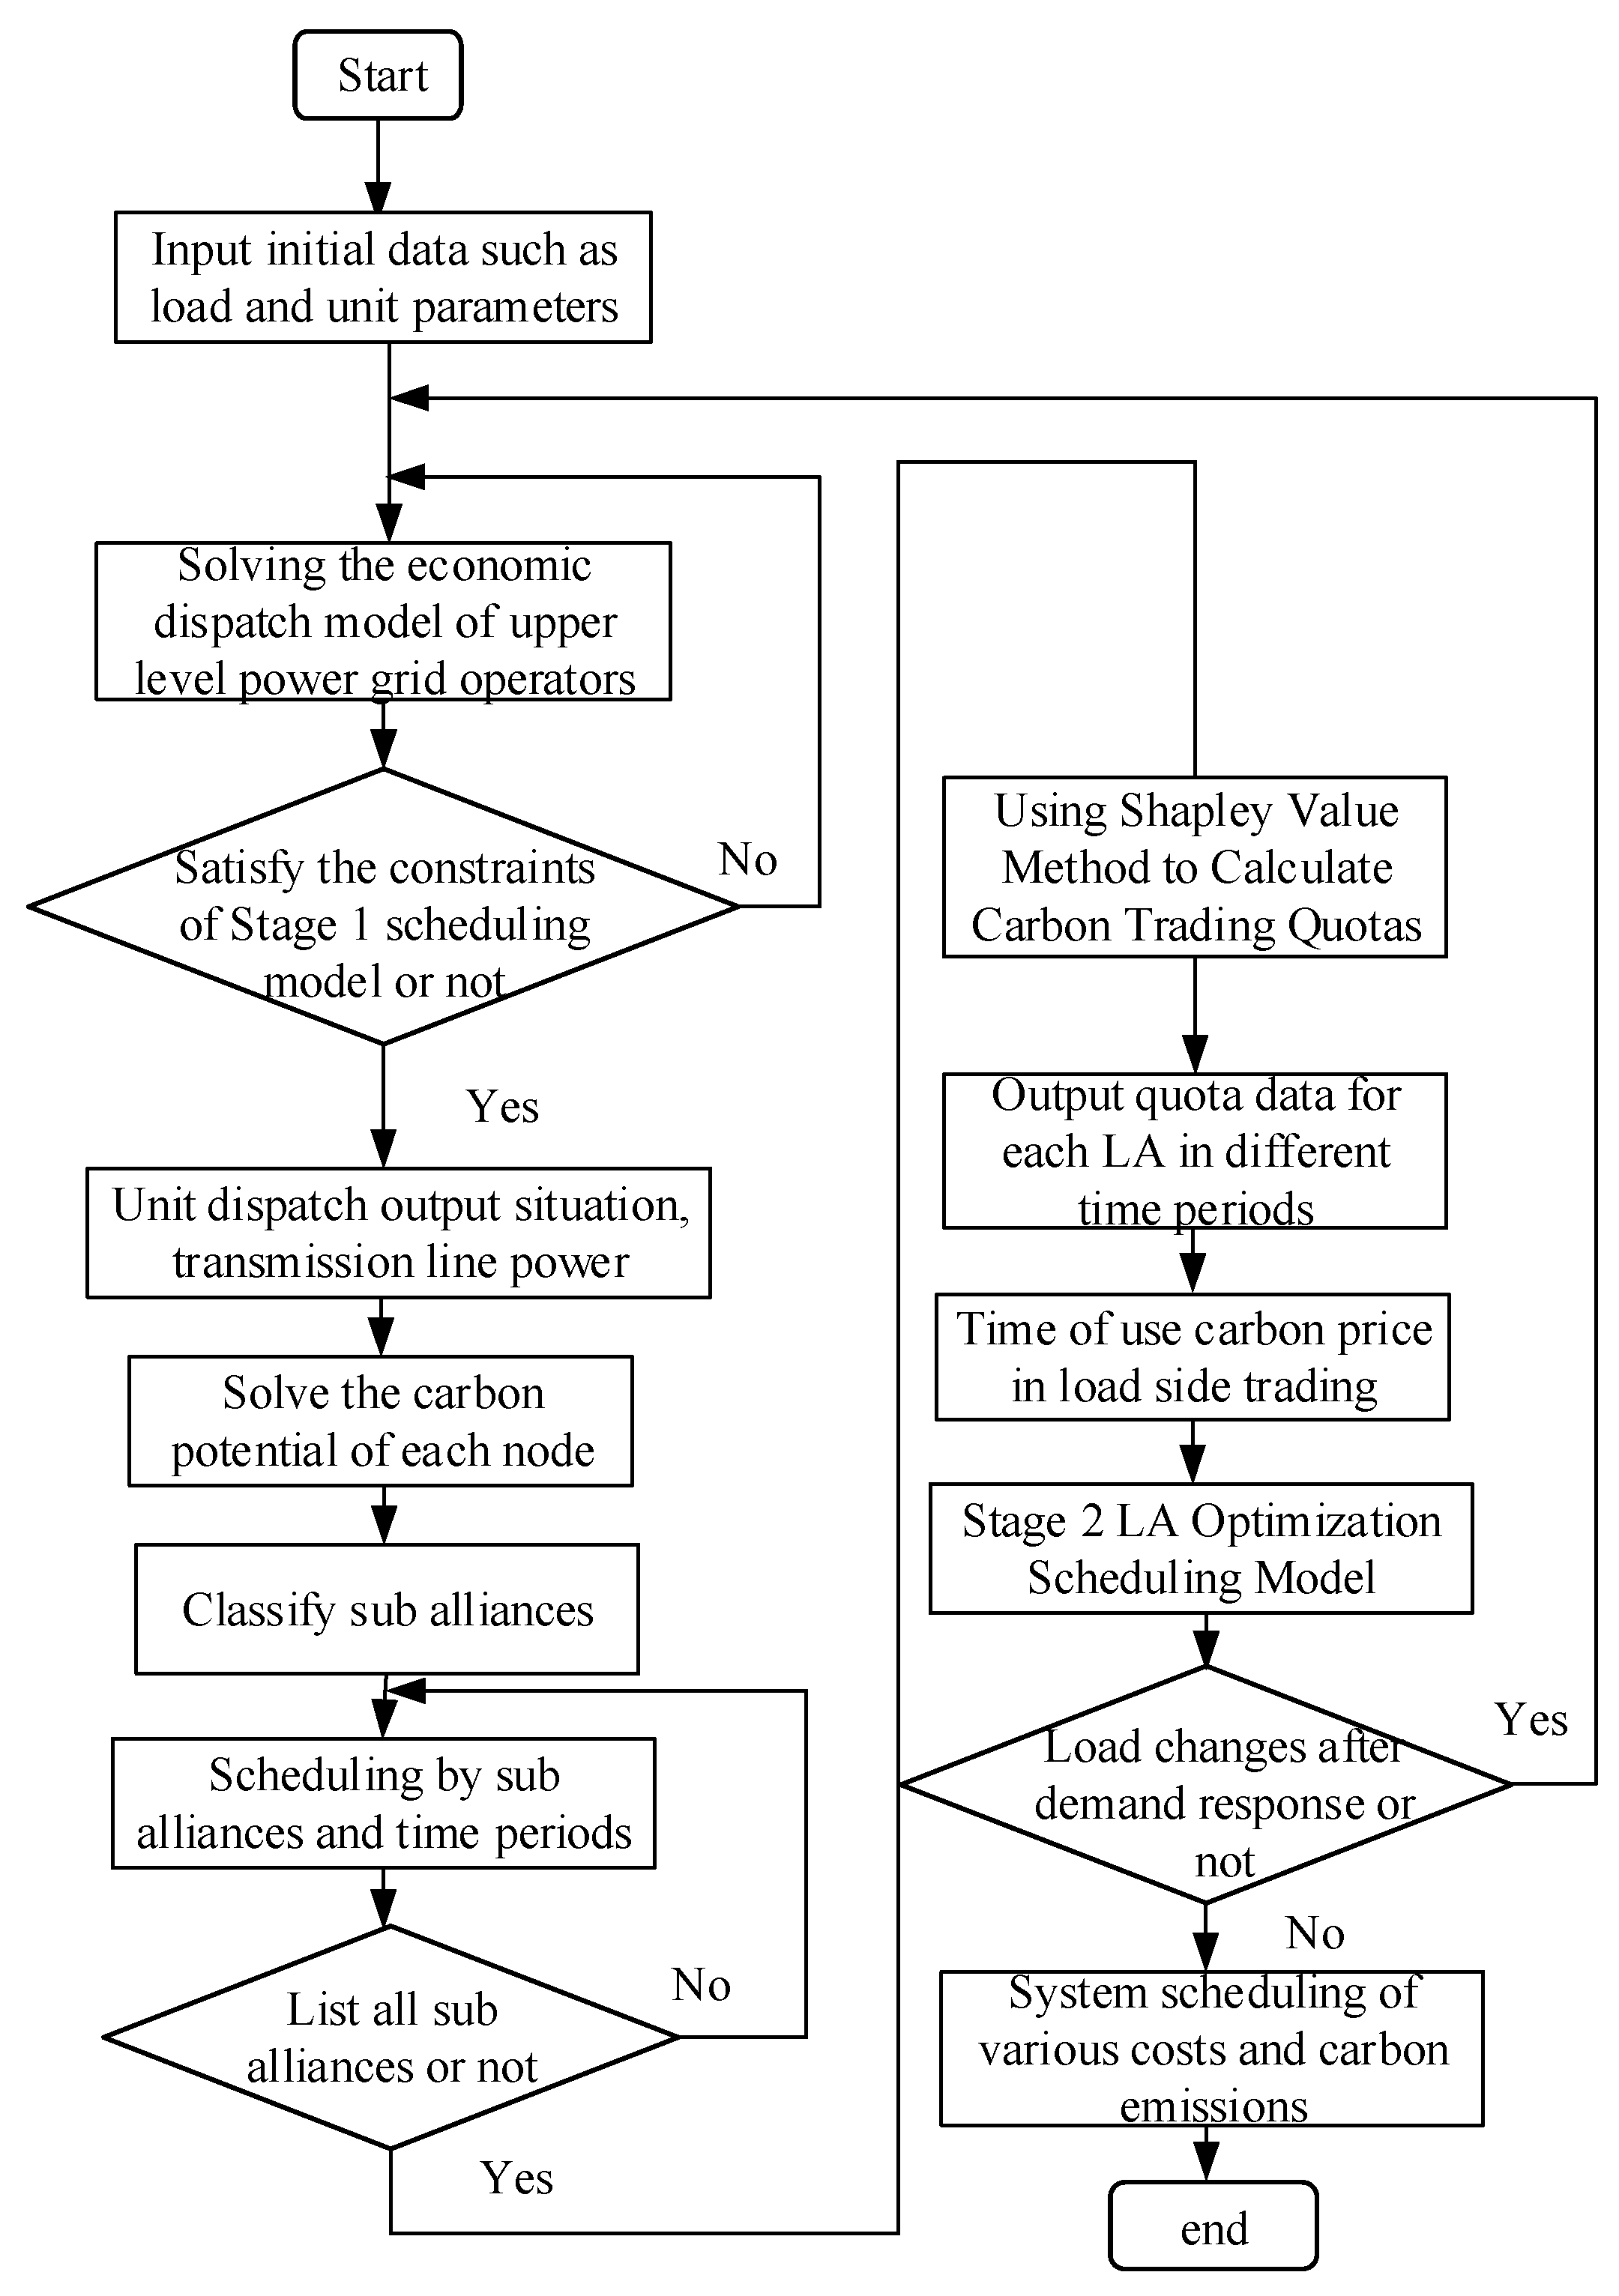
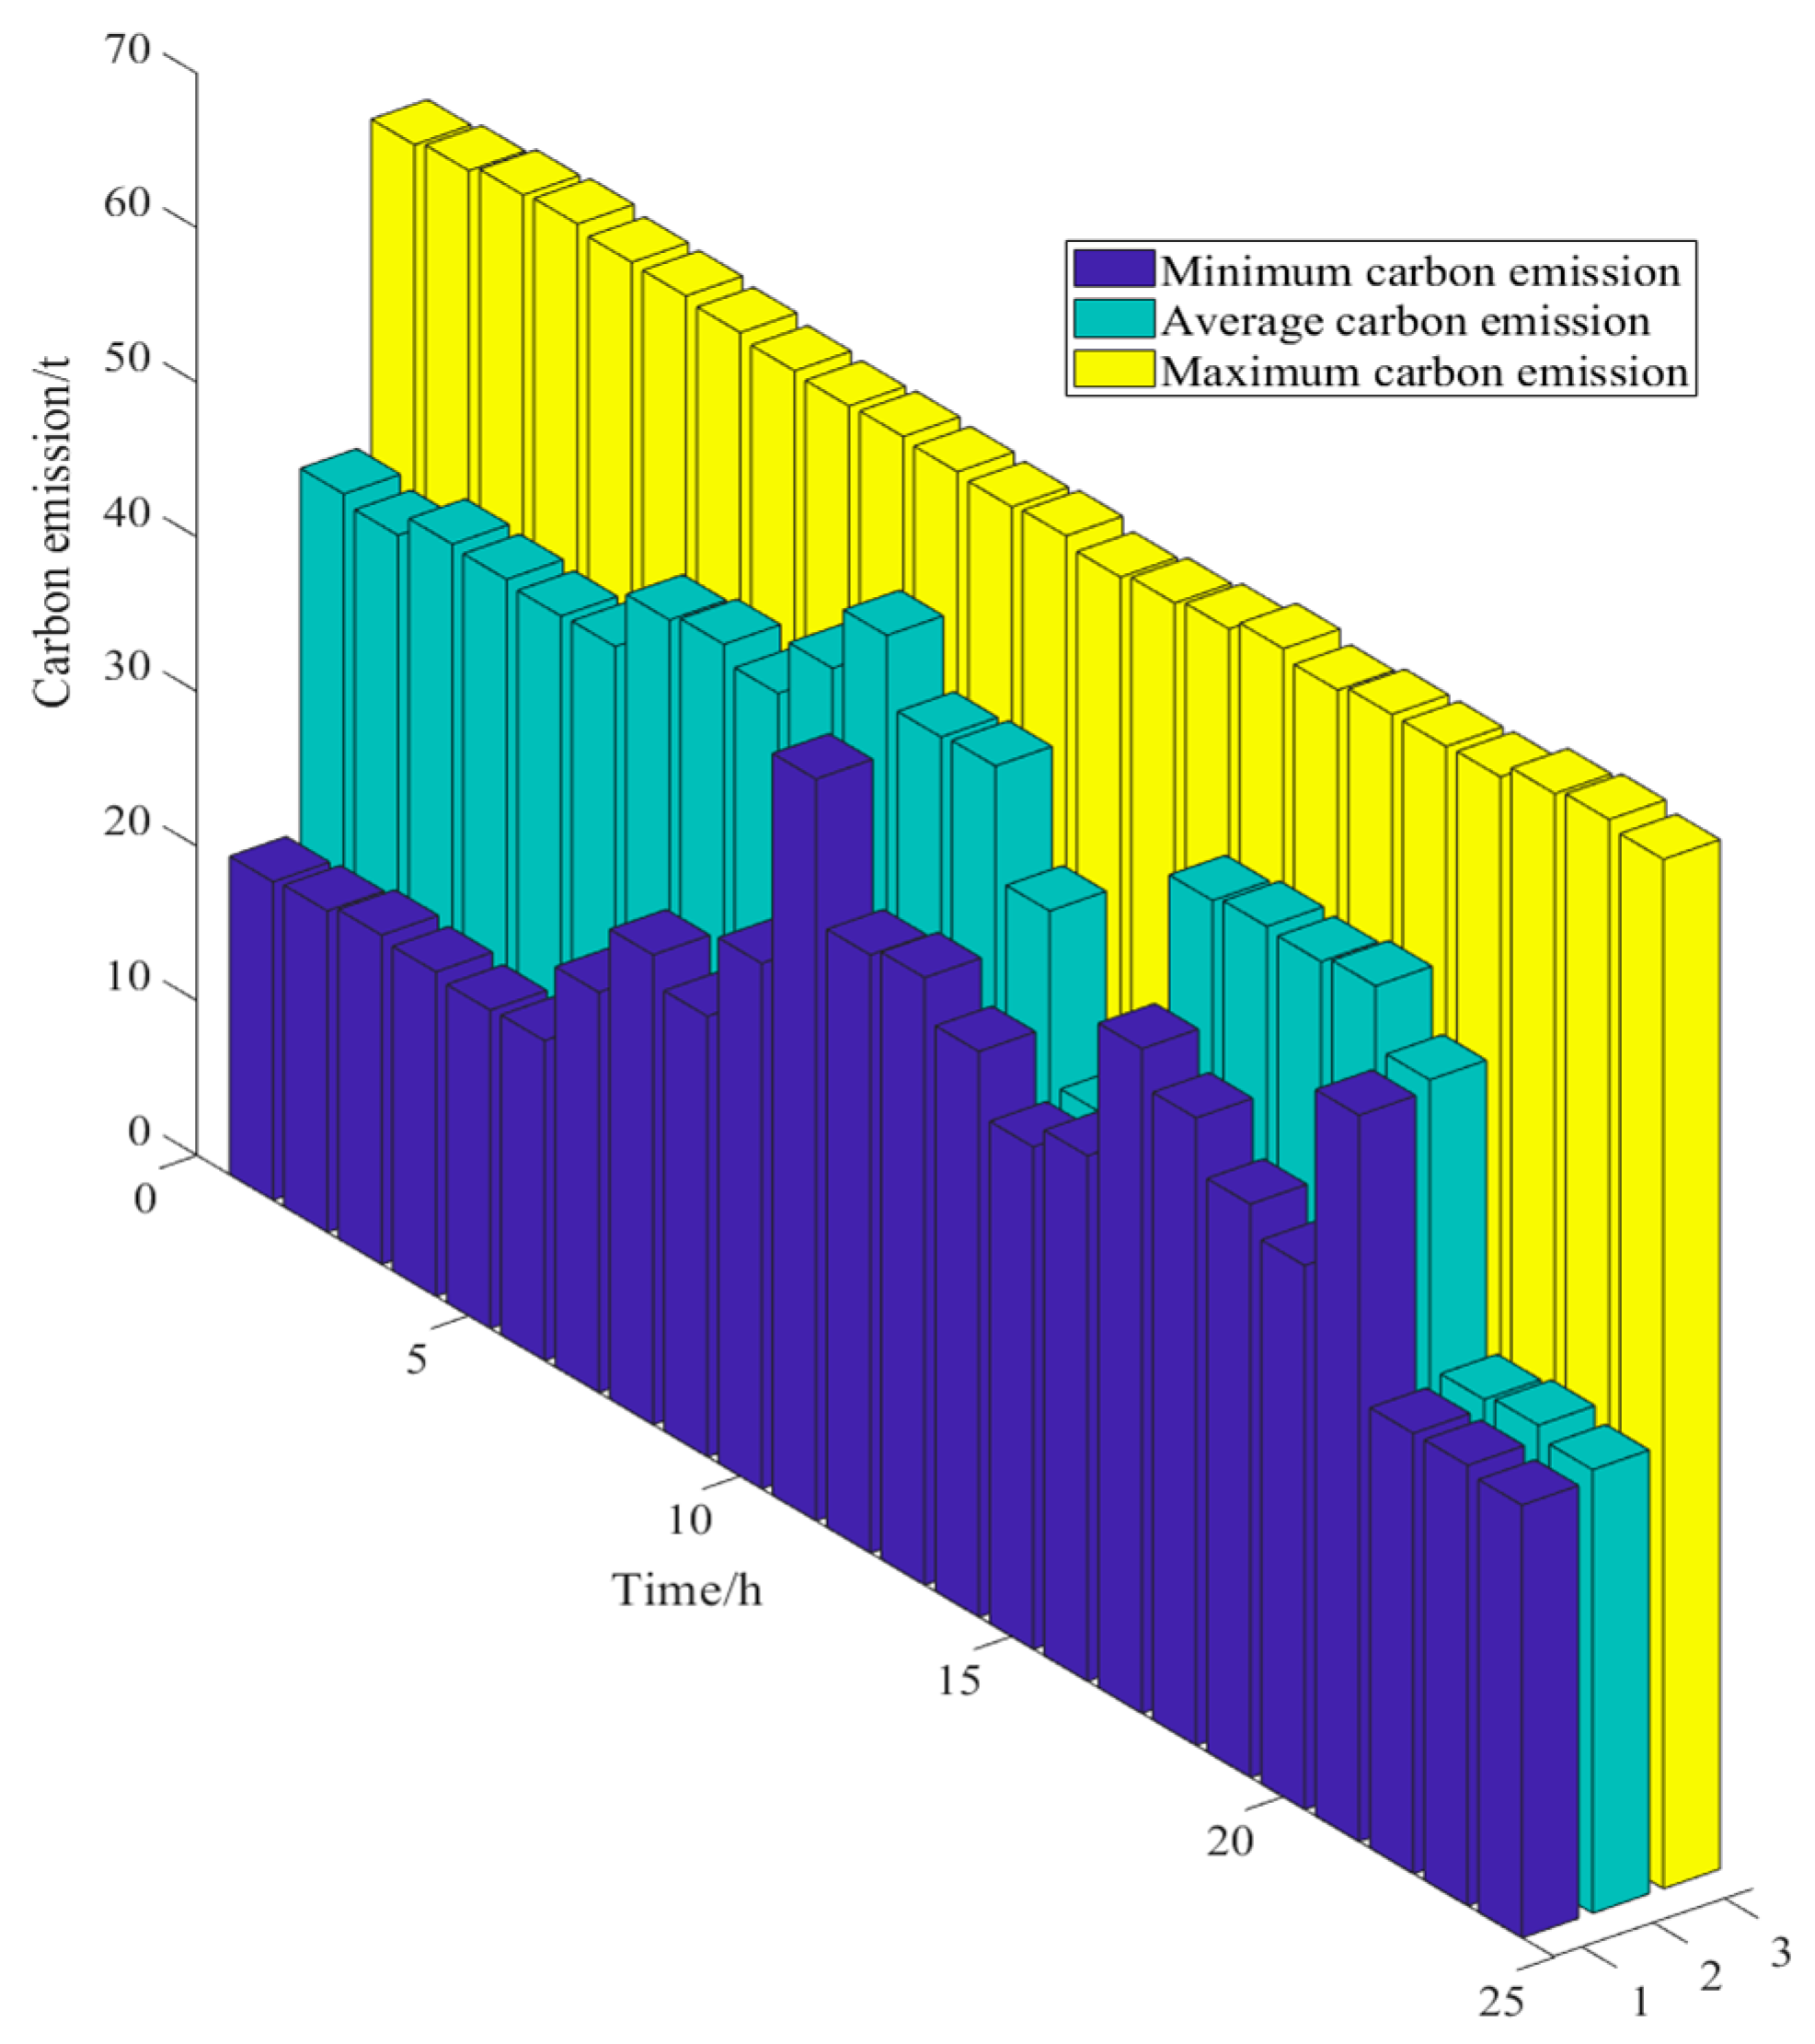
2.1. Carbon Emission Stream Model Based on Proportional Sharing Principle
Most of the carbon dioxide comes from the source side of the energy industry, but the key factor determining carbon emissions is in the end-use stage. A carbon emission flow model constructed using the principle of proportional distribution can measure the total carbon emissions of various energy products from production to consumption. At present, the calculation method of this carbon emission flow theory is gradually improving, and the carbon emission flow situation at each time period and node can be calculated based on the known trend distribution.
When calculating carbon flow, the carbon potential of a node is only affected by the injected current, so the sum of the active current of the node is
In the formula, is the sum of active power flows flowing into the node ; is the active power of the branch ; is the set of branches representing node with flowing currents; and is the output of the connected generator .
- (1)
Carbon flow rate
The carbon flow rate represents the carbon emissions corresponding to the energy flow through network nodes or branches per unit time. It can be represented by
, in seconds, as shown in Equation (2).
In the formula, represents the inflow of carbon emissions and represents time.
- (2)
Carbon flow density
The carbon flow density represents the carbon emissions per unit of electricity, including three concepts: generator carbon emission intensity, branch carbon flow density, and node carbon potential, all measured in t/MWh. The carbon intensity of a generator represents the real-time carbon emission intensity of a power plant based on its power generation characteristics, denoted as .
Branch carbon intensity refers to the carbon emissions on the generation side caused by unit electricity consumption in branch transmission, which is the ratio of branch carbon flow to active power flow. The calculation formula is
In the formula, is the carbon flow rate, and is the power of the transmission line.
- (3)
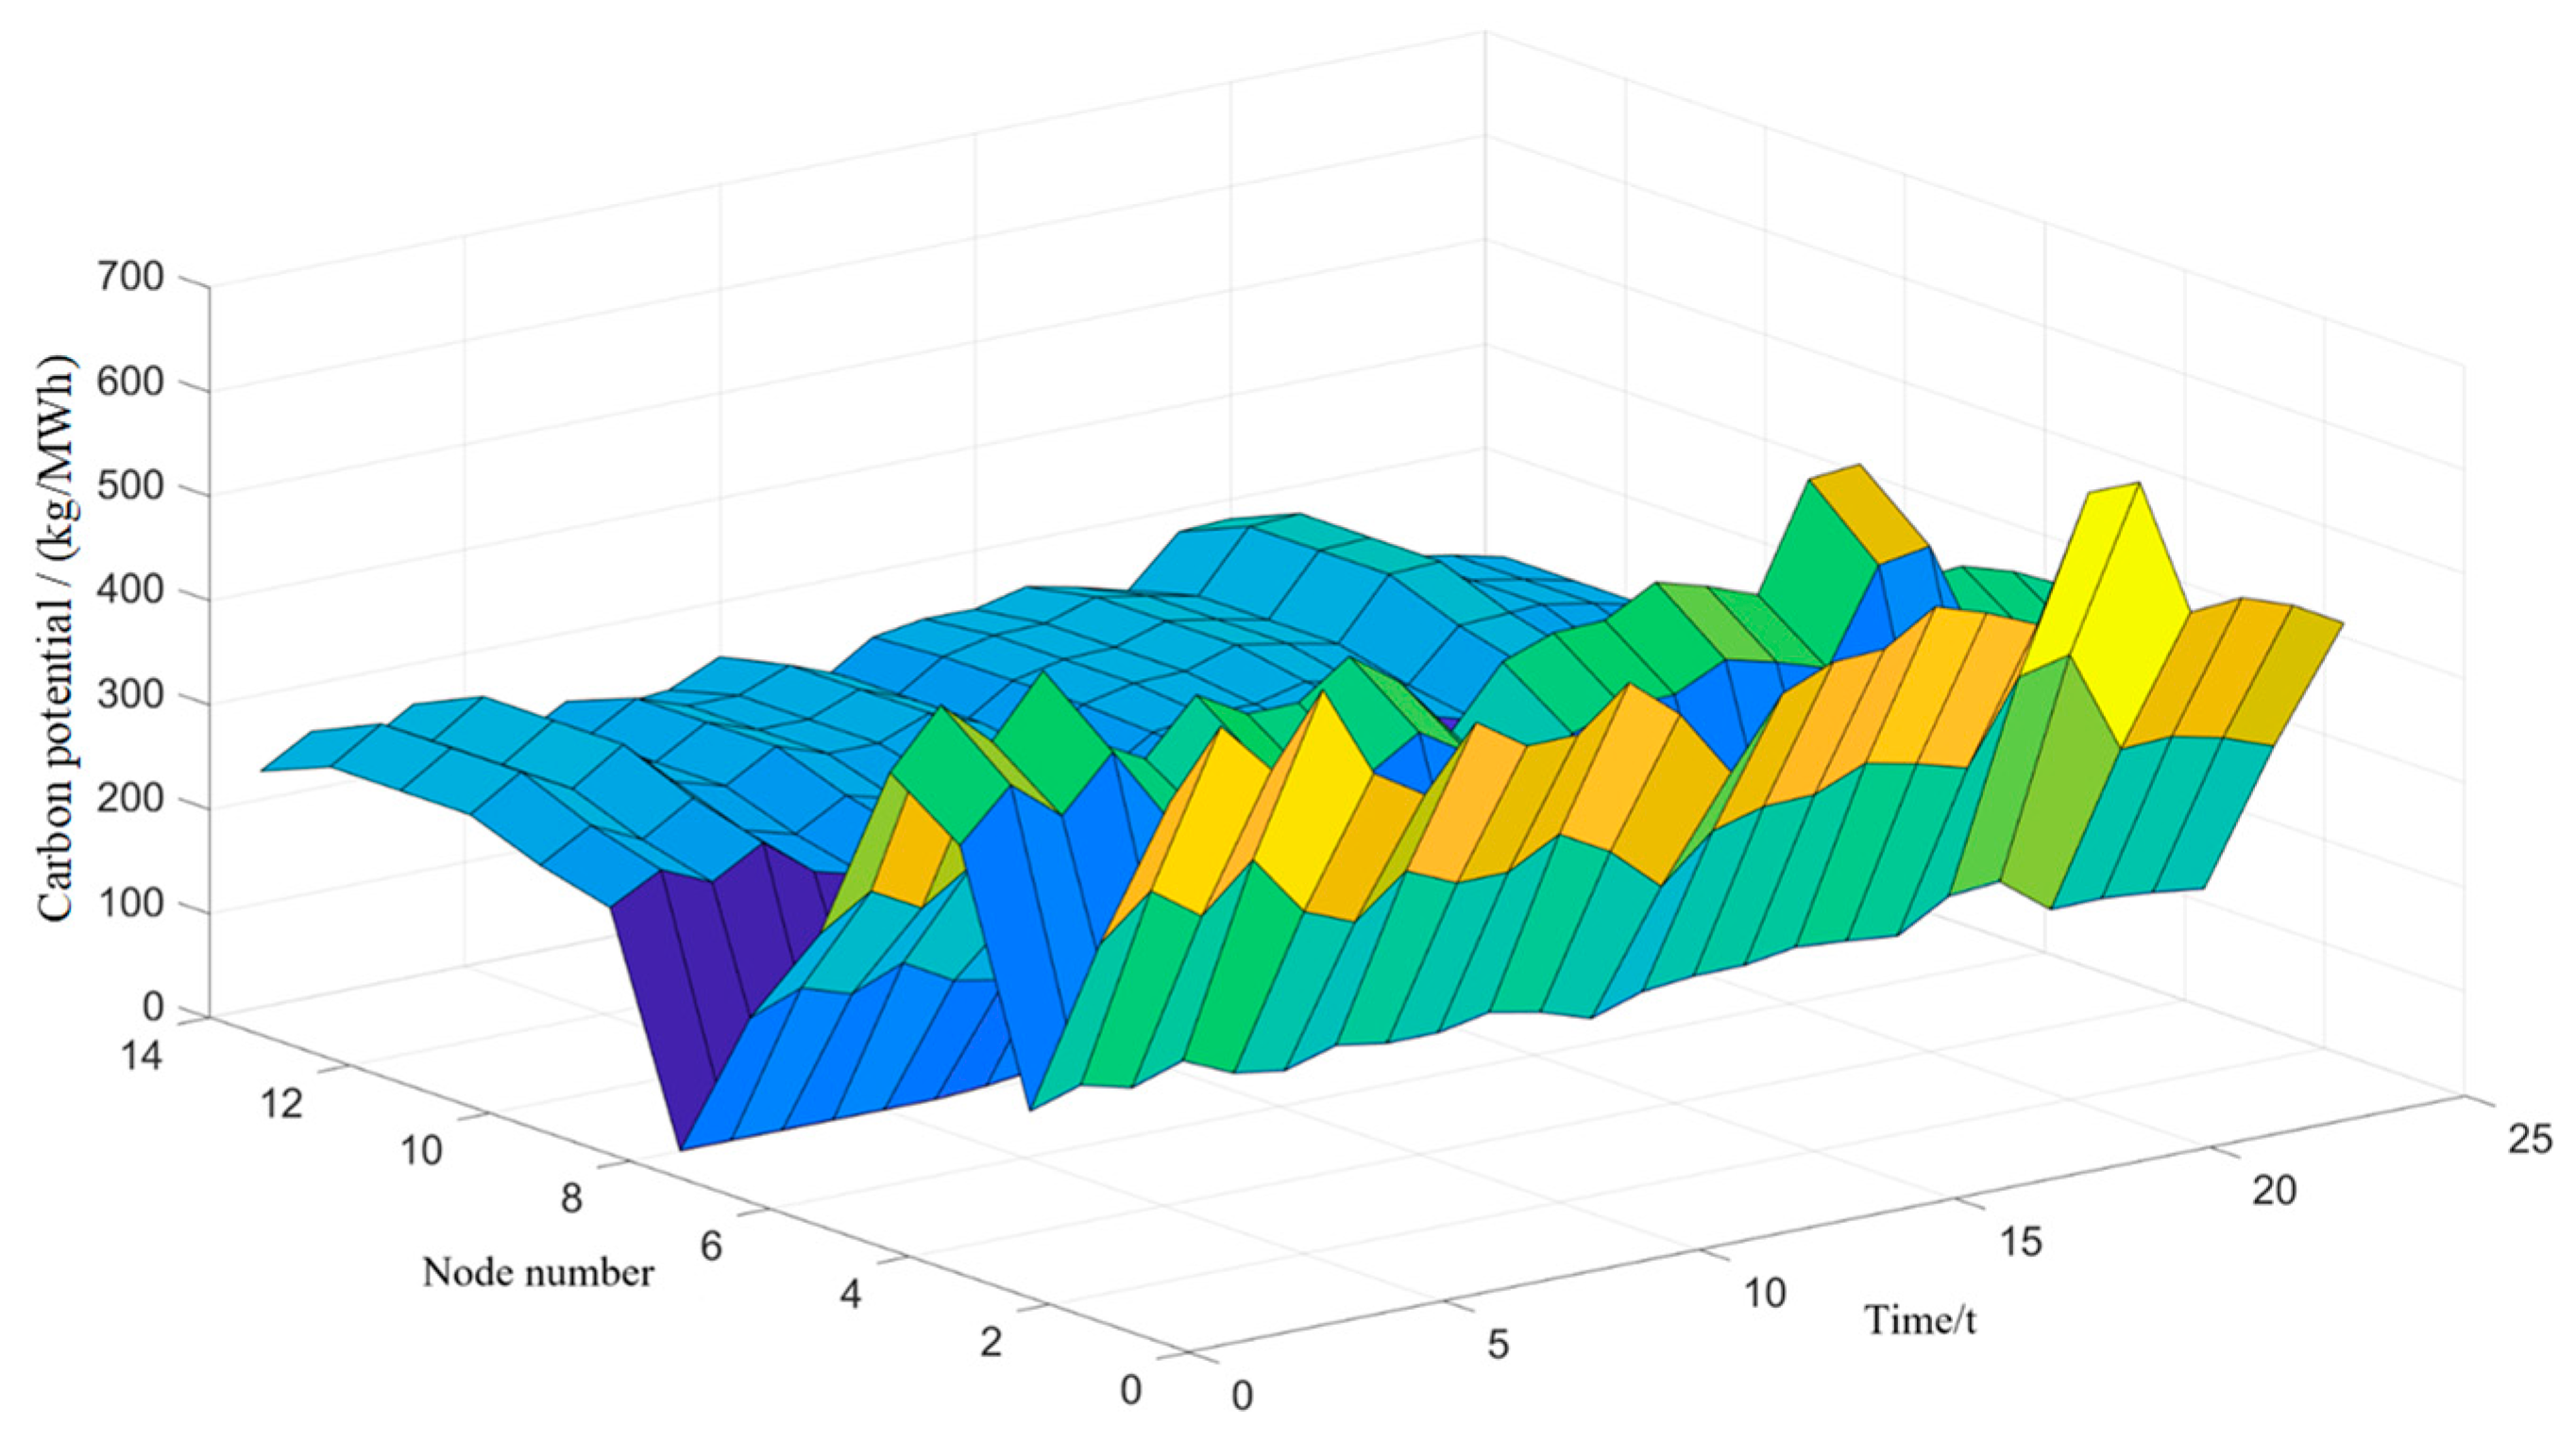
Node carbon potential
The carbon potential of a node represents the equivalent carbon emissions generated on the power generation side per unit of electricity consumed by the node. This value is equal to the weighted average of the carbon flow density of all branches flowing into the node relative to the active power flow. For node
n, the carbon potential of node
n is
In the formula, is the carbon potential of the node ; is the carbon emission intensity of the generator ; is the injection power of node i in the branch; is the generated power of the generator at the node ; is the carbon flow density of branch i injected into the node; and is the number of injected power branches connected to the node.
After obtaining the carbon potential of the node, the carbon emissions of the node load can be calculated:
In the formula, represents the carbon emissions of node n; and is the load capacity of node n.
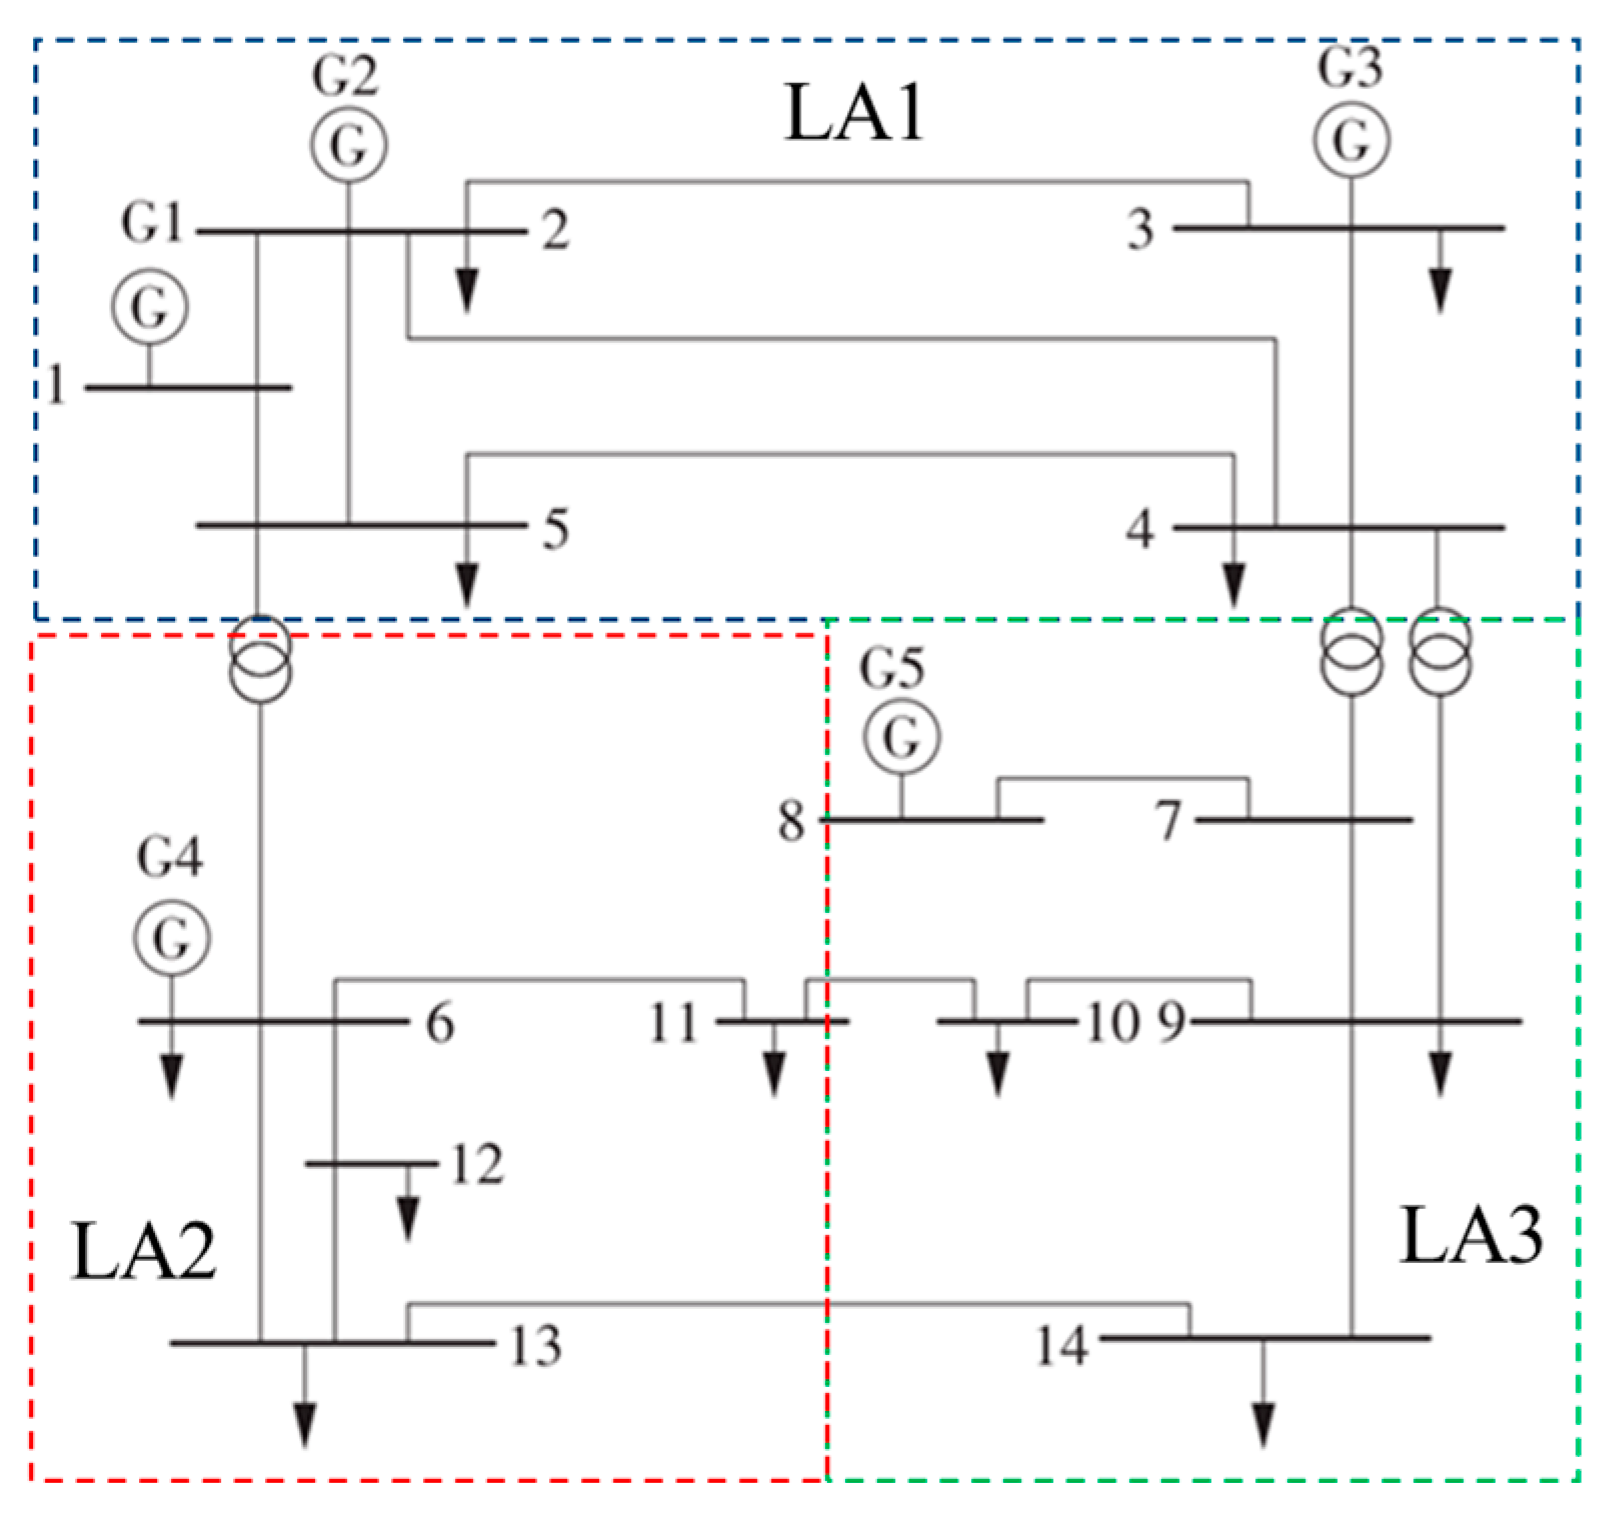
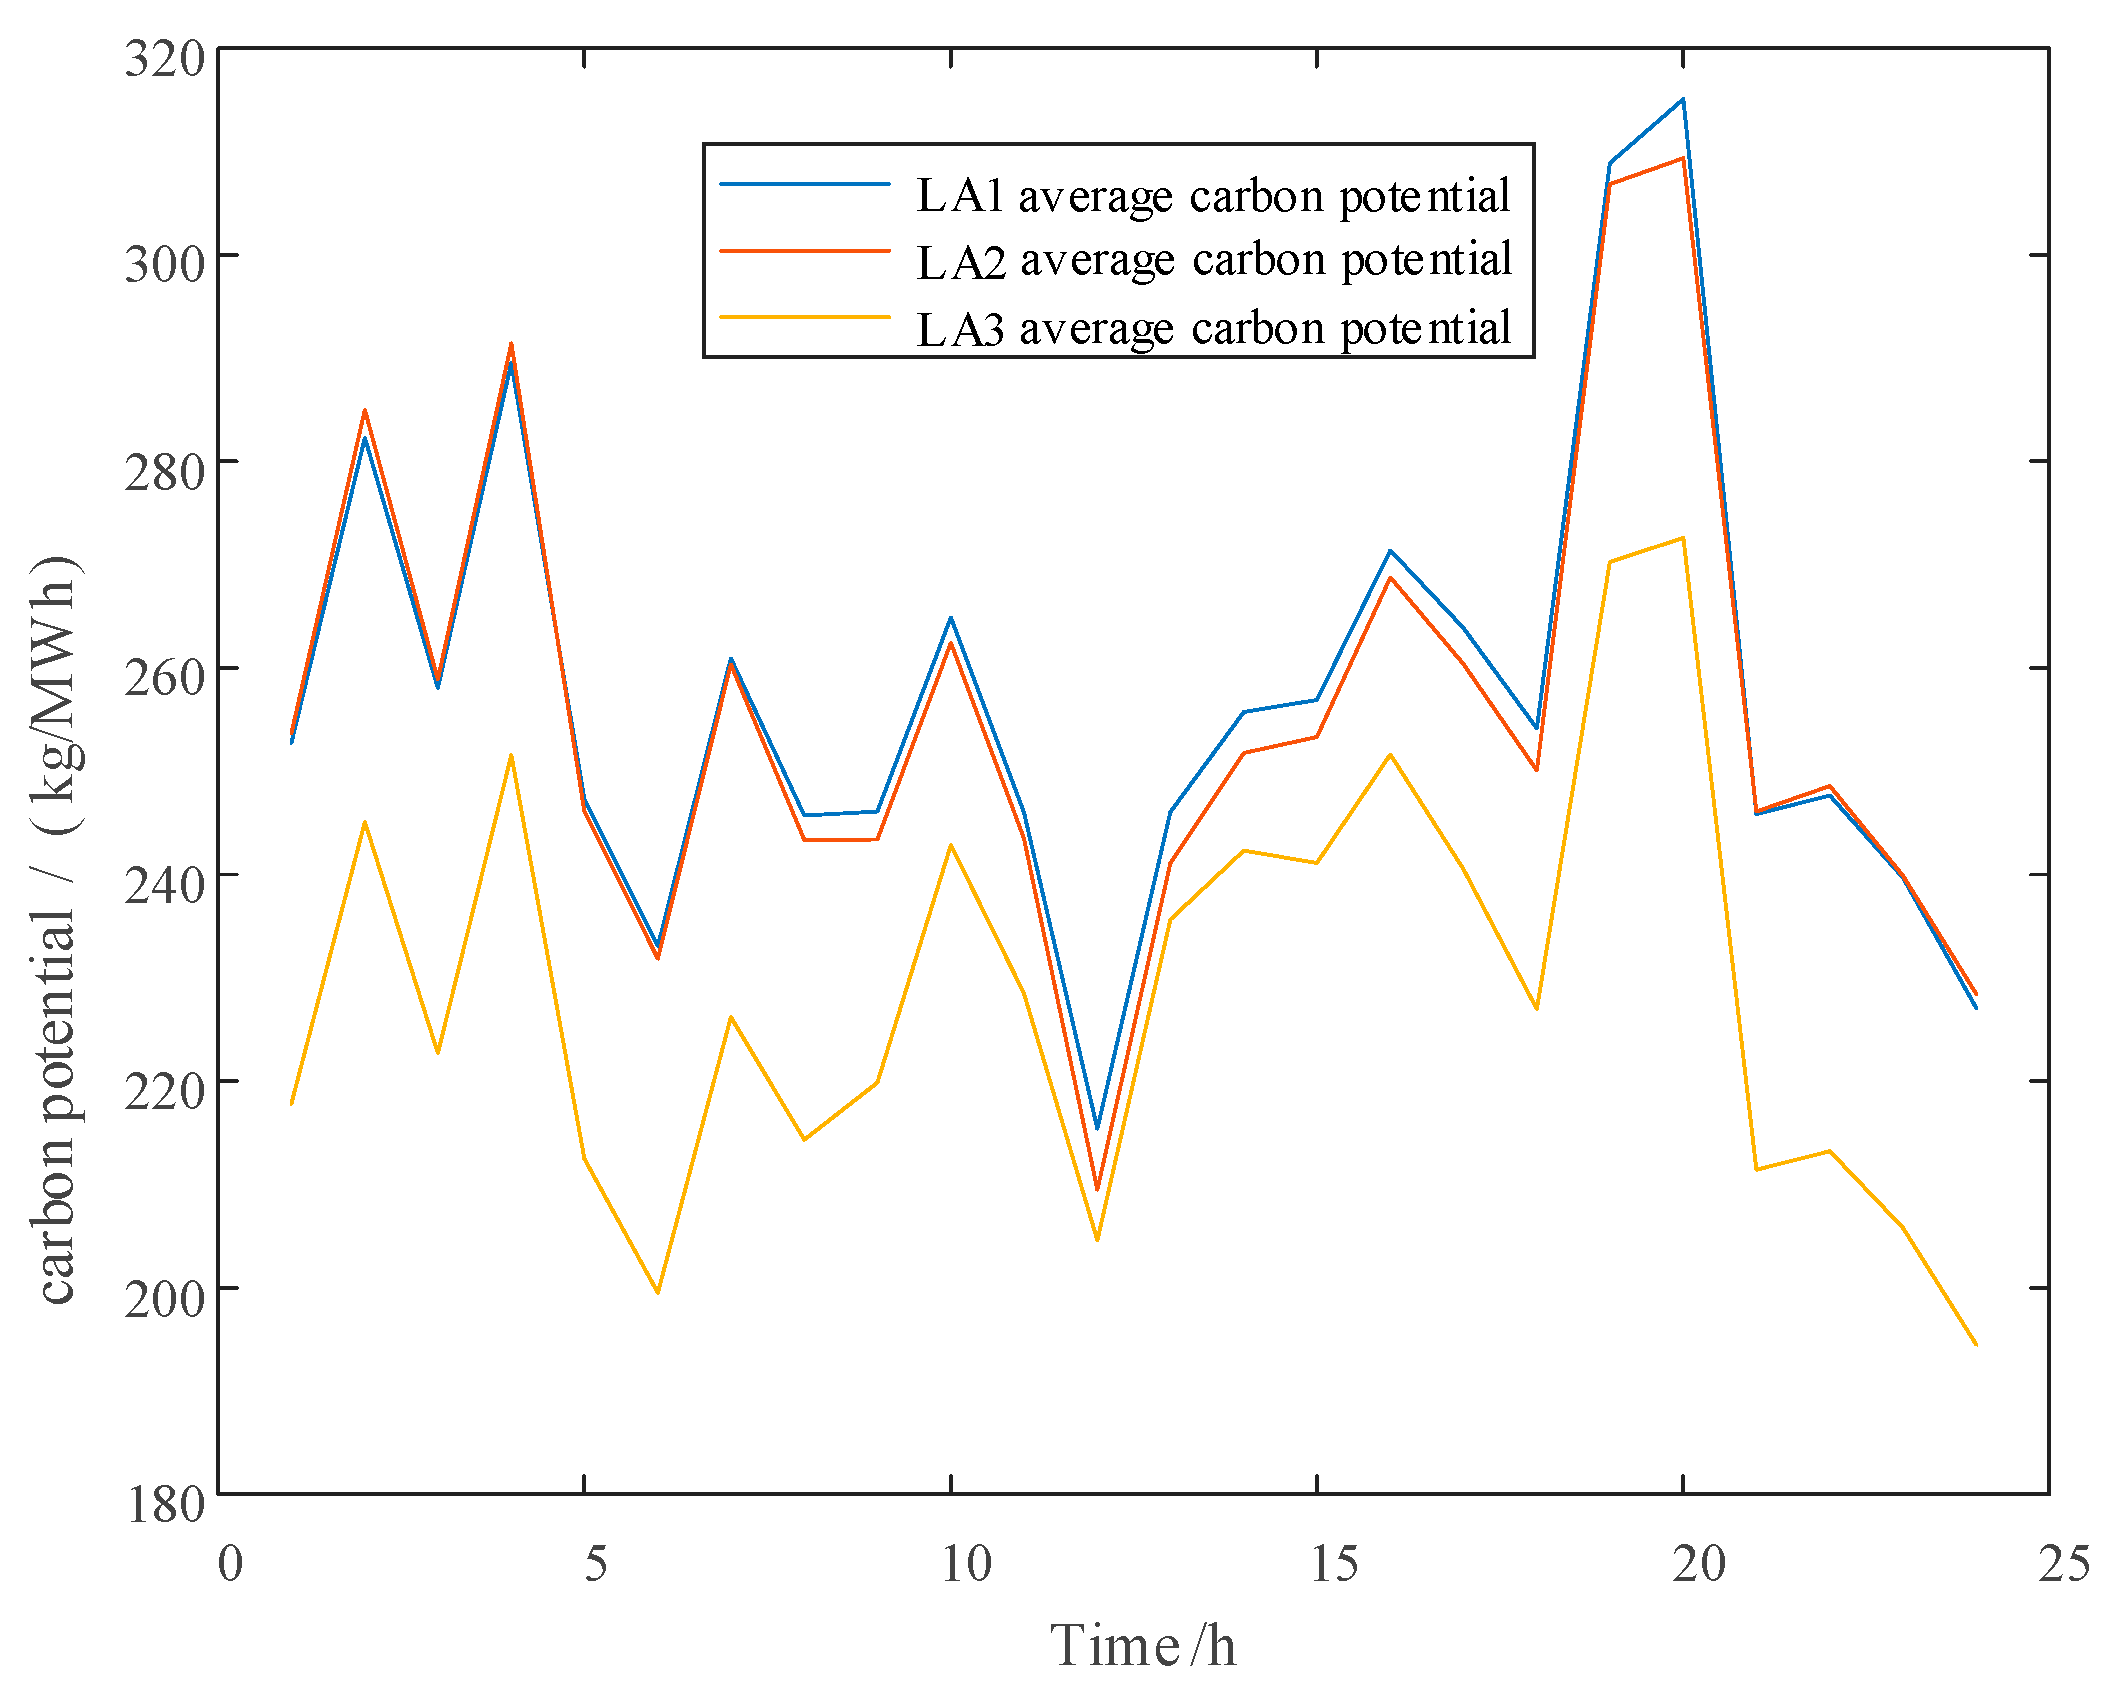
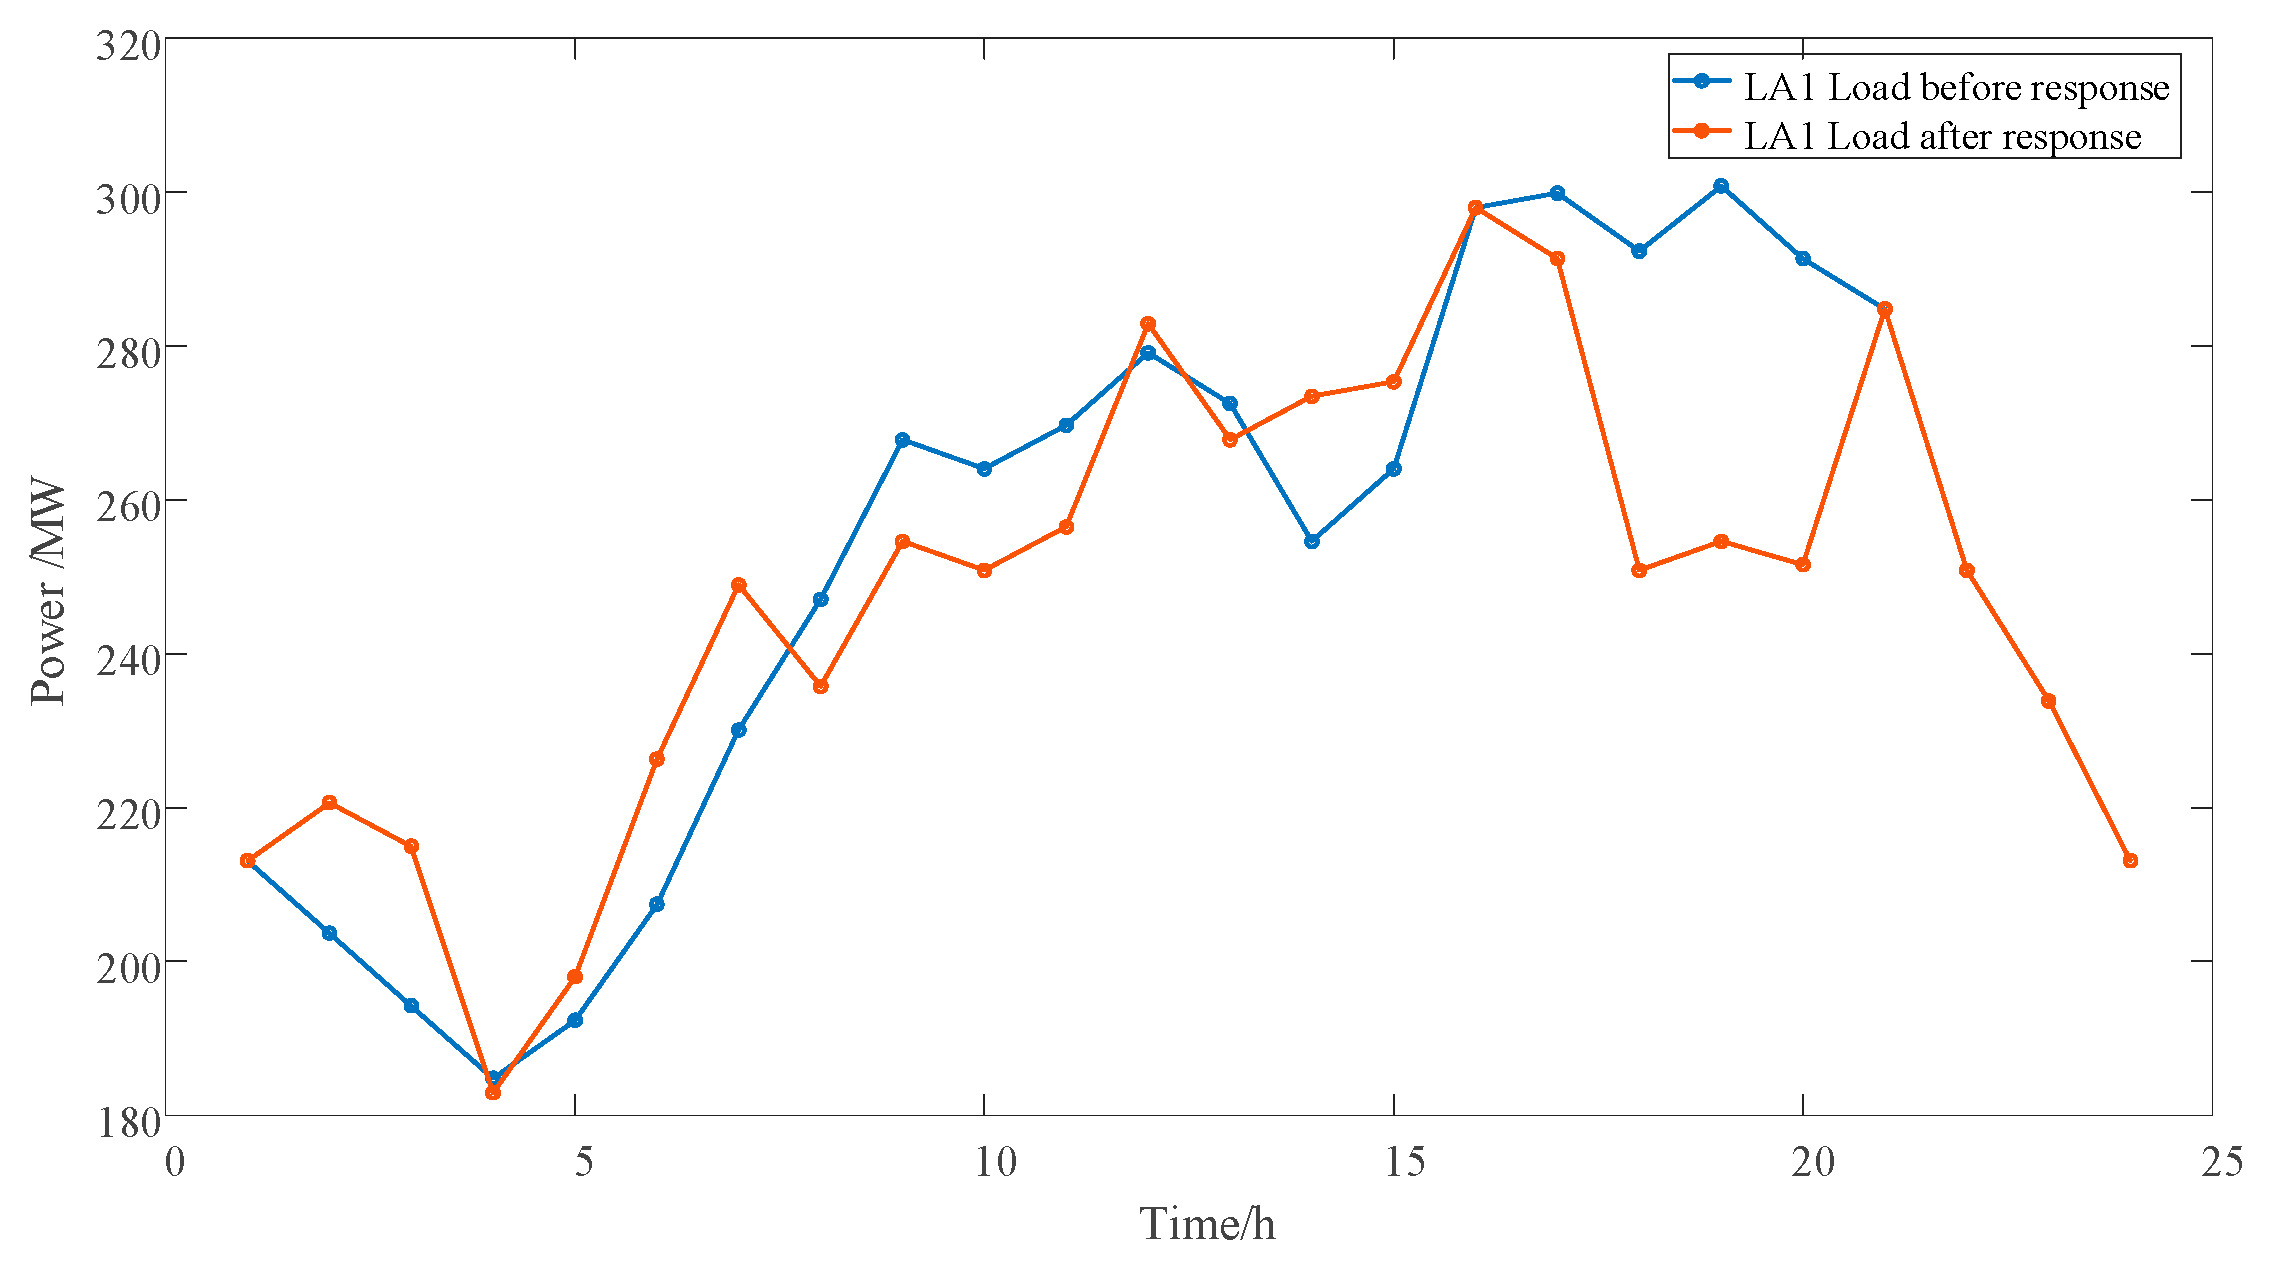
2.2. Load Carbon Emission Model Guided by Node Carbon Potential
After calculating the carbon potential of each node through the carbon flow tracking method, each LA receives the node carbon potential signal and uses incentive contracts to guide flexible loads to respond to it. A flexible load carbon emission model based on node carbon potential is constructed to obtain the carbon emissions of flexible loads after demand response. This article divides flexible loads in residential LA, commercial LA, and industrial LA areas into electric vehicles, reducible loads (CLs), and transferable loads (TLs). The carbon emission model of flexible loads guided by the node carbon potential is shown below.
- (1)
EV carbon emission model
After an EV signs an agreement with an LA, the EV grants the LA the right to charge and discharge, and the LA can freely schedule authorized EVs within the agreed time and limitations. This article uses the Monte Carlo method to simulate the uncertainty of EV daily mileage, access time, departure time, initial access power, and target power.
The carbon emissions
of an EV are the carbon emissions generated by charging the EV at time
t minus the carbon emissions reduced by discharging:
In the formula, is the total charge and discharge amount of all connected EVs at time t; is the carbon potential of node m; is the number of EVs; and and represent the charging and discharging power of the th EV at time t.
- (2)
CL and TL carbon emission models
The incentive contract specifies the load response amount, load response compensation fee, and response time of users of CLs and TLs. A CL refers to a load that cannot be transferred, but can be reduced by a certain proportion within a certain period of time. The TL operating period is relatively flexible, allowing interruptions with an indefinite duration while ensuring the same cumulative operating time, and keeping the total amount of load input and output unchanged.
The flexible load of the new energy microgrid in the park can respond to the demand of the power system, adjust the electricity consumption and power load according to the actual situation, and assist the new energy generation system in power dispatching, thereby improving the stability of the power system.
The carbon emissions
after demand response by the CL and TL are as follows:
In the formula,
represents the node carbon potential after the load participates in the demand response at node m at time
t;
and
represent the power input and output of the TL at time
t, respectively;
is the reduction in the load at time
t;
is the 0–1 state variable of the CL at time
t;
is the upper limit value of the CL;
and
are the starting and ending moments of the CL response, respectively;
is the upper limit of the CL response period;
and
represent the response status of the transfer in and transfer out of the TL at time
t, represented by 0–1 variables;
and
are the upper limits of the TL input and output power, respectively;
and
are the starting and ending times of the TL transfer in and transfer out, respectively. By combining Equations (7) and (8), the actual carbon emissions
in the LA can be obtained, which is the sum of the initial load, CL, TL response, and carbon emissions generated by EV charging and discharging:
In the formula, is the initial load of the LA at time t.
- (3)
Price-based demand response model
According to consumer psychology theory, price-based demand response aims to change users’ charging load and habitual electricity usage patterns, and to develop reasonable electricity prices to guide user load distribution. Taking electricity load as an example, the impact of electricity price changes on electricity load is represented by the demand elasticity matrix E, as follows:
In the formula, the values of electricity load and user electricity value at time t are and , respectively, and their changes from time to time are represented by and . The ratio between the two is the load change rate and electricity price change rate at time t, represented by and , respectively. The main diagonal of the demand elasticity matrix is the self-elasticity coefficient. The sub-diagonal is the mutual elasticity coefficient, with values of −0.2 and 0.033, respectively, in this paper. The total load remains unchanged before and after demand response. The load forecast value at time t is represented by . The load forecast value before demand response is represented by . represents the entire scheduling cycle.


