1. Introduction
Urbanization significantly alters the physical landscape of cities and causes notable changes in urban climate. These changes often affect the thermal environment more directly than global climate change itself [
1]. Rapid urban expansion frequently leads to a reduction in green spaces, including parks, wetlands, and agricultural lands. The loss of these areas diminishes biodiversity and recreational opportunities while also degrading the natural cooling effects that vegetation provides. Moreover, high built-up density, a common feature of urbanization, contributes to this phenomenon by allowing densely constructed areas to absorb and retain heat more effectively than surrounding rural regions [
2].
The rise in land surface temperature (LST) in urban areas compared to their rural counterparts is commonly referred to as the urban heat island (UHI) effect [
3]. This effect has become a significant factor contributing to climate change at local, regional, and global levels [
4]. UHI can result in various adverse outcomes, such as increased energy consumption due to greater dependence on air conditioning, more intense heat waves, changes in local wind and rainfall patterns, and an increase in air pollution [
5]. As global temperatures rise and urbanization accelerates, the impacts of the UHI effect are expected to grow. As a result, UHI has drawn considerable interest in the academic community and has been the focus of extensive study [
6,
7,
8,
9].
According to the review by Kim, Brown [
10], the severity of the UHI effect is on the rise due to both global and urban climate change. The resulting damage from UHI is expected to intensify. To develop effective strategies for mitigating current and future heat stress in cities, it is essential to conduct further research that accurately estimates and analyzes the intensity and extent of UHI. Therefore, analyzing and forecasting the magnitude of UHI is crucial to enhancing the cities’ preparedness for potential impacts. Additionally, the findings from those analyses will provide vital information to help mitigate UHI-related damage by formulating effective plans and policies in areas significantly impacted by urban heat stress.
In recent years, remote sensing and geographic information systems (GIS) technology have played a crucial role in assessing the UHI effect together with changes in land use [
11]. Remote sensing data obtained from the thermal bands of Landsat 8 can be conveniently used in estimating LST [
9]. Moreover, remotely sensed data provides an efficient and accurate means to assess land use evolutions over time. This technology detects modifications in urban development patterns and the expansion of built environments. Furthermore, GIS enhances remote sensing by integrating spatial data, which allows for a detailed analysis of land cover characteristics and urban growth [
12]. The combination of remote sensing and GIS facilitates the monitoring of important indicators, such as impervious surface coverage and vegetation indices, which are vital for evaluating environmental impacts, particularly regarding the UHI effect [
13].
Additionally, data from public satellite missions can now be easily accessed through the powerful Google Earth Engine (GEE) platform. GEE provides access to a vast catalog of satellite imagery and geospatial datasets. This platform is designed to support efficient analysis of large-scale geospatial data. Remote sensing data retrieved from GEE can be effectively used for land use and land cover classification, particularly when combined with machine learning-based classifiers [
14]. Notably, the integrations of GIS, cellular automata, and neural networks have provided an effective tool for simulating future land use and land cover [
15,
16]. Cellular automata represent different land types through discrete cells and analyzes spatial interactions and transitions based on predefined rules. CA captures the dynamics of land use change over time and offers insights into future scenarios [
17]. Cellular automata can be combined with neural networks; this integrated approach relies on neural networks for transition potential modeling [
18].
There has also been a notable trend in applying machine learning and GIS technology in spatial estimation of the UHI effect in urban environments. The integration of machine learning and GIS offers numerous advantages for the task at hand. First, machine learning algorithms excel at handling complex datasets, allowing for the analysis of various influencing factors such as land use, vegetation cover, and other geographical variables. These data-driven approaches, such as artificial neural networks [
19], can identify intricate patterns and relationships in datasets. Hence, machine learning models can provide accurate estimations of the urban heat stress [
18]. Second, GIS technology enhances the visualization and geospatial analysis of surface temperature data [
20]. By combining machine learning approaches, remote sensing data, and GIS, insights are revealed into how different explanatory variables—such as impervious surfaces, green spaces, waterbodies, barelands, and wetlands—contribute to the intensity of the UHI effect [
21,
22,
23].
Despite the aforementioned advancements, significant gaps remain in the research on spatial modeling of UHI intensity. Few studies have developed data-driven models to forecast the spatial variations in UHI intensity based on projected land cover change. While there is universal agreement on the increasing trend in UHI in major urban areas, further investigation is necessary to investigate the key variables driving spatial variations in UHI effects, especially considering the unique characteristics of different regions. Additionally, due to the complexity of the problem at hand, more research should be dedicated to exploring the potential of other advanced machine learning techniques. The urban center in Da Nang, Vietnam, has recently faced unprecedented heat waves resulting from a combined effect of UHI and climate change; however, the spatial variation in UHI intensity in this area is scarcely documented.
Furthermore, advanced gradient boosting machines have gained attention for their strong learning capabilities and high predictive accuracy [
24,
25,
26]. These models often achieve excellent accuracy and effectiveness when applied to complex datasets derived from GIS and remote sensing that exhibit intricate patterns and relationships. Various works have confirmed the superiority of these boosting-based machines over other methods [
27,
28]. However, few studies have been dedicated to investigating the capability of advanced gradient boosting machines for estimating and forecasting the spatial variations in UHI intensity.
This study addresses existing gaps in the literature by introducing an innovative data-driven framework for spatial modeling and forecasting of UHI intensity in Da Nang’s urban center. The research employs machine learning analyses to investigate the spatial variations in this variable within the study area. The study examines the influence of various environmental and anthropogenic factors on urban heat stress. Remote sensing data from Landsat 8 is used for retrieving LST and formulating GIS datasets. A comprehensive set of factors, including topographical features, distances to coastlines and rivers, land cover types, built-up density, greenspace density, bareland density, waterbody density, and distance to wetlands, are considered influencing variables.
This study utilizes natural gradient boosting machine and deep neural network methods to establish functional relationships between the aforementioned influencing factors and UHI intensity. To provide insights into the contributions of different factors to the spatial variation in urban heat stress, the study applies the Shapley additive explanations (SHAP) method. This method quantifies the impact of each factor and identifies the most significant ones. The proposed framework aims to assist urban planning authorities in estimating UHI intensity in Da Nang. Furthermore, a neural network-based cellular automata model is employed to project future land cover changes. Based on the projected land cover, the UHI intensity in Da Nang’s urban center for the year 2040 can be predicted. The results from this study can provide crucial information for urban planners and policymakers in establishing effective strategies to mitigate the impacts of UHI effects.
2. Research Method and Materials
2.1. General Description of the Study Area and the Employed Remote Sensing Datasets
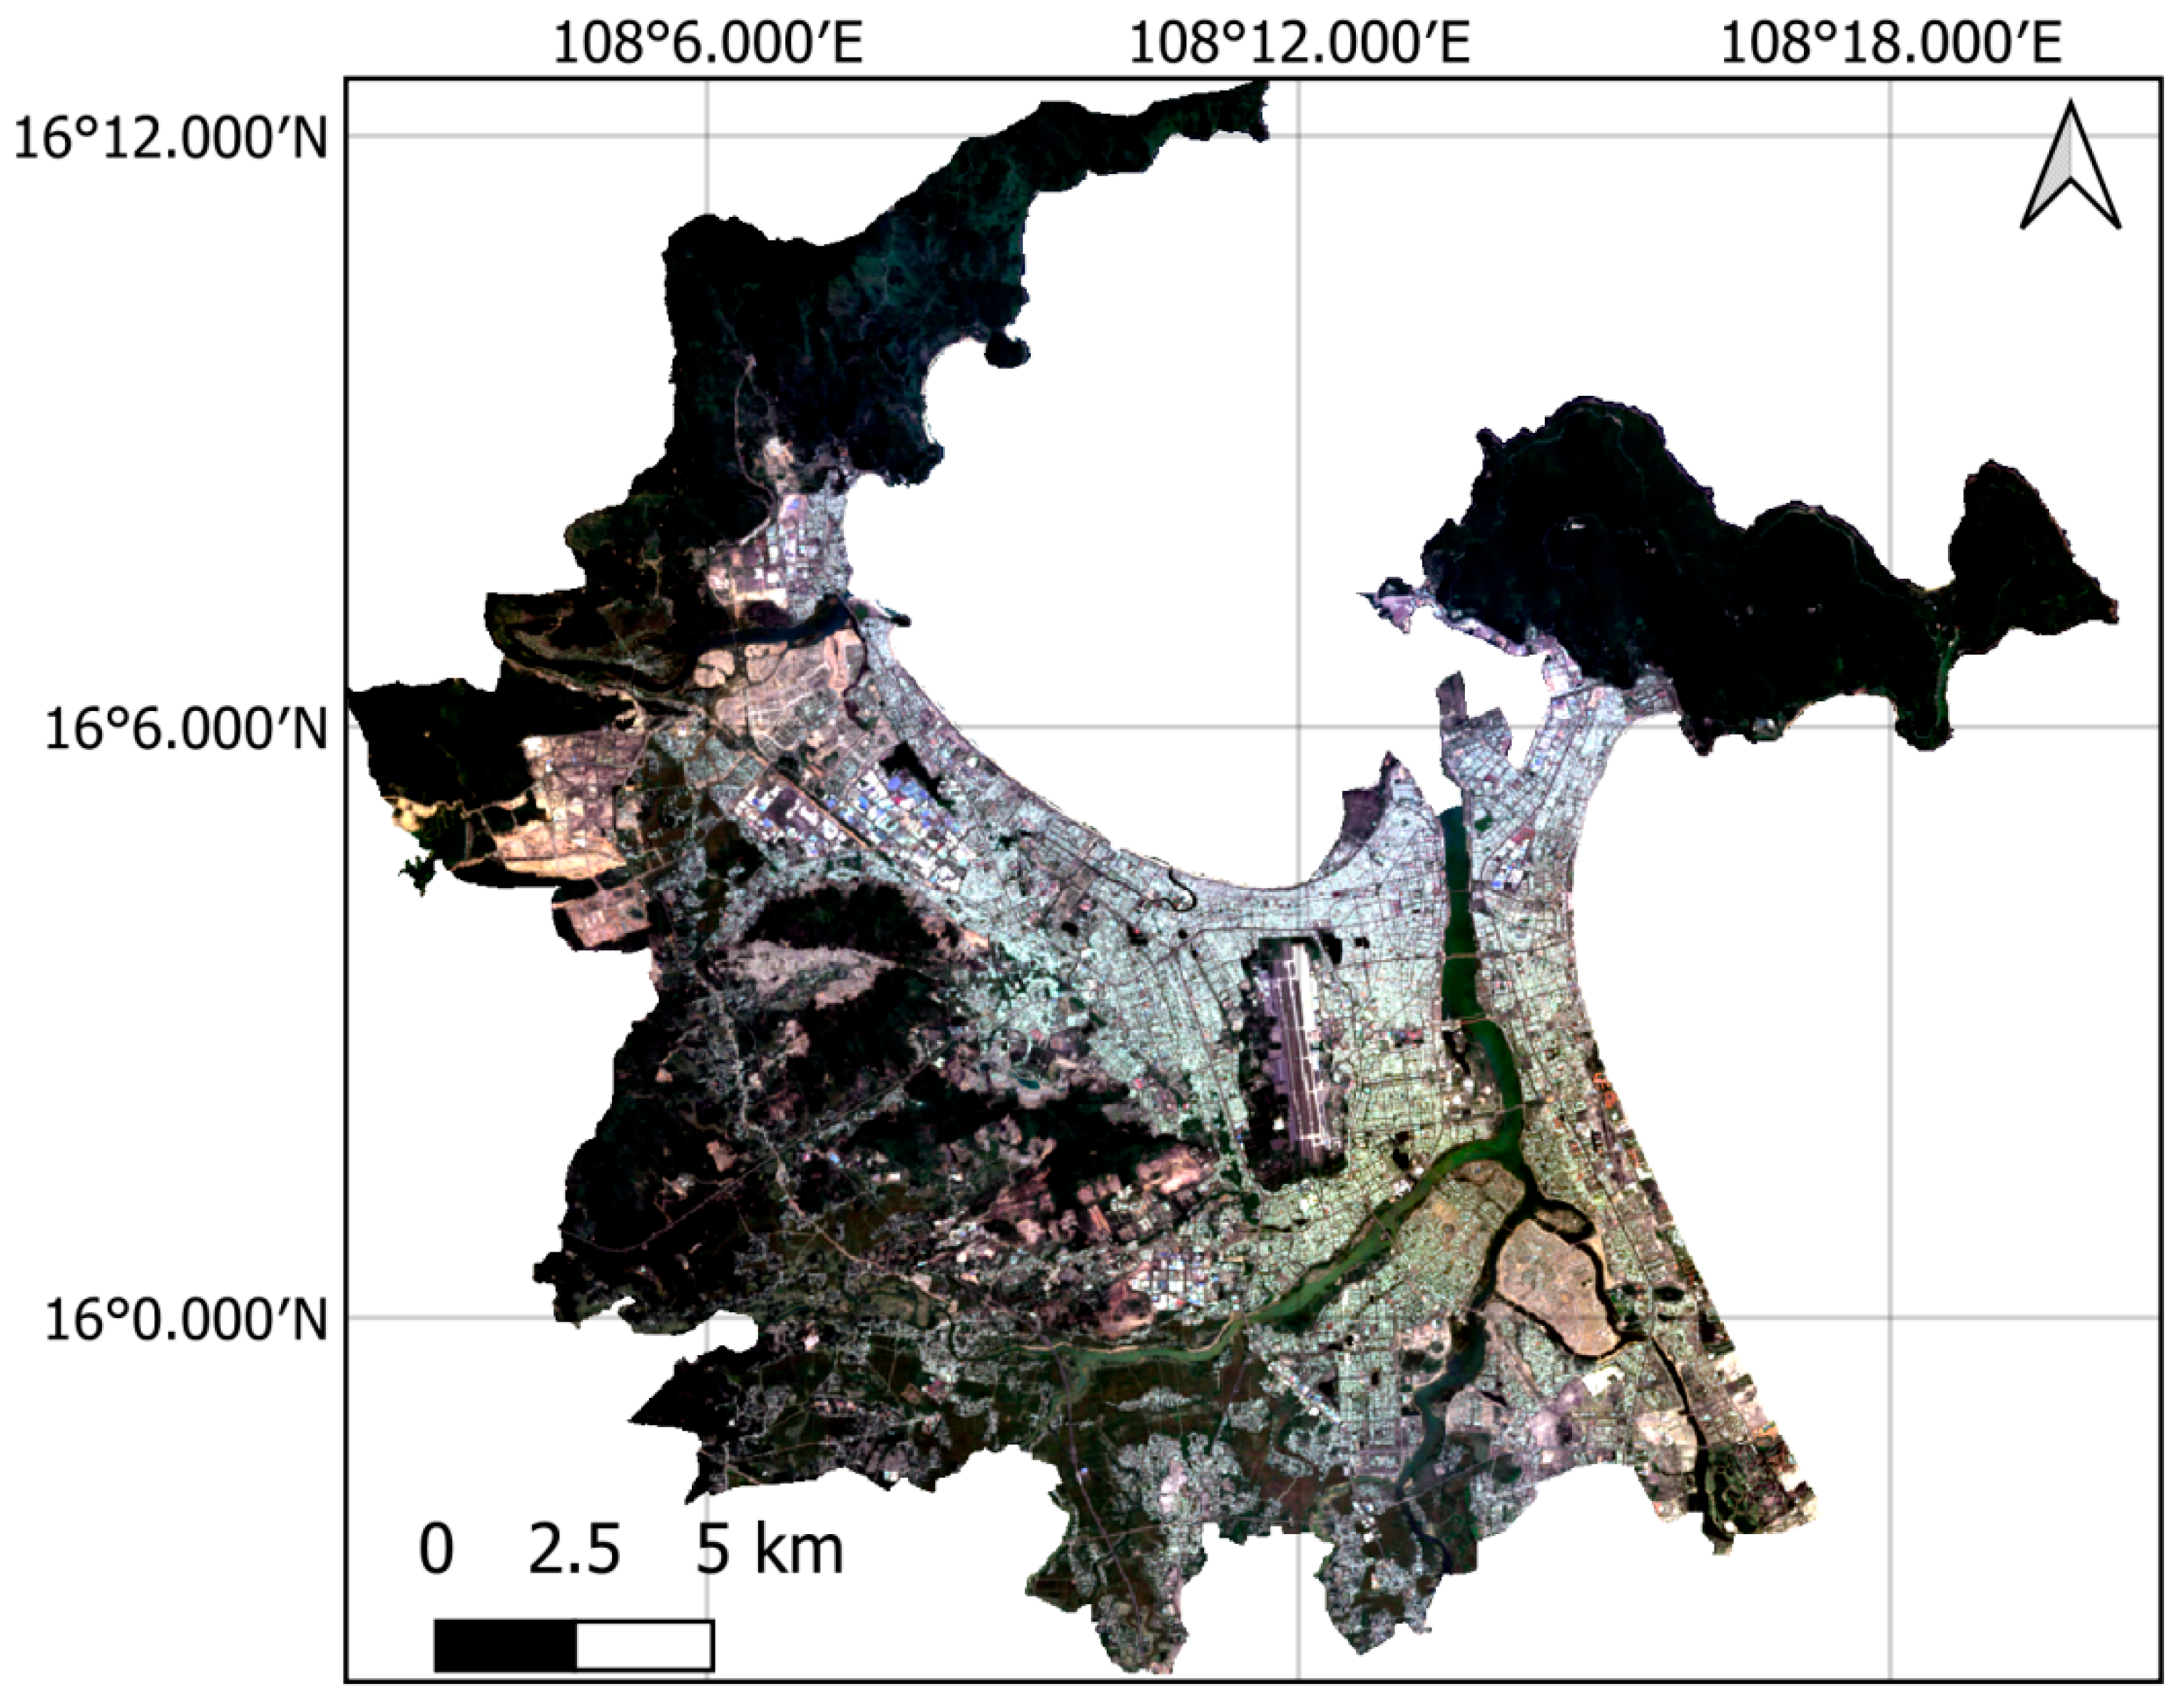
Da Nang, situated in a coastal area of South Central Vietnam, serves as a pivotal urban center due to its strategic location within the country. This region includes mountainous area in the west, coastal plain along the Han River, and the Hoang Sa Islands in the East Sea. The western and northwestern regions are dominated by high, steep mountains that extend toward the sea, while lower hills are scattered among narrow coastal plains [
29]. Due to the research interest of UHI effect, this study focuses on the urban center of Da Nang (refer to
Figure 1). The rural area of Hoa Vang district is used as the rural reference to evaluate the UHI in Da Nang.
Over recent decades, Da Nang has undergone significant urban development. The population surged by 1.3 times between 2002 and 2011, reaching approximately 1,374,562 residents by 2021 [
30]. This rapid growth has led to substantial urban expansion, with built-up areas increasing by an average of 430.9 hectares annually from 1996 to 2015 [
31]. Such extensive urbanization has increased the city’s vulnerability to climate change impacts, particularly in relation to heat stress. The climate in Da Nang is characterized by distinct wet and dry seasons, with notable seasonal variations in precipitation. During the dry season from March to September, the city experiences significant increased LST, which intensifies the UHI effect. Recent years have seen an increase in heatwaves attributed to climate change; the combined effect of UHI and heatwaves leads to intensified periods of extreme heat and drought in Da Nang [
32]. Therefore, the assessment of the UHI intensity is a pressing need for this region to develop effective strategies for mitigating heat-related health risks and enhancing urban heat comfort. As Da Nang continues to expand rapidly, understanding the spatial distribution and intensity of UHI allows urban planners and policymakers to formulate effective planning and targeted interventions.
In this research, data obtained from the Landsat 8 OLI/TIRS dataset are utilized to calculate LST in the study area. This dataset can be accessed through the GEE code editor. The analysis focuses on images collected from 1 March to 30 September of 2020. Specifically, the thermal band (band 10) of the thermal infrared sensor (TIRS) tier-1 is employed for LST measurement. To improve image quality, a cloud masking technique based on the quality assessment (QA) band is applied. Additionally, median filtering is used to process data sourced from the GEE catalog. The normalized difference vegetation index (NDVI) is derived from the SR_5 and SR_6 bands of the Landsat 8 OLI/TIRS. Elevation data for the study area are obtained from NASA’s SRTM Digital Elevation dataset [
33] and processed using GEE to derive additionally thematic maps of slope, aspect, and topographic position index. Furthermore, land use and land cover information is extracted from the GLC_FCS30D Global 30 m Land Cover Change Dataset (1985–2022) [
34]. A summary of the remote sensing datasets used in this study is presented in
Table 1. All thematic maps in this study are prepared using QGIS (Version 3.34.10) (
https://www.qgis.org/).
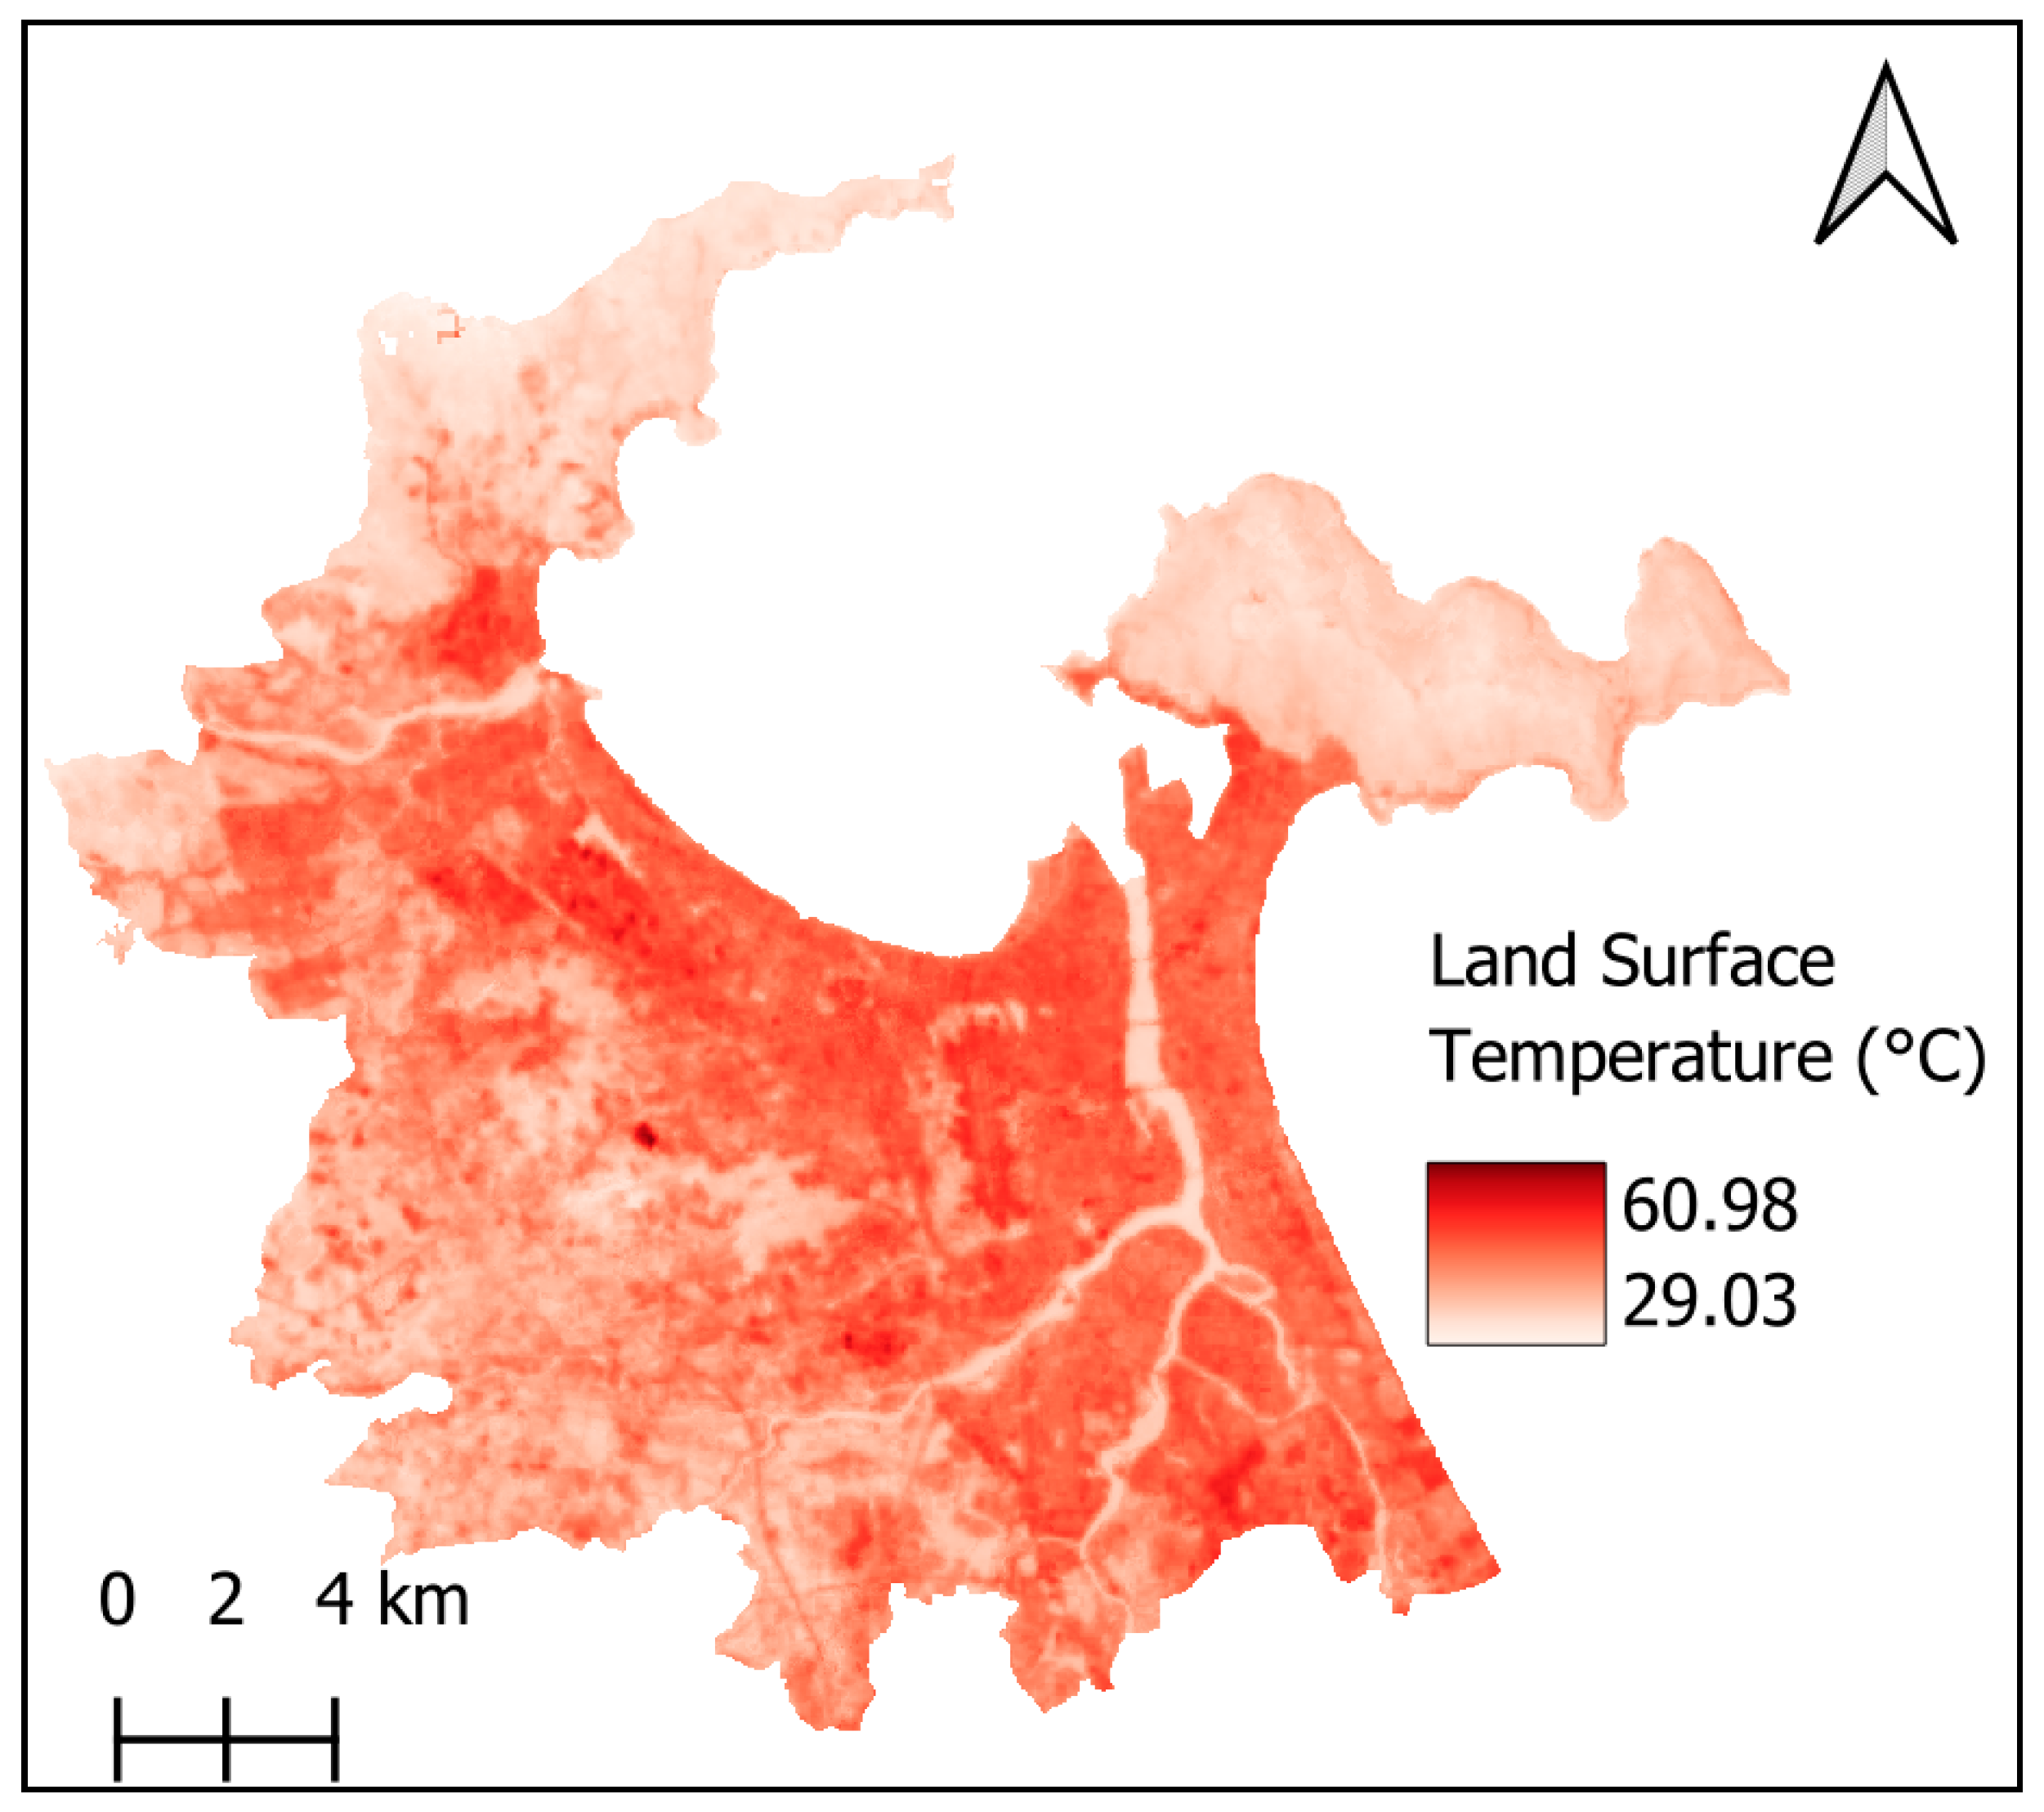
2.2. Retrieval of Land Surface Temperature
To analyze the intensity of the UHI in Da Nang’s urban center, the first step is to construct the LST map. This study retrieved LST data using the top of atmospheric (TOA) tier-1 data from Landsat 8. The thermal band of Landsat 8 originally had a resolution of 100 m, but was resampled to a resolution of 30 m. Additionally, radiometric calibration is applied to adjust the image data to radiance levels [
29]. The current work employs the thermal band (the 10th band) from the thermal infrared sensor (TIRS), which is widely used for measuring LST. Median filtering is utilized to process the data in GEE’s code editor.
Figure 2 presents the LST map of the study area.
In the first step, it is necessary to convert the spectral band values obtained from Landsat 8 into spectral radiance using the following method [
9]:
where B
10 refers to the digital number of the 10th band, MRF (0.0003342) indicates the multiplicative rescaling factor, and ARF (149) denotes the additive rescaling factor.
Moreover, the emissivity-corrected LST is computed in the following equation [
35]:
where
TS refers to the estimated surface temperature measured in Celsius (°C);
(10.8 µm) denotes the wavelength of emitted radiance;
(1.438
10
−2 mK), where h is the Planck’s constant (6.626
10
−34 Js), c is the velocity of light (2.997
10
8 m/s), and b represents Bolzmann’s constant (1.38
10
−23 J/K); the factor of 273.15 is used to convert the temperature from Kelvin (K) to Celsius (°C);
denotes the land surface emissivity.
The land surface emissivity is calculated in the following equation [
36]:
where
denotes the vegetation proportion calculated in the following equations [
9]:
where NDVI, NDVI
min, and NDVI
max refer to the value of NDVI, minimum NDVI, and maximum NDVI values at pixel level, respectively. NDVI is computed based on the red (SR_4) and near infrared bands (SR_5).
2.3. Urban Heat Island Intensity
This study relies on the constructed LST map to evaluate the UHI intensity (UHII). This index is generally used to quantify the temperature differences between urban and rural areas [
8]. UHII is calculated as follows [
37]:
where
TU refers to the LST of the
i-th pixel in the map and
TR denotes the mean LST of the surrounding rural areas.
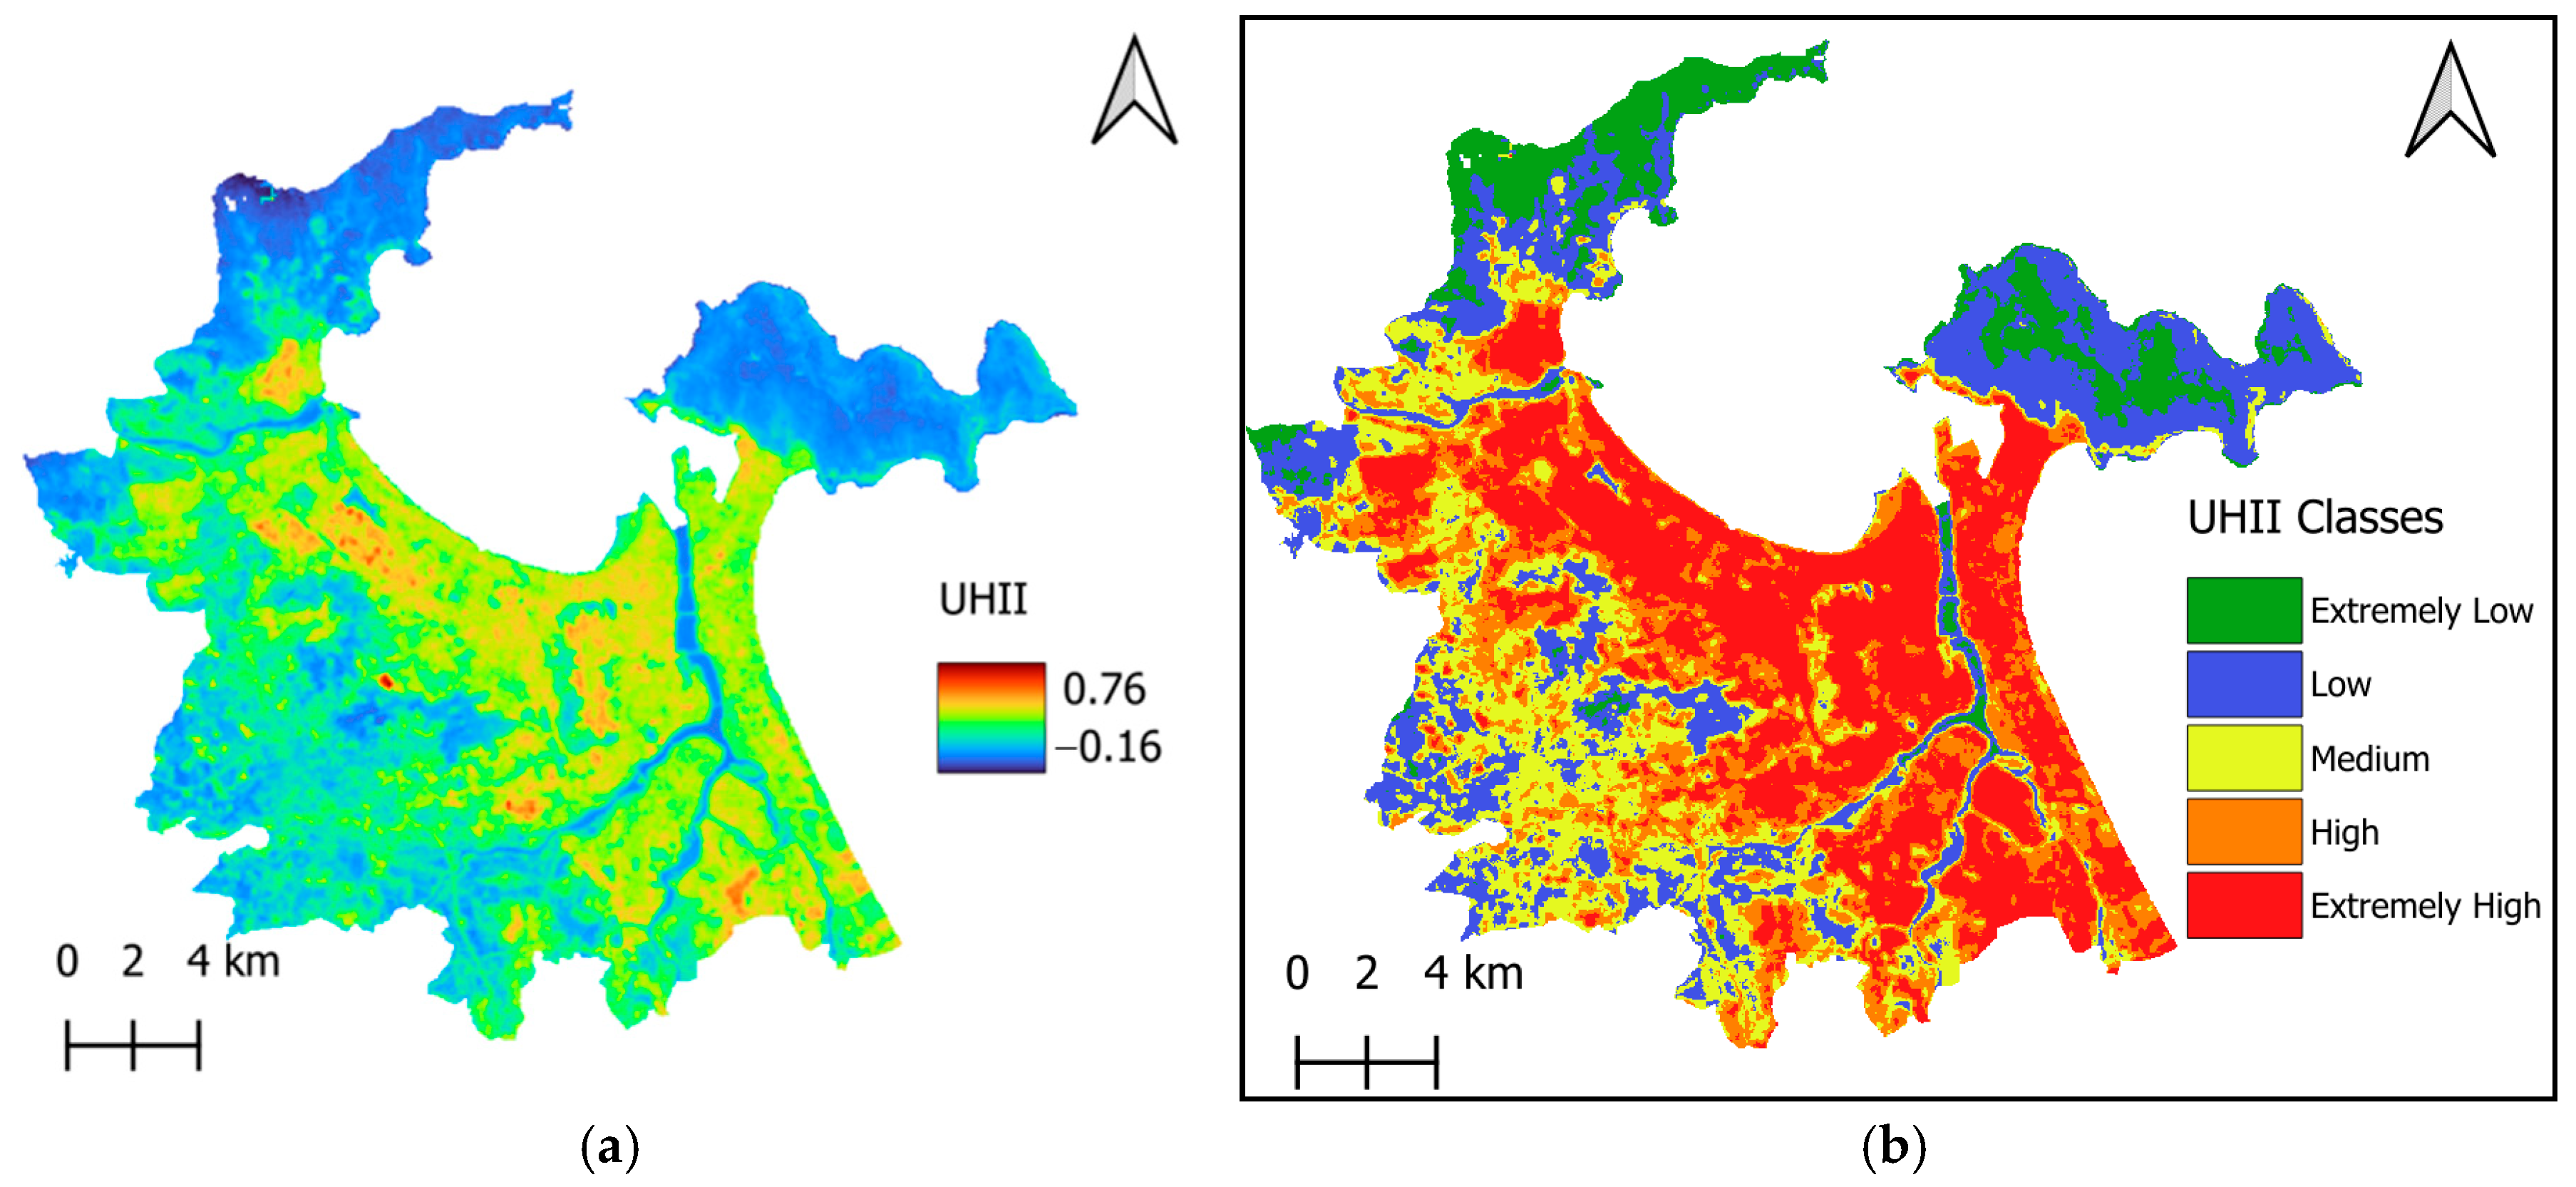
According to the computed UHII, a set of thresholds can be used to classify the intensity levels of the UHI effect [
37]. The detailed UHI level (UHIL) is provided in
Table 2. In general, the range of UHII is divided into five UHILs: extremely low (UHII ≤ 0), low (0 < UHII ≤ 0.1), medium (0.1 < UHII ≤ 0.2), high (0.2 < UHII ≤ 0.3), and extremely high (0.3 < UHII). The resulting maps of UHII and UHILs are presented in
Figure 3a,b, respectively. Evaluating the intensity of the UHI effect and categorization of UHII are crucial for urban planning. Based on the spatial distribution of UHILs, local authorities can identify areas severely affected by heat stress for targeted interventions and improvement of urban heat comfort.
2.4. Explanatory Variables
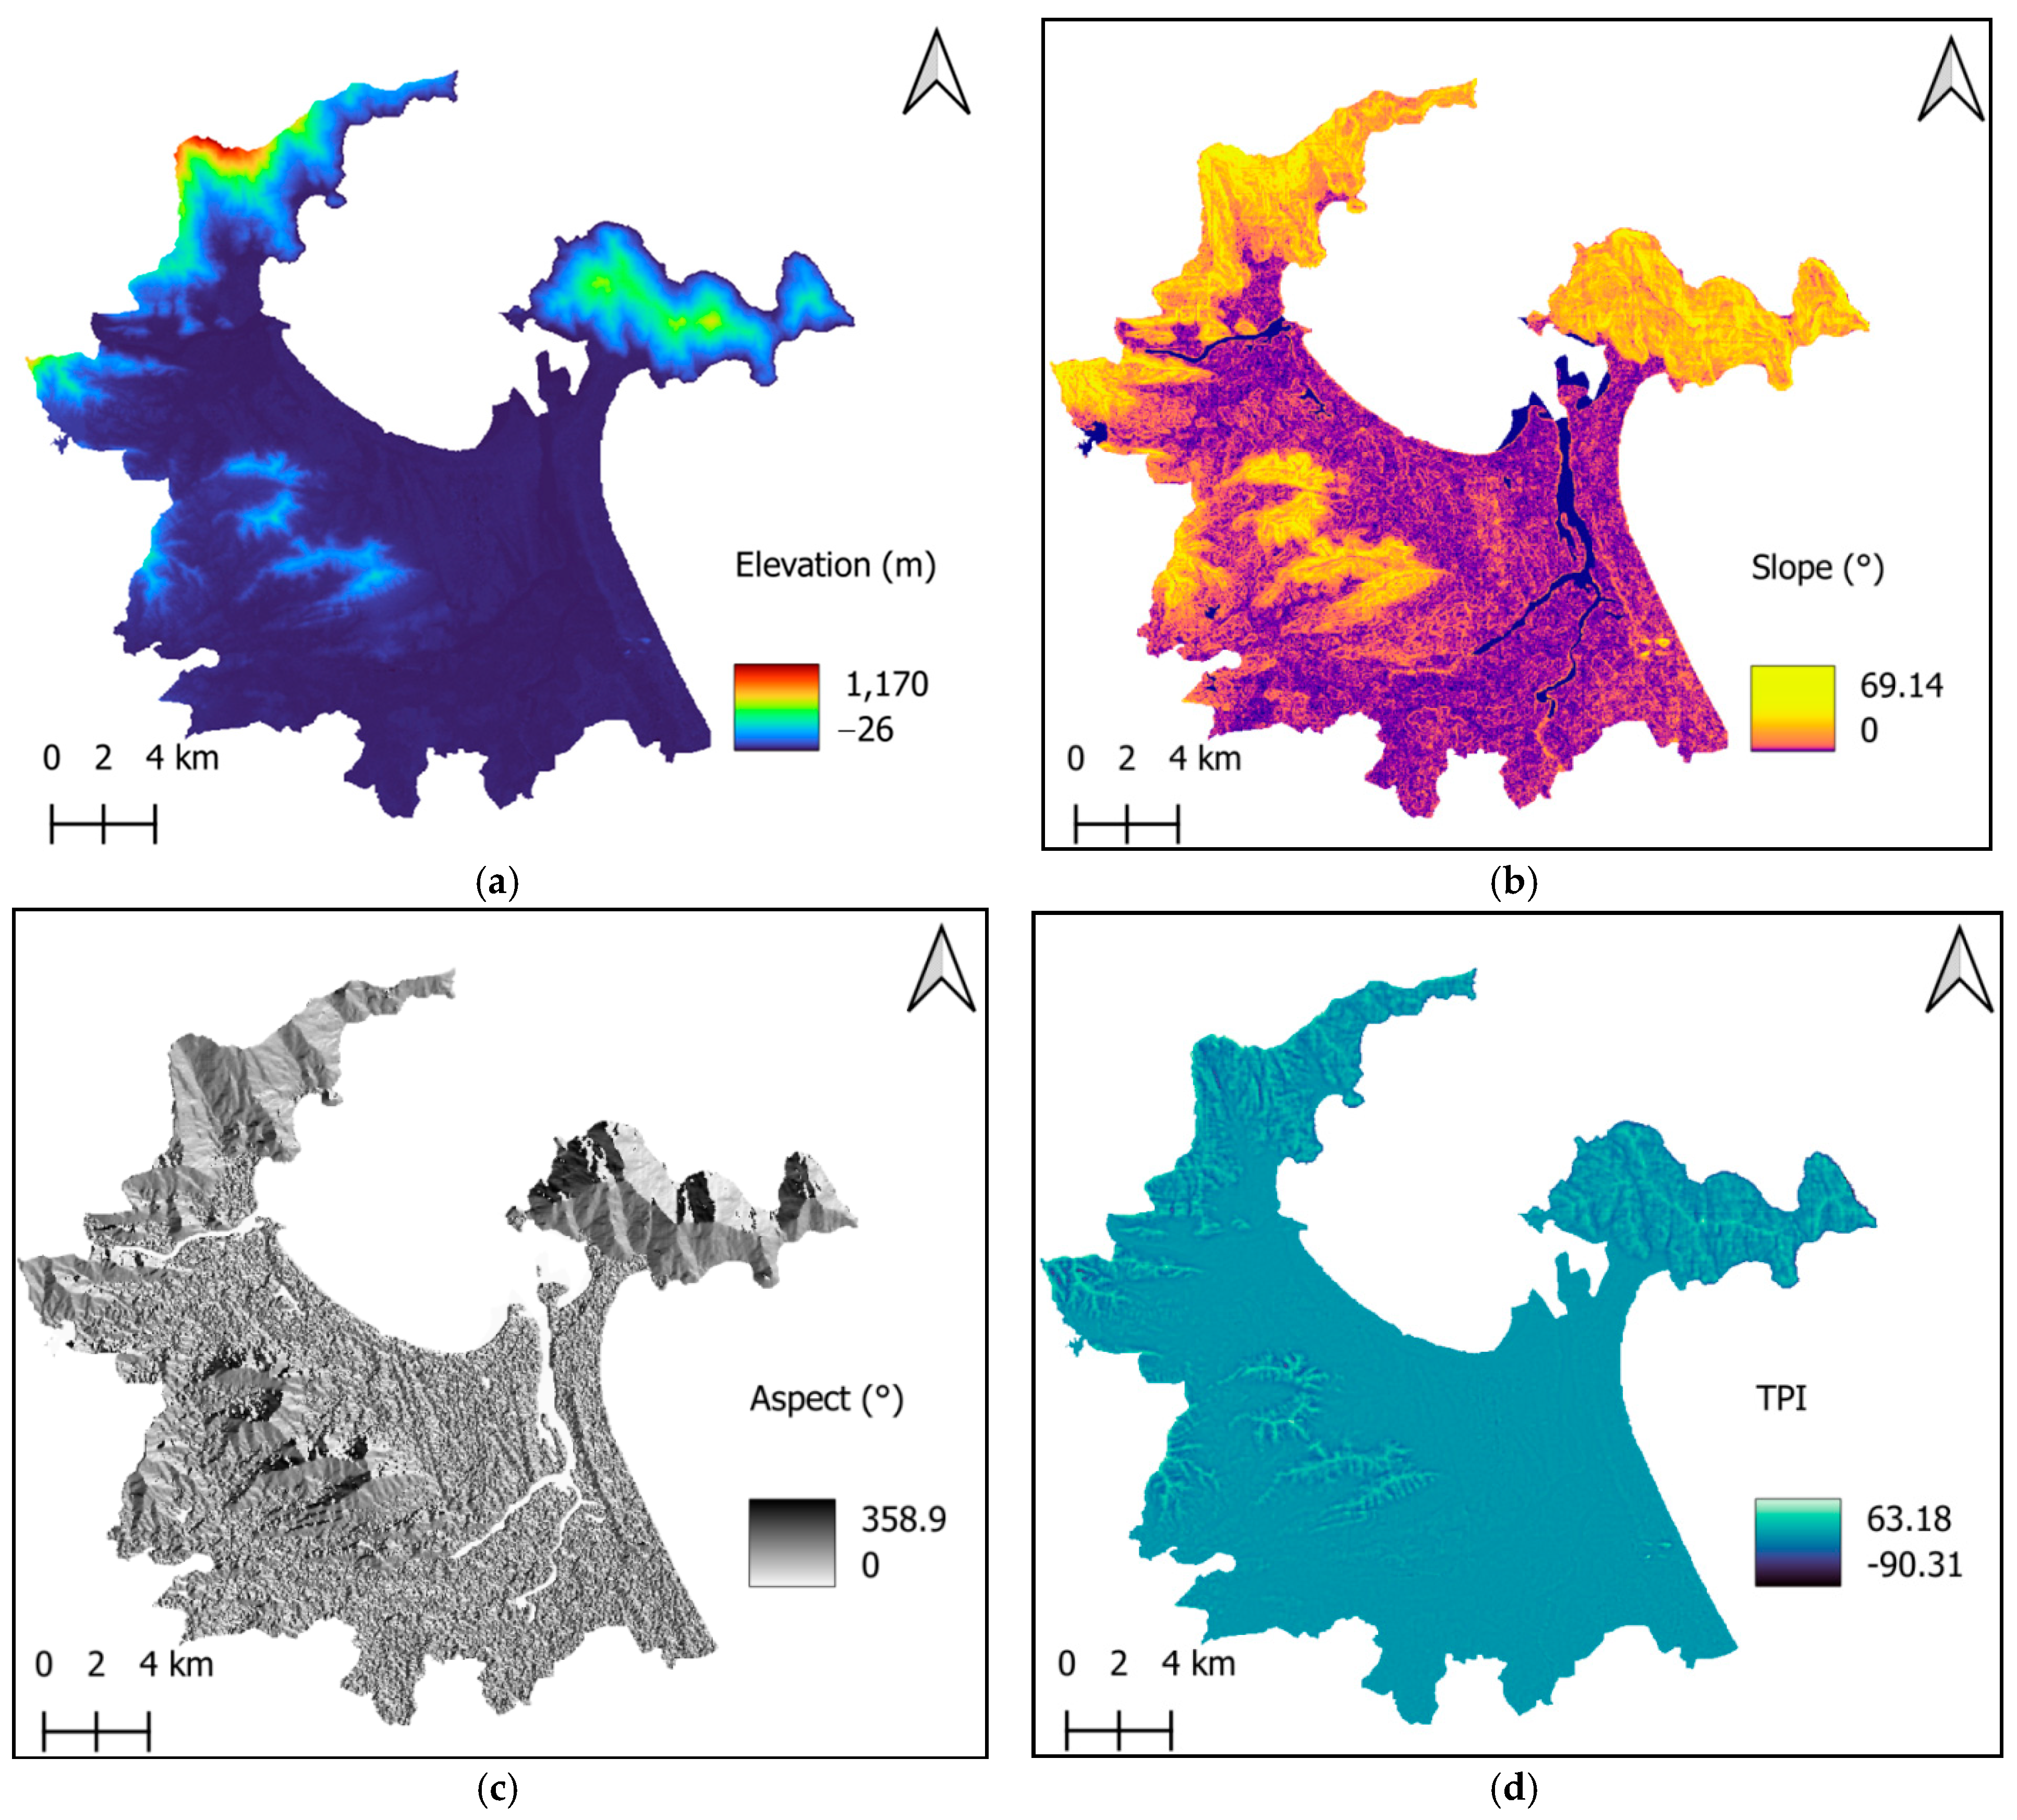
Explanatory variables play a crucial role in modeling the spatial variation in UHII. These variables encompass a range of factors that collectively influence thermal patterns within urban environments. Understanding these factors is essential for accurately predicting temperature variations. By combining these explanatory variables, robust data-driven models can be developed that capture the spatial and temporal variation in the UHI effect. Previous research has shown that topographic variables significantly influence surface temperature in urban areas [
38,
39]. Accordingly, this study employs elevation, slope, aspect, and the topographic position index (TPI) to describe the topographic characteristics of Da Nang’s urban center. The TPI evaluates the relative position of a point on the landscape in relation to the surrounding terrain; therefore, this feature is helpful for landform characterization [
40]. Slope, aspect, and TPI calculations utilize the terrain module of GEE and the elevation data provided by the NASA SRTM Digital Elevation dataset. The four topographic variables examined in this study are illustrated in
Figure 4a–d.
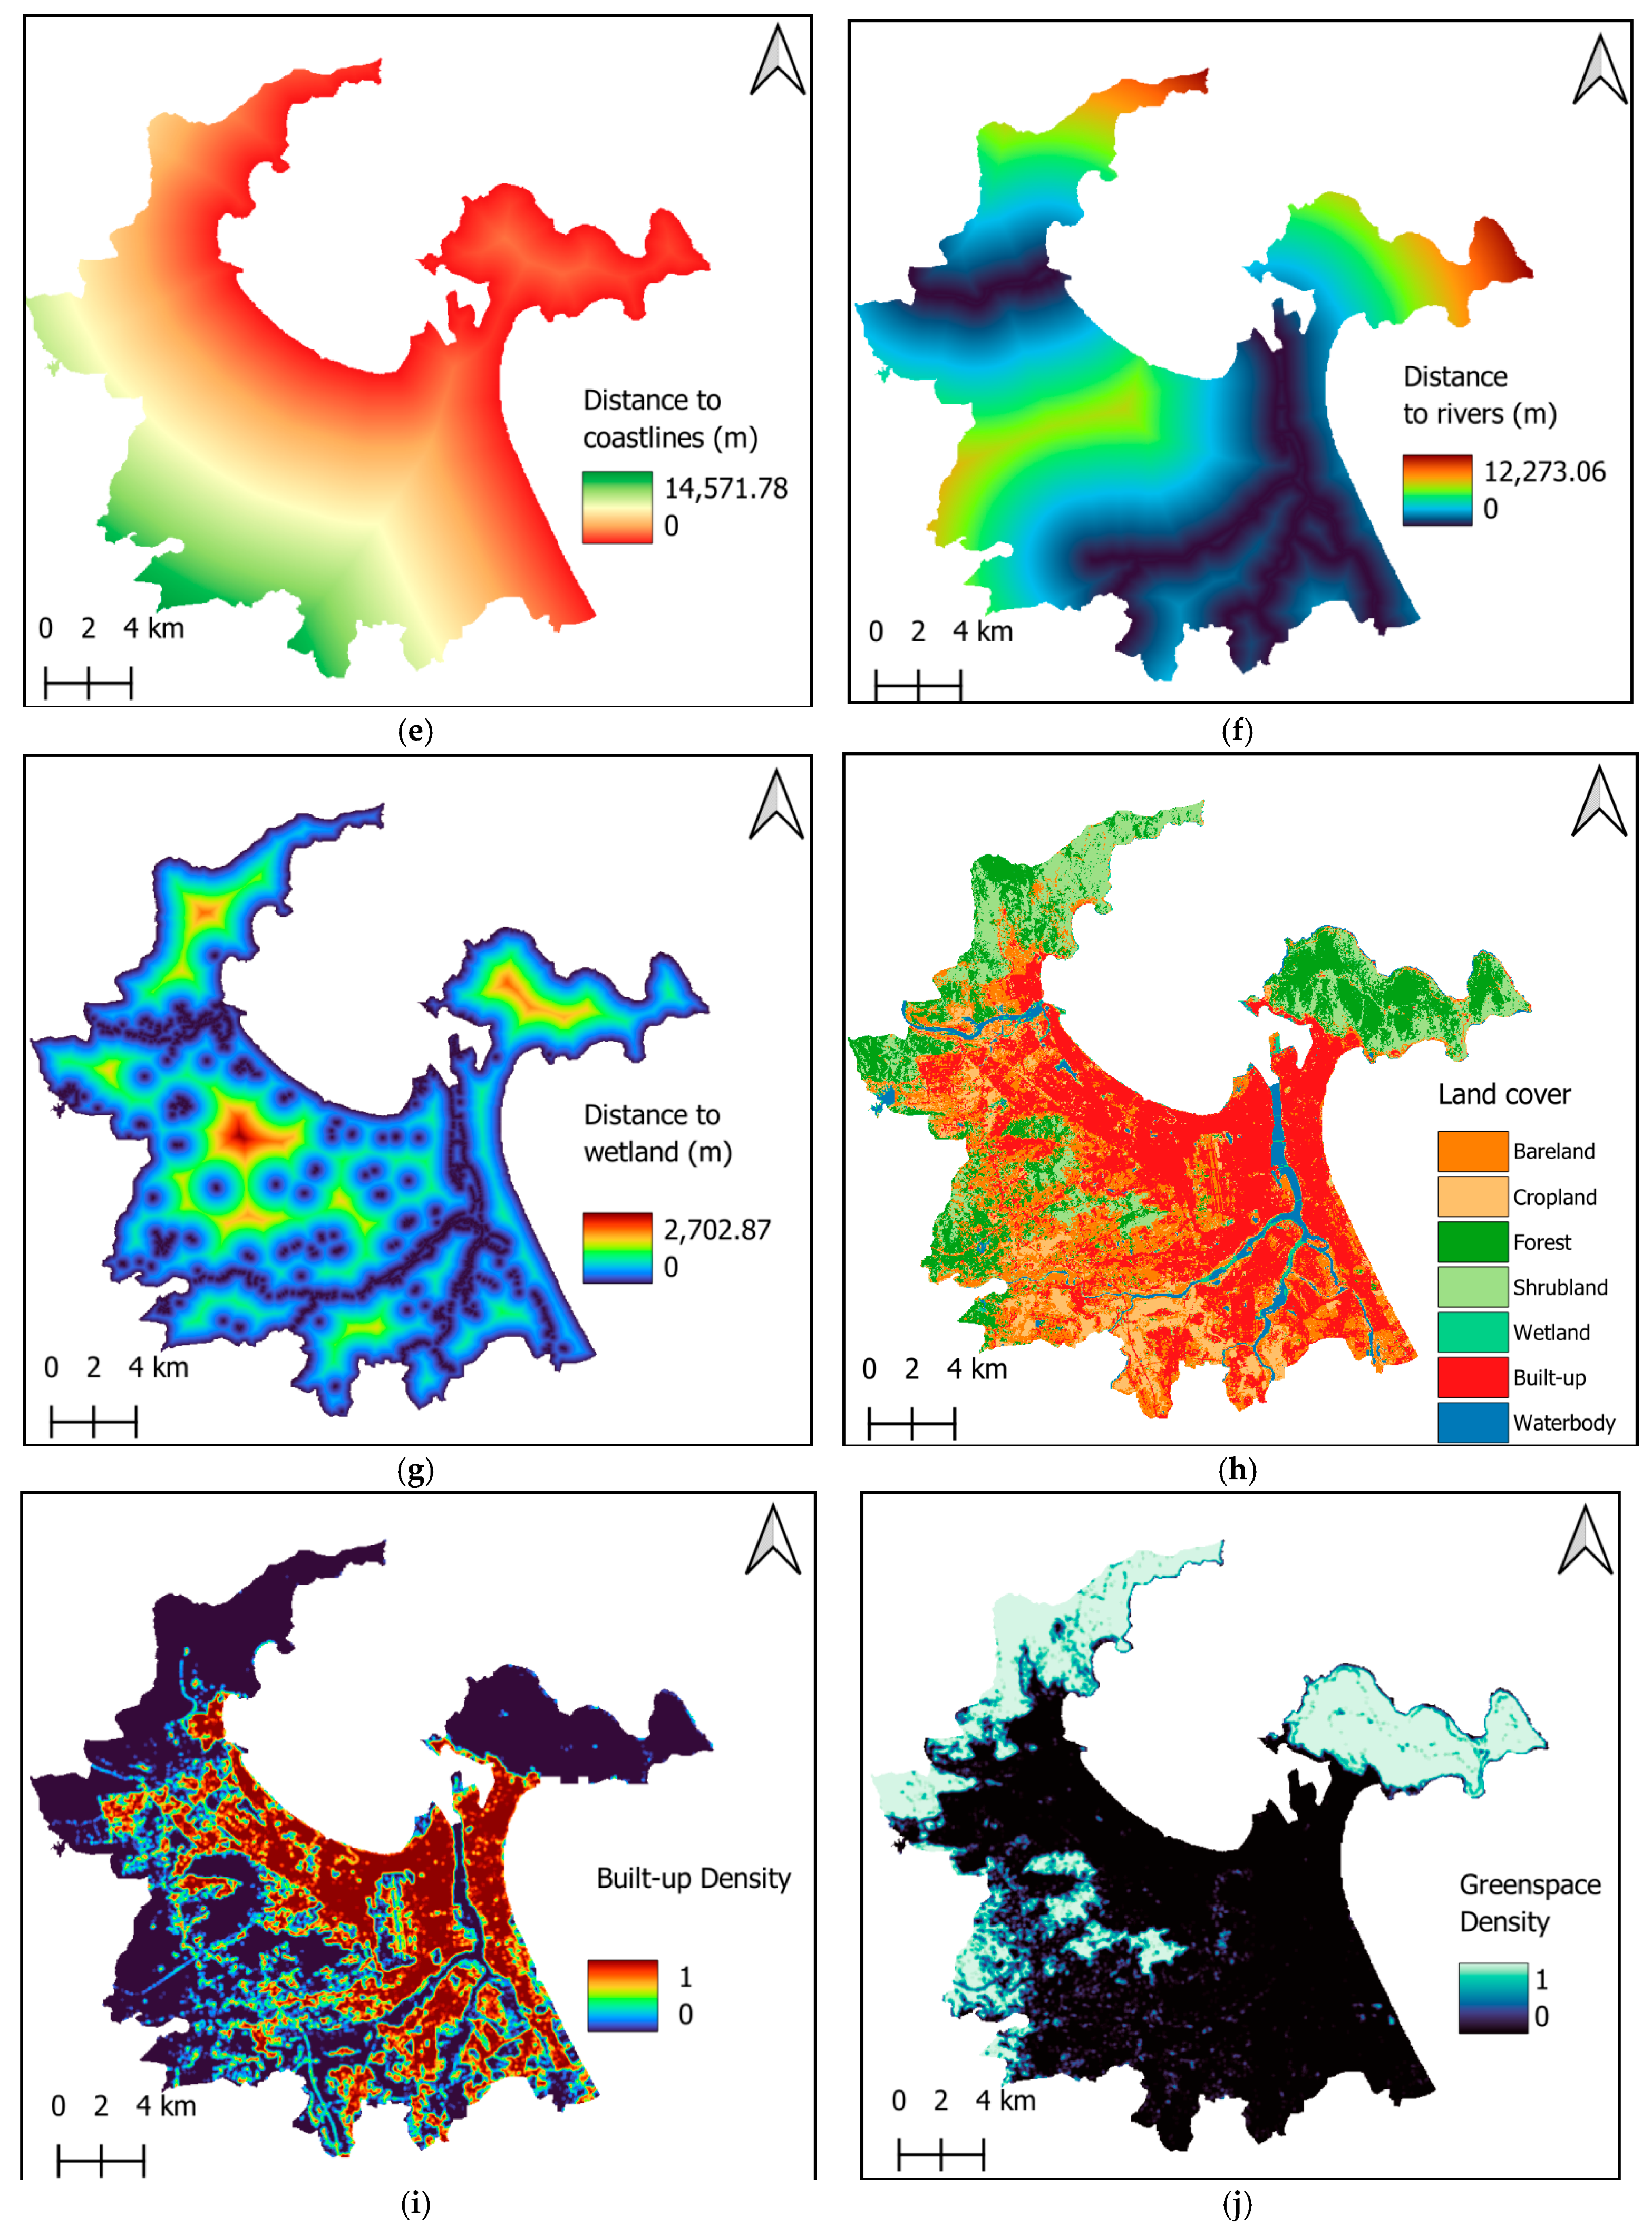
Waterbodies and wetlands have a significant cooling effect in urban areas [
41,
42,
43]. As a result, the distance of land from coastlines, rivers, and wetlands greatly influences LST. This study takes into account the distances to coastlines, rivers, and wetlands, as illustrated in
Figure 4e–g. Furthermore, land cover change serves as a major contributing factor to the UHI effect. Variations in the proportions of different land cover types have been shown to be the most influential factors affecting urban heat stress [
18]. The land cover map, shown in
Figure 4h, is compiled using classification results from the GLC_FCS30D global 30 m land cover change dataset. This map allows for the identification of pixels related to built-up areas, greenspaces, bareland, and waterbodies through equality filters. Morphological mean filters with a radius of 3 pixels are employed to generate the density maps. These data filtering operators are carried out in the GEE code editor.
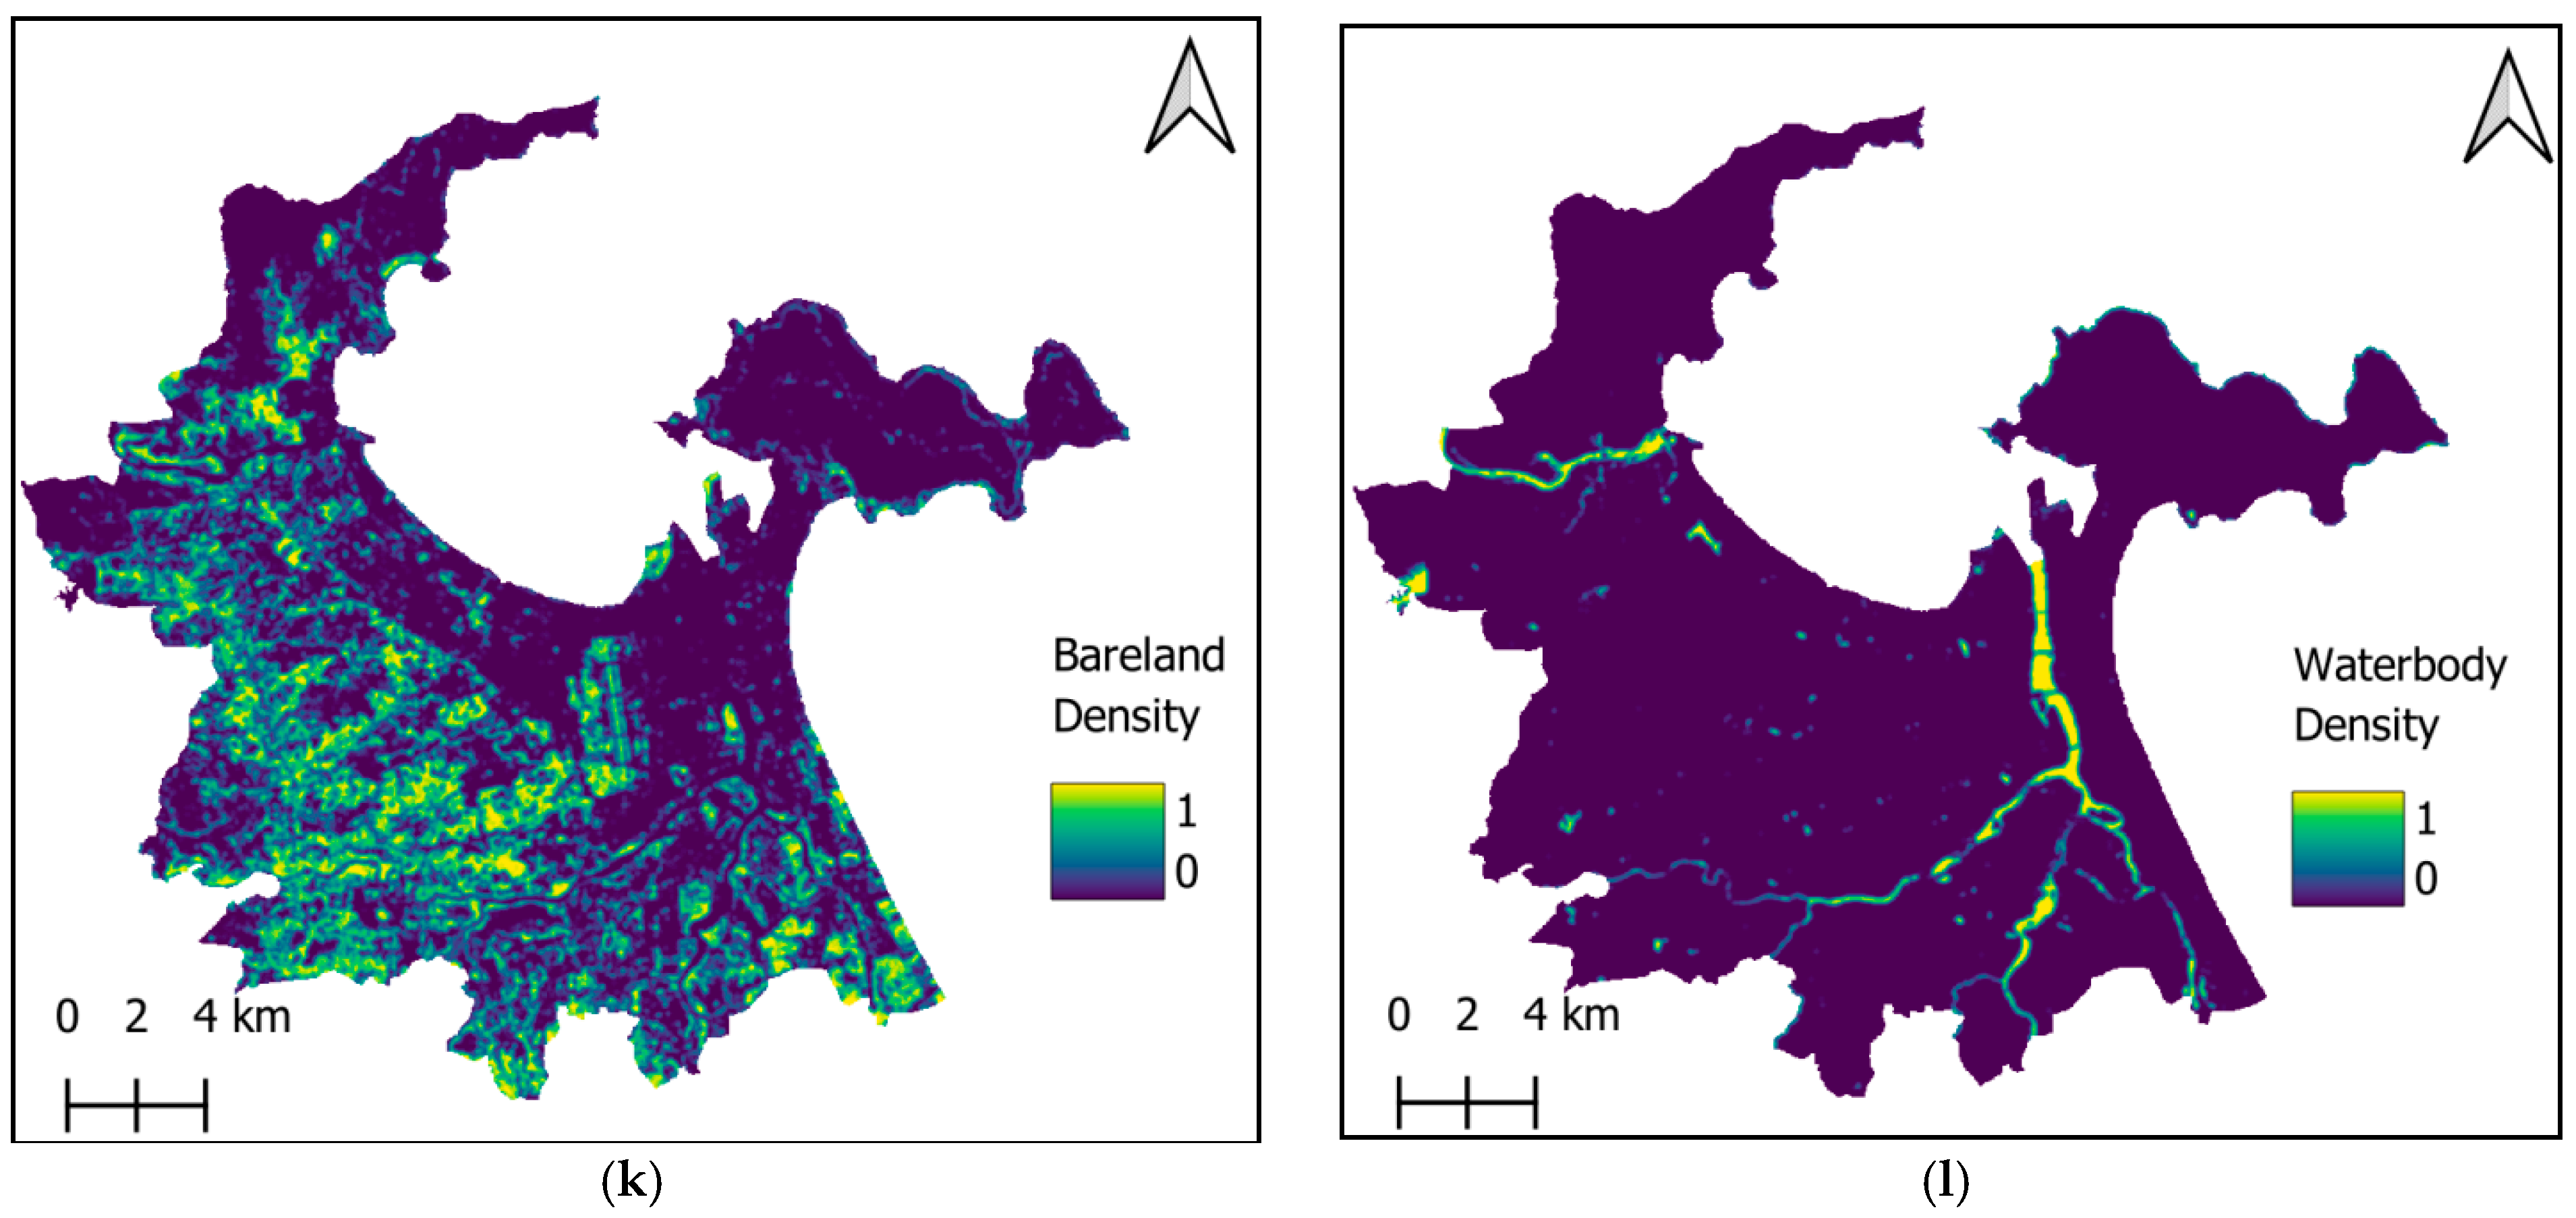
It is also noted that the variation in the density of built-up areas was proven to be the essential variable governing the UHI effect [
44]. Xiao et al. [
45] also confirmed that the cooling effects of green areas in urban environments were significantly influenced by the density of greenspace. Kafy et al. [
46] also pointed out that the decrease in green cover has emerged as one of the most significant factors contributing to the increase in LST. Moreover, the spatial distribution of heat islands was shown to be dependent on the transformation of bareland to impervious surface [
47]. Hence, this study relies on the densities of built-up areas (
Figure 4i), greenspaces (
Figure 4j), bareland (
Figure 4k), and waterbodies (
Figure 4l) to describe the characteristics of the urban landscape.
2.5. Machine Learning Approaches
2.5.1. Natural Gradient Boosting Machine
Natural gradient boosting machine (NGBoost), introduced in [
48], represents an innovative machine learning framework that integrates gradient boosting with natural gradient descent. Based on advanced gradient boosting methods, NGBoost is capable of effectively capturing the complexities of spatial relationships between the intensity of UHI and its influencing factors. Typically, gradient boosting techniques involve the sequential training of several base learners, which together form an additive ensemble. Each learner focuses on reducing the residual error estimated by the ensemble of previously trained learners. After training, the output from each learner is modified by a learning rate and incorporated into the existing ensemble [
49].
The learning process of NGBoost estimates the parameters of a probability distribution
, where the input feature is represented by
and the target output is denoted as
y. For its implementation, NGBoost requires specification of a base learner, a parametric probability distribution, and a scoring rule. Decision trees are often employed as the base learner in gradient boosting machines [
50]. During the training phase of the model, logarithmic score functions can be used as the scoring rule, as follows:
For nonlinear function approximation tasks, a normal distribution is utilized for probabilistic regression. Given the training dataset
, the parameters of NGBoost are initially generated as follows [
49]:
where
N is the number of the training samples.
For each decision tree, the model computes the natural gradient, allowing for updates to the model parameters
. NGBoost combines a multiparameter boosting algorithm with natural gradient techniques to estimate and adapt the model’s parameters according to the observed data. Hence, this approach enables the ensemble to achieve efficient optimization and robustness, especially in situations involving high-dimensional or correlated feature spaces. Although the effectiveness of NGBoost in multivariate data modeling has been demonstrated in previous studies [
25,
51,
52], the application of this method in spatial modeling of the UHII has not yet been investigated.
2.5.2. Deep Neural Network Regressor
The deep neural network regressor (DNNR) is a powerful tool for nonlinear function approximation. These networks consist of multiple layers of interconnected nodes, or neurons, which process input data through nonlinear activation functions [
53]. The architecture typically includes an input layer, one or more hidden layers, and an output layer. Each neuron in a layer receives inputs from the previous layer, applies a weighted sum followed by a nonlinear activation function, and transmits the result to the next layer. The ability of DNNR models to learn complex patterns makes them particularly suitable for tasks where relationships between variables are not linear. In regression problems, DNNRs can model intricate dependencies and interactions among features, leading to improved prediction accuracy compared to traditional linear models. Due to their advantages, these deep learning models are suitable for spatial modeling of the UHI effect [
54,
55].
2.6. Shapley Additive Explanations (SHAP)
Shapley additive explanations (SHAP) [
56] is a framework designed to interpret the contributions of individual input features to a model’s predictions. It is inspired by cooperative game theory, where each feature’s contribution is quantified as a SHAP value. This value reflects how much each feature influences the output compared to a baseline prediction. The additive nature of SHAP ensures that the total prediction can be expressed as the sum of the expected value and the contributions from all features. Therefore, this method is capable of providing clear and intuitive interpretations of the impact of each explanatory variable on the model’s output.
In the context of predicting the intensity of the UHI effect, SHAP helps identify which features significantly impact predictions, such as urban landscapes, topographical features, and land cover types. The analysis results can be presented by impact plots, which visualize overall feature importance and detail contributions for specific instances. Notably, positive SHAP values show that a feature contributes to an increase in the prediction, whereas negative values indicate a decrease. This information enables the identification of features that have a significant impact on the model’s output. Accordingly, SHAP has been recently employed for evaluating the importance of explanatory variables used for predicting spatial distributions of UHI [
57], estimating LST [
58], modeling urban heat resilience [
59], and examining the association between UHI and urban form factors [
60].
2.7. Machine Learning-Based Prediction of Land Cover
Notably, LST correlates with land cover changes [
37]. Therefore, significant transformations, such as the conversion of vegetation and waterbodies into impervious surfaces, strongly affect spatial variations in thermal stress in urban environments. It is apparent that urban areas, characterized by a higher proportion of impervious surfaces, typically exhibit elevated LST levels. Therefore, the changes in the distribution of different land cover types represent significant influences on the intensity of the UHI effect. By predicting future land cover changes and examining their relationship with UHI, it is possible to forecast the evolution of UHII in the study area.
Cellular automata (CA) is a widely used method for simulating and predicting land cover changes. The CA model determines the state of each cell in a grid based on the previous states of neighboring cells, following specific transition rules [
61]. This model effectively simulates future land cover by analyzing historical patterns. Moreover, an artificial neural network (ANN) can be applied to model transition potential matrices used for land cover projections. This study relies on the MOLUSCE plugin [
62] in the open-source QGIS software (Version 3.34.10) to model and predict land cover change. To forecast land cover maps, data from 2010, 2015, and 2020 were utilized. In MOLUSCE, an ANN model can be trained to predict transition potential for land cover alterations. To assess the accuracy of the predicted land cover maps, kappa statistics were calculated in the validation stage.
2.8. Performance Assessment Indices
This study formulates the prediction of the UHI effect’s intensity as a regression analysis task. The aim is to generalize a mapping between UHII and its explanatory variables. To accomplish this, the research utilizes advanced machine learning algorithms, specifically NGBoost and DNNR. Evaluating the performance of these models is essential to identifying the most appropriate model for estimating the UHII. This study employs root mean square error (RMSE), mean absolute error (MAE), and the coefficient of determination (R
2). The calculations for these metrics are provided as follows:
where
ti and
yi are the actual and estimated UHII values of the
ith sample, respectively.
N denotes the total number of samples in the dataset.
RMSE is a key metric for evaluating the performance of machine learning-based regressors. It measures the average magnitude of prediction errors by calculating the differences between predicted and actual UHIIs, with a lower RMSE indicating better prediction accuracy. RMSE is sensitive to larger errors, making it useful to signify large deviations in the results. MAE is a straightforward measure of prediction accuracy. This index calculates the average absolute differences between predicted values and actual observations of UHII, providing a straightforward measure of prediction accuracy. MAE treats all errors equally, making its outcomes less sensitive to outliers compared to RMSE. In addition, R2 is also a widely used statistical measure for evaluating the performance of regressors. This index exhibits the proportion of the variance in the target variable that is explained by the model. R2 values range from 0 to 1, where a value of 0 indicates a totally incapable model, while a value of 1 signifies a perfect one. The R2 index provides a clear indication of how well the model fits the data and allows for easy comparison between different models.
3. Proposed Machine Learning Framework for Predicting UHII
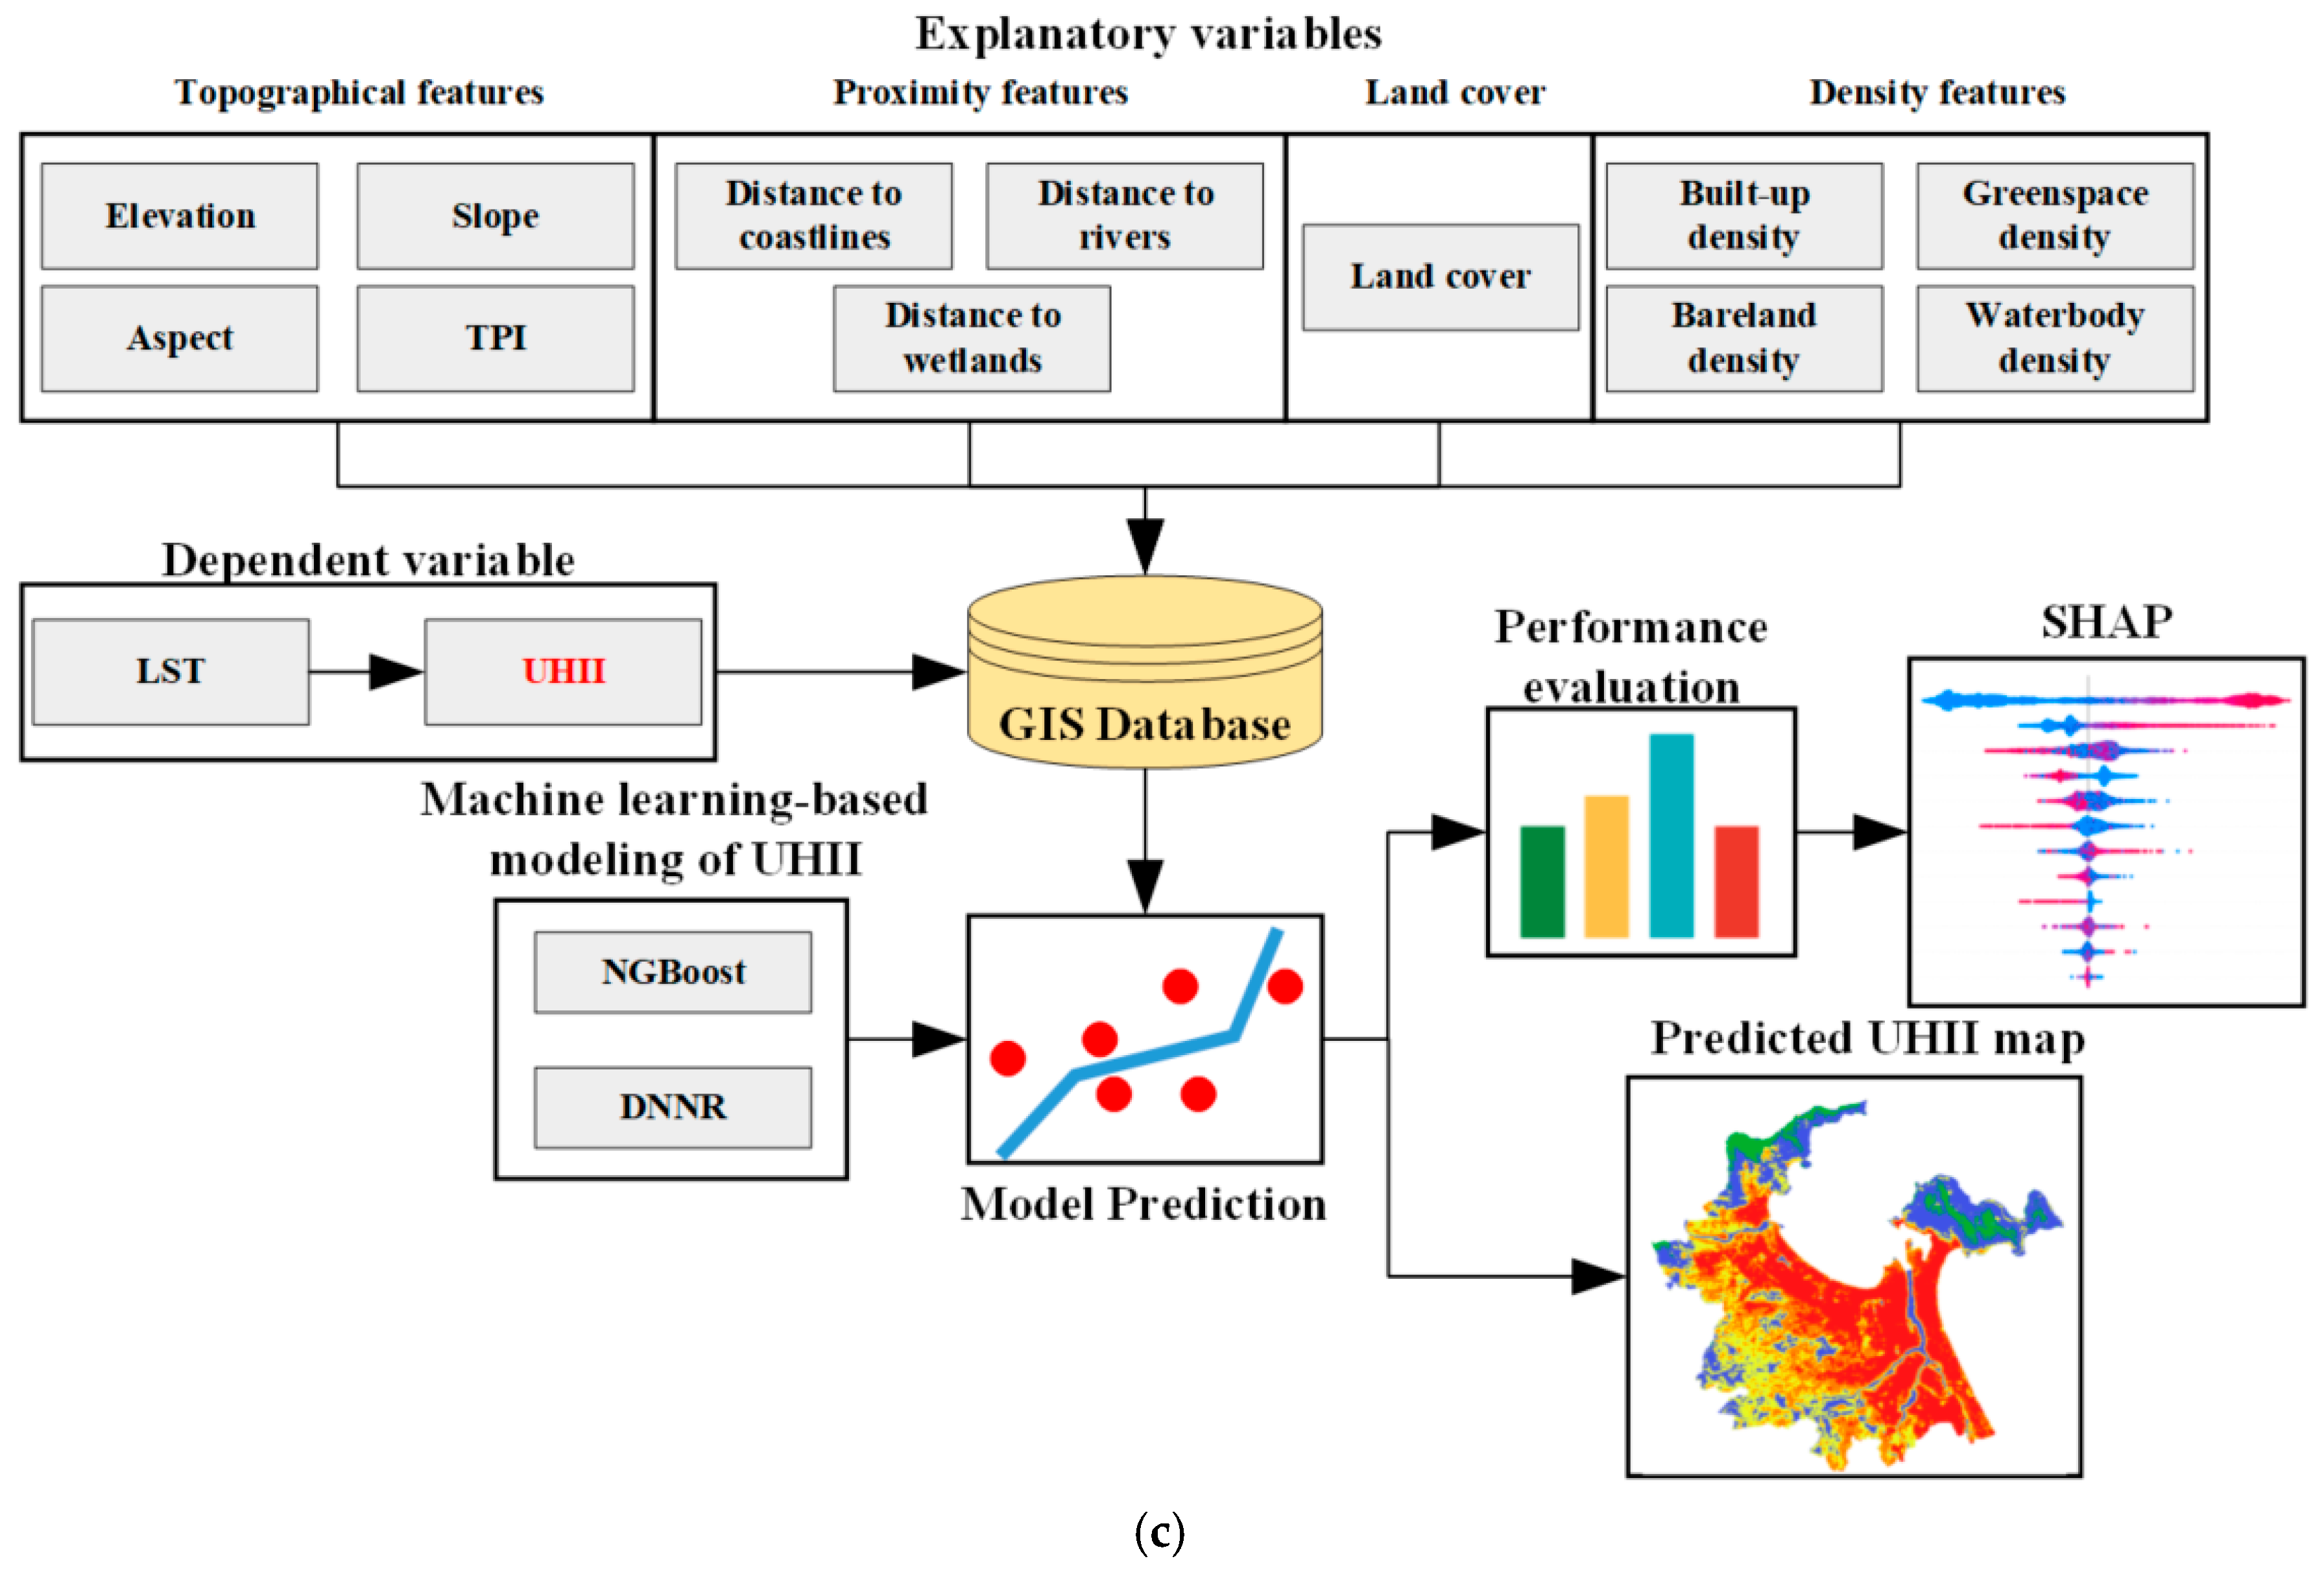
This study introduces an integrated framework for estimating the spatial variation in UHII through the integration of machine learning, geospatial analysis, and remote sensing approaches. The framework considers a comprehensive set of influential variables, including elevation, slope, aspect, TPI, distances to coastlines, rivers, and wetlands, together with land cover types, built-up density, greenspace density, bareland density, and waterbody density. To generate density maps showing the study area for 2020, land cover maps derived from the GLC_FCS30D global 30 m land cover change dataset are utilized. The analysis employs equality filters and morphological mean filters with a radius of three pixels to obtain the final density maps (refer to
Figure 5a). These image filtering operations are executed using the Google Earth Engine (GEE) code editor.
The equality filter in GEE is a tool used to filter an image dataset based on whether specific properties of features match a given value. Herein, the encoded values of built-up, vegetation, bareland, wetland, and waterbody are used to extract the pixel locations of these land covers. In addition, the morphological mean filter GEE is an image processing tool that is widely used for feature extraction in spatial data. This operation basically computes the mean value within a specified neighborhood.
Moreover, to forecast land cover in 2040, the transformation of land cover from 2010 to 2015 serves as the training samples for a combined cellular automata and artificial neural network (CA-ANN) approach (refer to
Figure 5b). This trained model is subsequently applied to predict land cover for 2020. The predictive accuracy of the CA-ANN framework is assessed by comparing actual land cover data with simulated results from 2020. Following this evaluation, the established methodology is utilized to project land cover changes for 2040 in Da Nang’s urban center. The MOLUSCE plugin within the open-source QGIS software is employed to conduct the land cover change simulations.
The proposed machine learning framework for spatial modeling of UHII is demonstrated in
Figure 5c. This framework employs NGBoost and DNNR to elucidate the relationship between UHII and its explanatory variables. This framework integrates diverse data sources and advanced computational techniques, thereby providing a robust tool for analyzing and predicting variations in UHII. The primary goal of this analysis is to identify which algorithm achieves the highest accuracy in mapping UHII in the study area. Notably, NGBoost is implemented using the Python toolbox (Version 3.10) developed by Duan et al. [
63]. The DNNR model is built in Python with the assistance of the Scikit-learn library [
64]. Hyperparameters for all machine learning models are determined through cross-validation processes [
65]. Additionally, the development and operation of these models are performed in Microsoft’s Visual Studio for Python programming environment. To assess prediction performance quantitatively, the metrics of RMSE, MAE, and R
2 are employed.
Furthermore, the framework incorporates SHAP to evaluate the influence of various features on UHII estimation. By calculating SHAP values, this analysis yields critical insights into the importance of each explanatory variable affecting UHII. Utilizing the aforementioned density maps alongside other influential factors, a GIS database is established to train and validate the proposed framework. A dataset comprising 12 influencing factors and 5000 randomly sampled data points from the study area is generated. This dataset is then divided into two subsets: a training set consisting of 70% of the total samples and a testing set comprising the remaining 30%. This training-to-testing ratio is a widely accepted and reliable approach for constructing and validating machine learning models [
66,
67]. The data partition in this study ensures that the models are trained on a substantial portion of the data (3500 samples) while reserving sufficient data (1500 samples) to reliably evaluate their performance on unseen cases.
4. Prediction Results
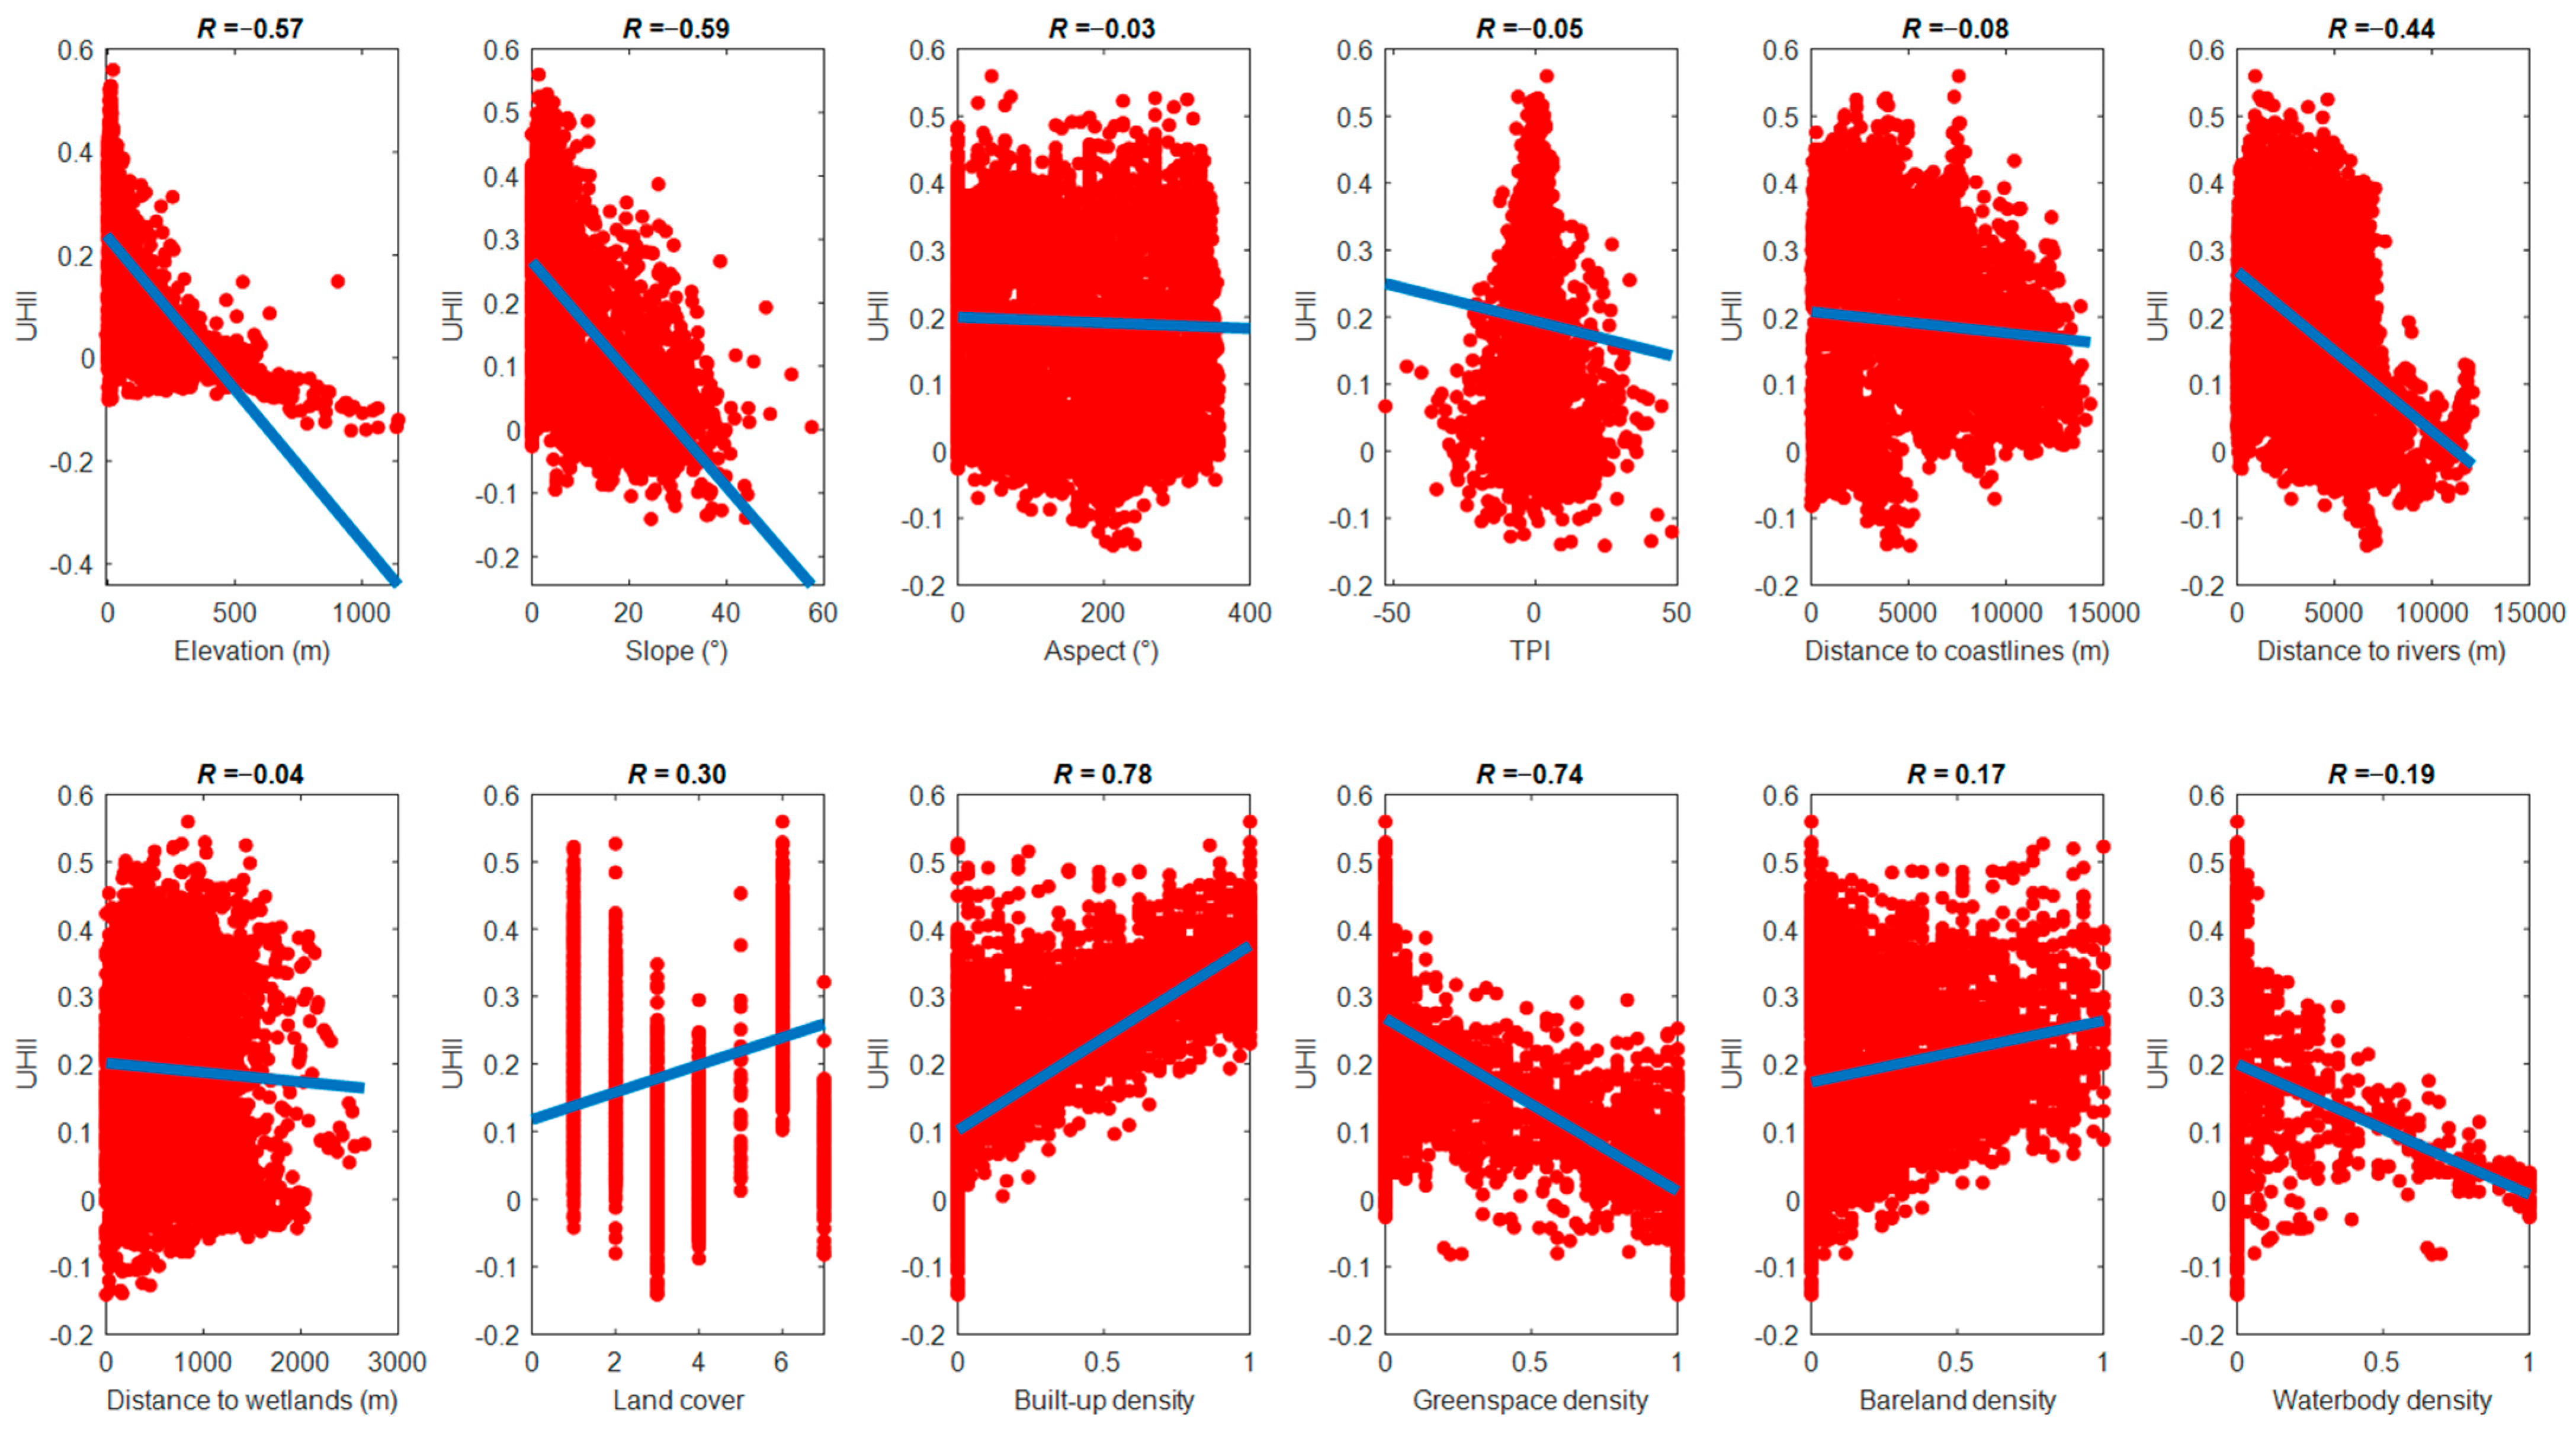
Based on the collected GIS dataset, analysis based on linear correlation is used to examine the relationships between various factors and UHII. This approach preliminarily assesses the associations and the quantification of how changes in these factors may influence UHII in the study area. Correlation plots in
Figure 6 show the linear relationship between UHII and its influencing factors. Herein, the Pearson correlation coefficient (
R) is calculated to assess the linear relationships between UHII and each explanatory variable. The results of the Pearson correlation analysis demonstrate significant linear associations between various land use and environmental factors and UHII in the study area. The strongest positive correlation was found between built-up density and the target variable, with an
R value of 0.78. This result implies that impervious surface coverage significantly contributes to the increase in urban LST by absorbing and retaining heat, leading to elevated temperatures in densely built environments.
As built-up density increases, so does the potential for higher UHII, intensifying heat stress in urban areas. The strongest negative correlation occurred between greenspace density and the target variable, with a Pearson correlation coefficient of −0.74. This finding indicates that as greenspace density increases, temperatures decrease, which highlights the cooling effect of vegetation in the urban areas of Da Nang. Notable negative correlations with UHII are found with elevation (R = −0.57), slope (R = −0.59), and distance to rivers (R = −0.44). The correlations of waterbody density with UHII (R = −0.19), distance to coastlines (R = −0.08), TPI (R = −0.05), and distance to wetlands (R = −0.04) are also negative, indicating the cooling effects of these variables. The linear correlation between bareland density and UHII of 0.19 demonstrates that there is a weak positive relationship between the two variables. This suggests that as bareland density increases, there is a slight tendency for UHII to also increase.
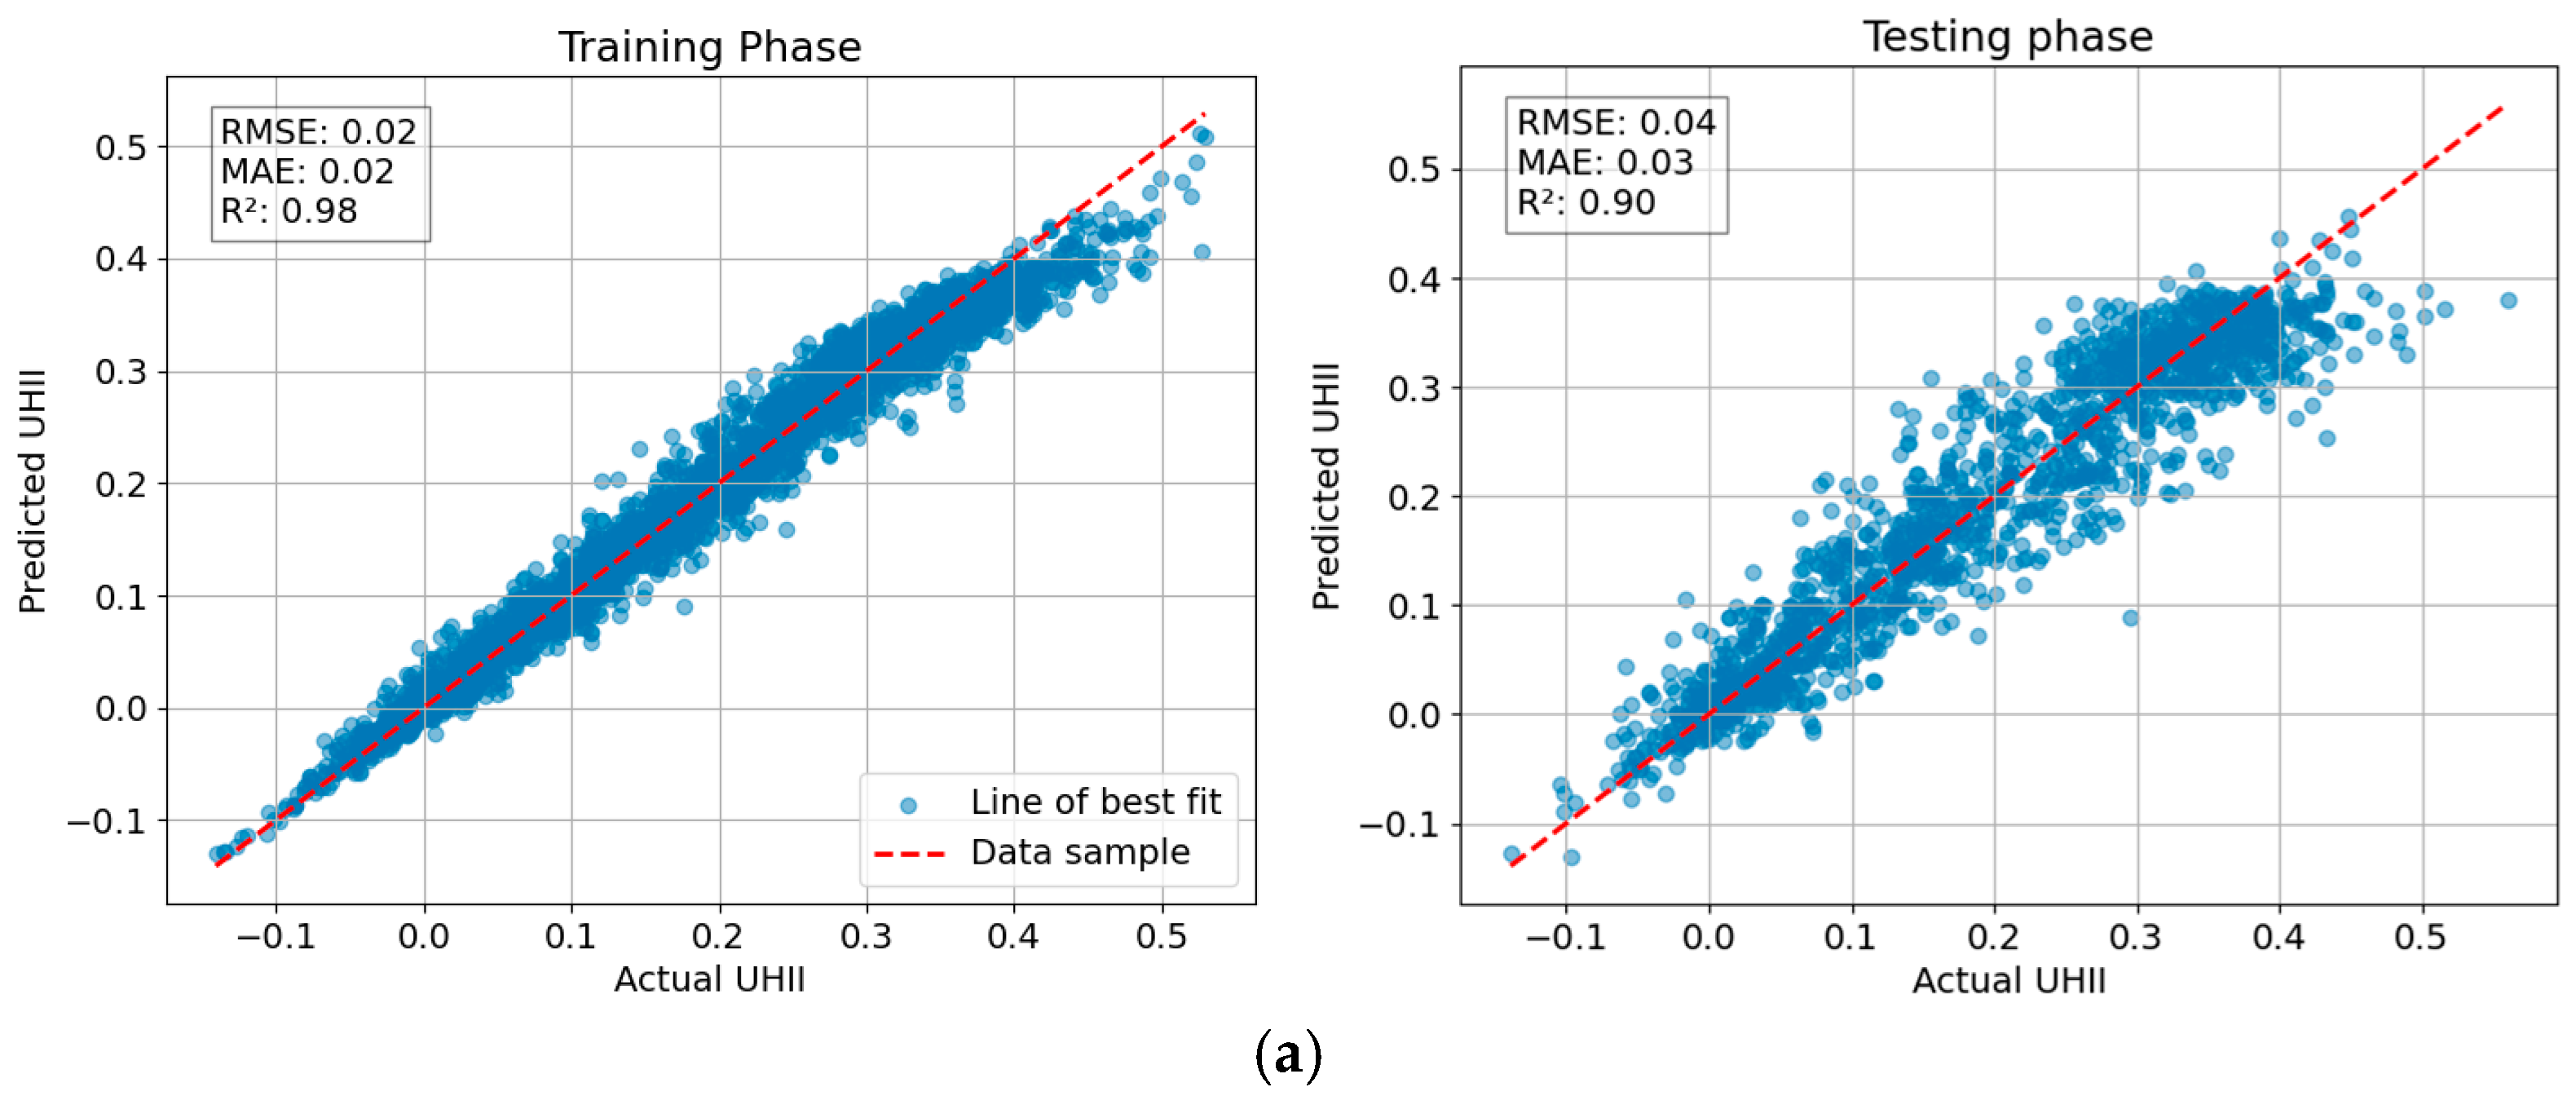
The prediction accuracy of NGBoost and DNNR is summarized in
Table 3 and
Figure 7. The prediction performance of the NGBoost model demonstrates strong results across both training and testing phases. In the training phase, the model achieved low RMSE and MAE values of 0.02, indicating a high level of accuracy in its predictions. The R
2 value of 0.98 further emphasizes the model’s effectiveness, suggesting that it explains 98% of the variance in the training data. In the testing phase, the model maintained good performance, with an RMSE of 0.04 and an MAE of 0.03. Although these metrics indicate a slight increase in error compared to the training phase, the R
2 value of 0.90 still reflects a robust ability to predict UHI intensity, explaining up to 90% of the variance in the test data.
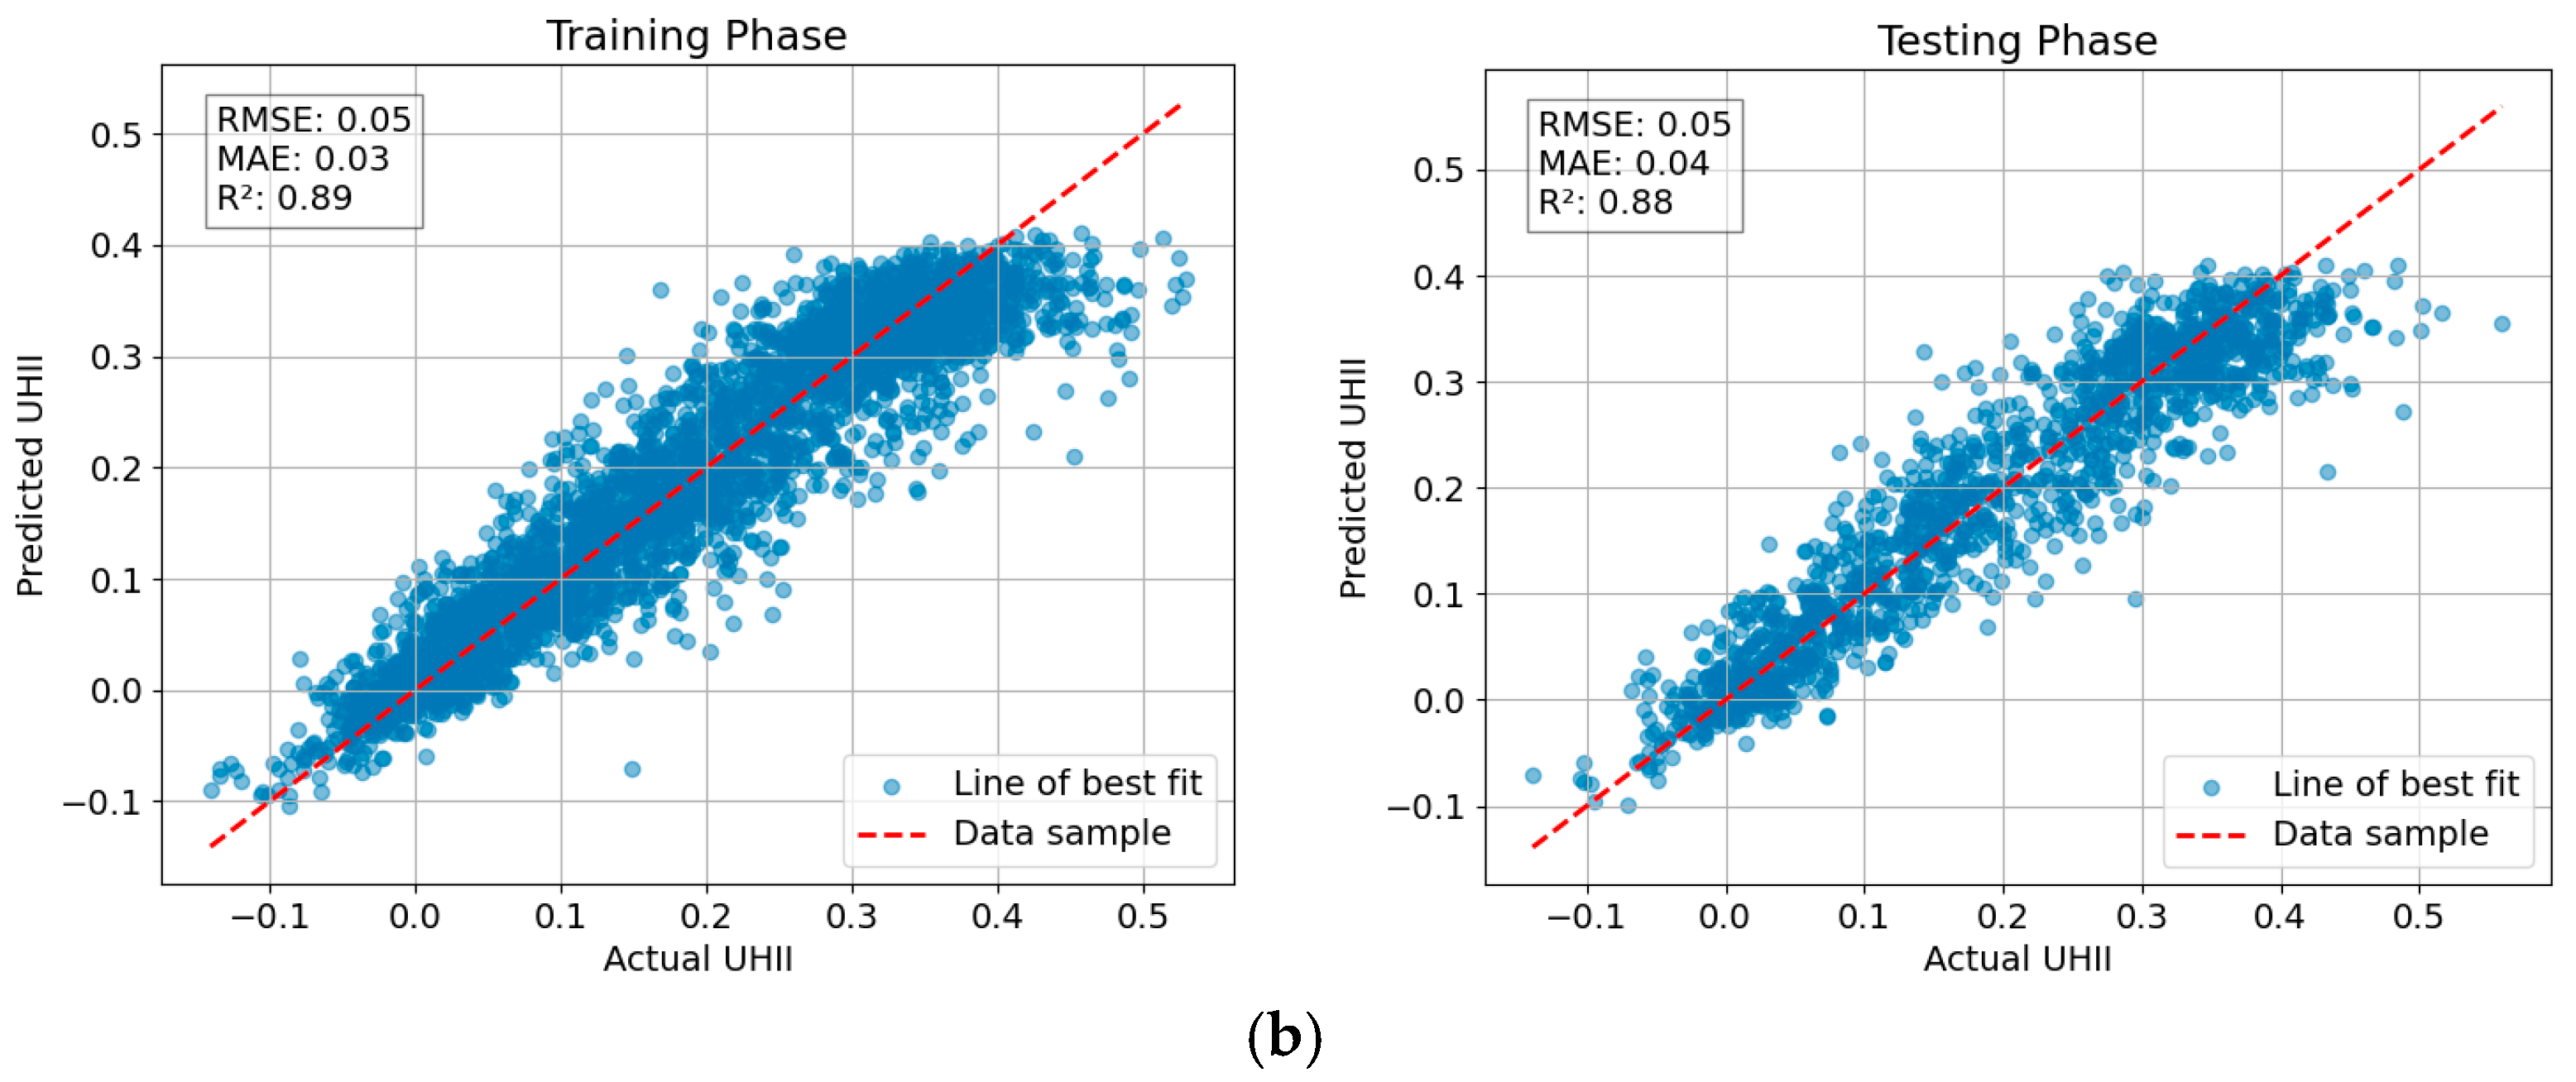
The performance of the NGBoost model in predicting UHII outperforms the DNNR model across various metrics during both training and testing phases. In the testing phase, DNNR (with an RMSE of 0.05) are inferior to NGBoost. Based on the R2 value, DNNR can only explain 88% of the variance in the UHII. Overall, these results illustrate that NGBoost consistently delivers better predictive accuracy than DNNR in modeling UHI intensity.
Furthermore, sensitivity analysis plays a vital role in understanding how various features impact UHII, particularly in the context of rapid urbanization. This study relies on SHAP analyses to investigate each feature’s contribution to model predictions. The analysis outcome can yield insights into the influence of different environmental and urban factors on the UHI effect in Da Nang’s urban center. Since NGBoost demonstrates superior performance in spatial modeling of the target variable, the machine learning model is combined with SHAP to provide a clear ranking of feature importance. It is important to note that NGBoost utilizes TreeSHAP for calculating SHAP values, which enables fast computation of feature contributions [
68,
69].
SHAP analyses can be visually represented via an impact plot, as shown in
Figure 8. These plots serve as effective visualization tools for interpreting how individual variables contribute to NGBoost predictions. Drawing from cooperative game theory, particularly Shapley values, these plots provide insights into the influence of different input variables on machine learning model outputs. SHAP values quantify each feature’s contribution to UHII predictions for a specific location in the study area. The SHAP value for an explanatory variable reflects its average contribution across all potential combinations of the variables.
The SHAP analysis results reveal that built-up density emerges as the most influential variable affecting UHII, followed by bareland density, distance to coastlines, greenspace density, and other factors. The presence of both built-up density and greenspace density among the most significant variables emphasizes the dual nature of urbanization in Da Nang. On one hand, increasing built-up density contributes to heightened heat stress in urban areas. On the other hand, the importance of greenspace density highlights its critical role in providing cooling benefits, which can mitigate the adverse effects of the UHI phenomenon. Bareland density also stands out as a significant contributor to the UHI effect. This observation suggests that areas with higher bareland density may aggravate heat retention due to reduced vegetation cover and increased exposure of soil and surfaces to solar radiation. Proximity features of distance to coastlines and distance to rivers rank third and fifth, respectively. This ranking indicates that these geographical factors play a crucial role in influencing UHII. Closer proximity to coastlines and rivers likely provides cooling effects due to increased humidity and airflow, which can help regulate temperatures in Da Nang’s urban environments. Elevation ranks sixth in significance; however, variables such as aspect, TPI, and slope demonstrate less importance than others.
Via SHAP analysis, land cover, while still relevant, is less important than other factors, including urban morphological features. This outcome indicates that the NGBoost model relies more on the specific quantitative characteristics of the urban environment than on the categorical classification of land cover. In particular, the higher average absolute SHAP values for the density features indicate that changes in these variables cause larger changes in the machine learning model’s output compared to changes in the land cover type.
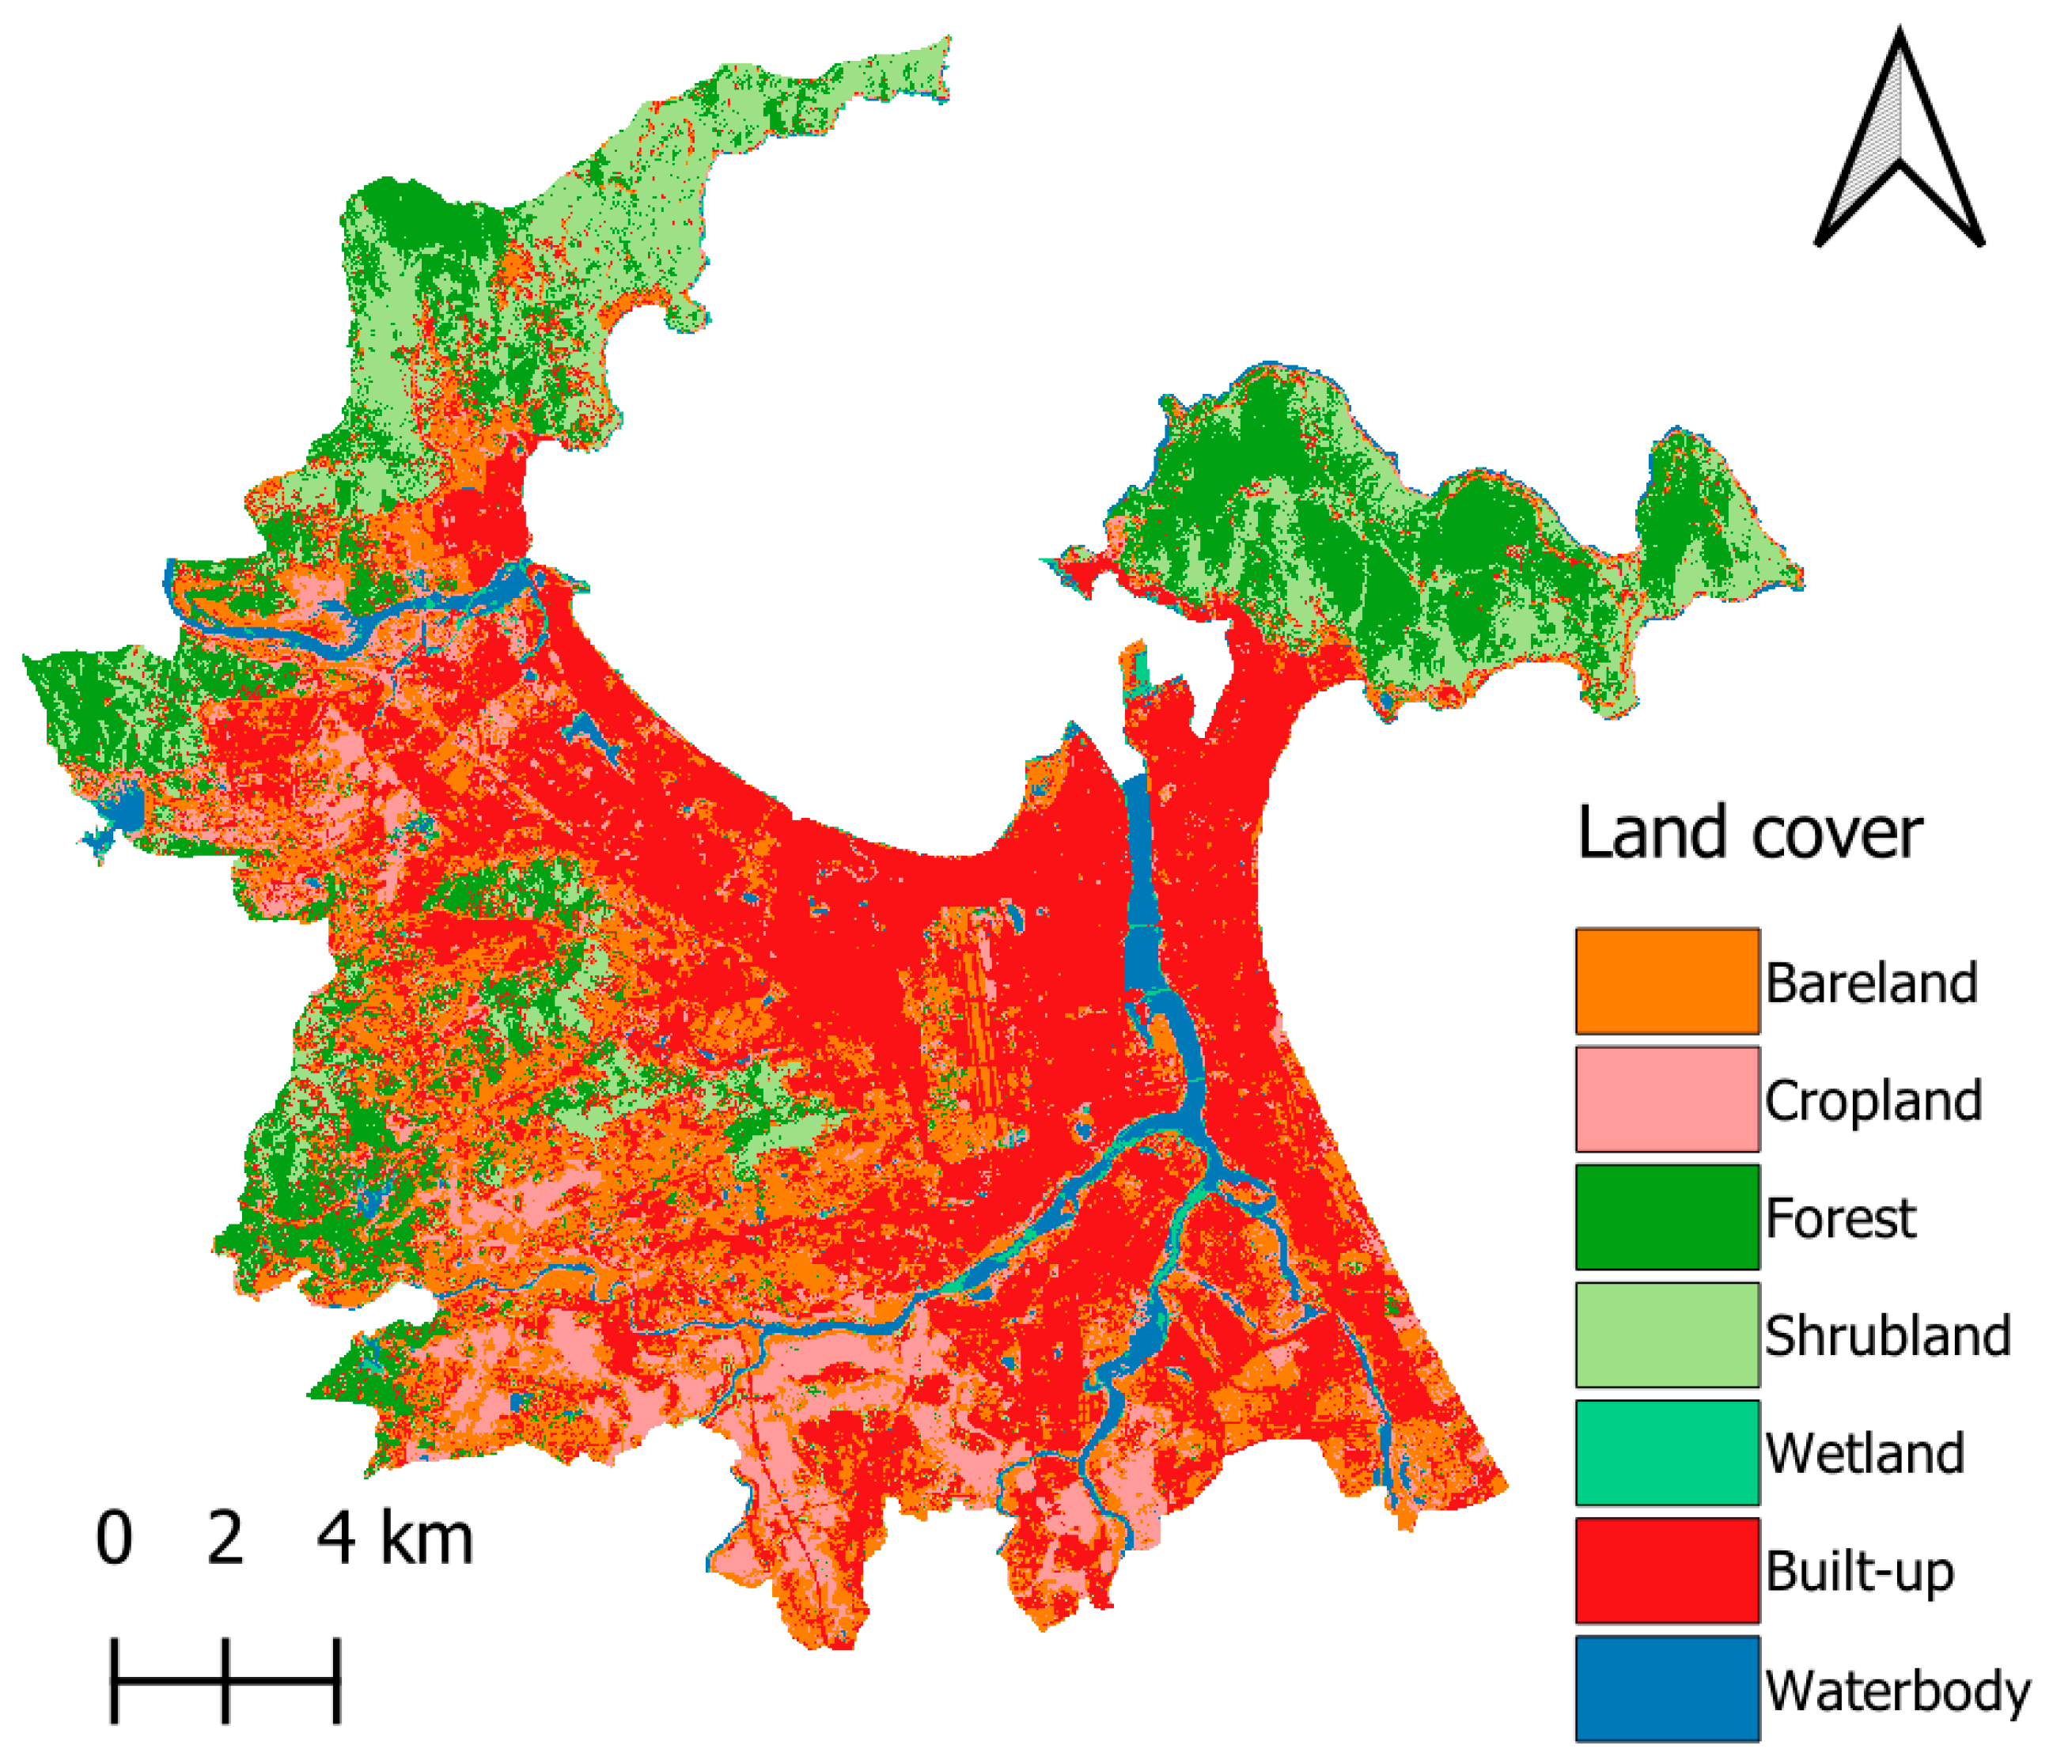
This study uses the CA-ANN framework to simulate land cover change in the study area. The CA method models each cell’s state within a grid based on the prior states of neighboring cells, following defined transition rules. This approach simulates future land cover by examining historical patterns. An ANN model is used to generalize transition potential matrices for land cover projections. As mentioned earlier, the changes in land cover between 2010 and 2015 provide training samples for CA-ANN, which is subsequently used to predict land cover for 2020. The model’s accuracy is evaluated by comparing the actual 2020 land cover data with the simulated results, achieving a prediction accuracy of 83.05% and a Cohen’s kappa of 0.78. The CA-ANN framework is then applied to project land cover in Da Nang’s urban center for 2040, as illustrated in
Figure 9.
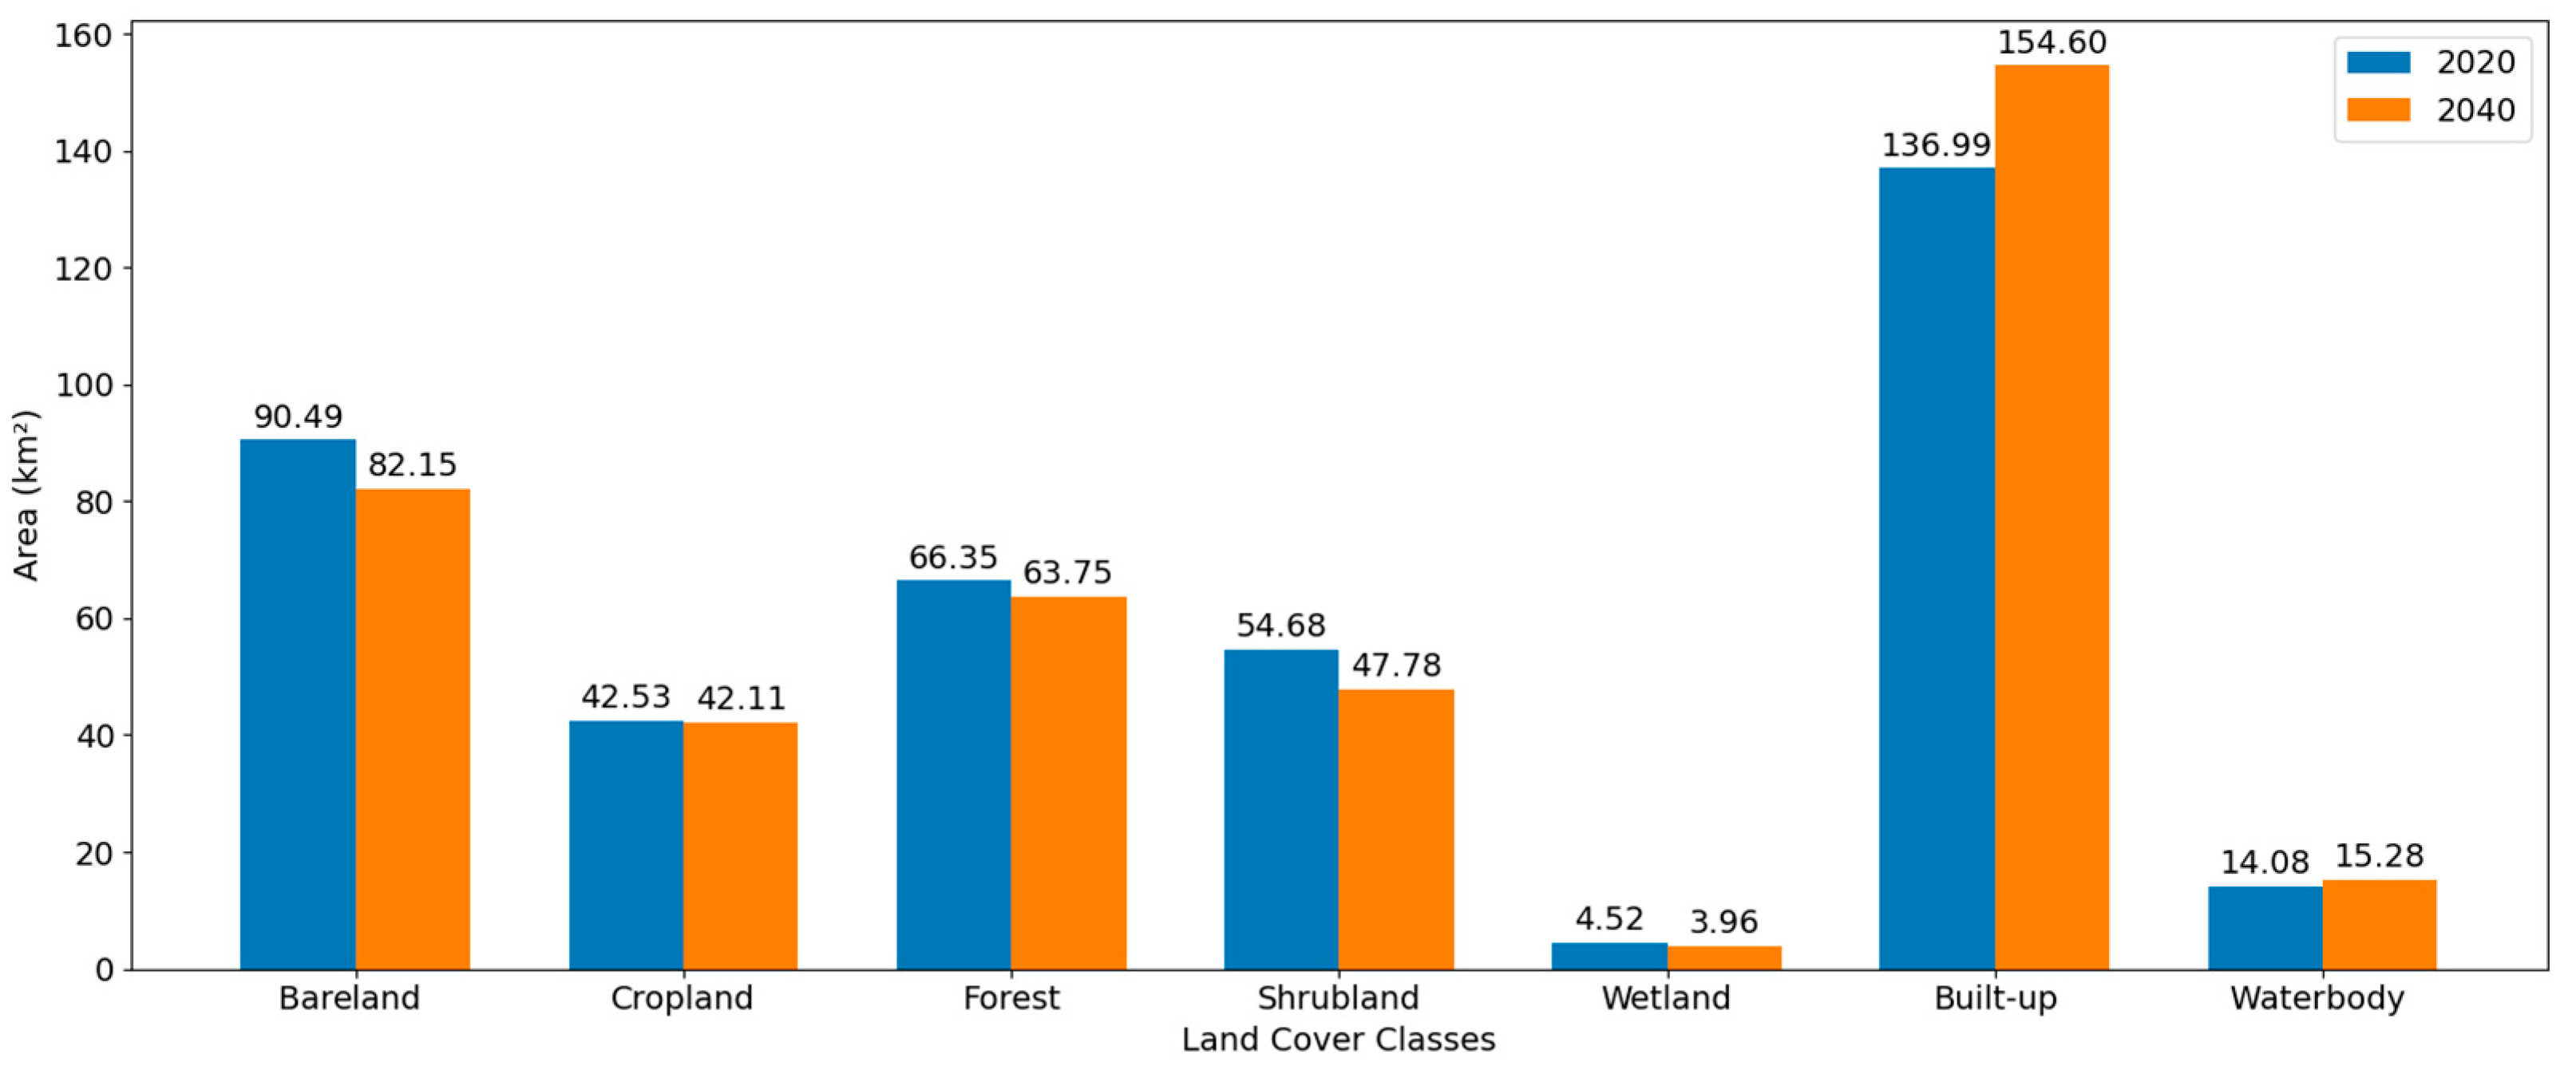
Figure 10 highlights the changes in each land cover type between 2020 and 2040. The area of bareland is expected to decrease from 90.49 km
2 to 82.15 km
2, reflecting a decline in undeveloped land. Cropland also shows a slight reduction, from 42.53 km
2 in 2020 to 42.11 km
2 in 2040. Forest areas are anticipated to shrink from 66.35 sq. km to 63.75 km
2, and shrubland is projected to decrease from 54.68 km
2 to 47.78 km
2, suggesting a decline in natural vegetation cover. Wetland areas are expected to reduce marginally, from 4.52 km
2 to 3.96 km
2, while waterbodies show a small increase from 14.08 km
2 to 15.28 km
2, possibly due to changes in water management or expansion of water resources. In contrast, built-up areas demonstrate a notable increase from 136.99 km
2 in 2020 to 154.60 km
2 by 2040.
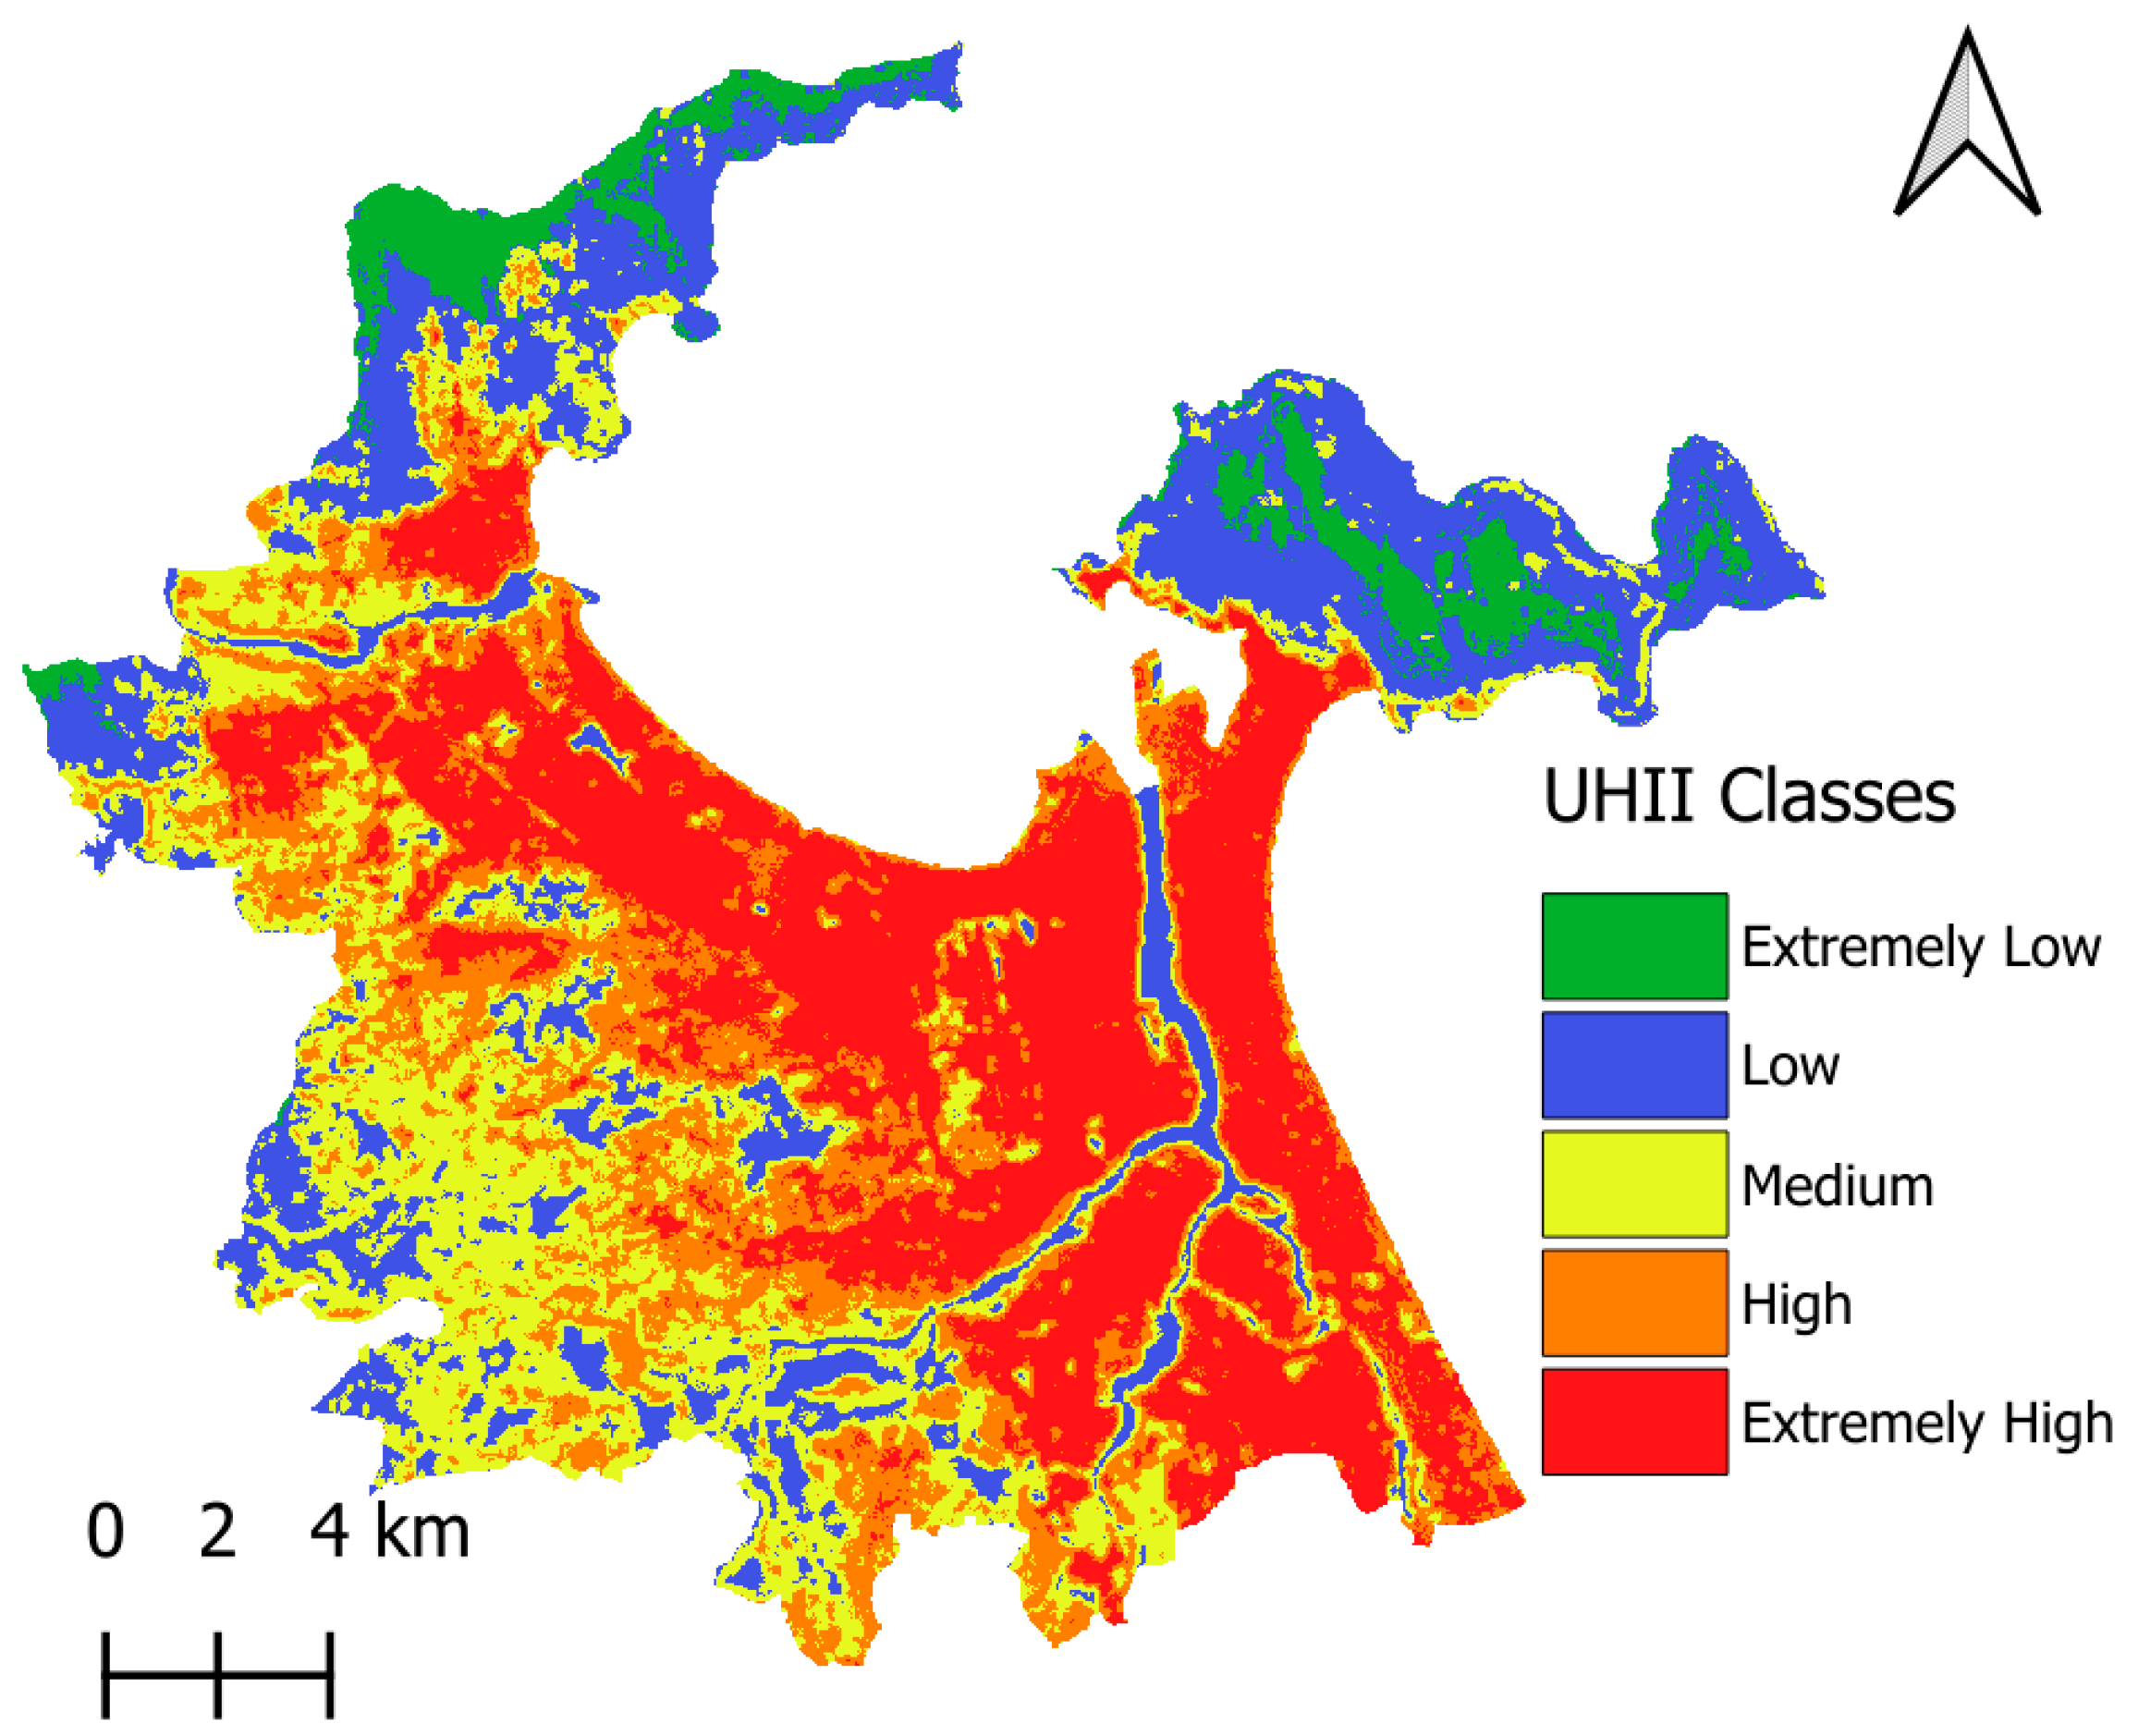
Based on the projected land cover in 2040, the factors of distance to wetlands, land cover types, built-up density, greenspace density, bareland density, and waterbody density are computed. The established NGBoost model is used to predict the spatial variation in UHII in the study area. The UHII map for 2040 is illustrated in
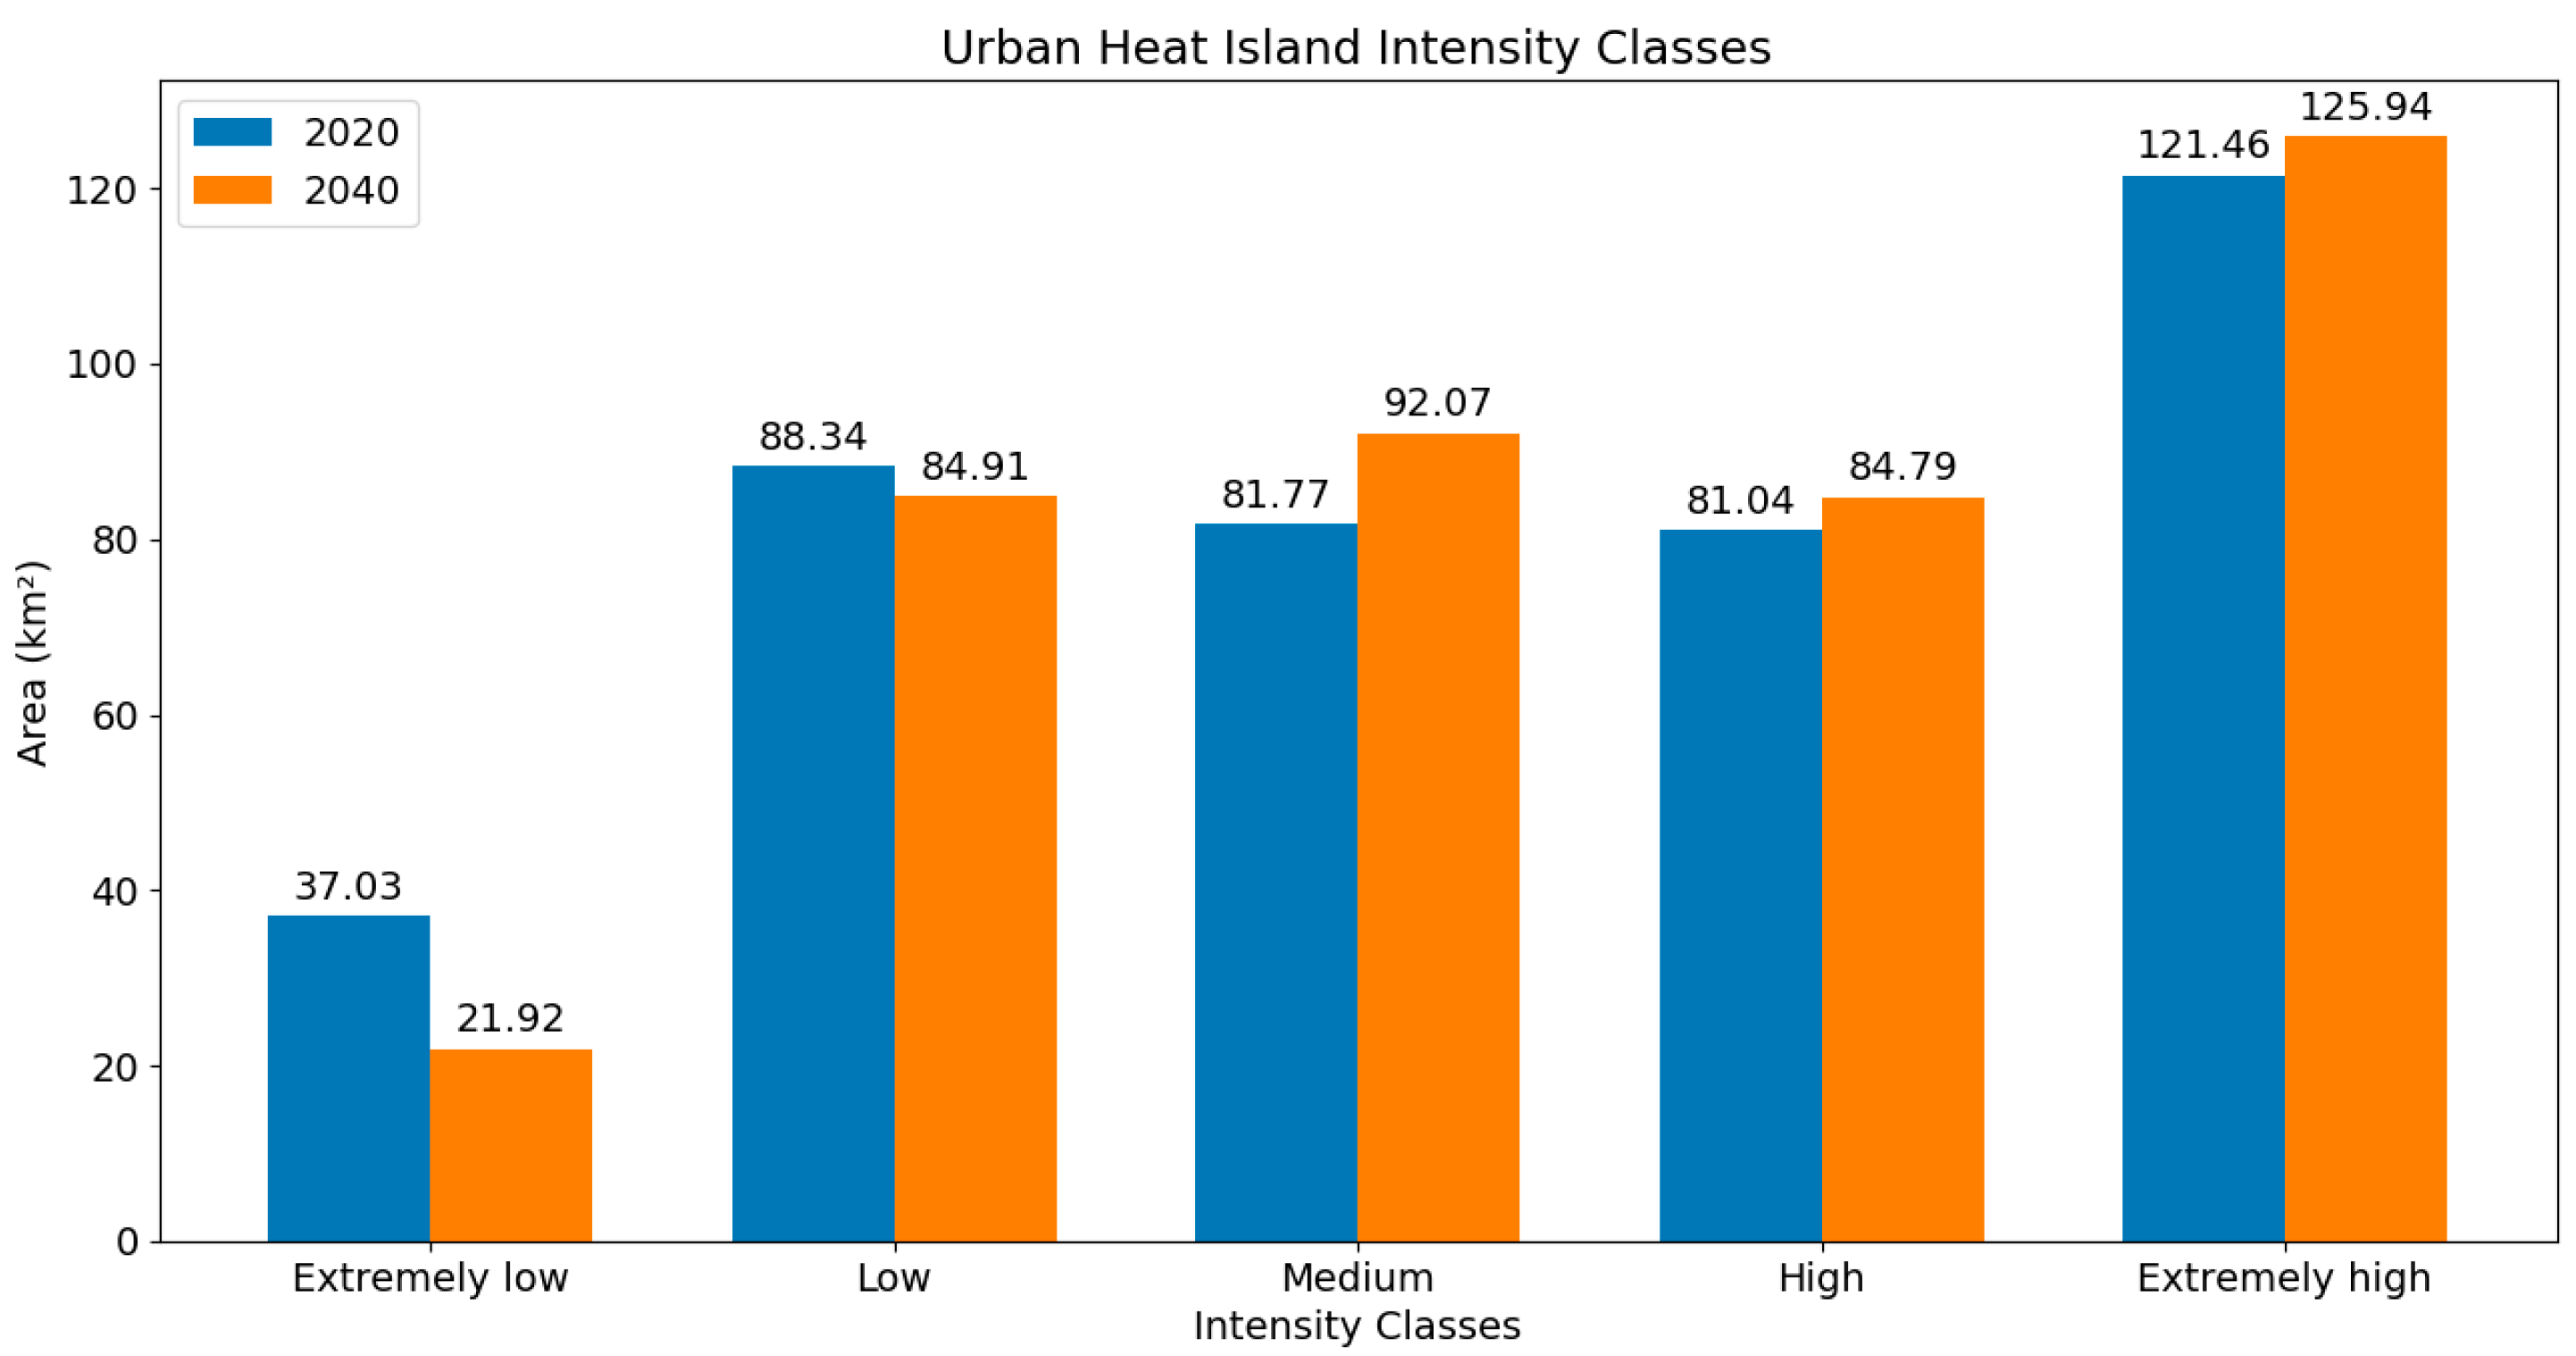
Figure 11. In addition, the changes in area of UHII classes are demonstrated in
Figure 12. The results show remarkable changes across UHII classes between 2020 and 2040. Areas classified under “extremely low” intensity experience a notable decrease, dropping from 37.03 km
2 in 2020 to 21.92 km
2 by 2040. This decline suggests a reduction in zones with minimal temperature differences between urban and rural areas. “Low” intensity areas also decrease slightly, from 88.34 km
2 to 84.91 km
2. In contrast, “medium” intensity areas increase from 81.77 km
2 in 2020 to 92.07 km
2 in 2040, reflecting a growth in moderately affected regions. High-intensity UHI areas grow modestly, from 81.04 sq. km to 84.79 km
2. Finally, “extremely high” intensity zones expand from 121.46 km
2 to 125.94 km
2, showing a marked increase in areas facing the most severe urban heat. This trend suggests an overall intensification of UHI effects in the region by 2040, with more areas transitioning to higher intensity levels.
5. Discussion and Urban Planning Implications
This study employs machine learning approaches for estimating the spatial variation in UHII for Da Nang’s urban area, a region that has recently experienced a fast pace of urbanization and also suffered from the undesirable effect of global climate change. Although machine learning-based prediction of LST and urban heat stress has been intensively investigated, geospatial modeling of UHII has not been fully explored. In addition, the studies dedicated to forecasting the future evolution of UHII based on projected land cover change are still limited. This study has filled those gaps in the literature by comparing the performance of NGBoost and DNNR in UHII estimation. Based on the experimental results, NGBoost is deemed best suited for the task of interest.
NGBoost is particularly effective for predicting UHII due to several key advantages that align well with the complexities of this task. The relationship between UHI intensity and its influencing factors is complex and nonlinear. NGBoost excels in capturing these nonlinear relationships through its multiparameter boosting approach [
70]. This capability enables the model to accurately represent the intricate interactions among the employed 12 factors that affect UHI intensity. Conventional machine learning models often struggle with such complexities, making NGBoost a more suitable choice for this type of analysis. Another important aspect of NGBoost is its use of natural gradient optimization [
48]. This method stabilizes training dynamics and enhances the model’s ability to fit complex data patterns without requiring extensive tuning or expertise. By optimizing the parameters of the conditional distribution effectively, NGBoost leads to improved prediction performance, which is particularly valuable when managing multifaceted urban datasets.
This study established a GIS dataset to explore the relationship between UHII and its explanatory variables. Based on Pearson correlation analysis, built-up density and greenspace density have the highest linear correlation with UHII; their |R| values are larger than 0.74. However, the relationship between the explanatory variables and the dependent variable can be highly nonlinear. This fact is proven by the observation that although the linear correlation of bareland density and UHII is minor (R = 0.17), this feature still attains a high rank (i.e., 2nd rank) based on SHAP analysis. A similar observation holds true for the case of distance to coastlines. This fact shows the nonlinear nature in the GIS dataset related to UHII and provides a strong motivation for applying sophisticated machine learning models to capture the complex patterns in the data.
Moreover, SHAP provides valuable insights into the ranking of the input features and their associations with the UHII. The feature ranking attained by SHAP is aligned with previous studies [
71,
72,
73], which confirmed that the expansion of built-up zones is a primary driver of urban heat stress. The effect of bareland on LST variation in urban areas is not clearly depicted. Peng et al. [
74] found a positive correlation between bareland and LST, whereas Chen et al. [
47] indicated a negative relationship. This inconsistency can be attributed to the intricate interactions among urban land cover types and their differing influences on the urban thermal properties. This study contributes to the ongoing discussion by showing the criticality of bareland in urban environments via the factor of bareland density. In addition, the impact plot yielded by SHAP shows that there is a strong positive association between the bareland density and UHII in the study area.
Based on SHAP analysis, elevation ranks sixth in significance among the variables assessed. The impact of this variable impact is relatively minor compared to other factors related to urban landscape. In contrast, the variables such as aspect, TPI, and slope demonstrate even less importance. This finding suggests that topographical variations within the study area do not significantly affect UHII in comparison with the more pronounced influence of urban landscape characteristics. Furthermore, the analysis also reveals that land cover type contributes modestly to UHII variation. This outcome indicates that the specific type of land cover at a given location is less critical than broader neighborhood characteristics and patterns of land use. Factors such as built-up density, bareland density, and greenspace density are far more influential in determining the spatial variations in UHII. This perspective shifts the focus from isolated land cover types to a more holistic understanding of how different land uses interact within urban environments.
Based on SHAP, there are clear positive correlations between built-up density and bareland density with UHII. These relationships highlight how increased urbanization and changes in land use contribute to higher temperatures in urban settings. As built-up areas expand and barelands increase, the thermal environment becomes more pronounced, intensifying UHI effects. Conversely, negative correlations emerge with variables such as distance to coastlines, greenspace density, distance to rivers, elevation, and waterbody density. These results indicate a cooling effect associated with these factors.
The fact that built-up density, bareland density, distance to coastlines, greenspace density, and distance to rivers are the most influential variables indicates the critical importance of the urban landscape. These variables interact in complex ways to shape the thermal dynamics of urban areas. Given this intricate relationship, effective land management by local authorities emerges as a crucial strategy for mitigating UHI effects. Urban planners must consider how different land use patterns influence temperature variations across the city. Strategies that incorporate green infrastructure, such as urban forests and parks, can significantly reduce heat stress. Additionally, maintaining adequate distances from coastlines and rivers can help regulate microclimates within urban settings. These considerations highlight the necessity for a comprehensive approach to urban planning that relies on the surrounding natural landscapes (e.g., coastal areas, natural waterbodies, etc.) to mitigate the adverse effects of UHI.
Based on the projected land cover in 2024, built-up areas show a significant rise from 136.99 km2 in 2020 to 154.60 km2 by 2040. This fact indicates urban expansion is predicted as a crucial factor in land cover change in the study region. Therefore, it is recommended that local authorities can implement zoning regulations that promote sustainable land use practices and encourage the integration of natural elements into urban design. This approach not only addresses immediate temperature concerns, but also fosters long-term environmental sustainability in Da Nang’s urban center.
This study classified the urban center into different categories based on the intensity of the UHI effect. It is recommended that each category require appropriate mitigation strategies to effectively reduce heat stress for the urban dwellers. In areas with low UHII, preserving and enhancing existing green spaces is the primary focus. Maintaining parks, street trees, and other urban greenness is crucial to sustaining the natural cooling benefits provided by these areas. For medium UHII zones, it is recommended that the local authorities carry out more proactive mitigation efforts. Expanding urban greenness via the expansion of tree canopy along streets, parking lots, and within residential and commercial areas is beneficial to enhance the thermal comfort.
For high and extremely high UHII areas, it is strongly suggested that green roofs and vertical gardens on both public and private buildings be encouraged. Utilization of advanced methods for optimizing building layouts can be helpful to maximize natural ventilation and minimize heat retention. Local authorities should prioritize the expansion of urban parks and green corridors to provide better cooling and recreational benefits. Large-scale interventions, such as the replacement of impervious surfaces with permeable pavements, can be helpful for both heat-stress mitigation and improvement of stormwater management. Moreover, revising building codes to specify minimum green space ratios and mandate the use of green roofs in new developments should also be considered. Particularly for extremely high UHII areas, it is essential to establish cooling centers for vulnerable communities to provide shelters during extreme heat events.
6. Conclusions
As urbanization continues to intensify, knowledge of the spatial distribution of UHII becomes crucial for effective city planning and the mitigation of urban thermal stress. This study presents an innovative machine learning-based method for estimating UHII within the urban environment of Da Nang, Vietnam. Evaluating the spatial variations in UHII enables urban planners to assess heat stress more accurately and develop strategies that enhance thermal comfort for residents. The study utilizes NGBoost, geospatial data analysis, CA-ANN, and remote sensing data to create an integrated framework for UHII modeling and forecasting.
Notably, the integration of NGBoost with SHAP analysis provides insights into the various factors influencing UHII variations in the study area. Via the identification of critical factors that affect UHII, this research contributes to a deeper understanding necessary for implementing effective urban heat mitigation strategies. The current work has relied on a set of 12 factors affecting UHII and established a GIS database to support the analysis. The results demonstrate that NGBoost effectively models the spatial variations in UHII, proving to be a reliable tool for assessments of the UHI effect. Additionally, the CA-ANN method was used to simulate and project land cover changes, enhancing the predictive capabilities of the proposed framework. Accordingly, this framework is able to forecast UHII in 2040, allowing city planners to anticipate the intensity and spatial distribution of the thermal stress in Da Nang.
The current work also has several limitations. First, this study focuses on modeling the UHII during the dry season in Da Nang’s urban center. The current work does not account for seasonal variations in urban surface temperature; this fact may restrict the overall understanding of urban heat stress’s characteristics. Second, while the study highlights the importance of greenspace density, the effects of other factors related to urban greenness, such as size and shape [
75], have not yet been explored. Third, the current work has not taken into account the impact of government policies in projecting future urban land use/land cover. Fourth, future climate change—particularly the ongoing trend of global warming—has the potential to significantly influence the UHI effect; however, this variable has not been incorporated into the current modeling framework. Fifth, due to the lack of available data, this study has not considered the effect of the three-dimensional structure of buildings (e.g., building height) on the intensity of the UHI effect.
Furthermore, this study critically evaluated the effectiveness of NGBoost and DNNR in modeling and predicting UHII. While NGBoost has demonstrated strong performance on the collected datasets, it is necessary to extend the investigation to cover other promising methodologies, including advanced gradient boosting (e.g., extreme gradient boosting machine and light gradient boosting machine), transfer learning, as well as deep learning techniques designed for tabular data. Exploring the capabilities of other advanced machine learning models can help identify potentially superior approaches for modeling UHII and enhance predictive accuracy.
Future extensions of the current study may focus on exploring additional explanatory factors that influence the estimation and forecasting of UHII. The additional variables can help enhance the understanding of the spatiotemporal variation in UHII and lead to more accurate predictions. Moreover, considering and incorporating government policies in urban land use/land cover simulation can help achieve more accurate and realistic estimation of urban expansions. It is also noted that machine learning-based investigation into the effectiveness of various mitigation strategies for urban heat stress can be worth exploring. Understanding how these measurements impact UHII will provide valuable insights for urban planners to reduce heat stress in cities. Additionally, the proposed framework should be used to model UHII in other regions of Vietnam to further demonstrate its capability and enhance its generalization. Finally, the framework could be utilized to manage other tasks related to the UHI phenomenon, such as analysis of severe heat stress [
76], estimation of microscale impacts of urban crawl on seasonal UHII [
77], quantification of the relationship between morphological spatial pattern of greenspace and UHI [
78,
79], and examination of effects of urban form on UHI [
22,
80].


