Article

Examining Diverse Investors in the Clean Energy and Environmental Technology Sector: A Network Analysis from Japan

1
Department of Technology Management for Innovation, The University of Tokyo, Tokyo 113-8654, Japan
2
Institute for Future Initiatives, The University of Tokyo, Tokyo 113-0033, Japan
3
Department of Systems Innovation, The University of Tokyo, Tokyo 113-8654, Japan
*
Author to whom correspondence should be addressed.
Sustainability 2025, 17(10), 4258; https://doi.org/10.3390/su17104258
Submission received: 29 March 2025 / Revised: 6 May 2025 / Accepted: 6 May 2025 / Published: 8 May 2025
(This article belongs to the Section Economic and Business Aspects of Sustainability)

Abstract

:
Startups in the clean energy and environmental technology (CEET) sector can develop sustainable innovations, but mobilizing private finance has been difficult. As the venture capital (VC) investment model was found to be not well-suited for the CEET startups, diverse types of investors have received more attention. However, since previous studies have been dominated by a VC-centric perspective in the US and have overlooked collaborative relationships, the roles of various CEET investors have not been systematically analyzed. This study aims to analyze the diverse investors in the CEET investor network formed through co-investment syndication, using Japan as an underexplored regional context. Based on Japan’s comprehensive data from 2008 to 2022, this study examines the evolution, structure, and communities of the network. The analysis identified the development stages of the investor network: the formation stage (2008–2012), the expansion and diversification stage (2013–2017), and the stable growth stage (2018–2022). The results confirmed the strong influence of VCs, while a community analysis suggested the bridging role of governmental venture capital. The findings based on the CEET investor network contribute to expanding both the theoretical understanding and practical implications for overcoming the financing difficulties of CEET startups to address the climate change crisis.

1. Introduction

To accelerate the rapid diffusion of decarbonization technologies aimed at achieving the net-zero goal, startups in the clean energy and environmental technology (CEET) sector can play significant roles. These CEET startups are expected to develop sustainable innovations that improve sustainability performance [1] by reconciling economic, environmental, and social goals [2]. However, mobilizing private finance for the CEET sector has historically been difficult due to its specific technological and market barriers [3,4,5]. Nevertheless, while the IPCC’s discussions have focused on macro-finance for mature technology transfer [6], the issue of the serious funding gap for early-stage CEET has not been fully addressed. To understand the financing mechanisms that foster a sustainable innovation ecosystem, this study focuses on startup investors in the CEET sector.
A fundamental mismatch between the CEET and the venture capital (VC) investment model was identified because of technological features and the structure of VC funds [7]. As this issue became more widely recognized, more attention has been paid to non-VC investors as alternative sources of funding, such as patient capital [8] and governmental venture capital (GVC) [9]. However, empirical knowledge of these diverse investors has remained limited. Because previous studies have been concentrated on the US market [1,7,10,11,12], the VC-centric perspective originating in Silicon Valley [13] has tended to be generalized beyond its regional context. Understanding diverse investors in novel regional contexts expands the theoretical space for securing funding for the CEET sector.
Furthermore, co-investment syndication is particularly important when it is difficult for a single investor to take risks and provide sufficient capital [14,15], as is typical of deals in the CEET sector. Although diverse investors cooperate to address the CEET funding gap, previous studies tend to focus on investment performance and individual investors. There is a need to place these investors in the context of collaborative relationships. Therefore, this study uses social network analysis (SNA) [16,17] to understand the role of diverse investors in the CEET investor network.
We selected Japan as a unique regional case to complement and enrich previous research. Japan has established innovation capabilities, as evidenced by its leading position in the number of inventions in the manufacturing and CEET sectors [18]. This has fostered the diversity of investors, including non-VC investors whose investment amounts are comparable to those of VCs [19].
To examine the network evolution, structure, and roles of the diverse investors, we use SNA and a comprehensive dataset of CEET investments in Japan. The remainder of this study is organized as follows: Section 2 provides a literature review on CEET investors. Section 3 outlines the datasets and methodological approach. Section 4 presents the analytical results, including (1) the historical evolution of the investor networks, (2) the roles of various investor types, and (3) the characteristics of governmental venture capital (GVC). In Section 5, based on the results, we discuss the findings and draw practical implications. By advancing knowledge of the diverse investors in the CEET sector, this research contributes to developing funding strategies to support sustainable innovation.

2. Literature Review

The main challenge in the CEET sector is to secure stable private investment to address the barriers [5]. While private investors usually have a maximum time horizon of 12 years [20], energy technologies tend to have a long research and development (R&D) period and a large capital investment [4]. Because of these factors, investors failed to realize the expected returns during the previous clean tech bubble of 2006–2011, and as the capital cycle stagnated, VCs withdrew from the clean energy market [12,21]. A similar bubble-bust pattern was observed in the recent climate tech boom during and after the post-COVID economic recovery [22,23]. Fluctuations in the CEET investment cycle have led to changes in the composition and relationships among CEET investors. However, previous research has not fully examined how the investor network evolves over this temporal transition.
As explained in the introduction, current research has highlighted the diversity of the financial system in the CEET sector to improve stability and resilience [24,25]. The CEET investors in each stage of sustainable innovation are typically categorized as follows [26,27]: grants and strategic partnerships in the basic research stage, accelerators and angel investors in the applied R&D stage, VCs in the early growth stage, and private equity funds and conventional finance in the late growth stage. GVCs have recently attracted attention due to their important capacity to support the CEET sector [28,29] through direct investments in startups and indirect investments in VCs [30]. However, previous research has failed to consider how different types of investors with distinct investment strategies are involved in financing the CEET sector.
Syndication is a means of sharing and reducing the investment risk and complementing resources [15]. Syndication forms social networks among investors, promoting risk sharing, knowledge exchange, and value creation [14,31]. While syndication research began as a part of the financial study on investor behavior, SNA was used to deepen the understanding from a network perspective [32,33,34]. Recently, the understanding of the structural properties and roles of VC networks has been expanded by the development of the SNA methodology [35,36,37,38,39]. However, the CEET sector has not been specifically investigated in most studies, with the exception of a study on renewable energy [40]. Furthermore, previous studies have tended to overlook the diversity of investors within investor networks. Given the need to pay more attention to non-VC investors, especially in CEET, understanding investor diversity is beneficial.
Based on the literature review, this study sets the following research directions. First, we aim to examine how the CEET investor network has evolved. This study provides insights into the dynamics of investor networks over time, given the rapidly changing market and policy environment in the CEET sector. Second, we aim to analyze the characteristics of diverse types of investors in the CEET investor network. This study quantifies the role and influence of VC and non-VC investors in the CEET sector. Third, we aim to understand the specific role of GVCs as the sole public investment actor. A deeper understanding of GVCs also leads to useful insights for policymakers on how to foster startup ecosystems and stimulate other private investors.

3. Materials and Methods

3.1. Research Context

This section reviews the research context for Japan to analyze how the CEET startup ecosystem has evolved through the involvement of diverse investors. The institutional framework has encouraged companies and financial institutions to enter the energy market, driven by policy changes [41]. The liberalization of regulated energy markets started in 1995 and was completed in 2016 [42]. This deregulation of the utility market transformed the traditional, regulated energy system into a more favorable market for new business entrants [43]. This trend has led to the rise of startups and their investors, allowing smaller companies to enter the previously regulated market. After the Fukushima nuclear accident in 2011, the Feed-in Tariff (FIT) started to encourage the installation of renewable energy in 2012 [44]. These drastic market changes increased the need for energy companies to create new businesses and fueled the trend of creating CVCs [45]. Next, an important policy was the Green Transformation (GX) initiative, which comprehensively supports the transition of large corporations and promotes startup innovations [46]. This growing GX policy momentum has expanded the investment activity of CVCs and financial institutions in decarbonization technologies.
Next, we review the context of Japan’s overall startup ecosystem. According to historical investment data, the total startup investment was 73.7 billion yen, and 896 startups received investment in 2009 [47]. The total startup investment increased drastically to 877.4 billion yen, and the number of funded startups rose to 2224 in 2022 [48]. This rapid growth can be attributed to the recent strengthening of startup policies. The Japanese government introduced the Startup Development Five-Year Plan in 2022 [49]. This plan stated the ambitious goal of increasing the amount of startup investment to more than 10 times the current level (to 10 trillion yen) in five years (by 2027). This policy trend has also stimulated the activities of GVCs. Since these policies target startup investors, the investment environment has improved dramatically. The following section explains the dataset and methodology.

3.2. Dataset and Data Cleaning

In this study, we constructed a dataset using the following steps. The procedure is consistent with the approach taken in previous studies of cleantech startups [11,50,51]. First, we selected primary data sources. After carefully considering several databases, we selected the Japanese data providers Speeda Startup Information Research [52] and Startup DB [53] in terms of quality and coverage, considering the language barriers. These databases and their published reports have been used in government reports and research articles on Japanese startups [49,54,55]. Speeda Startup Information Research was last updated on 30 October 2023, investor information was last updated on 27 February 2024, and deal information was last updated on 26 March 2024. Startup DB was last updated on 17 April 2023. In the following process, Speeda Startup Information Research was used as the primary data and Startup DB as supplemental data. To the best of our knowledge, these databases provide the most comprehensive and accurate data on Japan’s CEET startups.
Second, we created a dataset of deals and investors using the following methods. We first created lists of target startups. To compare the characteristics of deep tech, we selected drug discovery as a capital-intensive and R&D-intensive control group and artificial intelligence (AI) as a software-based and asset-light control group. Based on the specifications in the startup ecosystems [19,23,56], we identified startups in the three sectors using the tag information of startups. Based on this list of startups, we constructed a dataset of their investment deals and identified the investors involved in these deals. This dataset did not include other forms of financing, such as grants and subsidies, bank debt, project finance, and social lending.
Third, we categorized the types of investors in this study. Based on the descriptions of Japan’s startup ecosystem [19,48], we categorized them as follows: (1) VC, investment funds that focus mainly on investing for financial returns; (2) corporate venture capital (CVC), business operating companies and their investment vehicles; (3) GVC, investment arms of the government, ministries, and local governments; (4) Other Financials, banks, securities companies, insurance companies, and non-VC financial investors. The “Others” type consists of all investors not included in the above types, such as business angels, consulting firms, non-profit organizations, etc. In total, we identified 525 CEET investors across five categories (VC: 119, CVC: 164, GVC: 11, Other Financials: 37, Others: 194). Finally, we manually verified the datasets with publicly available information, such as government reports, web articles, company websites, and other databases.
The annual investment amounts and deals in the CEET sector are shown in Figure 1. The investment activity was relatively low in the 2000s and began to rise in 2015, peaking in 2017 and growing steadily since then. To ensure sufficient reliability in collecting accurate data, the aggregation period was set to 31 December 2022, providing a sufficient sample size for a detailed network analysis. Therefore, this analysis mainly focuses on the period from 2008 to 2022.

3.3. Social Network Analysis

This study analyzes the CEET investor network using SNA, primarily with Python 3.9.13 and its NetworkX library. SNA is a methodological framework for analyzing complex network structures and relationship patterns [16,17], which is appropriate for the objective of this study to understand the roles of diverse investors based on the investor syndication network.
The investor networks in this study were based on the syndication relationships of each investment deal. This definition did not include relationships with prior shareholders. Nodes represent investors, and edges represent syndication relationships between investors. To gain a better understanding of network structures, each edge was weighted based on the number of syndications, and isolated nodes were removed.
To understand the temporal changes in the structural characteristics of the investor networks, we calculated network metrics. The annual number of new investors was calculated as the number of investors who made their first investment in the target sectors in each year, and the continuing investor rate was calculated using the Jaccard index, both starting from 2000.
When calculating network metrics and visualizing graphs, investor networks were weighted by the number of syndications. The network metrics were calculated using rolling five-year time windows. In addition, sensitivity analyses of this setting were conducted by changing the time windows to 4 and 6 years to check the consistency of observations.
The edge density was calculated as the ratio of the total weight of edges between nodes to the maximum possible number of edges.
D = 2 E N ( N 1 )
E is the total edge weight, and N is the number of nodes.
The clustering coefficient indicates the degree to which neighboring nodes are linked to each other, taking edge weights into account [57]. The average clustering coefficient is calculated as follows:
< C > = 1 N i = 1 N C i w
The average path length is the distance between any two nodes. Here, we use the largest connected component of the networks.
< d > = 1 N ( N 1 ) i j d ( i , j )
d ( i , j ) is the weighted shortest path length between nodes i and j. To calculate the average path length, the inverse of the edge weight is used as the distance in the calculation, since more syndication means closer distances between investors.
We calculated the small-world-ness S [58], by comparing the observed network with multiple random networks that preserve the same numbers of nodes and edges. Small-worldness is characterized by high clustering coefficients and short path lengths, describing networks where the distances between randomly selected nodes are small [16,59].
To understand the roles of different investors in the investor networks, we calculated the scale-free parameter α and centrality measures for each investor type. The value of α falls in the range 2 < α < 3 in typical scale-free networks [60]. In such networks, a small number of hub nodes have highly concentrated edges.
Centrality measures were calculated to understand the roles of the different investors. Firstly, to select the centrality measures for our purpose, several candidate measures were selected [16,61,62]. Secondly, the centrality measures were calculated for the CEET investor network (2008–2022), and a correlation matrix was generated, followed by hierarchical clustering. Based on the results of this preliminary analysis, we identified the degree centrality, betweenness centrality, closeness centrality, and eigenvector centrality as the representative measures for this investor network.
Third, we calculated centrality measures [63], accounting for the edge weights based on the number of syndications. The weighted degree centrality is calculated by expanding i = 1 n a i x and summing the edge weights with adjacent nodes. Investors with a high weighted degree centrality can have strong direct relationships with other investors.
Betweenness centrality is based on
i = 1 ; i x n j = i + 1 ; j x n g i j ( x ) g i j
g i j is the number of shortest paths from node i to j, and g i j ( x ) represents the number of paths that pass through node x. Calculations of betweenness and closeness centrality use the inverse of the edge weight as the distance. Nodes with high betweenness centrality can be important connectors.
Closeness centrality is calculated from
1 i = 1 n d G ( x ,   i )
Here, d G ( x ,   i ) is the shortest distance from node x to node i, considering the edge weight. Nodes with high closeness centrality can efficiently gather information and interact with each other.
Eigenvector centrality is a measure that extends degree centrality by considering the qualitative influence of its neighbor nodes. This is calculated based on
1 λ m a x ( A ) j = 1 n a j x v j
where a j x represents the edge weight from node j to x, and v is the eigenvector corresponding to the maximum eigenvalue λ m a x ( A ) of the adjacency matrix A. Investors with high eigenvector centrality can be connected to other influential investors.

3.4. Community Analysis

By analyzing community structures of networks [64], we gain a deeper insight into the role of GVCs. The Louvain method [65] was used to identify the community structure. First, the Louvain method was applied to the CEET investor network (2008–2022) with the resolution parameter set to the default value of 1.0, and the result with the highest modularity was used. To ensure the consistency of community detection, we checked the Normalized Mutual Information [66].
Second, in order to quantitatively assess the role of each type of investor in the community structures, this study used two indicators. To assess the bridging capabilities between communities in the investor networks, we developed a novel metric: the cross-community bridging score. The cross-community bridging score B i , c for an investor type i in a community C is defined in the following equation. It is calculated per community and per investor type.
B i , c = 1 | V i , c | v V i , c | ( v , u ) E :   u V \ C c |
There is a set of nodes V i , c in a specific investor type i and a specific community c. For each node v V i , c , we count the edges ( v , u ) that point to nodes u outside the given community c. We sum these counts overall v V i , c and divide them by the number of nodes | v V i , c |. This cross-community bridging score is calculated for one community and one investor type.
The participation coefficient was also used in this study, as a measure of how well the edges of the node are distributed across different communities [67]. A higher participation coefficient indicates that the edges are more evenly distributed across multiple communities. Nodes with high participation coefficients are associated with inter-community fluxes. These two indicators offer complementary perspectives; while the cross-community bridging score focused on the degree to which nodes of a given investor type within a given community were connected to other communities, the participation coefficient focused on the structural characteristics of the node layers as a macro understanding of the dispersion of edges across communities. These indicators offer a comprehensive understanding of the role of GVCs in the community structures within the network.

4. Results

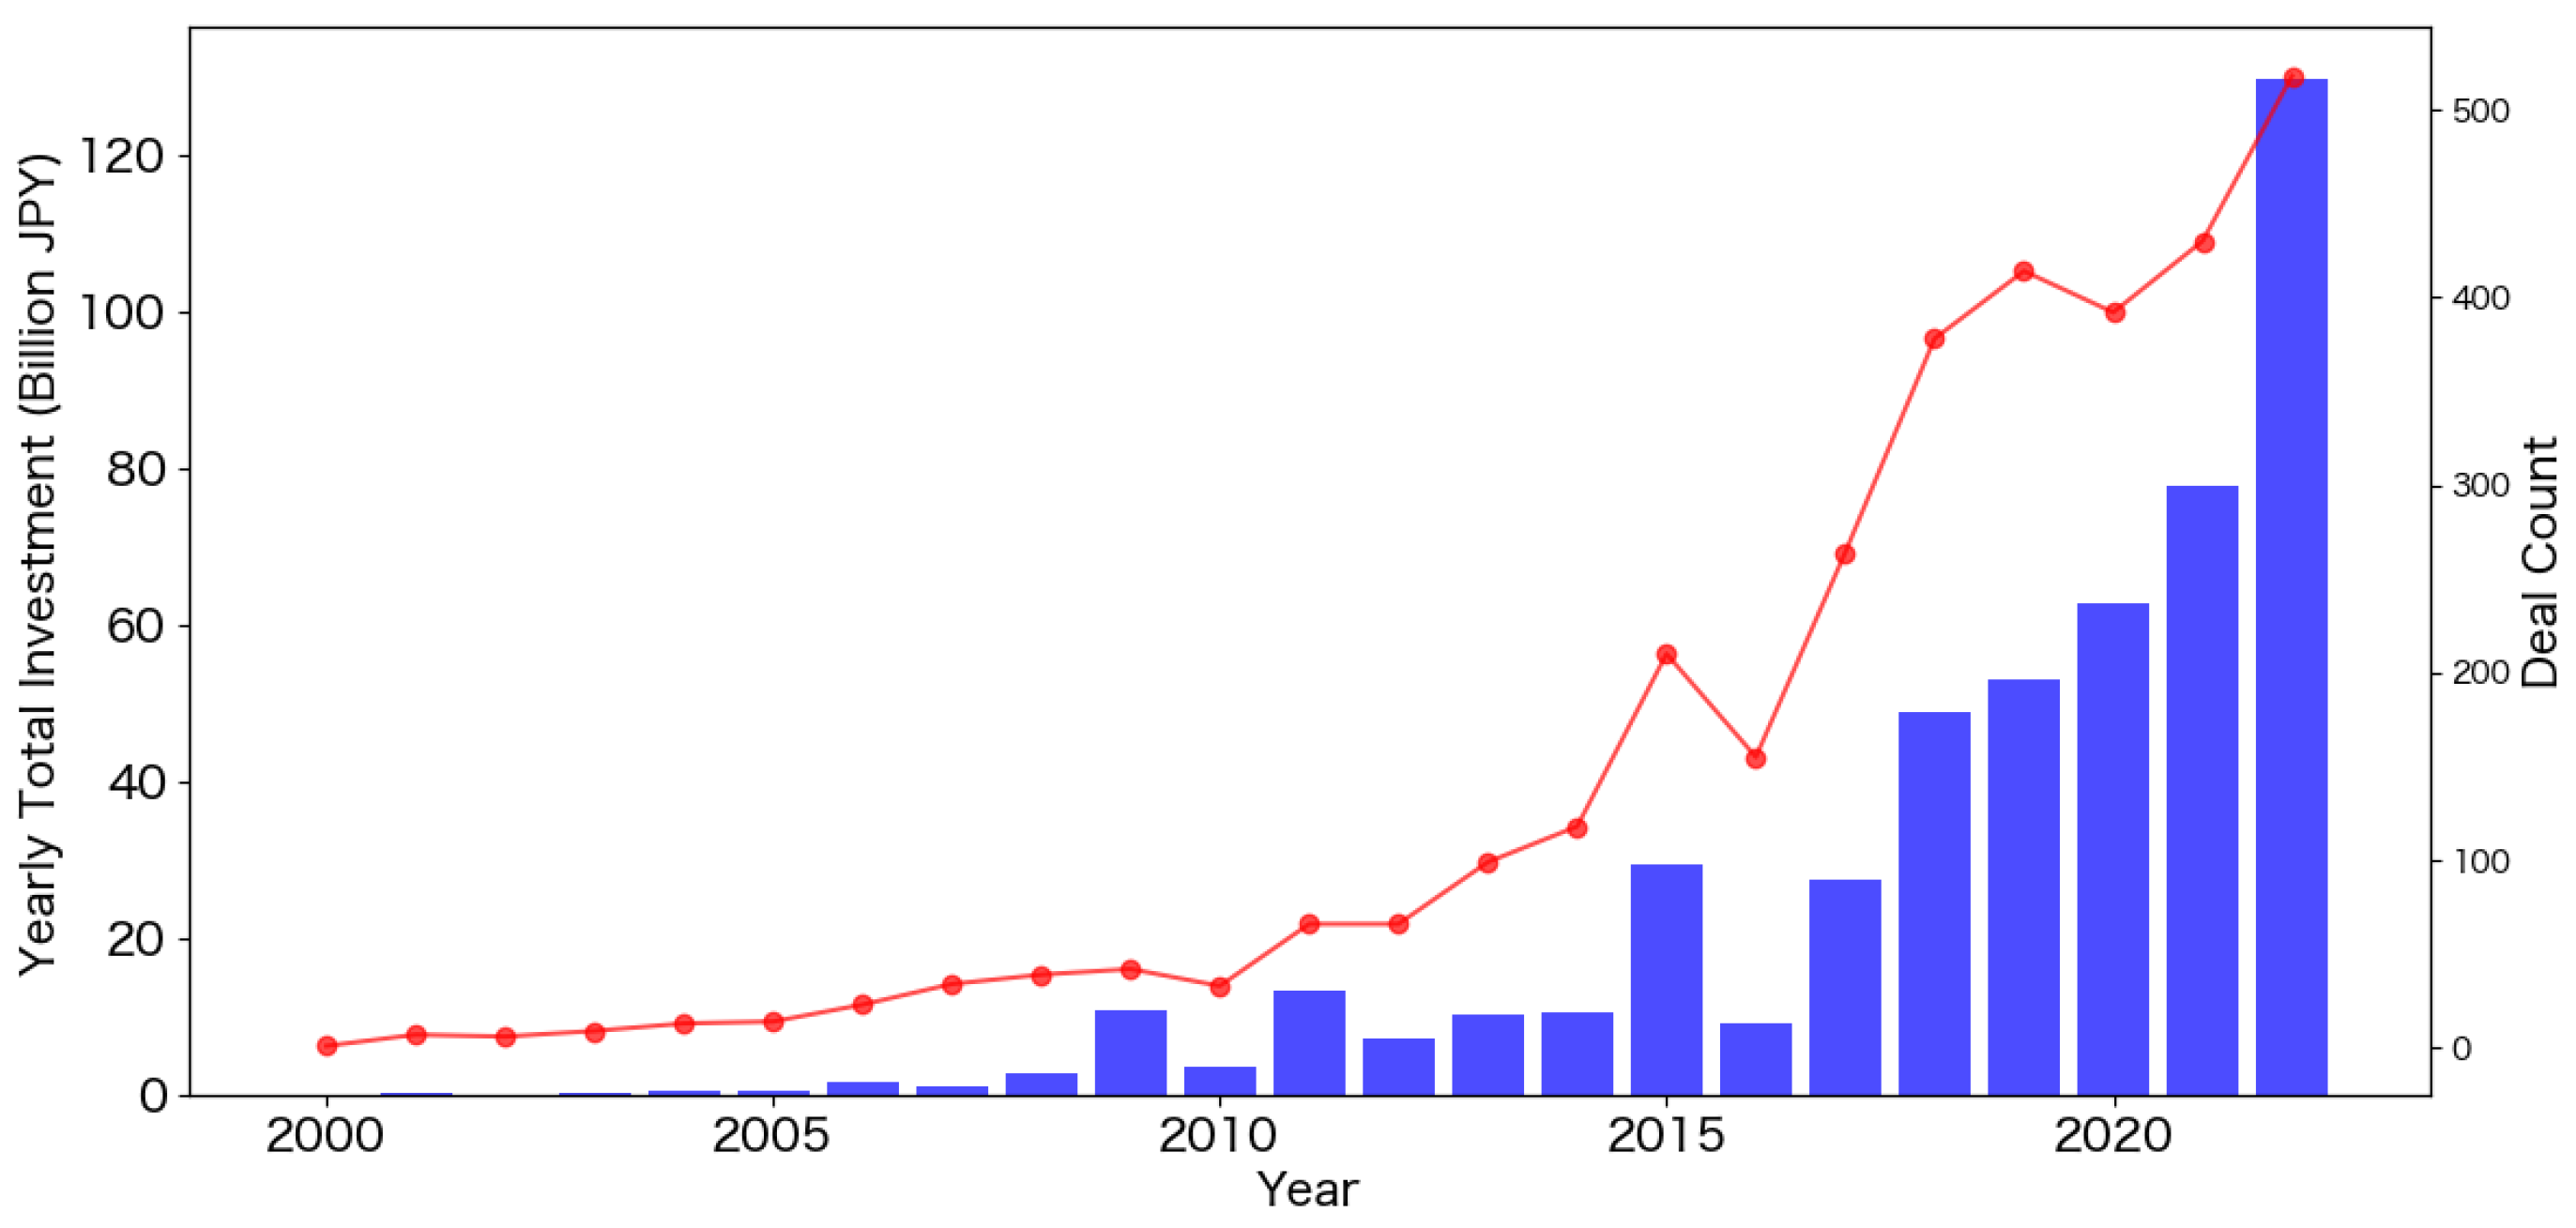
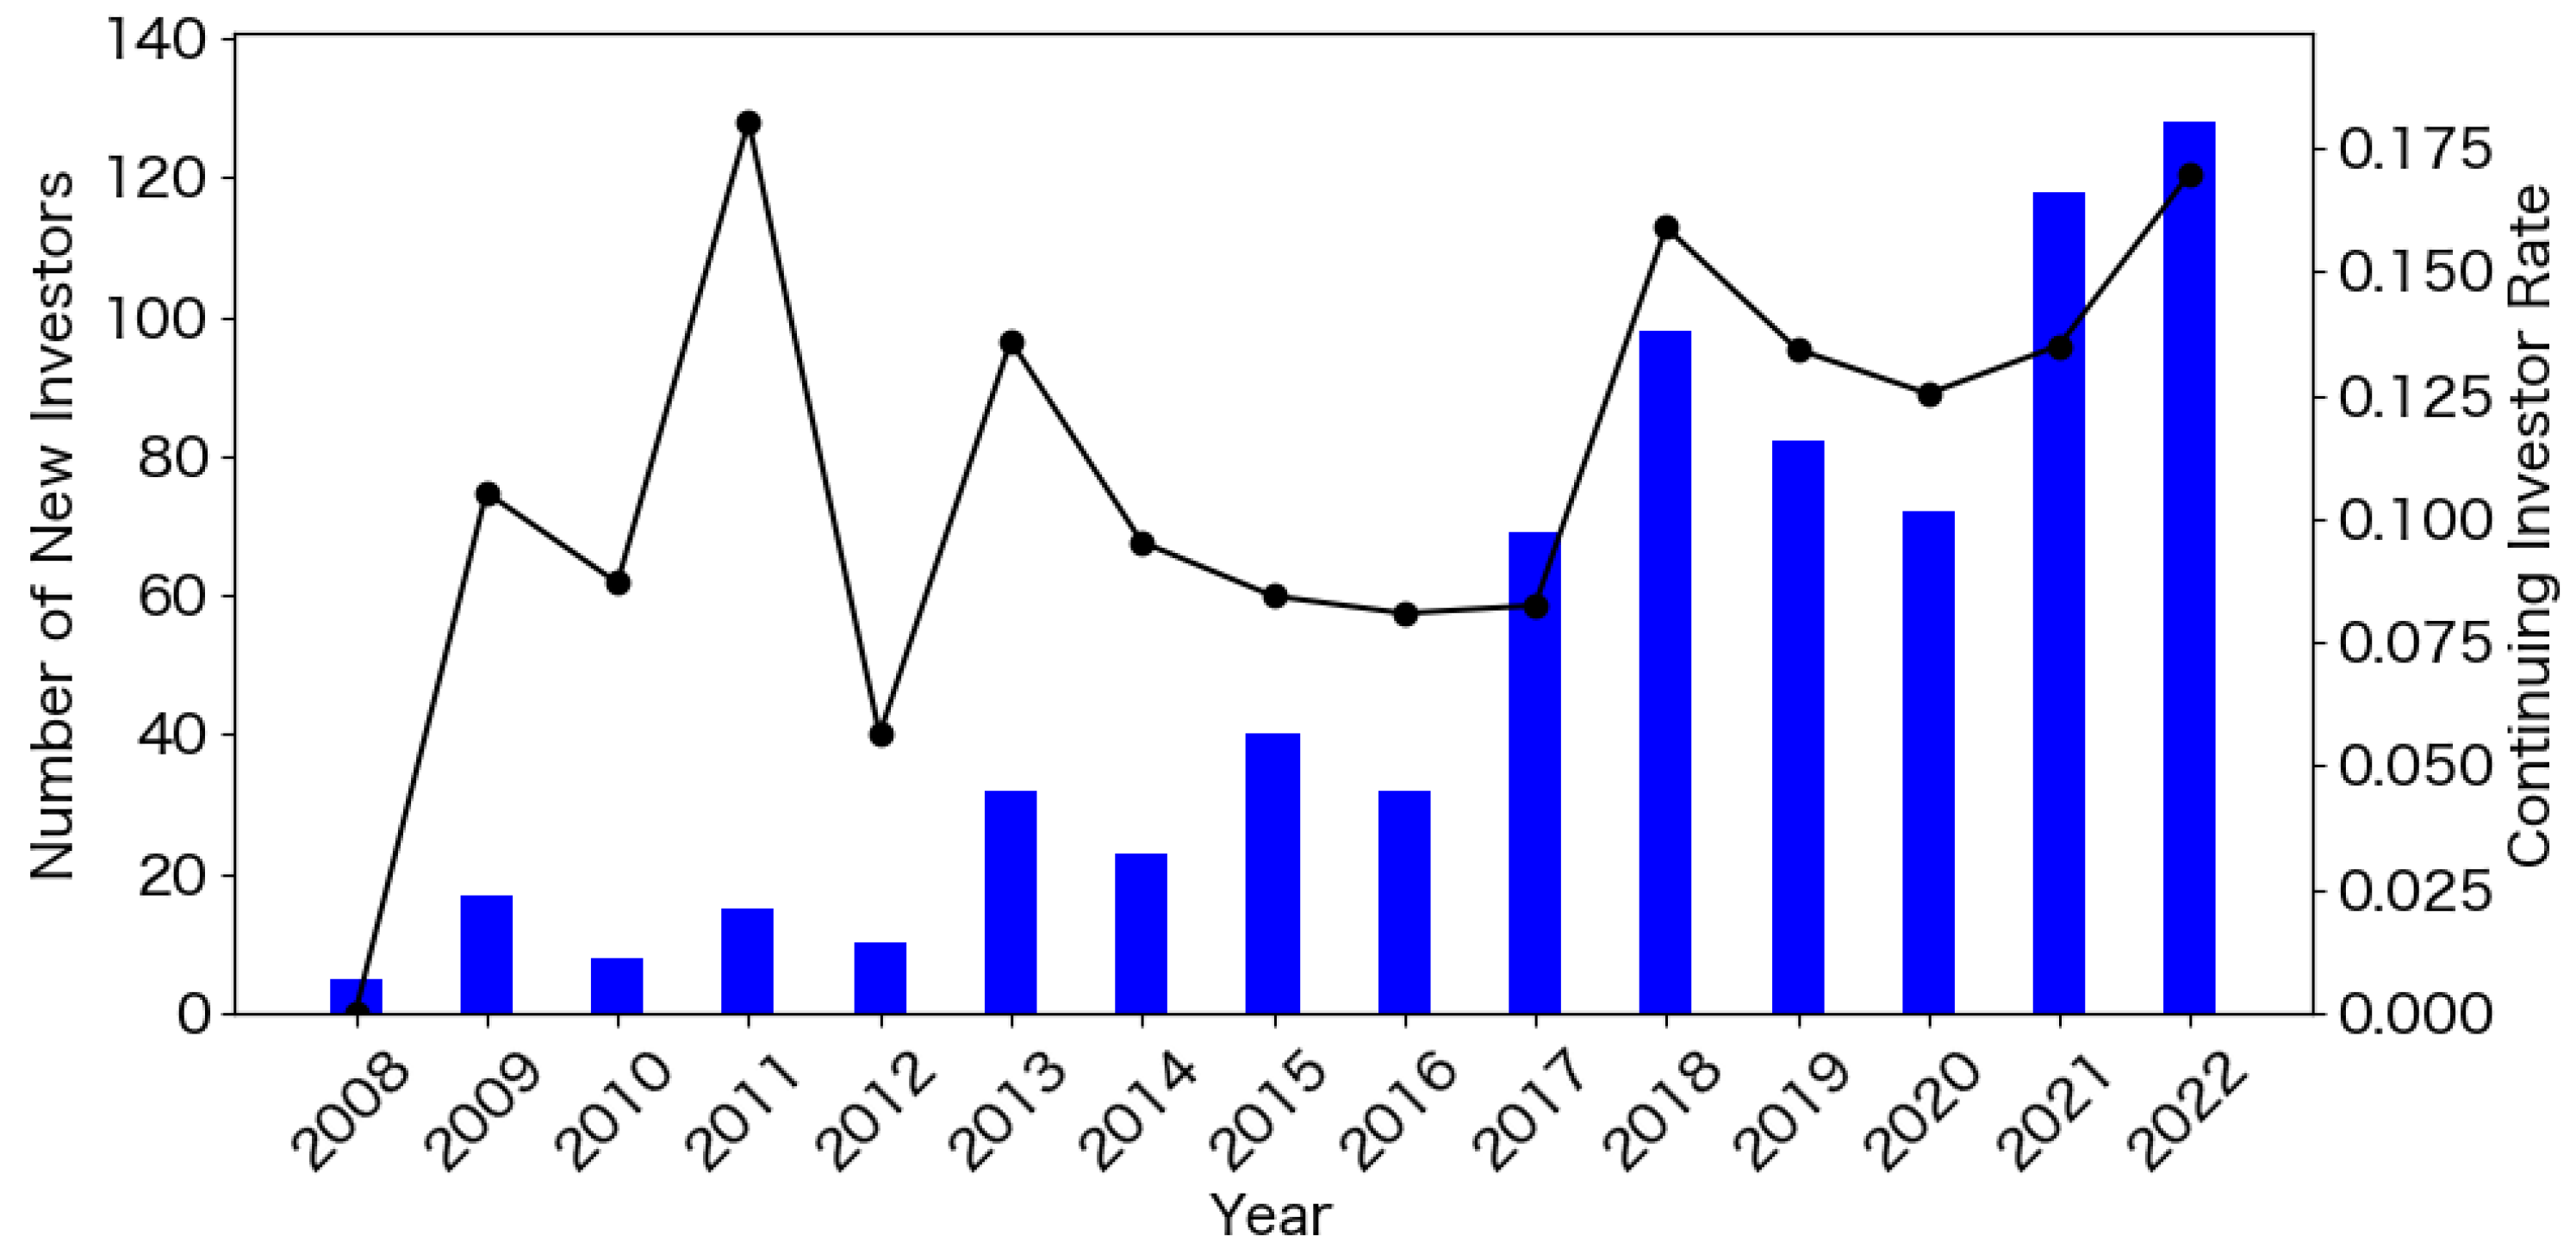
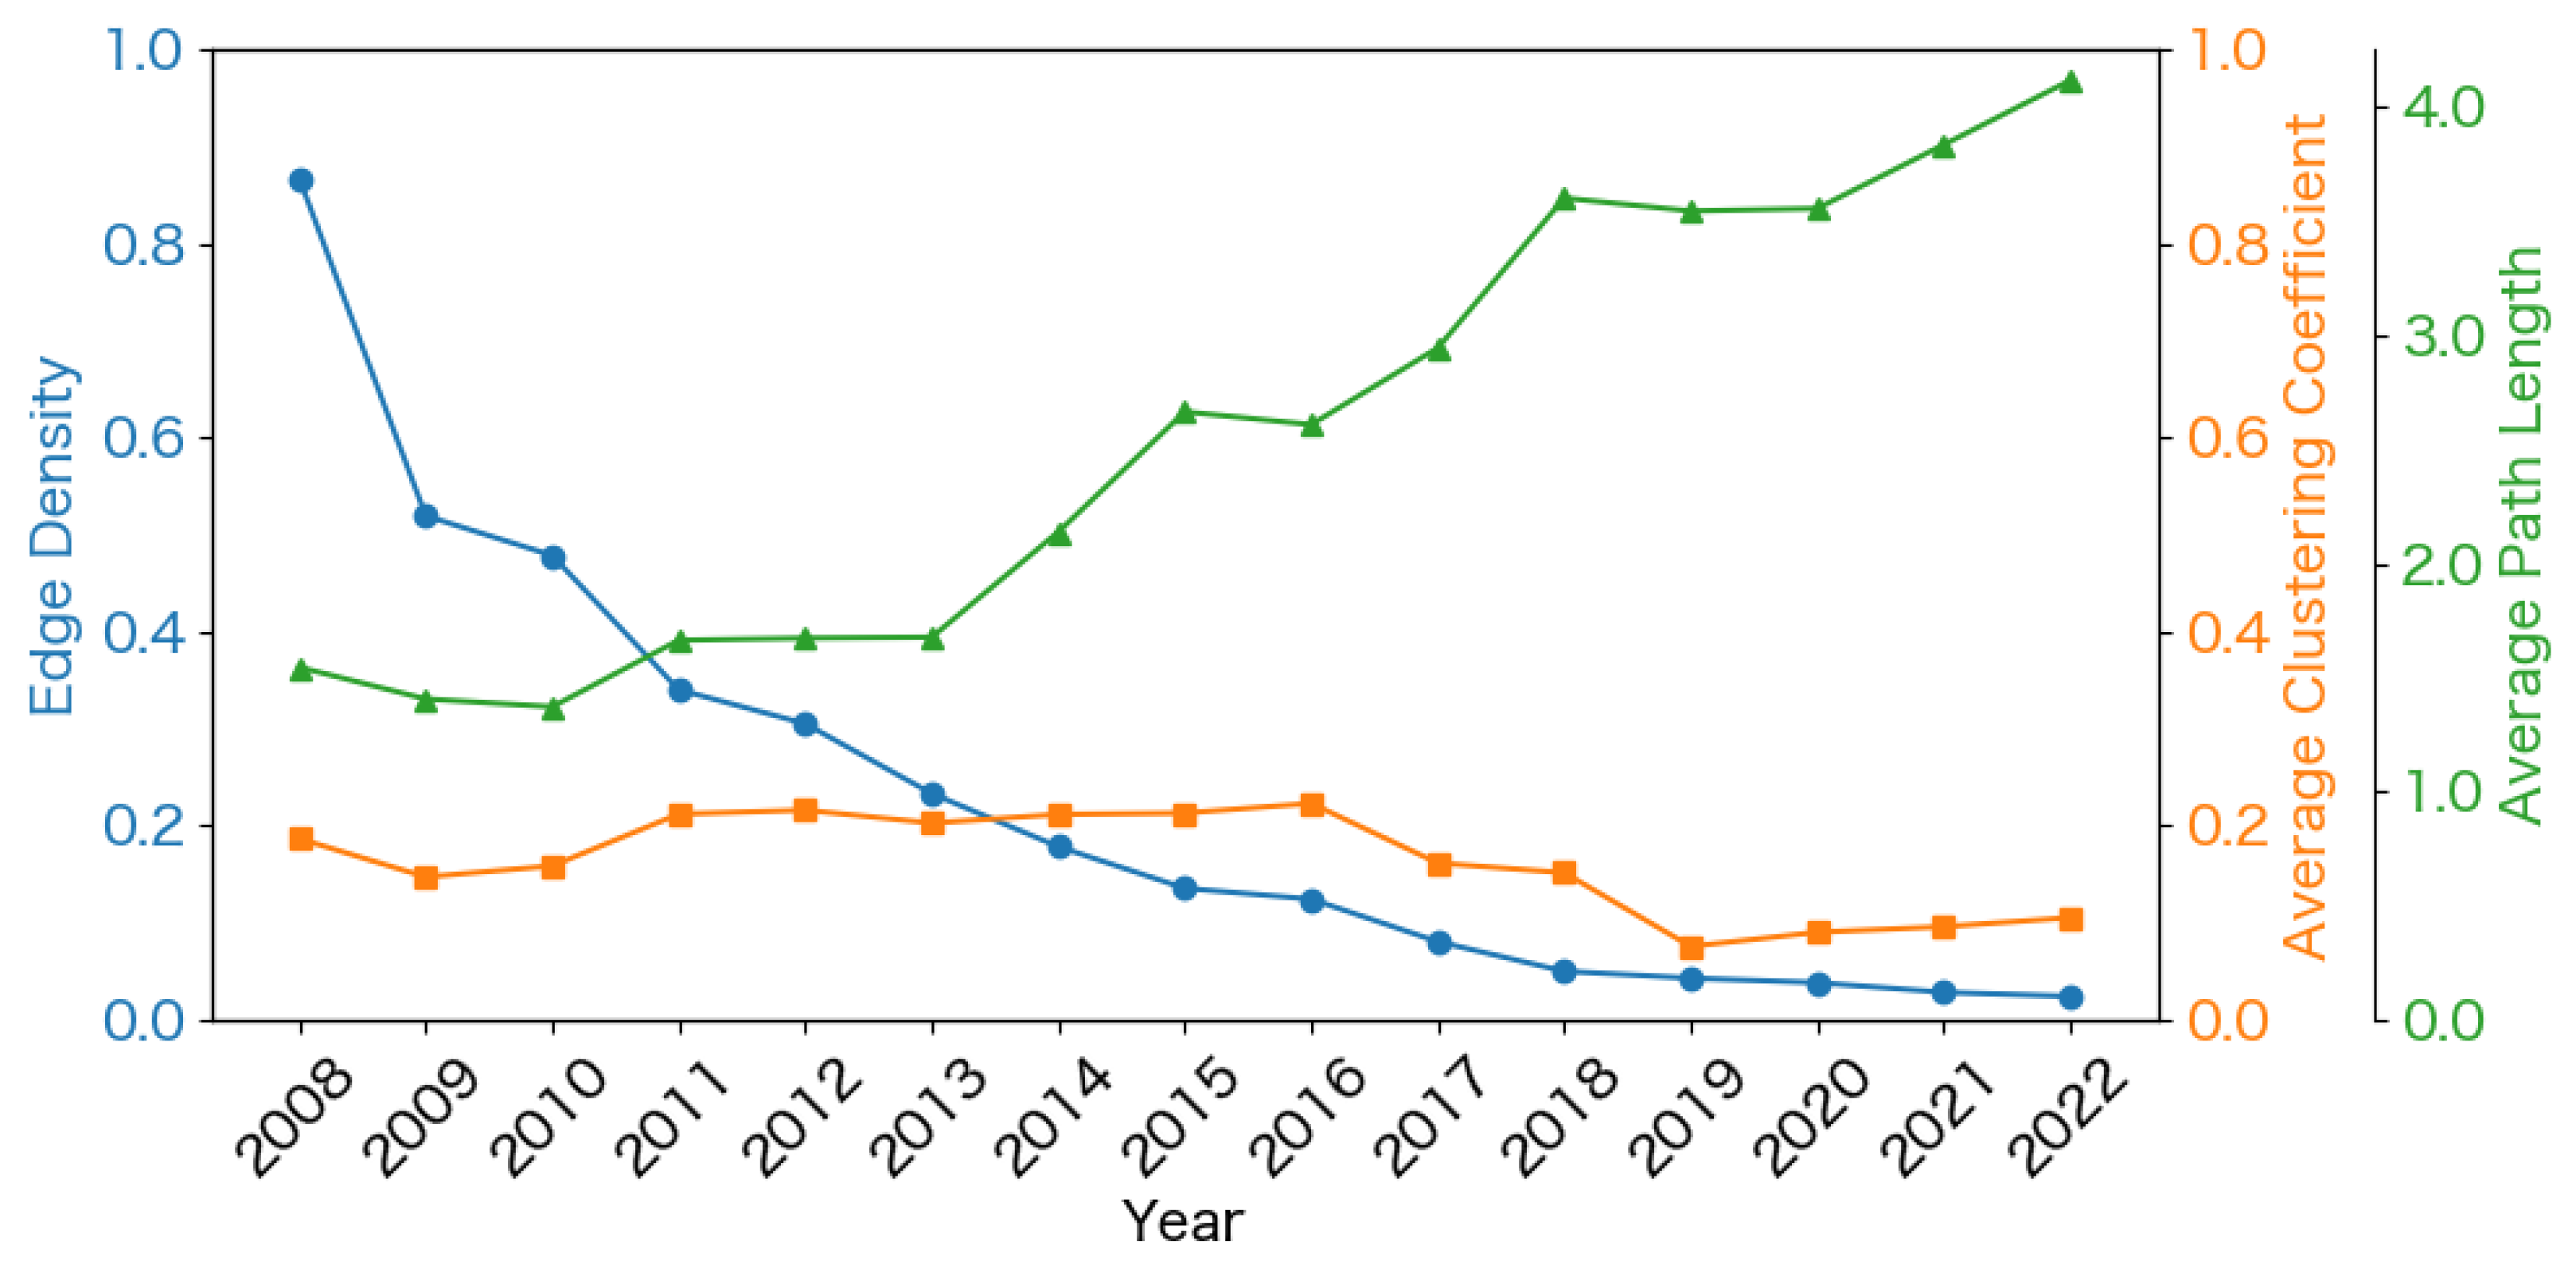
4.1. Historical Evolution of the CEET Investor Network

In this section, we analyzed the historical evolution of the CEET investor network. The growth of the network was analyzed in terms of the annual number of new investors and the continuing investor rate (Figure 2). The annual number of new investors was low until 2012 and increased between 2013 and 2018. The continuing investor rate decreased between 2013 and 2017 and increased in 2018. Both declined through 2020 before rising again.
The results of the network metrics are shown in Figure 3. The edge density decreased continuously during the observation period, indicating that the network became decentralized. The average path length remained stable until 2013, increased until 2018, and entered a phase of growth after 2019. The average clustering coefficient remained relatively stable until 2016 and then declined until 2019. These observations suggest high investor turnover due to the continuous entry and exit of investors in the CEET sector.
The small-world-ness S of the CEET sector remained relatively stable from 2013 to 2017, before increasing rapidly after 2019 (Figure 4). Looking at the other sectors, the small-world-ness S of the drug discovery sector has been growing since the mid-2010s, and the AI sector has been growing since the late 2010s, indicating general trends in the Japanese startup ecosystem.
Furthermore, to confirm the consistency of the observations, sensitivity analysis was conducted by changing the time window from five years to four and six years (Supplementary Figure S1). The network metrics showed consistent main patterns. For the small-world-ness S, although a decrease was observed in 2022 in the four-year time window, the main pattern was consistent.
The above discussion is supported by the three-window CEET investor network visualization (Figure 5). These temporal changes suggest the increasing maturity and complexity of the CEET investor network, from an early, closely connected network to a more decentralized network with many investors. In the next section, we analyze the role of various investors.

4.2. The Characteristics of the Diverse Investors

In this section, we aim to understand the characteristics of the CEET investor network and the diverse investors there. To examine the interconnections among the diverse investors, we analyzed the basic structural properties of the investor networks. The results showed a decreasing degree distribution from the upper left (a) and a scattered and increasing degree correlation distribution from the lower left (b) (Figure 6). Across all the tech sectors, we observed a hierarchical structure consisting of a small number of highly connected nodes and a large number of small-degree nodes.
The scale-free parameter α was estimated for a detailed understanding of the structural characteristics (Table 1). The results revealed that the α values for all three sectors (CEET (2.94), drug discovery (2.77), and AI (2.64)) were within the range of typical scale-free networks (2–3), although they deviated from the theoretical power-law distribution in the Kolmogorov–Smirnov test. In particular, the number of high-degree nodes was smaller than the number predicted by the power-law model.
Next, we focus on the CEET investor network to understand the roles of the diverse investors related to these network characteristics. We calculated the centrality measures for each investor type (Table 2). The results showed that VCs consistently exhibited the highest values for all centrality measures. GVCs had the second highest mean values for betweenness centrality and eigenvector centrality. CVCs and Other Financials showed moderate values. The “Others” type showed comparatively low mean values.
Statistical tests of these centrality measures revealed significant differences among investor types (Table 3). Neither the normality nor the homogeneity assumptions were met; therefore, we employed the Kruskal–Wallis test. The results revealed significant differences among investor types for all centrality measures (p < 0.01). The effect size, as measured based on the square of epsilon, was moderate, explaining about 0.107 to 0.163 of the variability in the centrality measures. The results of Dunn’s test, which analyzes differences between pairs of investor types, revealed that VCs were significantly different from CVCs and Others in all centrality measures and that VCs were different from Other Financials in all measures except degree centrality. In addition, GVCs were found to be significantly different from Others in betweenness centrality. The statistically significant differences between VCs and other investor types in many cases indicate that VCs have a structurally unique position in the CEET investor network, suggesting different roles for each type of investor.

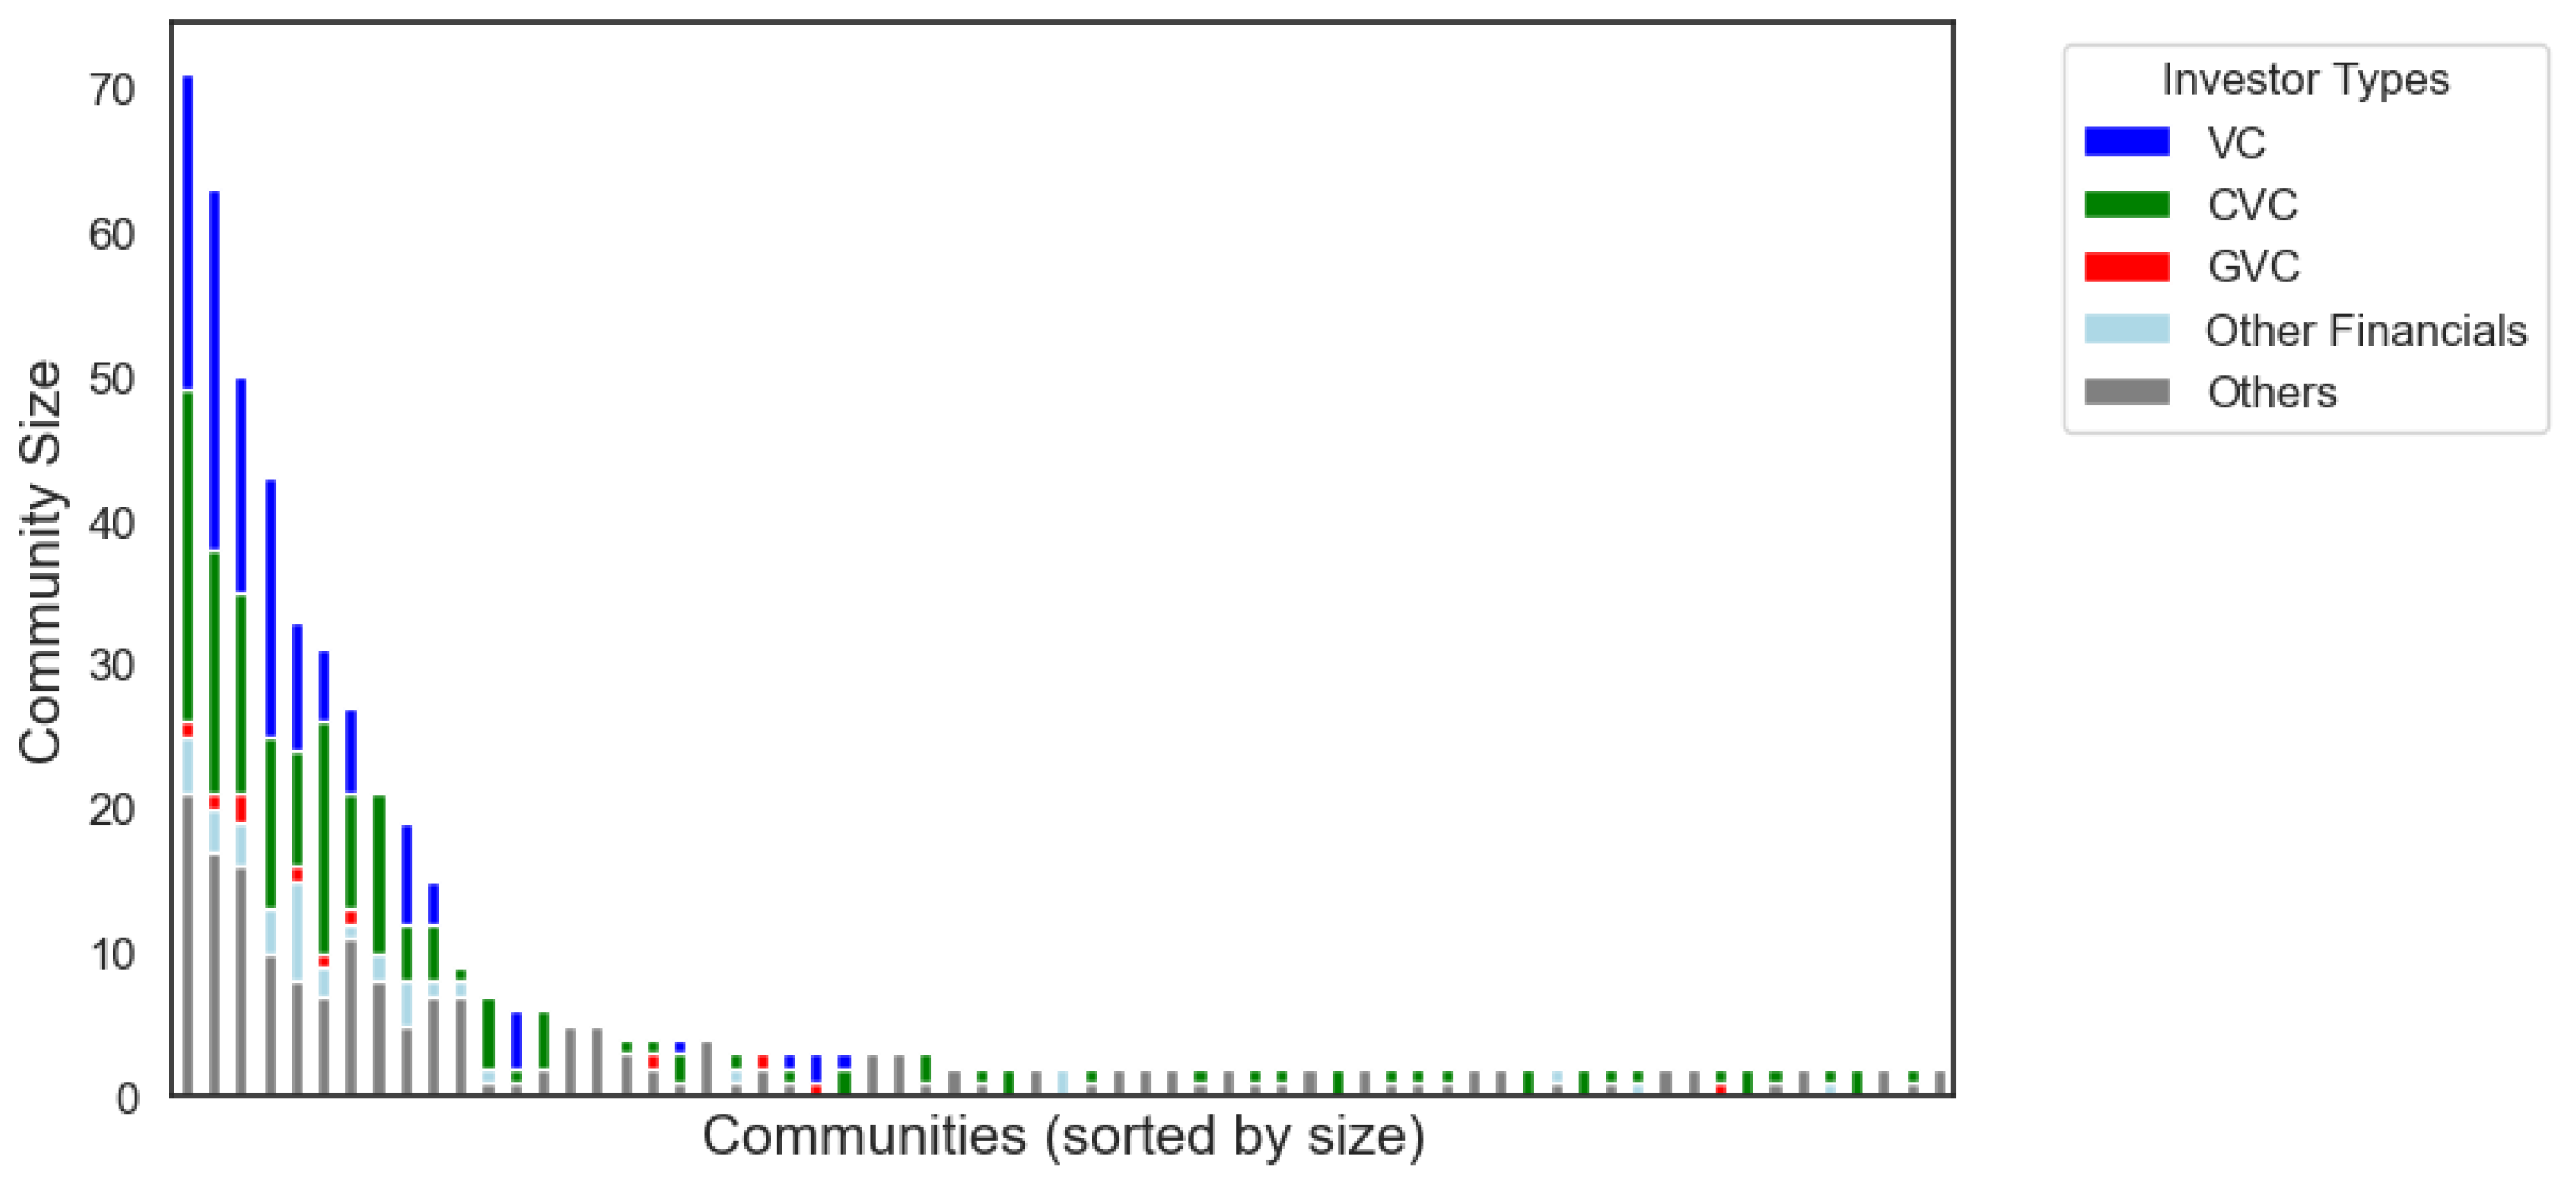
4.3. Community Analysis to Understand the Role of GVCs

In this section, we conducted a community analysis to gain a deeper understanding of the role of GVCs. A total of 65 communities were detected in the CEET investor network (2008–2022). The distribution of community sizes is shown on the vertical axis, which represents the number of investors in each community (Figure 7). A small number of large communities and a large number of small communities were observed. Figure 8 shows the composition of the community members of the CEET investor network
To understand the distribution of GVCs in communities, the size of GVC communities was analyzed (Table 4). The results revealed that GVC communities were larger than non-GVC communities. All communities were categorized as GVC communities (with at least one GVC investor) and non-GVC communities; 10 GVC communities and 55 non-GVC communities were identified in CEET. GVC communities were much larger than non-GVC communities, with a higher mean (28.70 vs. 4.33) and median (29.00 vs. 2.00). Nine communities contained one GVC, while there was one community that contained two GVCs. The results of a non-parametric Mann–Whitney U test comparing GVC and non-GVC communities revealed a statistically significant difference in the sizes of GVC and non-GVC communities in CEET (U = 466.5, p < 0.001).
To understand the role that investor types play in different communities, we calculated the cross-community bridging score in CEET (Figure 9, Table 5). This score was calculated for each investor type and for each community; a higher score indicates that a given investor type has more connections with nodes outside its own community. VCs (mean = 2.588, median = 2.0) and GVCs (mean = 2.250, median = 0.5) had relatively high scores. The results of the non-parametric Kruskal–Wallis test in Table S1 showed significant differences among investor types (p < 0.01). Dunn’s test also showed significant differences between VC and CVC (p = 0.003) and between VC and Others (p < 0.001), as well as between Other Financials and Others (p = 0.037).
To further analyze the bridging roles of investor types, we calculated the participation coefficient (Figure 10 and Table 6). This coefficient is computed for each node. The value ranges from 0 to 1, and a higher value means that the node’s edges are evenly distributed across all communities. VCs showed the highest value (mean = 0.354, median = 0.408), followed by GVCs (mean = 0.309, median = 0.444). The results of the Kruskal–Wallis test showed that there were significant differences among investor types (p < 0.01) (Table S2). The results of Dunn’s test showed that VC was significantly different from CVC (p < 0.001), Others (p < 0.001), and Other Financials (p = 0.016). CVC was marginally significantly different from Others (p = 0.056). In the results of cross-community bridging scores and participation coefficients, VCs had the highest scores, and GVCs followed with relatively high scores, suggesting that these investor types have a role in connecting different communities in the CEET investor network.

5. Discussion and Conclusions

The purpose of this study was to explore diverse investors in the CEET investor network. Using Japanese CEET startup investors as a case study, we investigated the evolution of the investor network, the characteristics of the various investor types, and the role of GVCs. The understanding of the diverse investors contributes to expanding knowledge about mobilizing private capital and enhancing sustainable innovation.
From the analysis of CEET investor networks from 2008 to 2022, the development process of investor networks can be divided into three stages. In the context of Japan, the background of the changes in each stage is described as follows. This evolutionary path suggests that Japan’s CEET network had gradually evolved into a mature structure combining diversity and efficiency. This case highlights the importance of understanding investor networks from a temporal perspective.
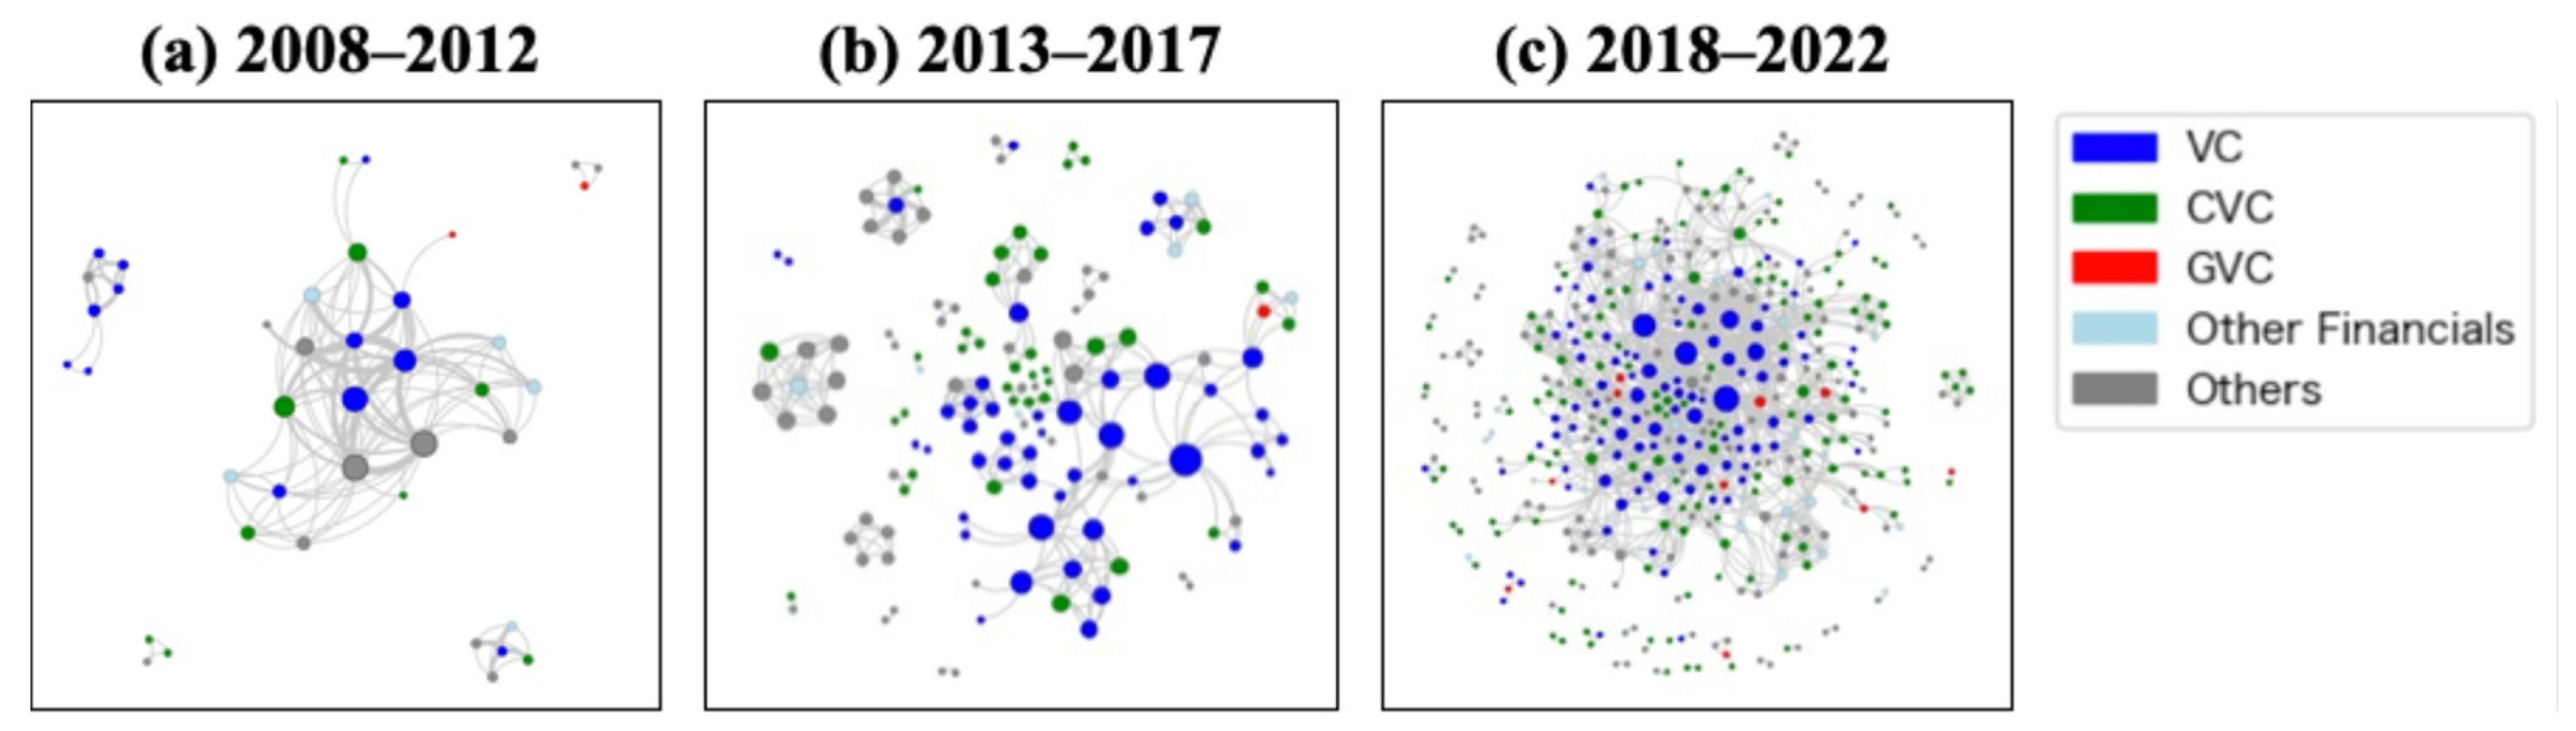
  • Formative stage: This stage corresponds to the period from 2008 to 2012. A close-knit network was formed, characterized by a comparatively small number of investors. From 2010 onwards, the entry of investors continued, and the first signs of network cohesion appeared. During this period, energy deregulation could be associated with an increase in startup entry [68]; however, the energy market had not yet been sufficiently open to investor entry.
  • Expansion and diversification stage: This stage corresponds to the period from 2013 to 2017. With the rapid growth of new investors, the CEET investor network has expanded and diversified. This growth trend was likely related to the total expansion of the Japanese startup investment market [19]. In addition, the rise of capital-intensive deep-tech startups may have increased the need for mutual collaboration among investors to allocate risk and secure funding.
  • Stable growth stage: This stage corresponds to the period 2018–2022. The investor network was growing steadily, and the efficiency of the network was continuously improving. During this period, not only was the Japanese startup investment market growing, but also the promotion of sector-specific transition policies and the global trend of rapid investment growth in climate tech [69] were likely to be associated with this trend. As VC funds specializing in decarbonization were established and partnered with GVCs and CVCs [70,71], more diverse investors entered the CEET sector.
This study aims to understand the various investor types based on structural characteristics and centrality measures. From the degree distribution and degree correlation results, high-degree nodes tend to preferentially connect with other high-degree nodes, suggesting the existence of hub investors. However, there tended to be fewer high-degree nodes than the theoretical power law distribution would predict. This could be explained by investors’ resource constraints and their strategies to maintain more selective relationships with a more reliable group of colleagues. The results of the centrality measures revealed that VCs have the strongest influence through their connections and ability to spread information in the CEET investor network. The non-VC investors are likely to have different investment motives in addition to the financial returns that VCs typically seek [72]. CVCs tend to emphasize strategic returns, such as business synergies and open innovation with their parent companies [73,74]. Therefore, CVCs are relatively less active in the network than VCs because they make more targeted investments based on corporate strategies. GVCs are influenced by public sector intentions such as environmental policy goals [75]. For this reason, GVCs can play a distinctive role in the network through longer-term investment activities. Other Financials may develop their investment strategies from their organizational missions, which may be why they are similar to CVCs in the investor network. The “Other” type includes a small number of investors with high values, suggesting that this type may include a wide variety of investors.
To understand the roles of GVCs, the findings from the community analysis indicated that GVCs were associated with larger community sizes. Furthermore, the results of the community bridging analysis suggested that both VCs and GVCs exhibited greater connecting capability than the other investor types. The findings regarding GVCs could be explained by two mechanisms: (1) GVCs’ expected long-term commitment and substantial financial resources make them attractive to private investors, creating incentives to cooperate with GVCs; and (2) GVCs provide signals to visualize and guarantee feasibility and reliability through investment, encouraging private investors to participate in their investments. GVCs benefit from syndication with private investors [76], but on the other hand, GVCs can mediate connections between private investors across the communities. Although the limitations of the sample size (11 GVCs) should be considered when interpreting the findings, the characteristics of GVCs in the investor network differ from those of other private investors.
From these observations, we can draw practical implications. The CEET investor network has changed over time, and different roles have been found for different investors. The investor network formed by the accumulated decisions of diverse investors is likely to be more resilient than more homogeneous networks. For example, even if VCs stop investing during financial recessions, other investors can fill the funding gap and prevent a slowdown in sustainable innovation. Policymakers should therefore encourage the diversification of investors and their cooperation with each other. This could include tax incentives for corporate investment, expanding the types of GVCs at each stage of innovation, and introducing mutual matching programs for new investors.
The study has several limitations. First, the scope of financing methods was limited to equity financing. Future studies would benefit from exploring other financing methods, such as public grants, crowdfunding, and venture debt. Second, the regional context focused on Japan. An analysis in different countries and regions would deepen the findings, especially the impacts of startup promotion policies and the role of GVCs. Third, our analysis did not include investment outcomes. Since the number of initial public offerings (IPOs) and mergers and acquisitions (M&As) in Japan was still limited [19,48] in the CEET sector, it would also be interesting to examine non-financial investment indicators and the innovation outcomes of portfolios. These are important future research spaces.
This study provides the first comprehensive analysis of the CEET investor network, using Japan as a case study, and clarifies the roles of its diverse investors. Since previous investor network studies have focused on VCs and sectors other than CEET, this study also contributes to extending these findings. The findings of this study provide valuable insights to advance both the theoretical understanding and practical implications for overcoming the CEET financing difficulties to address the climate change crisis. This study offers empirical evidence to support sufficient funding for sustainable innovation.

Supplementary Materials

The following supporting information can be downloaded at: https://www.mdpi.com/article/10.3390/su17104258/s1, Figure S1: Sensitivity analysis of the CEET investor network at different time windows; Table S1: Statistical analysis of differences in cross-community bridging scores for CEET; Table S2: Statistical analysis of differences in participation coefficients for CEET.

Author Contributions

Conceptualization, H.I., H.Y. and M.S.; methodology, H.I. and H.Y.; validation, H.I. and K.K.; formal analysis, H.I., K.K. and H.Y.; investigation, H.I. and K.K.; data curation, H.I. and K.K.; writing—original draft preparation, H.I.; writing—review and editing, H.I., K.K., H.Y., M.S. and K.T.; visualization, H.Y.; supervision, M.S. and K.T.; funding acquisition, K.T. All authors have read and agreed to the published version of the manuscript.

Funding

This research was funded by JST SPRING, grant number JPMJSP2108, and the Mohammed bin Salman Center for Future Science and Technology for Saudi-Japan Vision 2030 at the University of Tokyo (MbSC2030). The APC was funded by the University of Tokyo.

Institutional Review Board Statement

Not applicable.

Informed Consent Statement

Not applicable.

Data Availability Statement

This study used data from STARTUP DB (https://startup-db.com/) and the Speeda Startup Information Research platform (https://initial.inc/), accessed under commercial licenses and cooperative research agreements that restrict public access. Researchers interested in accessing these databases should contact the respective companies regarding licensing.

Acknowledgments

Data collection was supported by for Startups, Inc. (Tokyo, Japan). The previous versions of this research were presented at the 40th and 41st Conferences on Energy, Economy, and Environment of the Japan Society of Energy and Resources (JSER). We would like to thank K.I., R.I., A.A. and H.K. from Japanese startup support organizations for their valuable feedback.

Conflicts of Interest

The authors declare no conflicts of interest.

Abbreviations

CEETClean Energy and Environmental Technology
VCVenture Capital
CVCCorporate Venture Capital
GVCGovernmental Venture Capital
R&DResearch and Development
GHGGreenhouse Gas
SNASocial Network Analysis
METIMinistry of Economy, Trade and Industry
FITFeed-in Tariff
GXGreen Transformation
AIArtificial Intelligence
IPOInitial Public Offering
M&AMergers and Acquisitions

References

  1. Boons, F.; Montalvo, C.; Quist, J.; Wagner, M. Sustainable Innovation, Business Models and Economic Performance: An Overview. J. Clean. Prod. 2013, 45, 1–8. [Google Scholar] [CrossRef]
  2. Cillo, V.; Petruzzelli, A.M.; Ardito, L.; Del Giudice, M. Understanding Sustainable Innovation: A Systematic Literature Review. Corp. Soc. Responsib. Environ. Manag. 2019, 26, 1012–1025. [Google Scholar] [CrossRef]
  3. Anadon, L.D. Transforming U.S. Energy Innovation; Cambridge University Press: New York, NY, USA, 2014; ISBN 978-1-107-04371-8. [Google Scholar]
  4. Grubler, A.; Wilson, C. Energy Technology Innovation: Learning from Historical Successes and Failures; Cambridge University Press: Cambridge, UK; New York, NY, USA, 2013; ISBN 978-1-107-02322-2. [Google Scholar]
  5. Polzin, F. Addressing Barriers to Low-Carbon Innovation: Essays on Structures and Policies to Mobilise Private Finance; Peter Lang: Frankfurt am Main, Germany, 2015; ISBN 978-3-631-66981-5. [Google Scholar]
  6. Kreibiehl, S.; Jung, T.Y.; Battiston, S.; Carvajal, P.E.; Clapp, C.; Dasgupta, D.; Dube, N.; Jachnik, R.; Morita, K.; Samargandi, N.; et al. Investment and Finance. In IPCC Climate Change 2022: Mitigation of Climate Change. Contribution of Working Group III to the Sixth Assessment Report of the Intergovernmental Panel on Climate Change; Cambridge University Press: Cambridge, UK; New York, NY, USA, 2022; ISBN 978-1-00-915792-6. [Google Scholar]
  7. Gaddy, B.E.; Sivaram, V.; Jones, T.B.; Wayman, L. Venture Capital and Cleantech: The Wrong Model for Energy Innovation. Energy Policy 2017, 102, 385–395. [Google Scholar] [CrossRef]
  8. Ivashina, V.; Lerner, J. Patient Capital: The Challenges and Promises of Long-Term Investing; Princeton University Press: Princeton, NJ, USA, 2019; ISBN 978-0-691-21708-6. [Google Scholar]
  9. Berger, M.; Dechezleprêtre, A.; Fadic, M. What Is the Role of Government Venture Capital for Innovation-Driven Entrepreneurship? OECD Science, Technology and Industry Working Papers, No. 2024/10; OECD Publishing: Paris, France, 2024. [Google Scholar] [CrossRef]
  10. Ghosh, S.; Nanda, R. Venture Capital Investment in the Clean Energy Sector. 2010. Available online: https://www.hbs.edu/ris/Publication%20Files/11-020_0a1b5d16-c966-4403-888f-96d03bbab461.pdf (accessed on 29 March 2025).
  11. Goldstein, A.; Doblinger, C.; Baker, E.; Anadón, L.D. Patenting and Business Outcomes for Cleantech Startups Funded by the Advanced Research Projects Agency-Energy. Nat. Energy 2020, 5, 803–810. [Google Scholar] [CrossRef]
  12. van den Heuvel, M.; Popp, D. The Role of Venture Capital and Governments in Clean Energy: Lessons from the First Cleantech Bubble. Energy Econ. 2023, 124, 106877. [Google Scholar] [CrossRef]
  13. Nicholas, T. VC: An American History; Harvard University Press: Cambridge, MA, USA, 2019; ISBN 978-0-674-98800-2. [Google Scholar]
  14. Hopp, C. When Do Venture Capitalists Collaborate? Evidence on the Driving Forces of Venture Capital Syndication. Small Bus. Econ. 2010, 35, 417–431. [Google Scholar] [CrossRef]
  15. Lockett, A.; Wright, M. The Syndication of Venture Capital Investments. Omega 2001, 29, 375–390. [Google Scholar] [CrossRef]
  16. Barabási, A.-L. Network Science; Cambridge University Press: Cambridge, UK; New York, NY, USA,, 2016; ISBN 978-1-107-07626-6. [Google Scholar]
  17. Wang, D.; Barabási, A.-L. The Science of Science, 1st ed.; Cambridge University Press: Cambridge, UK, 2021; ISBN 978-1-108-61083-4. [Google Scholar]
  18. Ministry of Economy, Trade and Industry (METI). Japan Startup Ecosystem 2024; Ministry of Economy, Trade and Industry: Tokyo, Japan, 2024; Available online: https://www.meti.go.jp/policy/newbusiness/global_promotion.pdf (accessed on 29 March 2025).
  19. Venture Enterprise Center (VEC). VEC YEARBOOK 2022 (Annual Report on Japanese Startup Businesses); Venture Enterprise Center: Tokyo, Japan, 2024; Available online: https://www.vec.or.jp/vec-whitepaper (accessed on 29 March 2025).
  20. Satz, E. Why Time Horizon Matters: The Key To Successful Venture Capital Investing. Available online: https://www.forbes.com/councils/forbesfinancecouncil/2024/12/05/why-time-horizon-matters-the-key-to-successful-venture-capital-investing/ (accessed on 13 March 2025).
  21. Cornelli, G.; Frost, J.; Gambacorta, L.; Merrouche, O. Climate Tech 2.0: Social Efficiency versus Private Returns; BIS Working Papers No. 1072; Bank for International Settlements: Basel, Switzerland, 2023; Available online: https://www.bis.org/publ/work1072.htm (accessed on 29 March 2025).
  22. PwC State of Climate Tech 2024. PwC. 2024. Available online: https://www.pwc.com/gx/en/issues/esg/climate-tech-investment-adaptation-ai.html (accessed on 29 March 2025).
  23. PwC State of Climate Tech 2021. PwC. 2021. Available online: https://www.pwc.com/gx/en/services/sustainability/publications/state-of-climate-tech.html (accessed on 29 March 2025).
  24. Migendt, M.; Polzin, F.; Schock, F.; Täube, F.A.; Von Flotow, P. Beyond Venture Capital: An Exploratory Study of the Finance-Innovation-Policy Nexus in Cleantech. Ind. Corp. Change 2017, 26, 973–996. [Google Scholar] [CrossRef]
  25. Polzin, F.; Sanders, M.; Täube, F. A Diverse and Resilient Financial System for Investments in the Energy Transition. Curr. Opin. Environ. Sustain. 2017, 28, 24–32. [Google Scholar] [CrossRef]
  26. Polzin, F. Mobilizing Private Finance for Low-Carbon Innovation—A Systematic Review of Barriers and Solutions. Renew. Sustain. Energy Rev. 2017, 77, 525–535. [Google Scholar] [CrossRef]
  27. Wyne, J. How To Fund High-Impact Climate Innovations. Available online: https://www.forbes.com/sites/jamilwyne/2024/07/24/how-to-fund-high-impact-climate-innovations/ (accessed on 13 March 2025).
  28. Du, Q.; Li, Z.; Du, M.; Yang, T. Government Venture Capital and Innovation Performance in Alternative Energy Production: The Moderating Role of Environmental Regulation and Capital Market Activity. Energy Econ. 2024, 129, 107196. [Google Scholar] [CrossRef]
  29. Owen, R. Lessons From Government Venture Capital Funds to Enable Transition to a Low-Carbon Economy: The U.K. Case. IEEE Trans. Eng. Manag. 2023, 70, 1040–1054. [Google Scholar] [CrossRef]
  30. Kirihata, T. Japanese Government Venture Capital: What Should We Know? Asia Pac. J. Innov. Entrep. 2018, 12, 14–31. [Google Scholar] [CrossRef]
  31. Bygrave, W.D. The Structure of the Investment Networks of Venture Capital Firms. J. Bus. Ventur. 1988, 3, 137–157. [Google Scholar] [CrossRef]
  32. Abell, P.; Nisar, T.M. Performance Effects of Venture Capital Firm Networks. Manag. Decis. 2007, 45, 923–936. [Google Scholar] [CrossRef]
  33. Ferrary, M.; Granovetter, M. The Role of Venture Capital Firms in Silicon Valley’s Complex Innovation Network. Econ. Soc. 2009, 38, 326–359. [Google Scholar] [CrossRef]
  34. Hochberg, Y.V.; Ljungqvist, A.; Lu, Y. Whom You Know Matters: Venture Capital Networks and Investment Performance. J. Financ. 2007, 62, 251–301. [Google Scholar] [CrossRef]
  35. Carniel, T.; Halloy, J.; Dalle, J.-M. A Novel Clustering Approach to Bipartite Investor-Startup Networks. PLoS ONE 2023, 18, e0279780. [Google Scholar] [CrossRef]
  36. Gu, W.; Yang, A.; Lu, L.; Li, R. Unveiling Latent Structure of Venture Capital Syndication Networks. Entropy 2022, 24, 1506. [Google Scholar] [CrossRef]
  37. Jin, Y.; Zhang, Q.; Li, S.-P. Topological Properties and Community Detection of Venture Capital Network: Evidence from China. Phys. Stat. Mech. Its Appl. 2016, 442, 300–311. [Google Scholar] [CrossRef]
  38. Luo, X.; Yin, J.; Jiang, H.; Wei, D.; Xia, R.; Ding, Y. Venture Capital Syndication Network Structure of Public Companies: Robustness and Dynamic Evolution, China. Systems 2023, 11, 302. [Google Scholar] [CrossRef]
  39. Yao, Q.; Ma, S.; Liang, J.; Christensen, K.; Jing, W.; Li, R. Syndication Network Associates with Specialisation and Performance of Venture Capital Firms. J. Phys. Complex. 2023, 4, 025016. [Google Scholar] [CrossRef]
  40. Zhang, R.; McCarthy, K.J.; Wang, X.; Tian, Z. How Does Network Structure Impact Follow-On Financing through Syndication? Evidence from the Renewable Energy Industry. Sustainability 2021, 13, 4050. [Google Scholar] [CrossRef]
  41. Polzin, F. Venture Capital Investments in Cleantech Startups. In The Palgrave Encyclopedia of Private Equity; Cumming, D., Hammer, B., Eds.; Springer International Publishing: Cham, Switzerland, 2024; pp. 1–6. ISBN 978-3-030-38738-9. [Google Scholar]
  42. Ministry of Economy, Trade and Industry (METI). The 5th Strategic Energy Plan; Ministry of Economy, Trade and Industry: Tokyo, Japan, July 2018. Available online: https://www.enecho.meti.go.jp/en/category/others/basic_plan/ (accessed on 29 March 2025).
  43. Takeuchi, J.; Ito, T.; Okamoto, H.; Toda, N. The Energy Industry 2050: Game Change to Utility 3.0; Nikkei BP: Tokyo, Japan, 2017. [Google Scholar]
  44. Kuramochi, T. Review of Energy and Climate Policy Developments in Japan before and after Fukushima. Renew. Sustain. Energy Rev. 2015, 43, 1320–1332. [Google Scholar] [CrossRef]
  45. Tokyo Electric Power Company Holdings, Inc.; TEPCO Ventures, Inc. TEPCO Establishes Subsidiary to Turn New Businesses into Venture Companies—For Faster and More Effective Response to Deregulation and Other Market Changes. Available online: https://www.tepco.co.jp/en/hd/newsroom/press/archives/2018/180627-01-e.html (accessed on 28 March 2025).
  46. Cabinet Secretariat of Japan. Basic Policy for the Realization of Green Transformation: Roadmap for the Next 10 Years; Cabinet Secretariat: Tokyo, Japan, 2023; Available online: https://www.cas.go.jp/jp/seisaku/gx_jikkou_kaigi/pdf/kihon_en.pdf (accessed on 29 March 2025).
  47. Uzabase, Inc. Japan Startup Finance 2018; Uzabase, Inc.: Tokyo, Japan, 2019. [Google Scholar]
  48. Uzabase, Inc. Japan Startup Finance 2022; Uzabase, Inc.: Tokyo, Japan, 2023. [Google Scholar]
  49. Cabinet Secretariat of Japan. Startup Development Five-Year Plan; Cabinet Secretariat: Tokyo, Japan, 2022; Available online: https://www.cas.go.jp/jp/seisaku/atarashii_sihonsyugi/pdf/sdfyplan2022en.pdf (accessed on 29 March 2025).
  50. Kennedy, K.M.; Edwards, M.R.; Doblinger, C.; Thomas, Z.H.; Borrero, M.A.; Williams, E.D.; Hultman, N.E.; Surana, K. The Effects of Corporate Investment and Public Grants on Climate and Energy Startup Outcomes. Nat. Energy 2024, 9, 883–893. [Google Scholar] [CrossRef]
  51. Krishna, H.; Kashyap, Y.; Dutt, D.; Sagar, A.D.; Malhotra, A. Understanding India’s Low-Carbon Energy Technology Startup Landscape. Nat. Energy 2023, 8, 94–105. [Google Scholar] [CrossRef]
  52. Uzabase, Inc. Speeda Startup Information Research. Available online: https://initial.inc/ (accessed on 16 July 2024).
  53. For Startups, Inc. STARTUP DB. Available online: https://startup-db.com/ (accessed on 17 April 2023).
  54. Anai, H.; Shibazaki, R. Study on Startups Ecosystem Aggregation in Tokyo 23 Ward: Analysis of Co-Aggregation Using Bivariate Local Moran Statistics. J. City Plan. Inst. Jpn. 2020, 55, 1055–1062. [Google Scholar] [CrossRef]
  55. Kutsuna, K. Current Status of Startups in the Kansai Region. Kokumin Keizai Zasshi J. Econ. Bus. Adm. 2022, 226, 1–10. [Google Scholar] [CrossRef]
  56. HolonIQ. 2023 Global Climate Tech Outlook. Available online: https://www.holoniq.com/notes/2023-global-climate-tech-outlook (accessed on 29 March 2025).
  57. Barrat, A.; Barthélemy, M.; Pastor-Satorras, R.; Vespignani, A. The Architecture of Complex Weighted Networks. Proc. Natl. Acad. Sci. USA 2004, 101, 3747–3752. [Google Scholar] [CrossRef]
  58. Humphries, M.D.; Gurney, K. Network ‘Small-World-Ness’: A Quantitative Method for Determining Canonical Network Equivalence. PLoS ONE 2008, 3, e0002051. [Google Scholar] [CrossRef]
  59. Watts, D.J.; Strogatz, S.H. Collective Dynamics of ‘Small-World’ Networks. Nature 1998, 393, 440–442. [Google Scholar] [CrossRef] [PubMed]
  60. Clauset, A.; Shalizi, C.R.; Newman, M.E.J. Power-Law Distributions in Empirical Data. SIAM Rev. 2009, 51, 661–703. [Google Scholar] [CrossRef]
  61. Esposito, C.; Gortan, M.; Testa, L.; Chiaromonte, F.; Fagiolo, G.; Mina, A.; Rossetti, G. Venture Capital Investments through the Lens of Network and Functional Data Analysis. Appl. Netw. Sci. 2022, 7, 42. [Google Scholar] [CrossRef]
  62. Yamano, H.; Asatani, K.; Sakata, I. Evaluating Nodes of Latent Mediators in Heterogeneous Communities. Sci. Rep. 2020, 10, 8456. [Google Scholar] [CrossRef]
  63. Landherr, A.; Friedl, B.; Heidemann, J. A Critical Review of Centrality Measures in Social Networks. Bus. Inf. Syst. Eng. 2010, 2, 371–385. [Google Scholar] [CrossRef]
  64. Girvan, M.; Newman, M.E.J. Community Structure in Social and Biological Networks. Proc. Natl. Acad. Sci. USA 2002, 99, 7821–7826. [Google Scholar] [CrossRef]
  65. Blondel, V.D.; Guillaume, J.-L.; Lambiotte, R.; Lefebvre, E. Fast Unfolding of Communities in Large Networks. J. Stat. Mech. Theory Exp. 2008, 2008, P10008. [Google Scholar] [CrossRef]
  66. Danon, L.; Díaz-Guilera, A.; Duch, J.; Arenas, A. Comparing Community Structure Identification. J. Stat. Mech. Theory Exp. 2005, 2005, P09008. [Google Scholar] [CrossRef]
  67. Guimerà, R.; Nunes Amaral, L.A. Functional Cartography of Complex Metabolic Networks. Nature 2005, 433, 895–900. [Google Scholar] [CrossRef]
  68. Romero, T. As Japan Deregulates Electricity, This Startup Lets Consumers Compare Suppliers. Available online: https://www.techinasia.com/talk/yohei-kiguchi-enechange (accessed on 25 March 2025).
  69. PwC State of Climate Tech 2023. PwC. 2023. Available online: https://www.pwc.com/gx/en/issues/esg/state-of-climate-tech-2023-investment.html (accessed on 29 March 2025).
  70. Japan Investment Corporation. JIC Makes LP Investment in ANRI-GREEN No.1 2022. 2022. Available online: https://www.j-ic.co.jp/en/news/.assets/E_20220126_JIC_PressRelease.pdf (accessed on 27 April 2025).
  71. Segal, M. Mitsubishi Launches $1 Billion Climate Tech Growth Fund. Available online: https://www.esgtoday.com/mitsubishi-launches-1-billion-climate-tech-growth-fund/ (accessed on 25 March 2025).
  72. Gompers, P.A.; Lerner, J. The Venture Capital Cycle; MIT Press: Cambridge, MA, USA, 2004; ISBN 978-0-262-07255-7. [Google Scholar]
  73. Fels, G.; Kronberger, M.; Gutmann, T. Revealing the Underlying Drivers of CVC Performance—A Literature Review and Research Agenda. Ventur. Cap. 2021, 23, 67–109. [Google Scholar] [CrossRef]
  74. Hibara, N. Modeling New Categories of CVC Investments. Waseda Bull. Int. Manag. 2016, 47, 83–88. [Google Scholar]
  75. Bianchini, R.; Croce, A. The Role of Environmental Policies in Promoting Venture Capital Investments in Cleantech Companies. Rev. Corp. Financ. 2022, 2, 587–616. [Google Scholar] [CrossRef]
  76. Alperovych, Y.; Groh, A.; Quas, A. Bridging the Equity Gap for Young Innovative Companies: The Design of Effective Government Venture Capital Fund Programs. Res. Policy 2020, 49, 104051. [Google Scholar] [CrossRef]
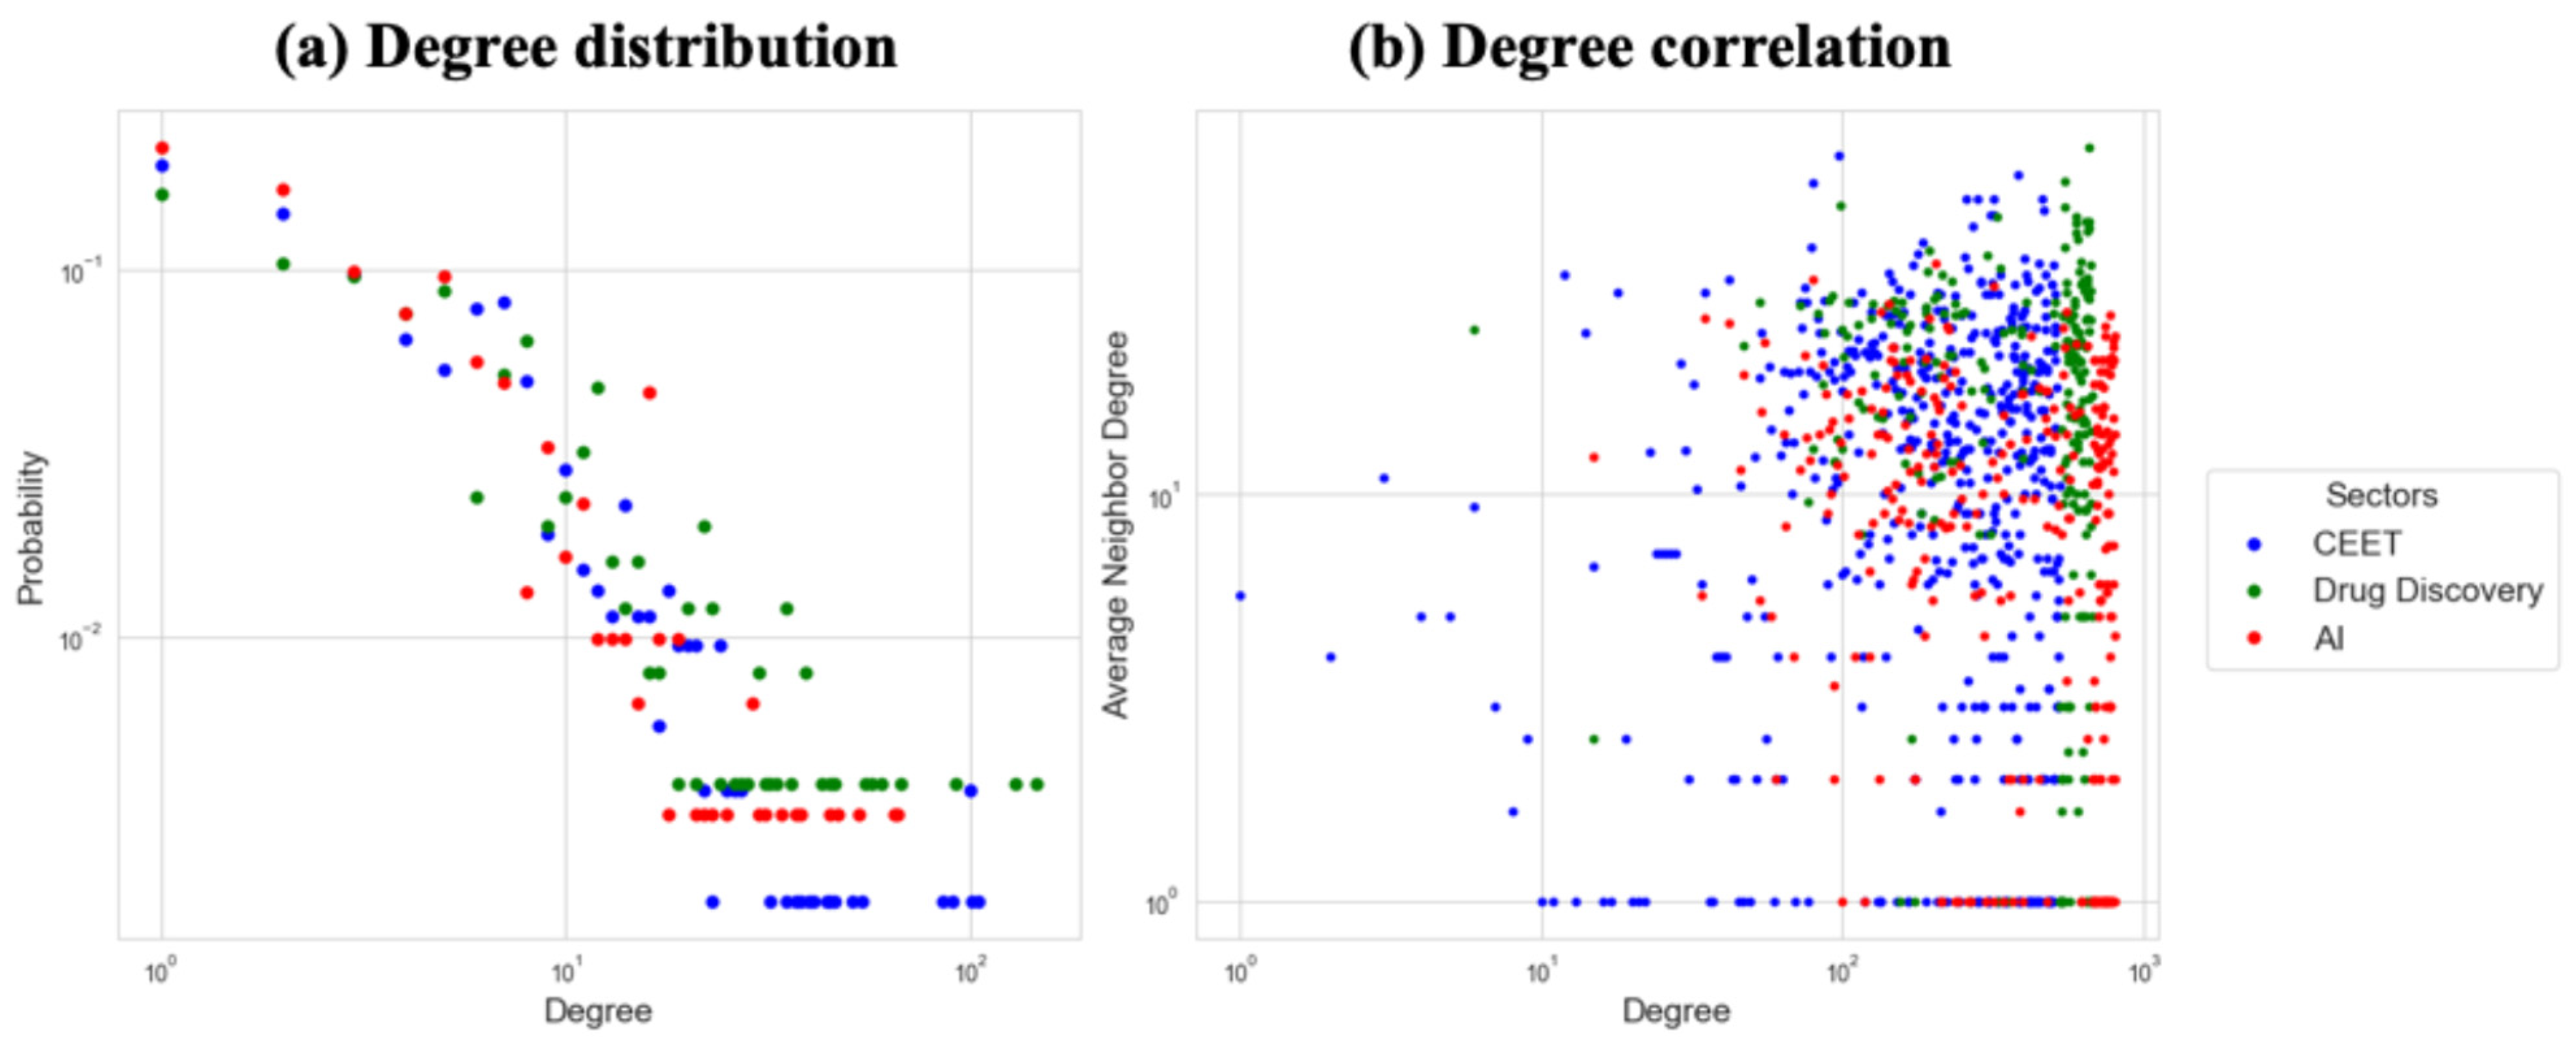
Figure 1. Annual investment amounts (in billions of Japanese Yen) and deal counts in the CEET sector. Blue bar shows the annual investment amounts and red line shows the annual deal counts.
Sustainability 17 04258 g001
Figure 2. Annual number of new investors and continuing investor rate of the CEET investor network. Blue bar shows the annual number of new investors and black line shows the continuing investor rate.
Sustainability 17 04258 g002
Figure 3. Edge density, average clustering coefficient, and average path length of the CEET investor network. The calculation was performed using a time window of the last five years from the target year.
Sustainability 17 04258 g003
Figure 4. A comparison of small-world-ness S across the tech sectors.
Sustainability 17 04258 g004
Figure 5. The CEET investor networks for three timeframes: (a) 2008–2012, (b) 2013–2017, and (c) 2018–2022. The size of the nodes represents the degrees, and the color represents the investor types. The thickness of the edges represents the edge weights. The force-directed layout was used, and isolated nodes were excluded. The networks are shown at different scales because their size varies in each timeframe.
Sustainability 17 04258 g005
Figure 6. Degree distribution (a) and degree correlation (b) of the investor networks (2008–2022) of the tech sectors.
Sustainability 17 04258 g006
Figure 7. Community distribution in the tech sectors.
Sustainability 17 04258 g007
Figure 8. Composition of community members, the CEET investor network.
Sustainability 17 04258 g008
Figure 9. Cross-community bridging scores by investor type in the CEET investor network.
Sustainability 17 04258 g009
Figure 10. Participation coefficient by investor type in the CEET investor network.
Sustainability 17 04258 g010
Table 1. Estimation results of the scale-free parameter α in the tech sectors.
Tech SectorNumber of NodesNumber of Edgesα Estimate (Scale-Free
Parameter)
95% Confidence Interval for αMean KS StatisticMean p-ValueOptimal Xmin
CEET52517162.941[2.460, 3.778]0.870p < 0.00114.0
Drug Discovery25010352.767[2.094, 4.507]0.924p < 0.00130.0
AI3038912.641[2.126, 4.248]0.650p < 0.0015.0
Table 2. Descriptive statistics of centrality measures by investor type.
Investor TypesVCCVCGVCOther FinancialsOthers
Degree Centrality
Mean16.3955.5307.0917.6494.758
Median8.0004.0006.0006.0003.000
Min1.0001.0001.0001.0001.000
Max104.00022.00021.00024.00038.000
Betweenness Centrality
Mean0.0100.0010.0020.0010.001
Median0.0000.0000.0000.0000.000
Min0.0000.0000.0000.0000.000
Max0.1380.0220.0080.0140.017
Closeness Centrality
Mean0.3120.2100.2160.2360.167
Median0.3080.2620.2670.2660.225
Min0.0040.0020.0020.0020.002
Max0.5040.3970.3980.4140.430
Eigenvector Centrality
Mean0.0410.0070.0140.0120.007
Median0.0130.0020.0010.0020.001
Min0.0000.0000.0000.0000.000
Max0.4270.0670.0880.0880.087
Table 3. Statistical comparison of centrality measures by investor type in the CEET investor network.
Centrality MeasureH-Statisticp-ValueEffect Size (ε2)Significant Differences (p < 0.05)
Degree Centrality59.476p < 0.0010.107VC-CVC, VC-Others
Betweenness Centrality88.642p < 0.0010.163VC-CVC, VC-Other Financials, VC-Others, CVC-Others, GVC-Others
Closeness Centrality76.118p < 0.0010.139VC-CVC, VC-Other Financials, VC-Others
Eigenvector Centrality73.702p < 0.0010.134VC-CVC, VC-Other Financials, VC-Others
Table 4. Comparison of GVC and non-GVC community sizes.
MetricCEET
Number of GVC Communities10
Number of Non-GVC Communities55
Average Size of GVC Communities28.70
Average Size of Non-GVC Communities4.33
Median Size of GVC Communities29.00
Median Size of Non-GVC Communities2.00
Mann-Whitney U Test ResultSignificant
U Statistic466.5
p-valuep < 0.001
Epsilon-Squared (ε2)0.348
Table 5. Summary statistics of cross-community bridging scores in the CEET investor network.
Investor TypesNumber of CommunitiesMeanMedianMinMax
VC142.5882.00.07.600
CVC410.3780.00.02.625
GVC102.2500.50.08.000
Other Financials171.3680.50.09.000
Others530.2010.00.02.286
Table 6. Summary statistics of participation coefficient in the CEET investor network.
Investor TypesCountMeanMedianMinMax
VC1190.3540.4080.00.822
CVC1640.1730.0000.00.684
GVC110.3090.4440.00.680
Other Financials370.2050.0000.00.710
Others1940.1040.0000.00.720
Disclaimer/Publisher’s Note: The statements, opinions and data contained in all publications are solely those of the individual author(s) and contributor(s) and not of MDPI and/or the editor(s). MDPI and/or the editor(s) disclaim responsibility for any injury to people or property resulting from any ideas, methods, instructions or products referred to in the content.

