Article

Prioritizing Smart City Themes for Multi-National Enterprises and United Nations Sustainable Development Goals

by
Neeraj Sharma
1,
Rupesh Kumar
2,
Nitin Simha Vihari
3,
Madhu Arora
4 and
Jatinderkumar R. Saini
4,*
1
Department of Management Studies, Graphic Era (Deemed to be University), Dehradun 248002, India
2
Jindal Global Business School (JGBS), O.P. Jindal Global University, Sonipat 131001, India
3
Business School, Middlesex University, Dubai P.O. Box 500697, United Arab Emirates
4
Symbiosis Institute of Computer Studies and Research, Symbiosis International (Deemed University), Pune 412115, India
*
Author to whom correspondence should be addressed.
Sustainability 2025, 17(10), 4251; https://doi.org/10.3390/su17104251
Submission received: 22 February 2025 / Revised: 27 April 2025 / Accepted: 28 April 2025 / Published: 8 May 2025

Abstract

:
Cities’ role as major hubs of human activity and economic development is essential in attaining sustainable development, fostering a balance between economic, social, and environmental development, especially in light of the growing concern over Anthropocene-induced environmental issues like global warming and climate change. The United Nations Sustainable Development Goals (SDGs) represent a historic call for coordinated international action in this area, with SDG 11 specifically identifying “Sustainable Cities and Communities” as a primary objective. Therefore, it is clear that a paradigm shift in our approach to these challenges in terms of our thinking, sensibility, behavior, and responses is necessary. Implicitly, in view of their pivotal role in environmental sustainability, development of “smart” cities as healthy, citizen-friendly, economically viable, and sustainable cities for our future generations in today’s globally integrated world, as predominant centers of human settlement and activity with multinational enterprises driving economic growth, gains the immediate attention of researchers. In this light, this study aims to identify and thereafter prioritize key indicators of a smart city using the structured and consistency-focused best–worst multi-criteria decision-making (BWM) method, suitable for expert-driven decision-making with limited comparisons. While the UN’s SDG 11 promotes safe and resilient cities, our findings suggest a disparity in how local officials prioritize certain dimensions such as safety or recreation. This disconnect warrants closer examination of localized policy drivers. The findings of this study indicate that according to experts, among others, the priority themes are, in order, water and sanitation, wastewater, health, the environment, and the economy. Thus, these represent a key take-away for multinational enterprises for identifying and assessing significant thrust domains and areas of opportunity for intervention and contribution to the UN SDGs. It also enables a replicable framework for synergy between the public and private sectors towards contrastive intervention in other cities across the globe.

1. Introduction

Rapid industrialization has improved living standards but has strained natural systems, necessitating a paradigm shift in sustainable development thinking. Human activities have increasingly disrupted the delicate yet adaptive balance of natural ecosystems. In response, nature activates feedback mechanisms that operate across a wide range of spatial scales—from local environments to the planetary level—and over varying timeframes, from immediate to long-term consequences [1]. These resource and nutrient cycles include carbon, water, nitrogen, phosphorus, oxygen and many others. All this poses a serious question to humans—are we not significantly impacting nature’s regenerative ability? It is thus increasingly evident that what is required is a paradigm shift in our way of thinking, sensibility, behavior, and responses to approaching these challenges. In the approximately last 7000 years of evolution of human society and culture, the global temperature has never deviated beyond 2° F from today’s temperature. However, as per the Intergovernmental Panel on Climate Change (IPCC), by the end of the current century, the global temperature is estimated to rise steeply by 3.2° F even in a low greenhouse gas emission scenario. With seemingly ever-increasing consumption of natural resources such as fossil fuels to meet the growing energy needs, greenhouse gas emissions have also been found to increase. Evidently, quitting smoking, like quitting fossil fuels, is not easy to achieve [2]. There has been a continuous increase in recorded global surface temperature since the year 1880 [3]. As of the morning of March 3, 2016, data indicated that the average temperature across the Northern Hemisphere had, for the first time in recorded history, exceeded the 2 °C threshold above pre-industrial norms—an unprecedented milestone likely not seen since the dawn of human civilization [4]. Due to global warming, a significant area of Greenland has been affected by snowmelt between 1992 and 2007 [5], which is reflective of an imminent danger of drowning for the low-lying land masses due to increase in sea level caused by melting of snow in the Arctic and Antarctic circles. A study identified 20 cities with the highest annual flood costs by the year 2050 across the globe. These are indicated in Table 1. These cities are susceptible to drowning with an estimated annual flood costs of USD 1 trillion [6].
Socio-economic inequalities persist across the globe, particularly in terms of income levels and access to essential resources like clean water, nutritious food, healthcare, and education. Traditional economic indicators such as GDP and GNP fall short in capturing the holistic well-being of societies and largely ignore the value of natural ecosystems and the services they provide. According to World Bank data from 2010, more than 2.4 billion people—nearly half the global population at the time—were surviving on less than USD 2 per day. UNICEF’s 2010 estimates reveal that approximately 22,000 children under the age of five were dying each day due to preventable causes rooted in poverty and malnutrition. In parallel, biodiversity loss continues at an alarming rate, with conservative projections indicating that over 5000 species disappear annually—a rate nearly 10,000 times higher than what was observed before significant human impact on the planet [7]. Thus, achieving economic development coupled with social development without negatively impacting and derailing environment should be a key objective of human race. There is no alternative to sustainable development, and sustainability is now the key driver of innovation.
The 17 Sustainable Development Goals (SDGs), introduced at the United Nations Summit in September 2015, officially came into effect on 1 January 2016, marking a global commitment towards sustainable and inclusive development [8]. These goals form the foundation of the 2030 Agenda for Sustainable Development and are applicable to all nations, regardless of their economic status. Over a 15-year horizon, countries are expected to collectively address major global challenges—eradicating poverty, reducing inequality, and confronting climate change. As successors to the Millennium Development Goals (MDGs), the SDGs broaden the scope by aiming to eliminate all forms of poverty while promoting equitable growth and environmental sustainability. What sets the SDGs apart is their universality—they call upon developed, developing, and least-developed countries alike to act in tandem. The framework emphasizes that combating poverty must be aligned with fostering economic progress and ensuring access to healthcare, education, employment, and social security, alongside safeguarding natural ecosystems. Complementing the SDGs, the Paris Agreement—effective from November 4, 2016—reinforced global climate governance. As the first legally binding international treaty uniting all nations under a shared vision, it urges ambitious mitigation strategies and resilience-building measures, especially through enhanced financial and technical assistance to developing nations. This study addresses the pressing need to bridge global sustainability goals with actionable strategies for multinational enterprises (MNEs) via smart city development.

1.1. Link Between Population, Economy, and Emissions

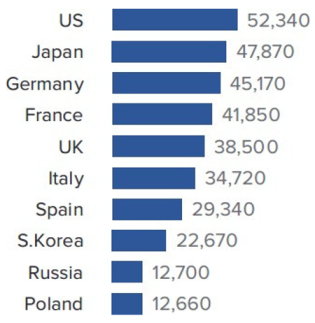
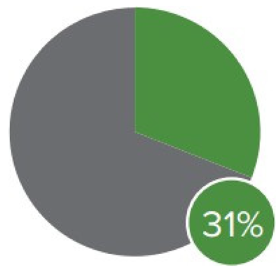
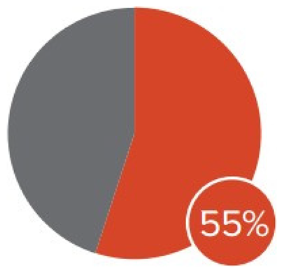
The World Bank new climate economy report 2014 illustrates a close link between population economy and emissions among the various countries across the globe at different stages of development, as depicted in Table 2.
While 74 countries classified as high-income countries, representing 1.3 bn people, have a share of 68% in the world’s GDP, their share of the world’s greenhouse gas (GHG) emissions is 43%. In contrast, 36 countries classified as low-income countries, represent 0.9 bn people and have a 1% share of the world’s GDP, while only 2% of the world’s GHG emissions is attributed to them. The 103 countries across the globe classified as middle- income countries, represent 4.9 bn people and have a 31% share of world’s GDP while contributing a 55% share of the world’s GHG emissions. Thus, middle-income and high-income countries have a critical role to play in curbing GHG emissions and perpetrating environmental sustainability.

1.2. Role of Cities in Sustainability

The growing significance of smart cities as a framework for sustainable urban development is closely linked to global climate commitments, particularly the Paris Agreement and the United Nations Sustainable Development Goals (SDGs). The 2015 Paris Agreement establishes ambitious global goals to reduce greenhouse gas (GHG) emissions, promote low-carbon solutions, and enhance climate resilience in order to mitigate climate change. The central aim of the Paris Agreement is to support countries in building urban resilience and developing policies that reduce climate-related risks, especially in vulnerable communities. Given that urban areas account for nearly 70% of global carbon emissions and over 80% of global GDP [10], the transition towards smart, sustainable cities is a key component in achieving these international climate goals. For example, Article 7 of the Paris Agreement calls for enhancing adaptive capacity and urban resilience, which aligns directly with our top-ranked themes such as solid-waste management and urban health infrastructure. Similarly, Article 9 emphasizes financial flows for climate-resilient development, resonating with the prioritization of water and sanitation infrastructure identified in our BWM results. These links validate that municipal priorities identified in our study reflect critical elements of international climate governance.
Multinational enterprises (MNEs) play a pivotal role in this transformation by leveraging technological innovation, data-driven urban planning, and strategic investments to enhance urban resilience and reduce environmental footprints [11]. Recent studies highlight that MNEs contribute significantly to smart city development through initiatives such as energy-efficient infrastructure, waste management solutions, digital governance models, and intelligent transportation systems [12]. MNEs, on the other hand, lack a structured framework for systematically identifying and prioritizing key smart city themes that align with sustainability requirements, despite their growing involvement. By using a best–worst multi-criteria decision-making (MCDM) strategy to evaluate and rank important smart city themes, this study fills this void. The rationale behind this methodological choice lies in its ability to optimize decision-making with fewer comparisons, enhanced consistency, and reduced subjectivity [13]. By integrating insights from climate policies, sustainability frameworks, and empirical research on urban development, this study provides a comprehensive analytical foundation that informs both policymakers and corporate stakeholders on optimal intervention areas. These contributions enhance our understanding of how climate agreements shape smart city planning and provide a structured decision-making approach for MNEs to drive impactful and scalable sustainability initiatives. Cities like Copenhagen and Singapore have shown success in aligning urban planning with environmental goals using real-time air quality monitoring and sustainable transport networks, reinforcing the validity of smart city interventions.
The rationale for focusing on smart city themes in the context of sustainable development stems from the increasing urbanization rate and the need for data-driven decision-making frameworks to enhance sustainability. According to a study by [14], in line with the UN Habitat report of 2021, 66% of the global population will reside in cities by 2050, necessitating structured urban policies that balance economic, social, and environmental objectives. This study identifies key indicators that align with SDG 11 (Sustainable Cities and Communities) and SDG 9 (Industry, Innovation, and Infrastructure), thereby offering a replicable model for MNEs to contribute to urban sustainability initiatives effectively.
As defined in the Brundtland Report, “Sustainable development is development that meets the needs of the present without compromising the ability of future generations to meet their own needs” [15]. Refer to Figure 1 for the pillars of sustainable development that have been prepared based on the background paper prepared for consideration by the UN High Level Panel on Global Sustainability at its first meeting, 19 September 2010.
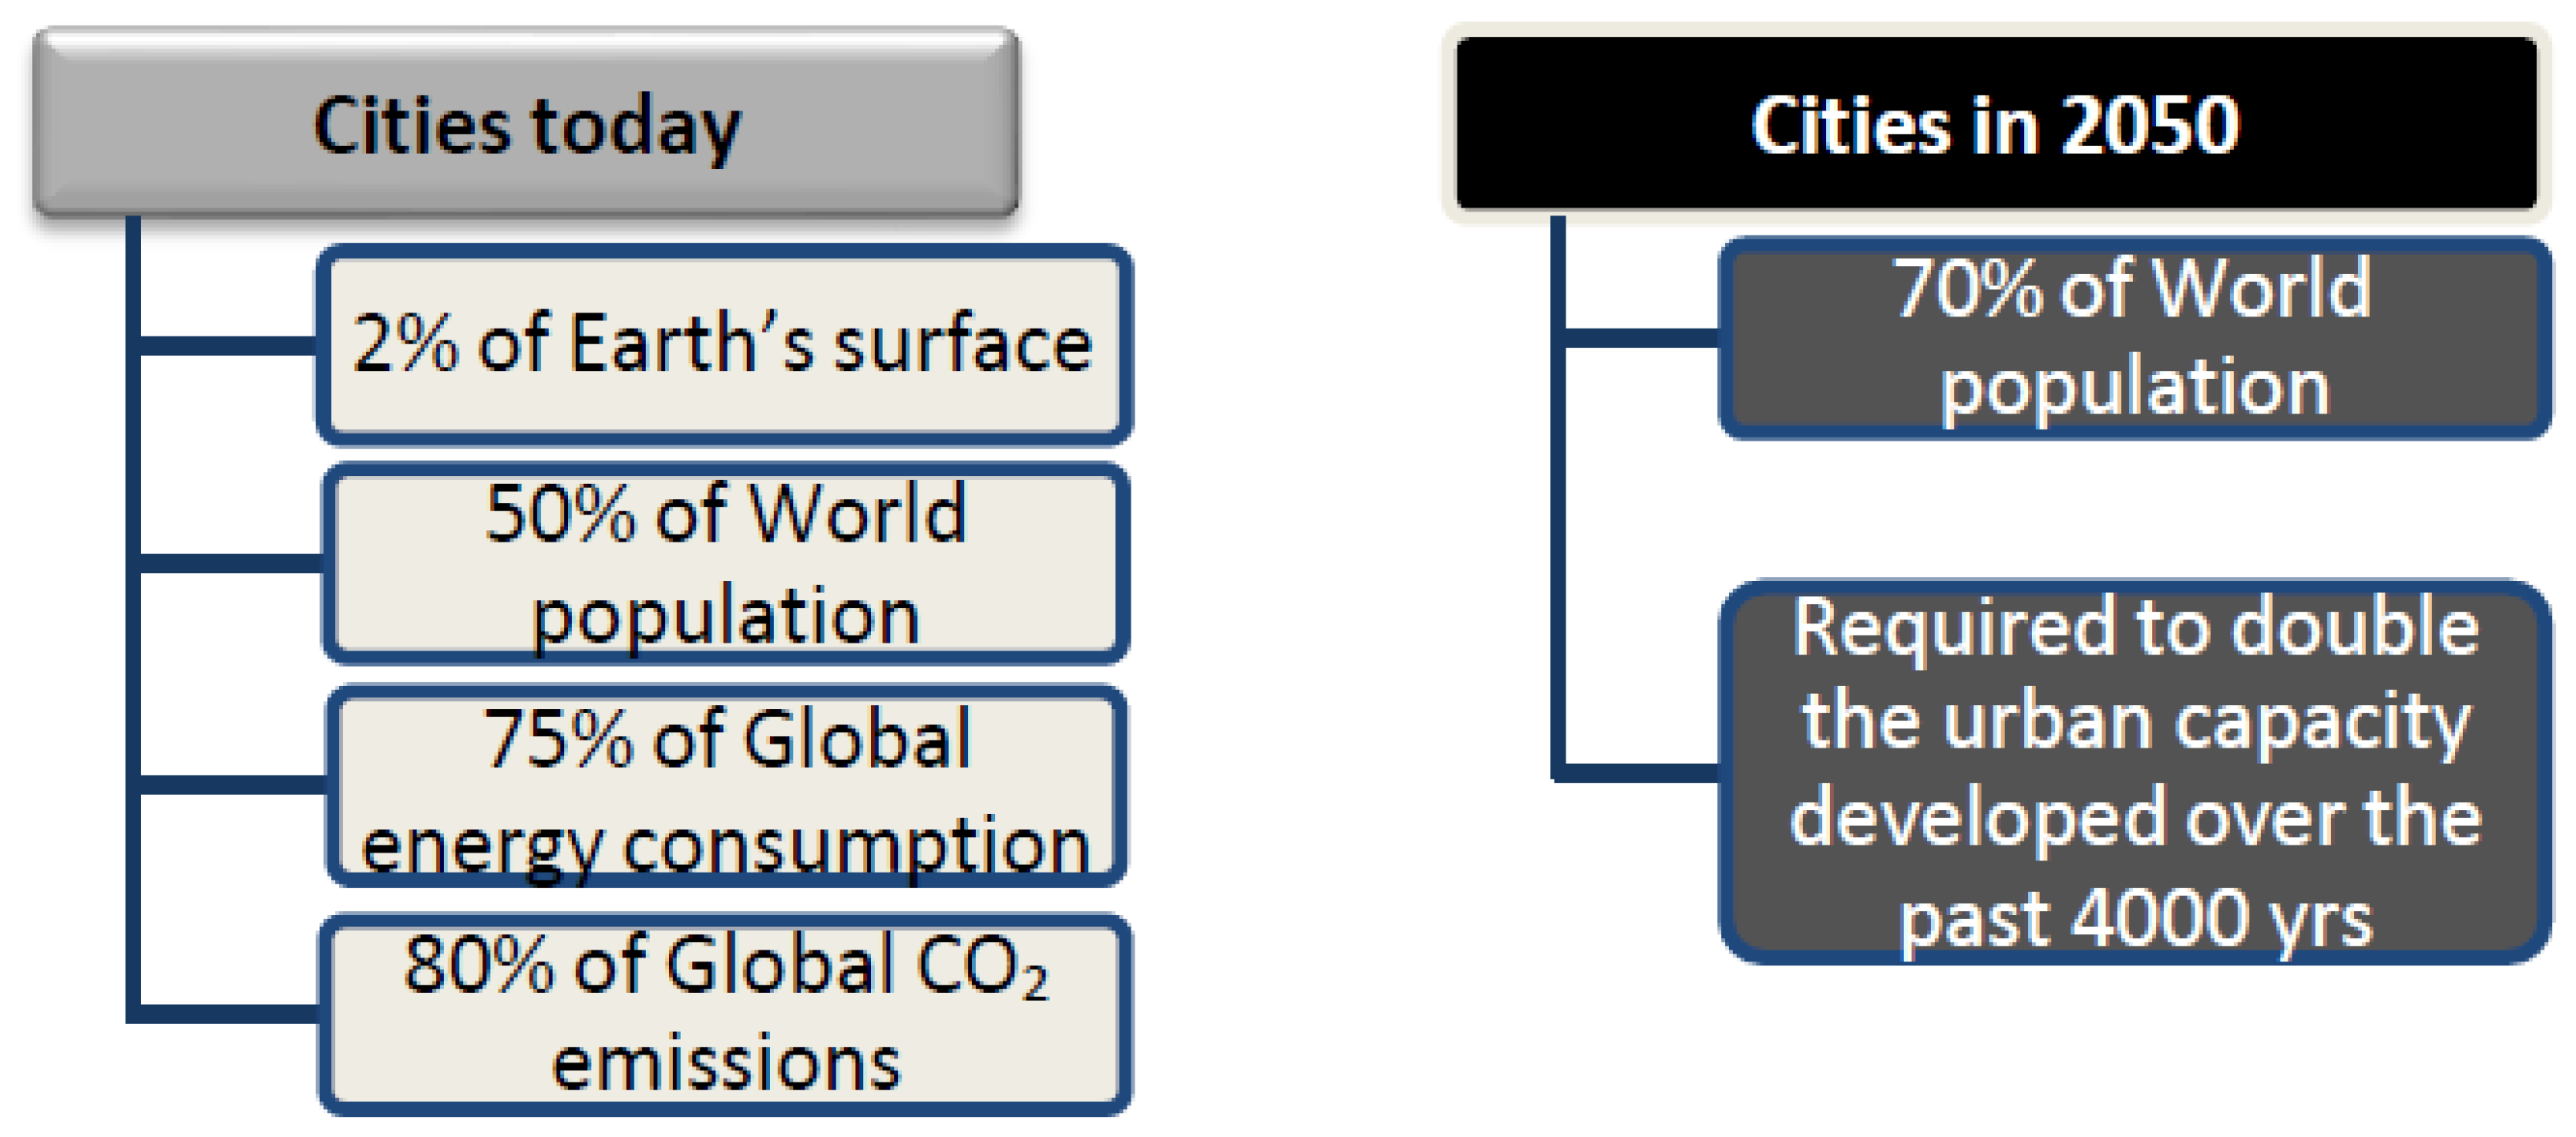
Cities across the globe, as predominant centers of human settlement and activity, are a major driver of economic growth. In the current ongoing debates and projections, over 53.85% of the global human population is living in urban areas [9], which is expected to reach 66% by 2050 [16]. Half of the world’s population lives on just 1% of the land [17]. Furthermore, there lies a close resemblance between the population density map and gross domestic product (GDP) density map [18], indicating dense human settlements as predominant centers of economic activity. GDP density is a measure reflecting GDP per square kilometer of area. With an increasing proportion of the world’s population rapidly becoming urbanized (refer to Figure 2), the role of cities cannot be undermined. Their role is critical for sustainability.
Further, the analysis of the World Bank new climate economy report 2014 focuses on the three key economic systems, viz., urban systems, land use systems, and energy systems. Over the coming decades, these economic systems, which will be the locations of much of the growth in the global economy, are also a source of the most global GHG emissions. Further, these economic systems will be driven by three key drivers of change, namely efficiency in resource usage, investment in infrastructure, and innovation. Cities, thus, predominantly feature one of the key economic systems depicted in Figure 3.
The World Bank highlights the central role of urban areas as key drivers of economic growth and human development. Urbanization is accelerating, with both emerging cities and large-scale “megacities” projected to witness a population increase exceeding one billion within the next decade and a half. These urban centers are responsible for approximately 80% of the world’s GDP, while also accounting for nearly 70% of global energy consumption and related greenhouse gas emissions. Despite their economic significance, many urban expansion efforts remain poorly planned, often resulting in substantial socio-economic disparities and environmental degradation. Research increasingly supports the notion that compact, well-integrated urban design—especially those centered on efficient mass transit systems—can enhance economic productivity, reduce emissions, and improve overall public health.
The UN Sustainable Development Goal 11 also lists Sustainable Cities and Communities as a key goal. The cities thus become critical centers for addressing some of the pressing challenges faced by human society at large such as global warming and the necessity of monitoring them due to their pivotal role in environmental sustainability. Evidently, “Smart city” is a buzz word these days for an organized, efficient urban settlement. For example, under the leadership of the Indian Prime Minister Narendra Damodardas Modi, “Smart City Mission” was launched by the Government of India recently, wherein 100 selected cities across India are to be developed as smart cities. Under India’s Smart City Mission, 130 million Indians, which is about 35% of the urban population in India, spread across 98 cities, shall be covered [21]. To be called a “smart city”, a city should provide its residents with a smart, connected urban infrastructure, which can improve their quality of life.
Thus, development of citizen-friendly, economically viable, and sustainable cities gains immediate importance. The economy, health, water, and the environment are amongst the key pillars of quality of life for citizens. This is especially significant for developing nations because they house a significant portion of the world’s seven billion or more people. Essentially, for its success, the role of citizens, policymakers, urban town planners, and public and private sector participation is vital. Further, in the currently prevalent scenario of the liberalization, privatization, and globalization (LPG) model for global trade, another dimension is added to the balancing of economic growth with sustainability in an era of a close-knit world with enhanced citizen expectations of demanding citizens and businesses witnessing hyper-competition. In light of all these factors and a constructive drive for progressive change, this work seeks to assess some of the core indicators of “city smartness” in terms of health and environment in selected global cities that are already considered smart or are aspiring to become smart. Their evolving significance, importance, and inter-relationships from a global perspective are analyzed.
A sample case of urban municipal corporation officials in India is also discussed as an example of their priorities, representative of the perception of urban town planners in a large developing-world country (currently the world’s second-largest country by population and home to almost 18% of the global human population, which is increasingly becoming urbanized). By the year 2030, about 40% of the Indian population is expected to be living in cities. All this is with an aim to eventually target transformation of the lives and living conditions of citizens. Evidently, with increasingly urbanized society, sustainable production and consumption practices of the citizens are also imperative for sustainability. This must be kept in mind while developing our cities as smart cities. This is particularly important and relevant for a developing-world country such as India, in view of the Indian Government’s recently launched “Smart City Mission” initiative, wherein 100 selected cities across India are to be developed as “smart cities”.
To give greater strength to our high-priority smart city indicators’ linkage with the Paris Agreement, we have associated each high-priority theme with specific Paris Agreement articles, clauses, and Nationally Determined Contributions (NDCs) where appropriate. For instance, Article 7 of the Paris Agreement calls for increasing adaptive capacity and resilience, which is translated into various national NDCs through sectoral actions towards urban solid-waste management and public health infrastructure. India’s NDC, for instance, lists commitments towards enhanced municipal solid-waste management and urban sanitation, corresponding directly to our high-priority themes. In a similar manner, Article 9’s stress on climate-resilient financial flows is implemented at the national and city level in the form of investments in water and sanitation infrastructure, as articulated in the SDG 6 targets (6.1, 6.2) and SDG 11.5 (mitigating the impacts of natural disasters in cities). To further cross-validate these associations, Table 14 has provided a direct correspondence of our high-priority indicators to the concerned SDG targets and sub-indicators and some chosen actions of India’s National Action Plan on Climate Change (NAPCC). This methodology illustrates that our prioritization framework is not merely theoretically consonant with global agreements but is also practically entrenched in national and local policy documents. India’s Nationally Determined Contributions (NDCs) under the Paris Agreement focus on waste-to-energy, water sustainability, and urban settlement resilience building. Article 7.9(a) promotes climate-resilient infrastructure adaptation planning—solid waste and wastewater are the focus of our discussion. Article 9.4 also highlights increased financial flows to least-developed countries, once again highlighting the role of low-cost water/sanitation interventions in urbanizing economies such as India.

2. Literature Review

2.1. Systematic Literature Review on Smart Cities

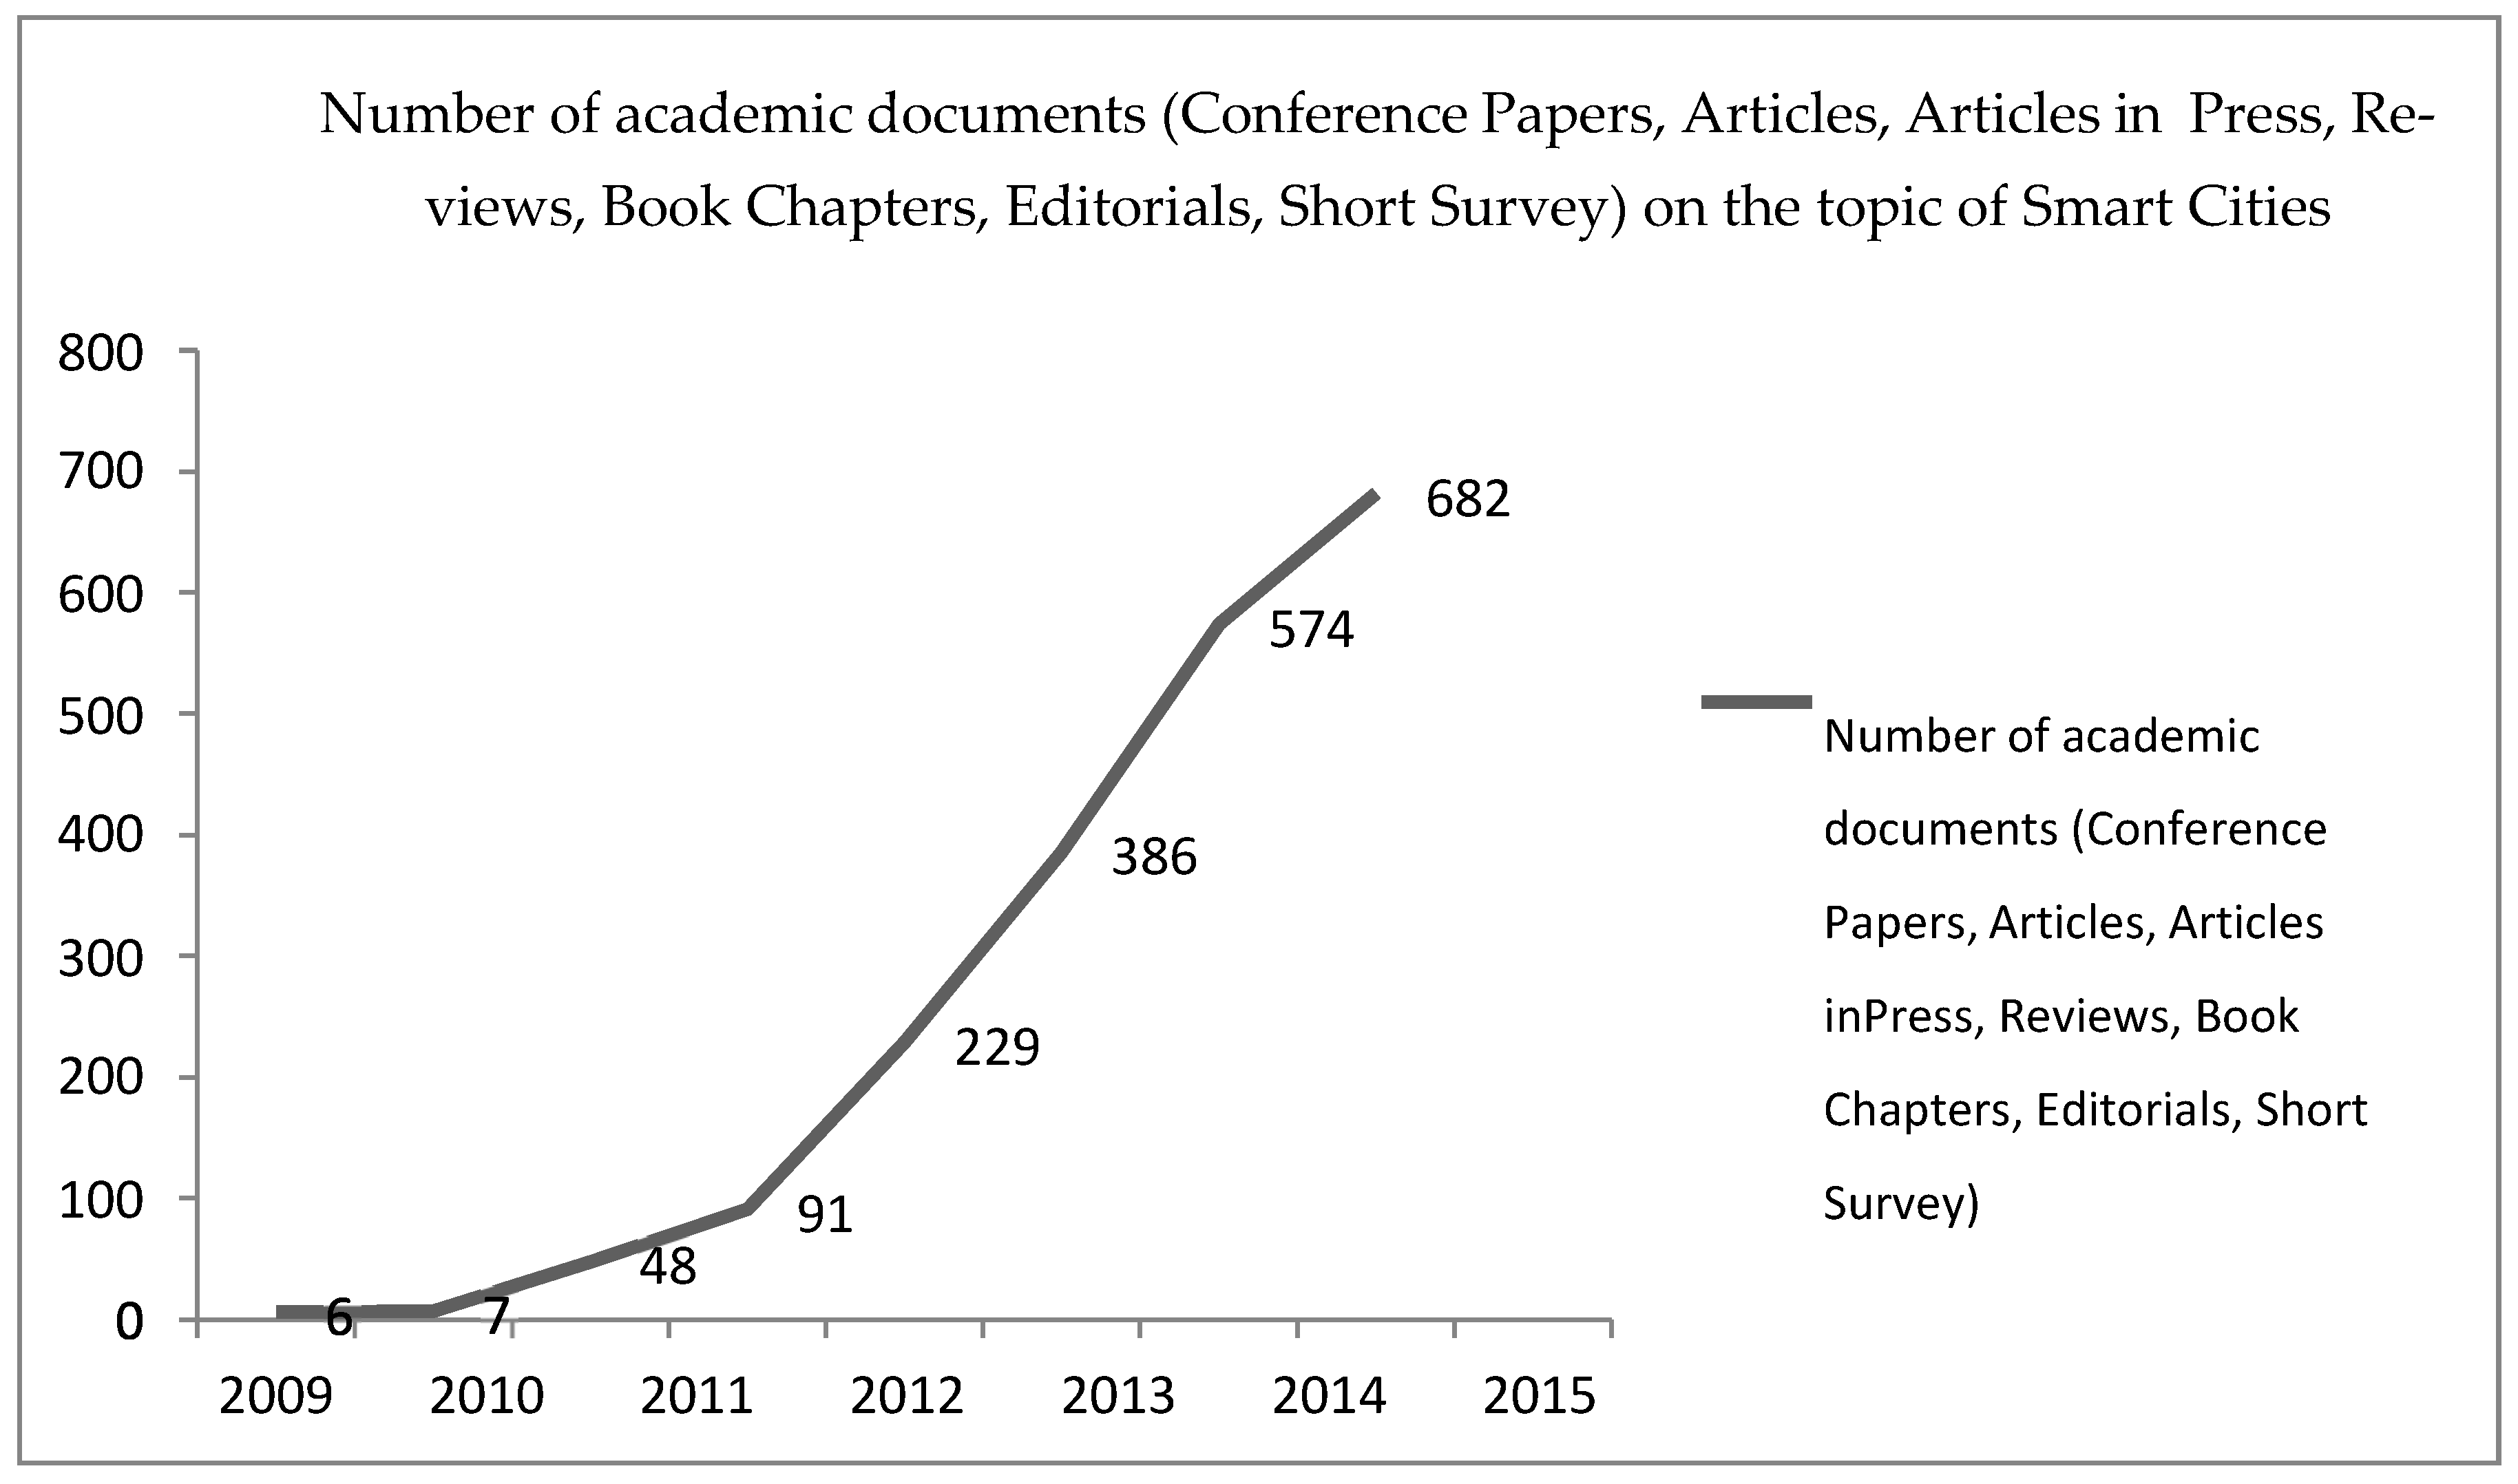
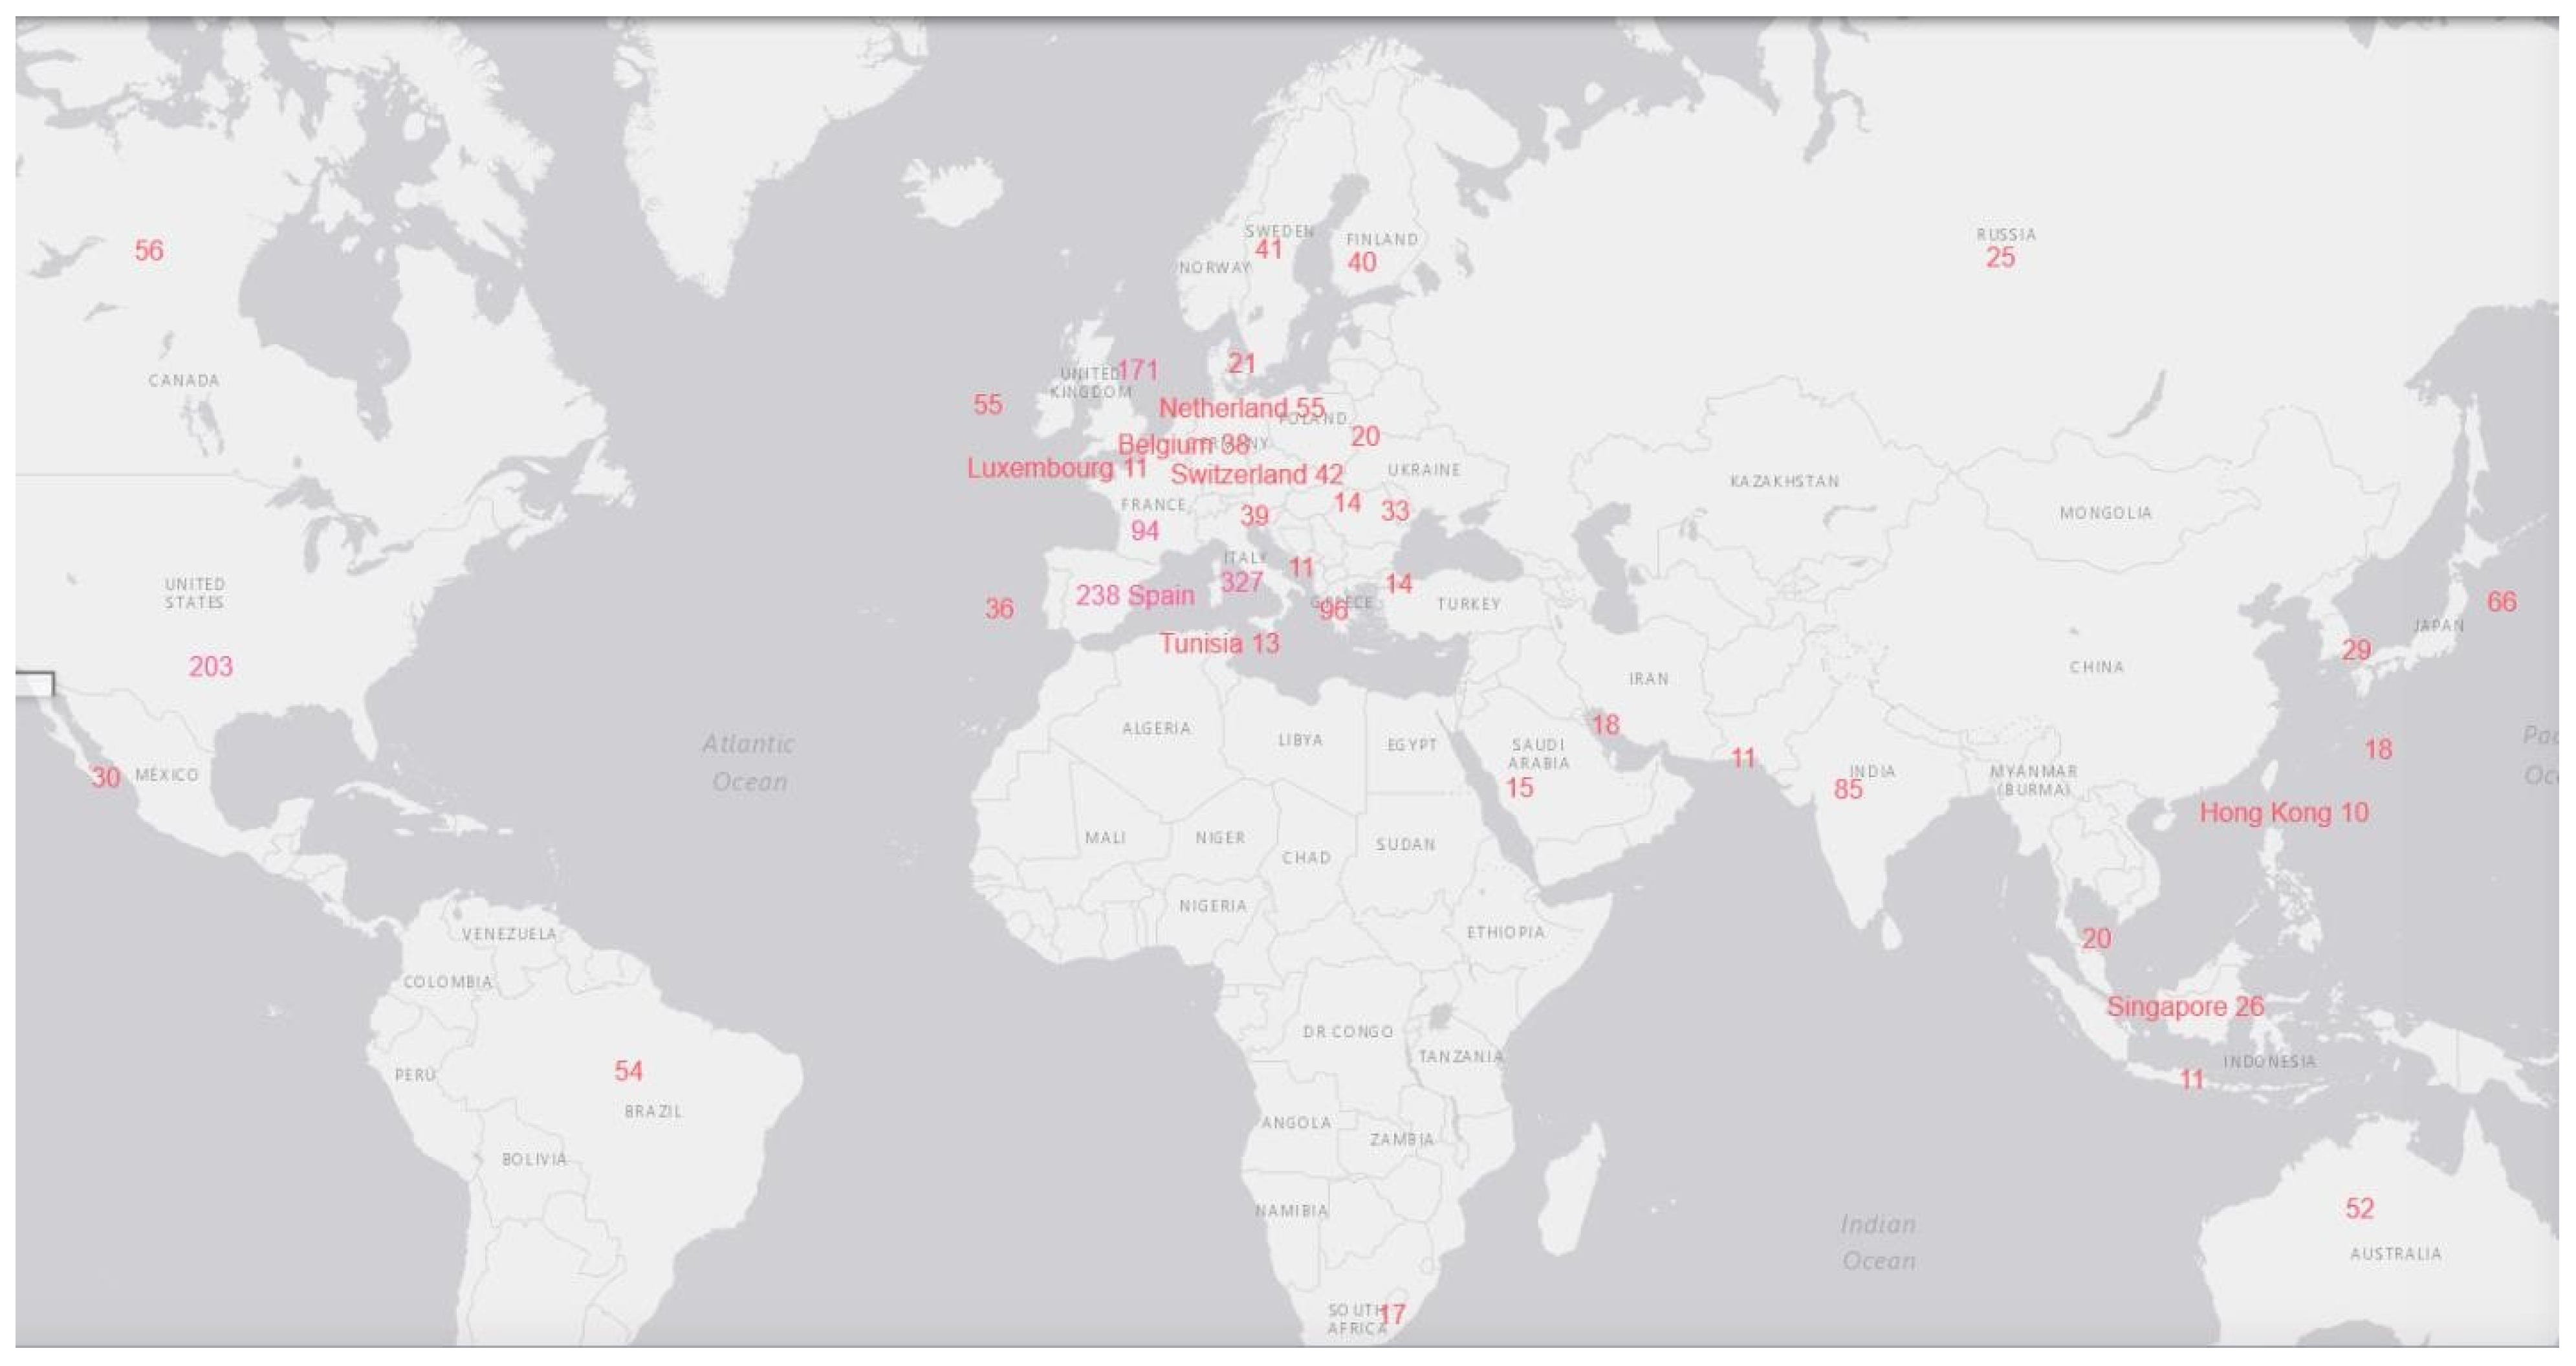
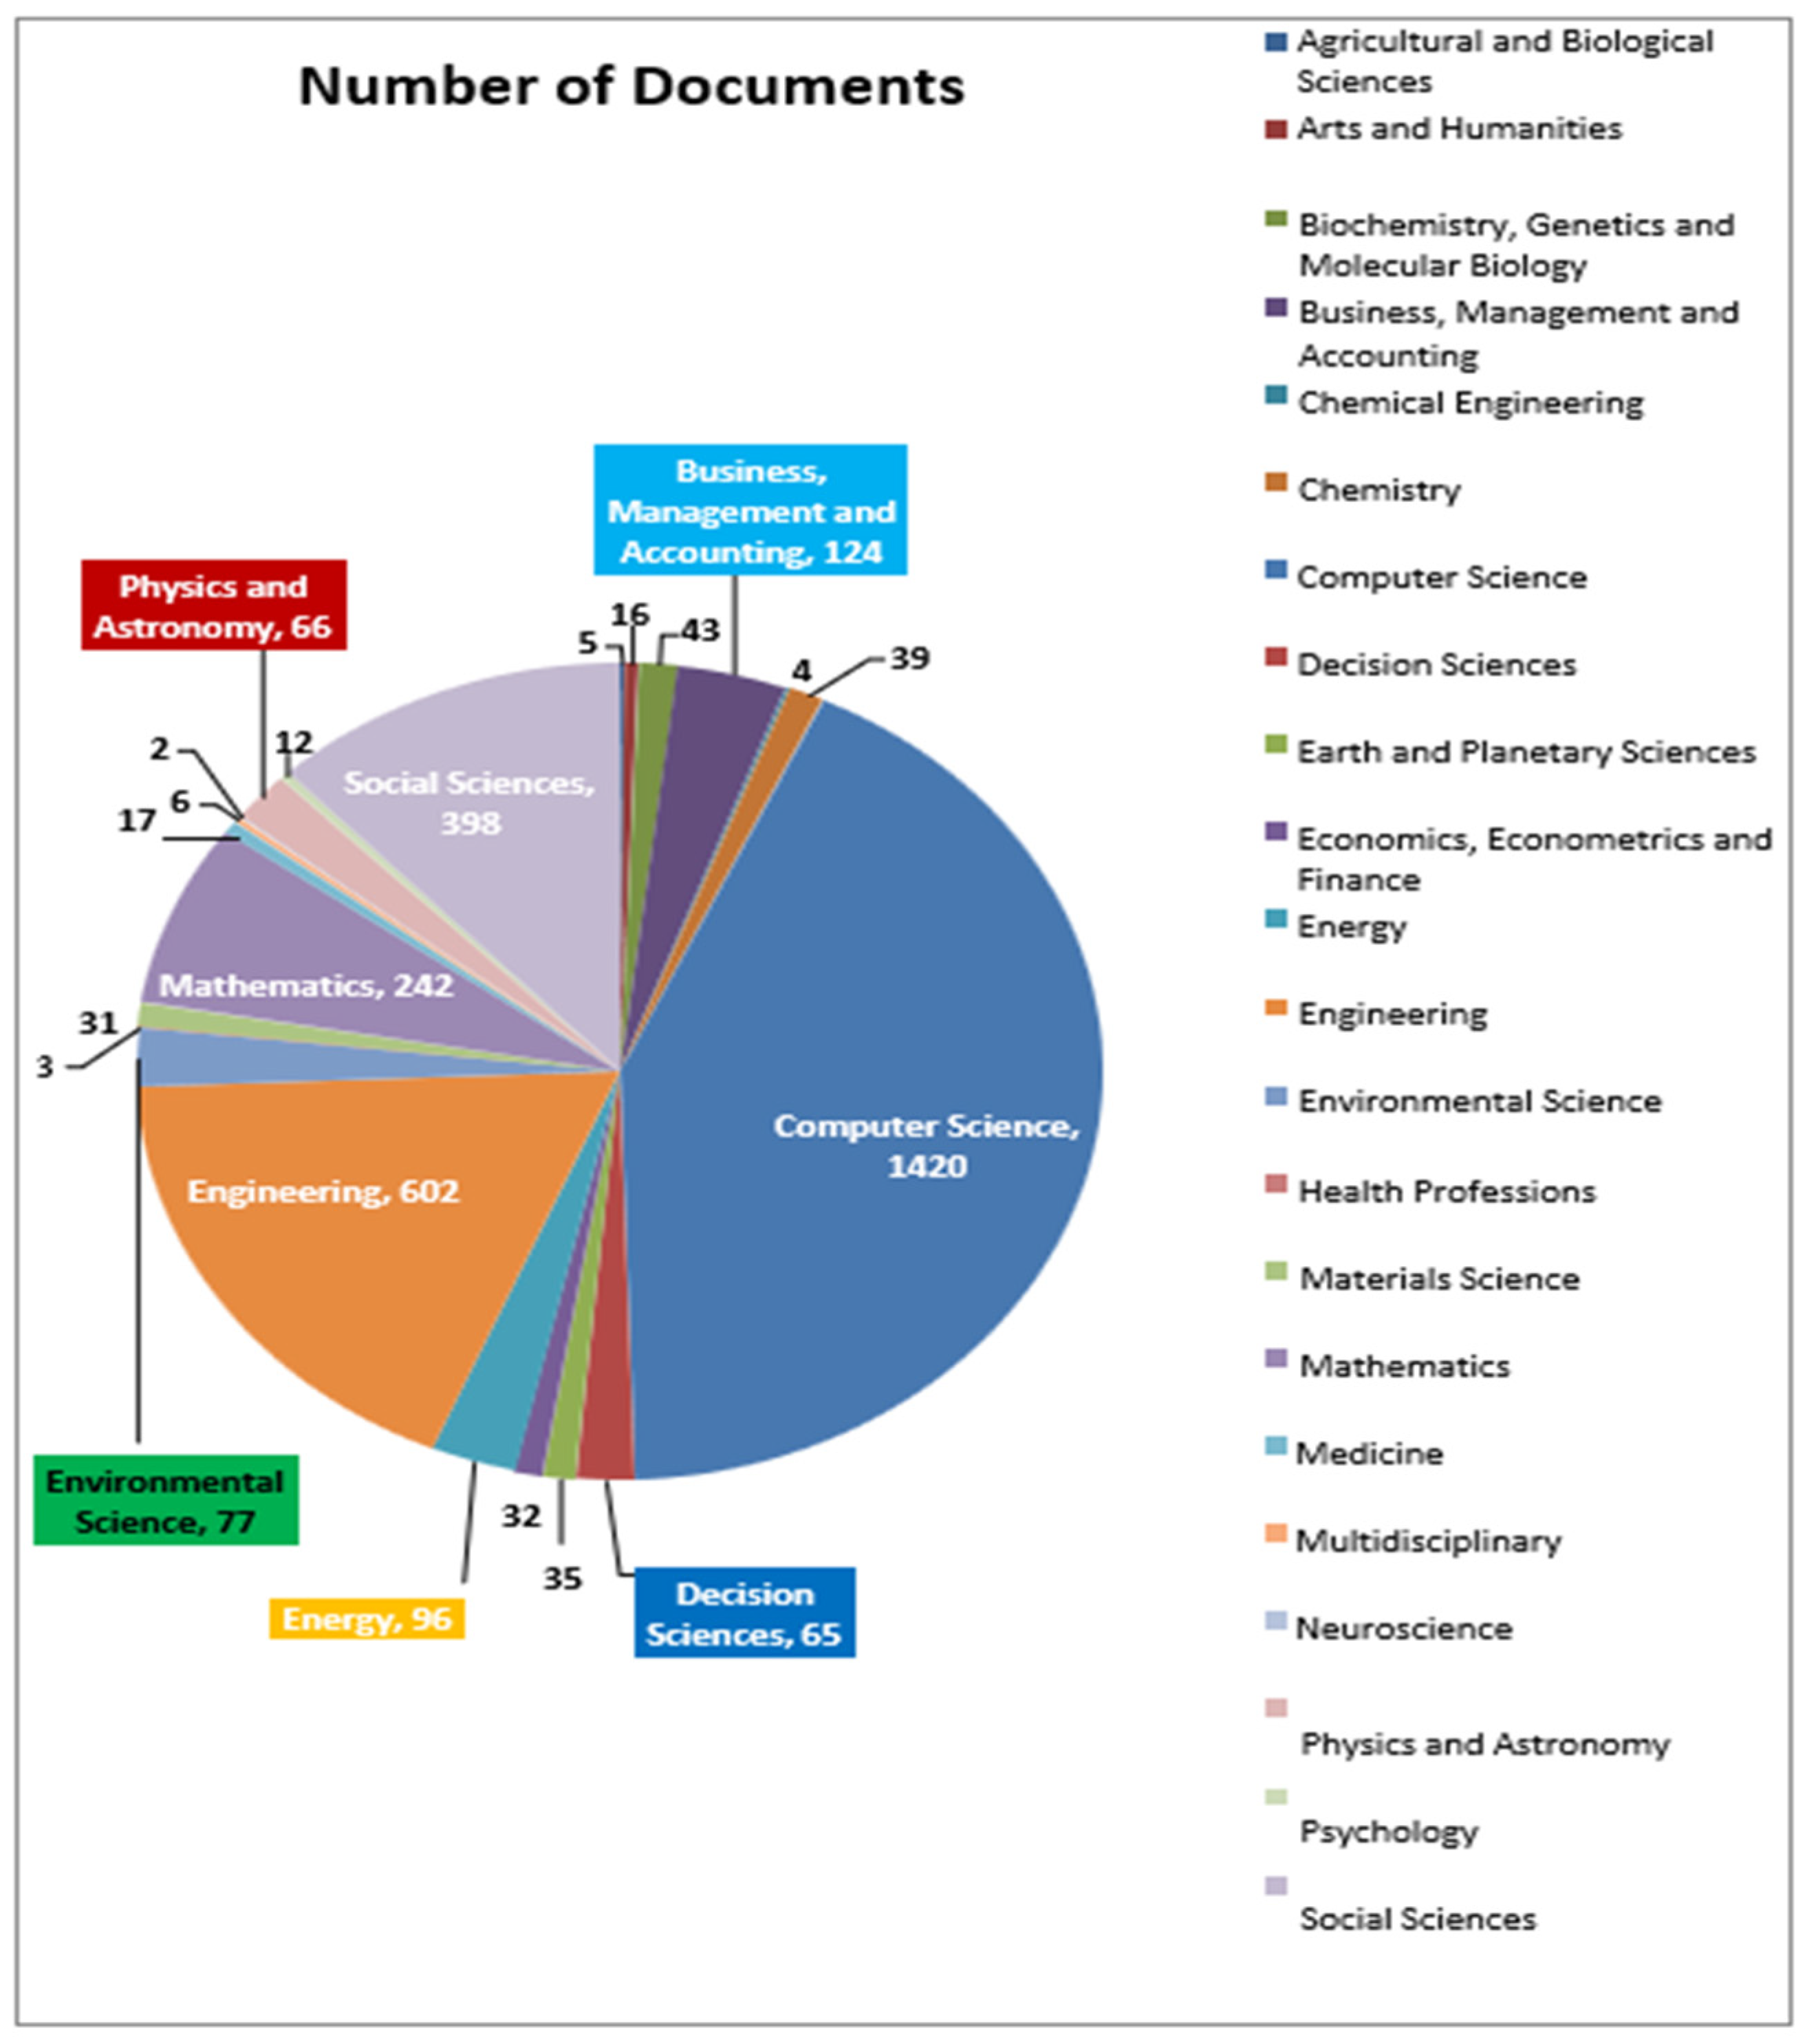
A systematic, reproducible, and transparent methodology adoption is said to have improved reviews in a field. In light of the above, a systematic literature review method is followed. An extensive literature review based on the Elsevier Scopus database was carried out, as indicated in Figure 4. It is found that the number of academic documents has been rapidly increasing since the year 2009, signifying growing interest for smart cities in academia. Similarly, the academic interest for studies on the “smart city” concept spans across almost all the continents, but Europe is found to be the front-runner, as can be seen from Figure 5. Similarly, academic fraternity ranging from business management and accounting to computer science to engineering to mathematics to physics and astronomy to energy to environmental science to social sciences, etc., has published academic articles related to smart cities in English. This has been shown in Figure 6.

2.2. Definitions and Conceptual Framework of Smart Cities

The literature review (LR) indicates that cities matter a lot for sustainability, and researchers have been highlighting their pivotal role, as shown by some of the research works indicated in Table 3.
Furthermore, according to LR (see Table 4), there is not a single agreed-upon definition of what a “smart city” is. Various terms, such as “cyberville”, “digital city”, “electronic communities”, “flexicity”, “information city”, “intelligent city”, “knowledge-based city”, “MESH city”, “telecity”, “teletopia”, “ubiquitous city”, and “wired city”, have been used by researchers to refer to similar concepts. The definition differs from nation to nation and city to city, depending on the degree of development, the resources and aspirations of the city’s citizens, and their willingness to change and reform.
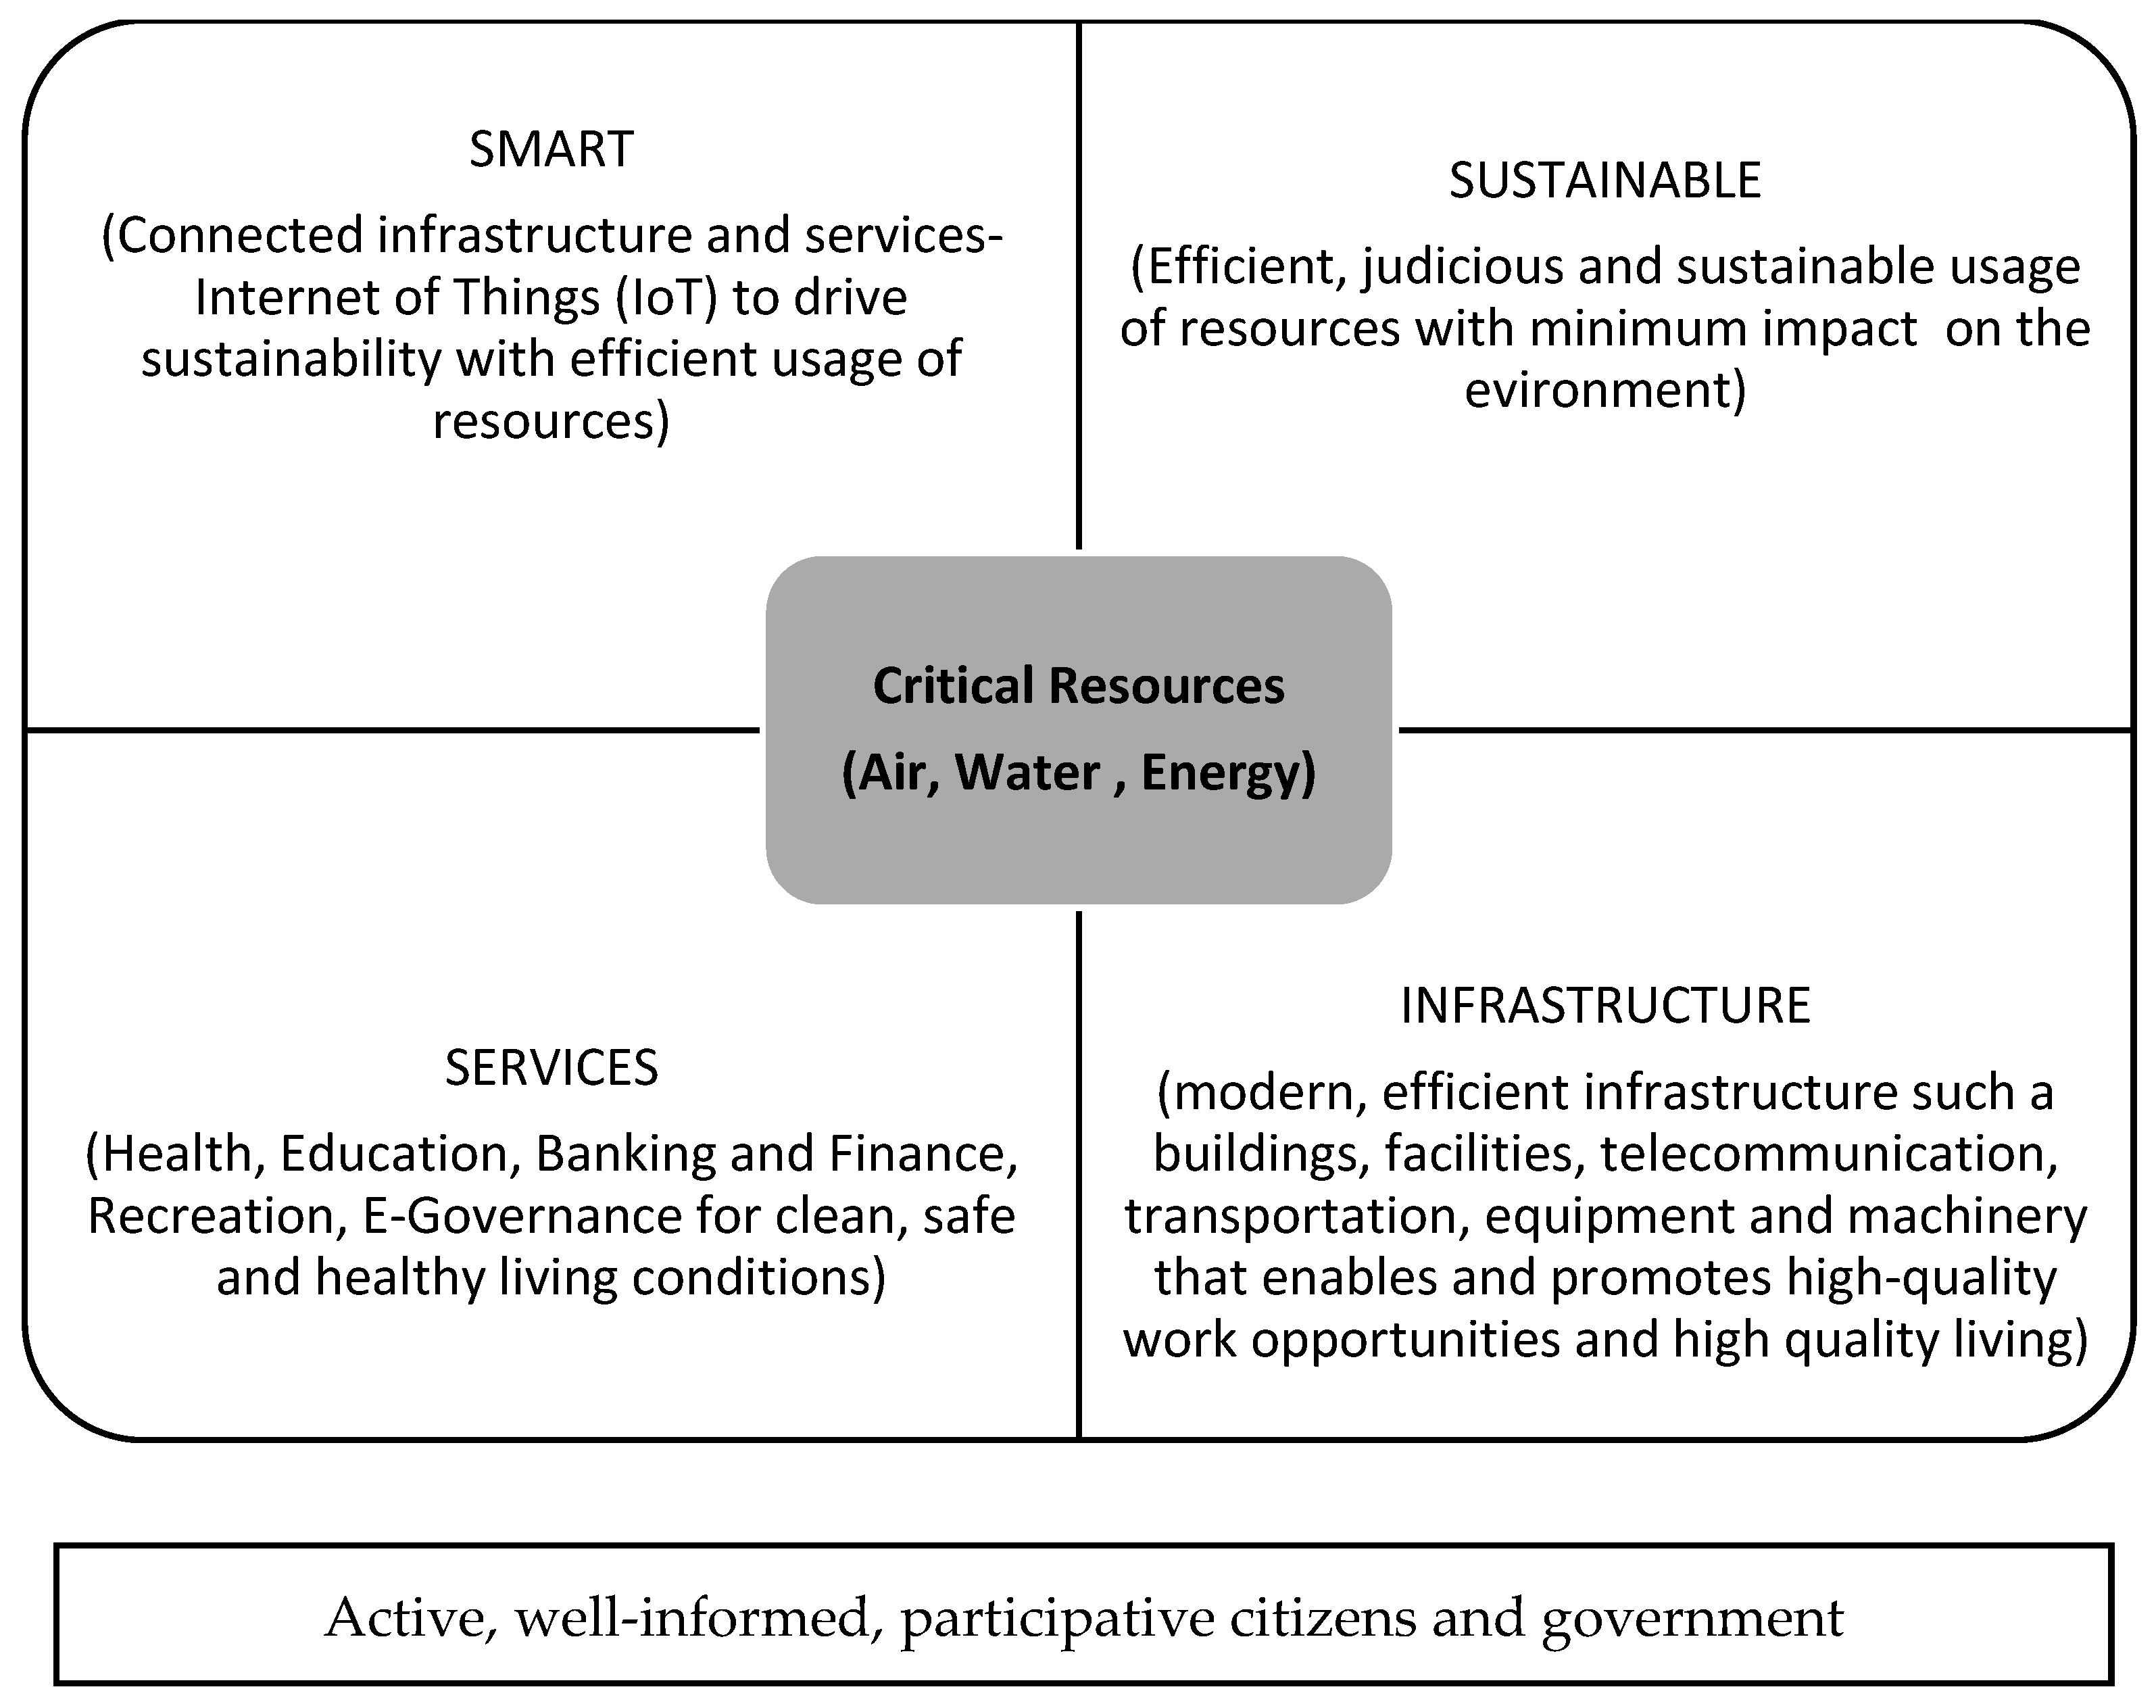
Implicitly, the role of active, well-informed, participative citizens and government is the underlying base of a smart city, coupled with connected infrastructure and services, as well as efficient, judicious, and sustainable use of resources with minimum impact on the environment. Smart services span across health, education, finance, recreation, and e-Governance to ensure clean, safe, and healthy living conditions for citizens.

2.3. Role of Cities in Global Sustainability Agendas

Modern efficient infrastructure comprising buildings, facilities, equipment, machinery, and transportation enables and promotes high-quality work opportunities along with high-quality living. Air, water, and energy are the critical resources cutting across all smart city domains and require efficient and effective usage. Because they have a direct impact on urban sustainability, public health, and economic productivity, air quality indicators play a crucial role in the development of smart city policies. Smart cities integrate advanced air quality monitoring systems to assess pollution levels and formulate data-driven policies aimed at reducing emissions, optimizing urban mobility, and promoting green infrastructure. Governments and municipal authorities use air quality data to enforce environmental regulations, design low-emission zones, and implement real-time traffic management systems. For instance, cities like Singapore and Copenhagen have successfully integrated air quality data into their urban planning frameworks, leading to improved air quality and enhanced livability. Given the increasing concerns over air pollution, particularly in rapidly urbanizing regions, the prioritization of air quality indicators in smart city policy frameworks has become imperative. This study identifies key trends, challenges, and best practices in sustainable urban management by examining the relationship between air quality indicators and smart city policies.
The concepts/definitions have been summarized through a smart city framework in Figure 7 [35,39].
The systematic review of smart city frameworks highlights recurring sustainability themes, including energy efficiency, mobility, digital infrastructure, and governance. Also, the relevance of ISO 37120 indicators is reinforced through comparative insights from previous smart city assessment models, emphasizing their alignment with climate agreements and SDGs. Past studies have identified key drivers of smart cities and their contributions to sustainability. Most of such studies, nonetheless, have covered individual areas such as energy or mobility or used generic prioritization techniques that are not specially configured to local policymaking contexts. For instance, the Analytic Hierarchy Process (AHP) has been utilized to estimate smart city themes; however, limits of sparse expert inputs and strict requirements for pair-wise comparison consistency were not accounted for. Another study, nonetheless, prioritized health and security but did not systematically link them to Sustainable Development Goal (SDG) targets or national plans of action. Our research, however, contributes to the subject by:
(1)
Including a formal BWM methodology that reduces the inconsistency of comparison and is appropriate for situations where there is sparse expert opinion.
(2)
Clearly connecting prioritized issues to both national policy instruments and SDG sub-indicators, thus operationalizing the global-to-local policy linkage.
Closing the gaps in previous research by providing a replicable decision framework that can be applied across a range of urban environments and policy regimes. This combined synthesis illustrates how our research builds upon and expands the existing literature, filling gaps in policy usefulness and methodology. Prior studies have emphasized either technological aspects (e.g., ICT and governance) or social infrastructure but lack integration of multi-stakeholder perspectives, especially from the lens of multinational enterprises. Our study extends this literature by introducing a novel application of ISO 37120 and best–worst MCDM, allowing expert-driven prioritization under limited-resource settings.
The International Organization for Standardization (ISO) 37120 Smart City Standard of 2014 also identifies the seventeen schematic themes of a smart city. These seventeen themes are outlined in Table 5.

2.4. Role of Multinational Enterprises

Multinational enterprises (MNEs) play a crucial role in advancing sustainable development. In recent years, there has been growing focus on the ethical, environmental, and social aspects of business, often framed under the umbrella of corporate social responsibility (CSR).
Many multinational corporations (MNCs) recognize immediate business advantages from proactive environmental management, such as reduced costs, lower risks, and enhanced operational efficiency. Additionally, they see long-term benefits from supporting sustainable development, including improved competitive advantage, conservation of essential resources, positive corporate reputation, and new product opportunities. Furthermore, many companies acknowledge that a strong reputation in corporate citizenship can result in easier access to capital, reduced operational expenses, better financial performance, and a stronger brand image. Numerous MNCs are launching voluntary environmental initiatives, often labeled as ‘corporate citizenship’, to address public concerns about the environmental impact of their operations and facilities. Transnational corporations are pivotal in shaping, spreading, and solidifying sustainable development within the framework of globalization and multinational business practices.
By leveraging multinational industries, civil society organizations are able to use companies’ global networks to push for social and environmental agendas in the global economy. While many business guidelines focus more on environmental sustainability, they often overlook the social aspects, particularly the needs of the poorest, as originally emphasized in the Brundtland Report. This highlights the potential for MNEs to adopt a triple bottom line approach, balancing profit, environmental impact, and social welfare while contributing to the UN’s Sustainable Development Goals (SDGs).
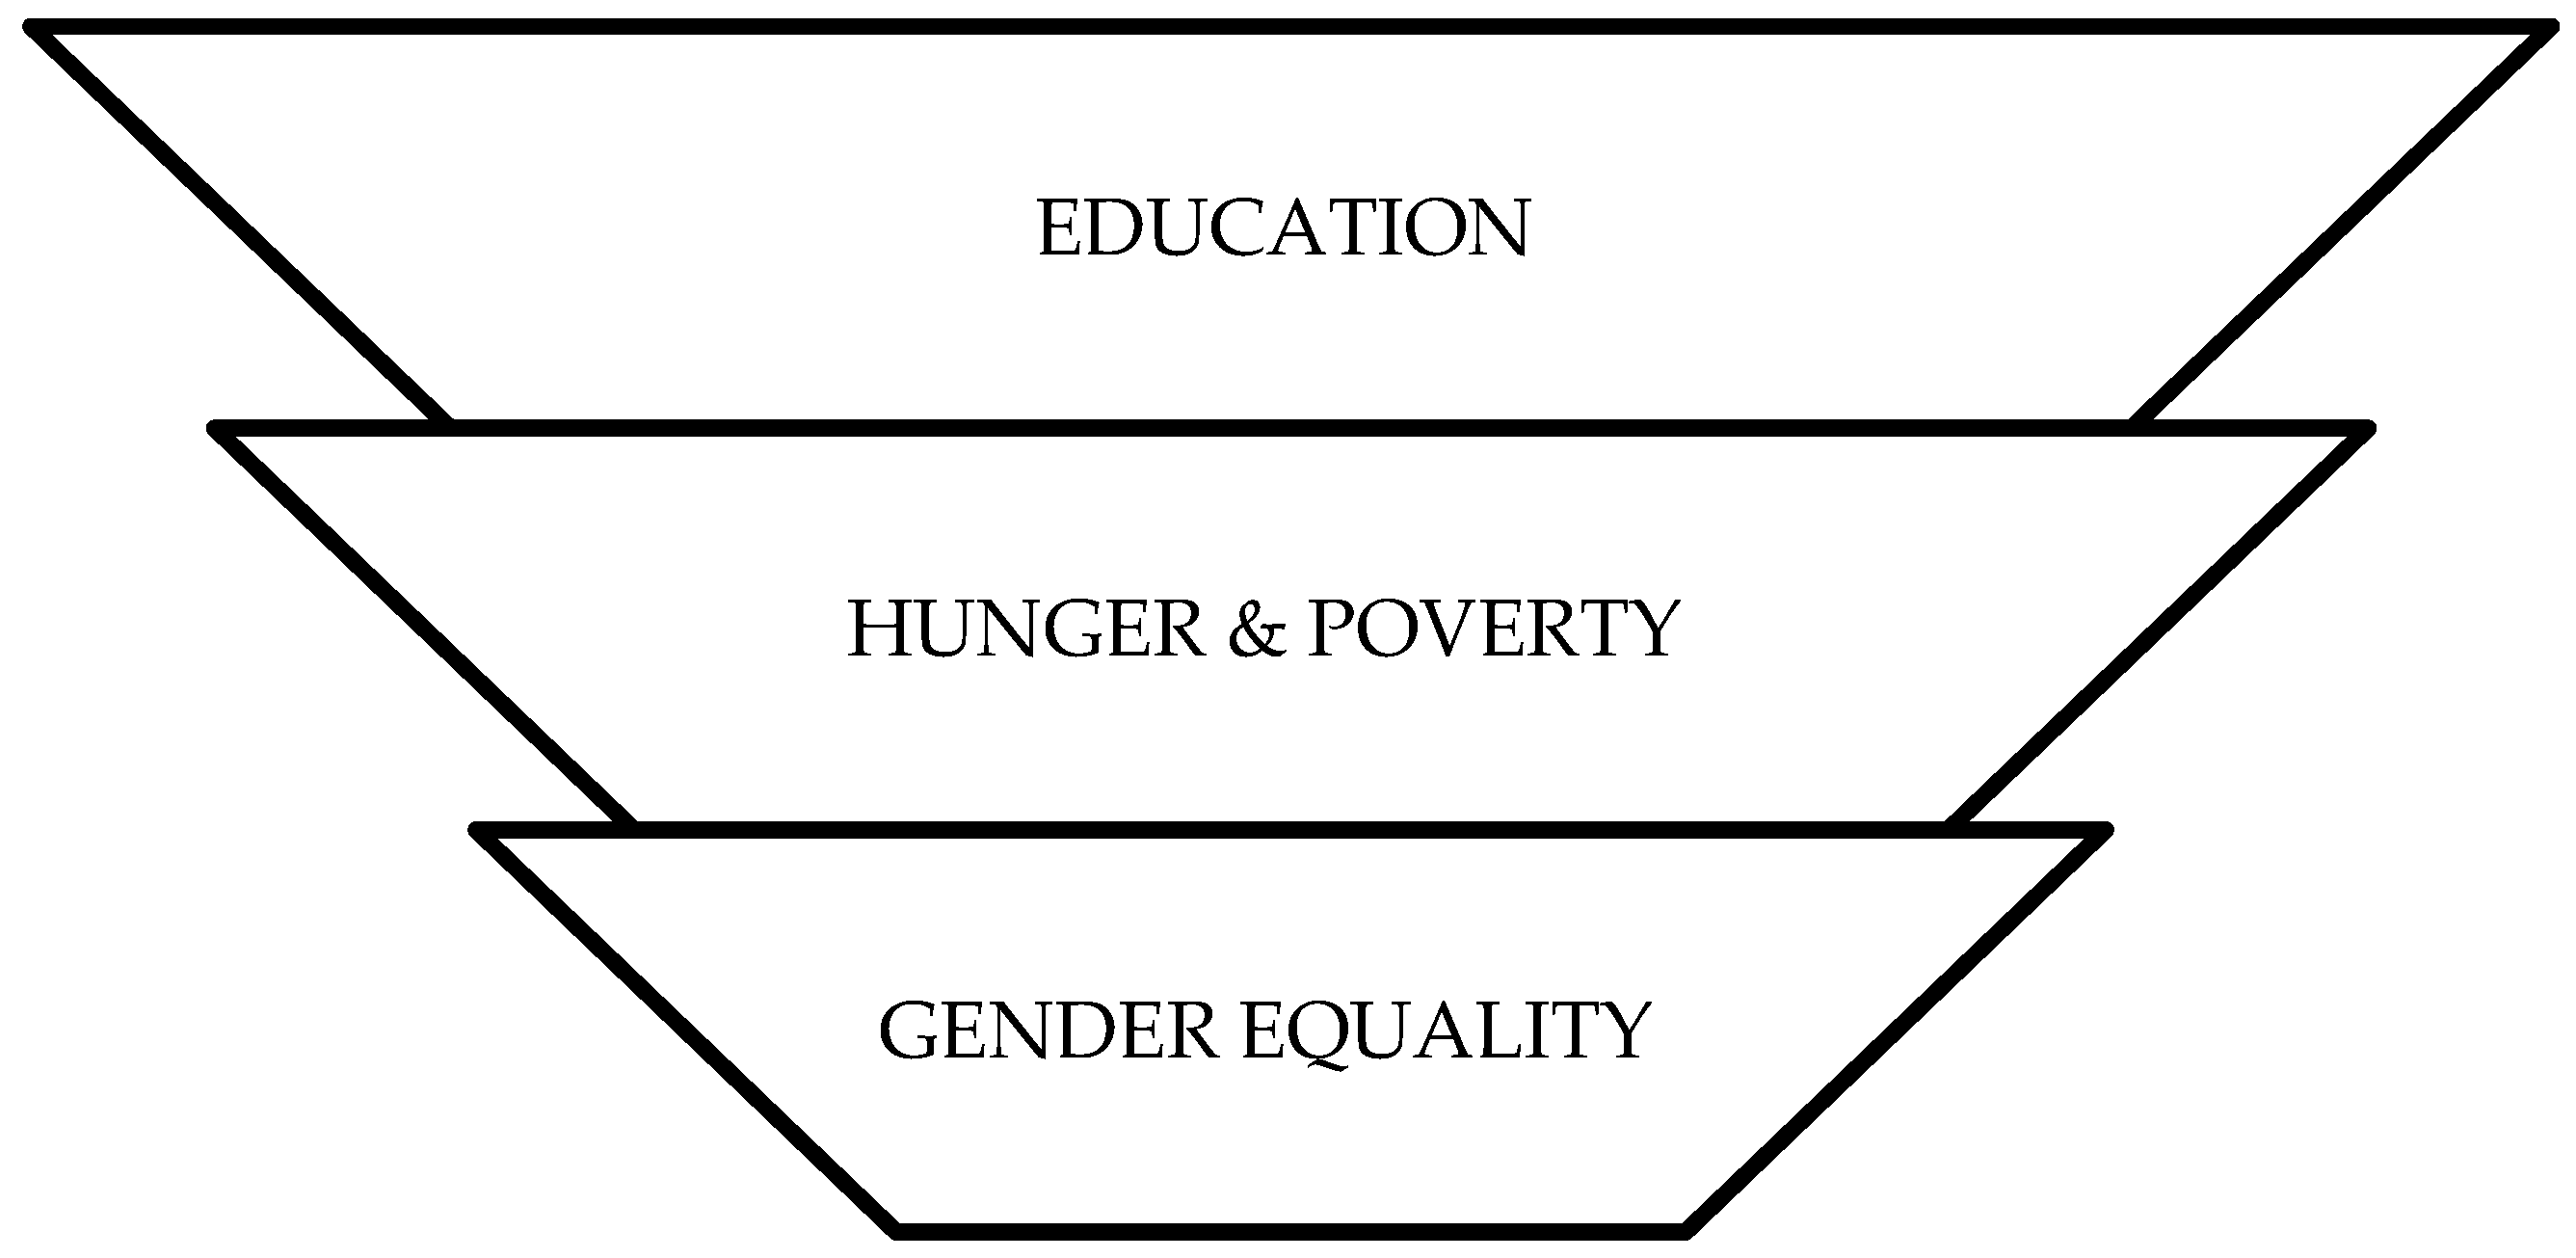
In countries like India, MNCs are among the largest investors in education. According to the CSR Rules (India), which took effect on 1 April 2014, companies meeting certain financial thresholds are required to spend 2% of their average profit over the last three years on social development initiatives, including education, healthcare, sanitation, and poverty alleviation. Among the 11 activities listed in Schedule VII of the rules, education, skill development, and healthcare remain the top priorities for Indian public sector units (PSUs). Furthermore, MNCs are increasingly collaborating with both central and state governments to address developmental challenges.
According to the NASSCOM report, education is the area with the most spending, followed by hunger and poverty, and gender equality (refer Figure 8). It is thus evident that MNCs need to develop a comprehensive look at the various areas of SDGs and thereafter deciding on their thrust areas. Research and evidence-based inputs such as through this research work can facilitate them in their decision-making towards achieving this objective.

2.5. Thematic Grouping and Critical Synthesis

There have been three thematic strands of prior research on smart city prioritization frameworks, particularly in the context of sustainable development: global trends and sustainable development:
(1)
Global trends and sustainable development: The difficulties posed by rapid industrialization, climate change, and socioeconomic inequality are highlighted in the early discussions [1,3,7]. These studies gave sustainable development agendas their start, but they did not have any specific guidelines for urban policy or private sector intervention. Although they provided data on global flood costs, they did not provide a structured framework for placing smart city initiatives in order of importance.
(2)
Frameworks and directions for action: The SDGs and the Paris Agreement gave us a planned way to deal with these problems [8]. However, these frameworks remained high-level and needed to be translated into city-level strategies that could be implemented. The Paris Agreement emphasized lowering greenhouse gas (GHG) emissions, but it did not explicitly link to specific smart city indicators that were relevant to local contexts.
(3)
Urbanization and economic factors: An examination of the economy, population, and emissions revealed that cities play a crucial role in driving economic expansion and greenhouse gas emissions [9,16,18]. Even though World Bank studies emphasized the significance of cities, they did not provide specific strategies for balancing economic growth with environmental sustainability. In addition, this does not take into account the urban poor, who make up more than 45% of the global population and are frequently left out of smart initiatives. Ref. [9] linked smart city themes to climate agreements like the Paris Accord but focused narrowly on carbon emissions, neglecting critical social dimensions such as health and sanitation. For example, [9] analyzed GHG emissions across income groups but omitted discussions on equitable resource distribution in urban contexts.

2.6. Gaps Addressed by This Study

Our work advances the field by addressing three critical limitations in prior research:
(1)
Policy operationalization: The SDGs and climate agreements are recognized as important in the existing literature, but there are no concrete ways to turn these global goals into local smart city priorities. By using BWM to identify and prioritize specific smart city themes aligned with SDG targets and national action plans (such as water and sanitation, wastewater, and health), this study closes this gap.
(2)
Context-specific prioritization: Although global trends and economic factors are well documented, a deeper comprehension of localized policy drivers is required. To address this limitation, our study uses expert-driven decision-making to ensure that priorities reflect the city’s unique context and its stakeholders, contrasting global directives with local demands.
(3)
Structured decision-making for MNEs: Previous research has acknowledged the role of MNEs in the development of smart cities, but it has not offered a structured framework for their strategic intervention. Our research provides MNEs with a replicable and scalable model for identifying significant domains and areas of opportunity for contributing to the UN SDGs while taking into account resource disparity and equity. This is accomplished by employing the best–worst method (BWM). The BWM framework brings in methodological rigor and reduces subjectivity and enhances consistency, particularly under constraints of limited expert input.

3. Methodology

3.1. Research Motivation and Background

A systematic literature review reveals a strong correlation between population growth, economic expansion, and greenhouse gas emissions, which collectively contribute to climate change challenges. In this context, urban settlements—particularly smart cities—emerge as a crucial enabler of sustainability. Prior research highlights the necessity of a holistic approach to tackling these challenges, emphasizing that multinational enterprises (MNEs) play a pivotal role in supporting the United Nations Sustainable Development Goals (UN SDGs).
Given this backdrop, our study is structured to empirically identify priority intervention areas in smart city development while aligning with the SDGs. This necessitates a research-driven, evidence-based approach to evaluating and prioritizing smart city themes. The central objective of this study is to identify and prioritize key smart city themes that align with the UN Sustainable Development Goals (SDGs), particularly SDG 11 (Sustainable Cities and Communities). Recognizing the strategic role of multinational enterprises (MNEs) in advancing urban sustainability, the study employs a structured decision-making framework to guide targeted interventions. In light of increasing urbanization and the need for scalable sustainability solutions, this research integrates expert insights with a robust analytical methodology to derive actionable priority areas for smart city development.

3.2. Research Questions

This study aims to answer the following key research questions (RQs):
RQ 1: In order to align with global sustainability objectives and climate agreements, how can indicators for smart cities be prioritized?
RQ 2: Why is the best–worst multi-criteria decision-making (BWM) method an optimal approach for prioritizing smart city themes compared to other MCDM techniques?
Table 6 addresses this question in detail.
RQ 3: How do these indicators drive strategic urban interventions and what are the main factors that influence MNE contributions to smart city development?
By addressing these questions, the study bridges the gap between theoretical discourse and practical urban sustainability frameworks.

3.3. Research Objectives

To systematically investigate these research questions, the study is structured around the following three key objectives:
(1)
To examine the role of cities in sustainable development, particularly their impact on climate mitigation and adaptation strategies.
(2)
To analyze the concept of “Smart Cities”, identifying key thematic areas and performance indicators relevant to sustainability.
(3)
To assess the prioritization of various smart city themes, applying a structured multi-criteria decision-making (MCDM) approach.

3.4. Research Scope and Methodology

The study focuses on smart city schematic themes and core performance indicators, as derived from an extensive literature review.

3.4.1. Primary Data Collection:

A questionnaire-based survey was conducted over one week, targeting 36 municipal officials with expertise in urban governance, sustainability policies, and smart infrastructure planning. The respondent profile includes assistant and executive engineers, health officers, and sanitary inspectors with degrees in engineering and medicine, ensuring domain relevance and diversity (refer to Table 7 and Figure 9 and Figure 10). The expert panel comprised 15 professionals with ≥10 years of experience in sustainability or smart city domains. Participants included academics (6), industry practitioners (5), and policymakers (4). The selection criteria prioritized expertise in SDG-aligned urban development.
Expert-driven insights were gathered using a purposive convenience sampling method, despite the study’s inherent limitations (such as a small sample size and regional policy variations).

3.4.2. Analytical Approach:

A systematic literature review provided an initial understanding of smart city sustainability dynamics.
Experts identified, ranked, and classified smart city themes into three impact domains:
(1)
Social impact criteria.
(2)
Environmental impact criteria.
(3)
Economic impact criteria.
The best–worst method (BWM) was applied to derive the priority weights of key criteria, ensuring a structured multi-criteria decision-making process. The scope of the study comprises smart city schematic themes and core performance indicators as per the literature review with a particular focus on the review of the ISO 37120 smart city standard. The responses/primary data were collected through the questionnaire over a period of one week from a sample of 36 urban municipal officials closely working in the domain of urban development. Convenience sampling was used for the descriptive and exploratory study. Using a purposive convenience sampling strategy, 36 municipal officials from various Indian smart cities with expertise in urban governance, sustainability policies, and smart infrastructure planning were selected for this study. While this sampling approach enables us to capture expert-driven insights, we acknowledge certain limitations:
(1)
The relatively small sample size may limit broader generalizability.
(2)
Regional policy variations across smart cities may influence prioritization outcomes.
(3)
To improve robustness and cross-regional comparisons, future studies should take into account a larger, more diverse expert panel.
The quantitative technique of the best–worst method is used for analysis. Towards achieving the framed objectives, the following procedure is used:
First, the crucial role of smart cities in sustainability is assessed and analyzed through evidence based on a systematic literature review. Second, the themes and indicators of smart cities particularly relevant from the perspective of interventions are identified with the help of a literature review and inputs from 36 experts closely associated with the urban planning and implementation. Third, the experts are asked to score (on a scale of 1–100) the identified indicators (as above) to assess the preliminary ranking of the various indicators and identify critical criteria for a smart city, according to them. Fourth, in consultation with the experts, the above identified themes are grouped into three major groups of social-impact-related criteria, environmental-impact-related criteria, and economic-impact-related criteria. Fifth, the priority/weights of the top/major criteria groups by the experts are found using the best–worst multi- criteria decision-making method described in Section 3.5.

3.5. Best–Worst Multi-Criteria Decision-Making Method

To ensure methodological rigor and consistency in prioritizing smart city themes, the best–worst method (BWM), a recent advancement in multi-criteria decision-making (MCDM), was adopted. BWM stands out for requiring fewer pairwise comparisons, reducing the cognitive load on experts while enhancing the consistency of judgments. The process begins by identifying the ‘best’ (most important) and ‘worst’ (least important) criteria, followed by pairwise comparisons of these extremes with all other criteria. Using a linear programming model, optimal weights are then calculated to reflect the relative importance of each theme. This technique is particularly suited for expert-driven studies with limited sample sizes, making it ideal for our analysis involving 36 municipal officials. The resulting priority weights provide a robust and replicable framework for guiding smart city policy and MNE interventions. Multi-criteria decision-making (MCDM) is a very important branch of decision-making theory for handling discrete solution space problems [13]. The best–worst method (BWM), a new method introduced in 2014, is chosen over other MCDM techniques/methods such as the Analytic Hierarchy Process (AHP) because statistical results have shown its better performance through measures such as the consistency ratio, minimum violation, total deviation, and conformity. Unlike the AHP, which requires a large number of pairwise comparisons (n (n − 1)/2), the BWM reduces the burden to just 2n − 3 comparisons, increasing consistency and reliability. TOPSIS and VIKOR, while effective in alternative ranking, require complex normalization and are sensitive to scaling of input data. In contrast, BWM focuses solely on priority weights without complex mathematical transformation, making it ideal for expert-driven contexts like ours. The decision-making challenges in our expert-based study parallel the optimization trade-offs discussed by [41,42] in their work on distributed matrix multiplication under constraints of randomness and privacy. Their emphasis on optimization under constraint parallels our need to adopt BWM in a bounded comparison framework with expert-based judgments, thus further validating our methodological choice. Further, it is cited to accomplish the objective of MCDM with fewer comparison data and produces more reliable results.
A clear justification for choosing the best–worst multi-criteria decision-making (BWM) method over alternative techniques such as the Analytic Hierarchy Process (AHP) or Technique for Order of Preference by Similarity to Ideal Solution (TOPSIS) thus emanates from the following three main reasons:
(1)
Higher consistency: BWM requires fewer pairwise comparisons, reducing inconsistencies compared to AHP [13].
(2)
Improved decision-making efficiency: BWM generates more reliable rankings with fewer subjective biases, which is essential for strategic urban planning.
(3)
Better handling of small sample sizes: Given our expert-driven survey (n = 36 municipal officials), BWM is more suitable than statistical methods requiring larger datasets.
A detailed comparison of BWM vs. other MCDM techniques is shown in Table 6. This new method along with a new ISO standard for smart cities makes this study the first of its kind.
The steps involved in BWM are as follows:
Step 1: Identify the number of decision criteria depending upon the problem/study. If a problem has n criteria, then this set could be shown as {c1, c2, c3, …, cn}.
Step 2: Next, based on the opinion of the key decision-maker/expert, the best (i.e., the most desirable or the most important or top priority) and the worst (i.e., the least desirable or the least important or the lowest priority) criteria are determined.
Step 3: Next, the preference of the decision-maker/expert for the ‘Best’ criterion over all the other criteria is determined on a scale of 1 to 9, where:
  • Signifies equal importance/preference/priority.
  • Signifies somewhere between equal and moderate importance/preference/priority.
  • Signifies moderately more important/preferred/priority.
  • Signifies somewhere between moderate and strong importance/preference/priority.
  • Signifies strongly more important/preferred/priority.
  • Signifies somewhere between strong and very strong importance/preference/priority.
  • Signifies very strongly important/preferred/priority.
  • Signifies somewhere between very strong and absolute importance/preference/priority.
  • Signifies absolutely more important/preferred/priority.
The resulting best-to-others vector can then be represented as AB = {αB1, αB2, αB3, …, αBn}, where αBj indicates the preference of the best criterion B over criterion j. It is evident that αBB = 1.
Step 4: Similarly, the preference of the same decision-maker/expert (as above) for all the other criteria over the ‘Worst’ criterion is determined on the same scale of 1 to 9 (as above), where:
  • Signifies equal importance/preference/priority.
  • Signifies somewhere between equal and moderate importance/preference/priority.
  • Signifies moderately more important/preferred/priority.
  • Signifies somewhere between moderate and strong importance/preference/priority.
  • Signifies strongly more important/preferred/priority.
  • Signifies somewhere between strong and very strong importance/preference/priority.
  • Signifies very strongly important/preferred/priority.
  • Signifies somewhere between very strong and absolute importance/preference/priority.
  • Signifies absolutely more important/preferred/priority.
The resulting others-to-worst vector can then be represented as AW = {α1W, α2W, α3W, …, αnW}, where αjW indicates the preference of the criterion j over the worst criterion W. It is evident that αWW = 1.
Step 5: The optimal weights for various criteria (as identified in Step 1) using a linear programming model are as follows:
The optimal weights vector for various criteria c1, c2, c3, …, cn represented as W = {w1*, w2*, w3*, …, wn*}. The optimal weight wj* for a criterion cj is that value of wj, where, for each pair of wB/wj and wj/ww, we have wB/wj = αBj and wj/wW = αjW. In order to satisfy the above conditions for all j, a solution is required where the maximum absolute differences |wB/wj − αBj| and |wj/wW − αjW| for all j are minimized. For a non-negative value of weights, this implies the following min–max problem:
  • Min maxj {|wB/wj – αBj|, |wj/wW – αjW|}.
  • Subject to: For all j, Ʃj wj = 1 (i.e., sum total of all weights = 1);
  • and wj ≥ 0 (i.e., non-negative weights of all criteria).
This model can be solved after converting it into a linear programming model as follows:
For all j,
  • |wB/wj − αBj| ≤ ξ and |wj/wW − αjW| ≤ ξ.. Subject to: Ʃj wj = 1;
  • and wj ≥ 0.
ξ is called the consistency ratio, which should be minimum i.e., as close to zero as possible.
The best–worst method (BWM) is employed in this study to prioritize smart city themes based on expert evaluations. BWM, a multi-criteria decision-making (MCDM) technique, enhances decision accuracy by reducing inconsistencies in pairwise comparisons. To ensure a structured and methodical ranking process, experts must determine the most and least important criteria and evaluate their relative importance. To validate the consistency of expert judgments, the consistency index (CI) is calculated. The CI measures the degree of agreement in pairwise comparisons, ensuring that the assigned weights maintain logical coherence. A lower CI value indicates greater indicator prioritization reliability. These methodological refinements strengthen the robustness of the study’s findings, providing a clear justification for the prioritization process used in smart city planning and sustainability assessments.
The solution (Excel Solver can be used for this) to the above linear programming problem yields the optimal value of weights for the various criteria {w1*, w2*, w3*, …, wn*} and ξ*.

4. Results

4.1. Profile of the Respondents

The officials of the urban municipal development corporation authority are well-educated professionals, primarily with backgrounds in engineering and medicine, and possess significant experience in urban planning and administration. The profile of the respondents is indicated in Table 7 and Figure 9 and Figure 10.

4.2. Analysis

The score (on a scale of 100) and subsequent ranking of the different smart city themes based on the Z-Scores of the municipal corporation authorities (respondents) are provided in Table 8. Based on expert consultation, the seventeen criteria were classified under the three pillars of the triple bottom line: social impact, environmental impact, and economic impact. Table 9 illustrates this. Compared to frameworks like ISO 37120, our expert prioritization aligns significantly, especially on themes like water, sanitation, and waste management—underscoring cross-contextual consistency. Compared to the EU Smart City Framework’s emphasis on energy efficiency, our study prioritizes water/sanitation, reflecting developing economies’ infrastructural needs. Similarly, the Asian Development Bank’s focus on waste management aligns with our second-ranked theme, validating the framework’s applicability.
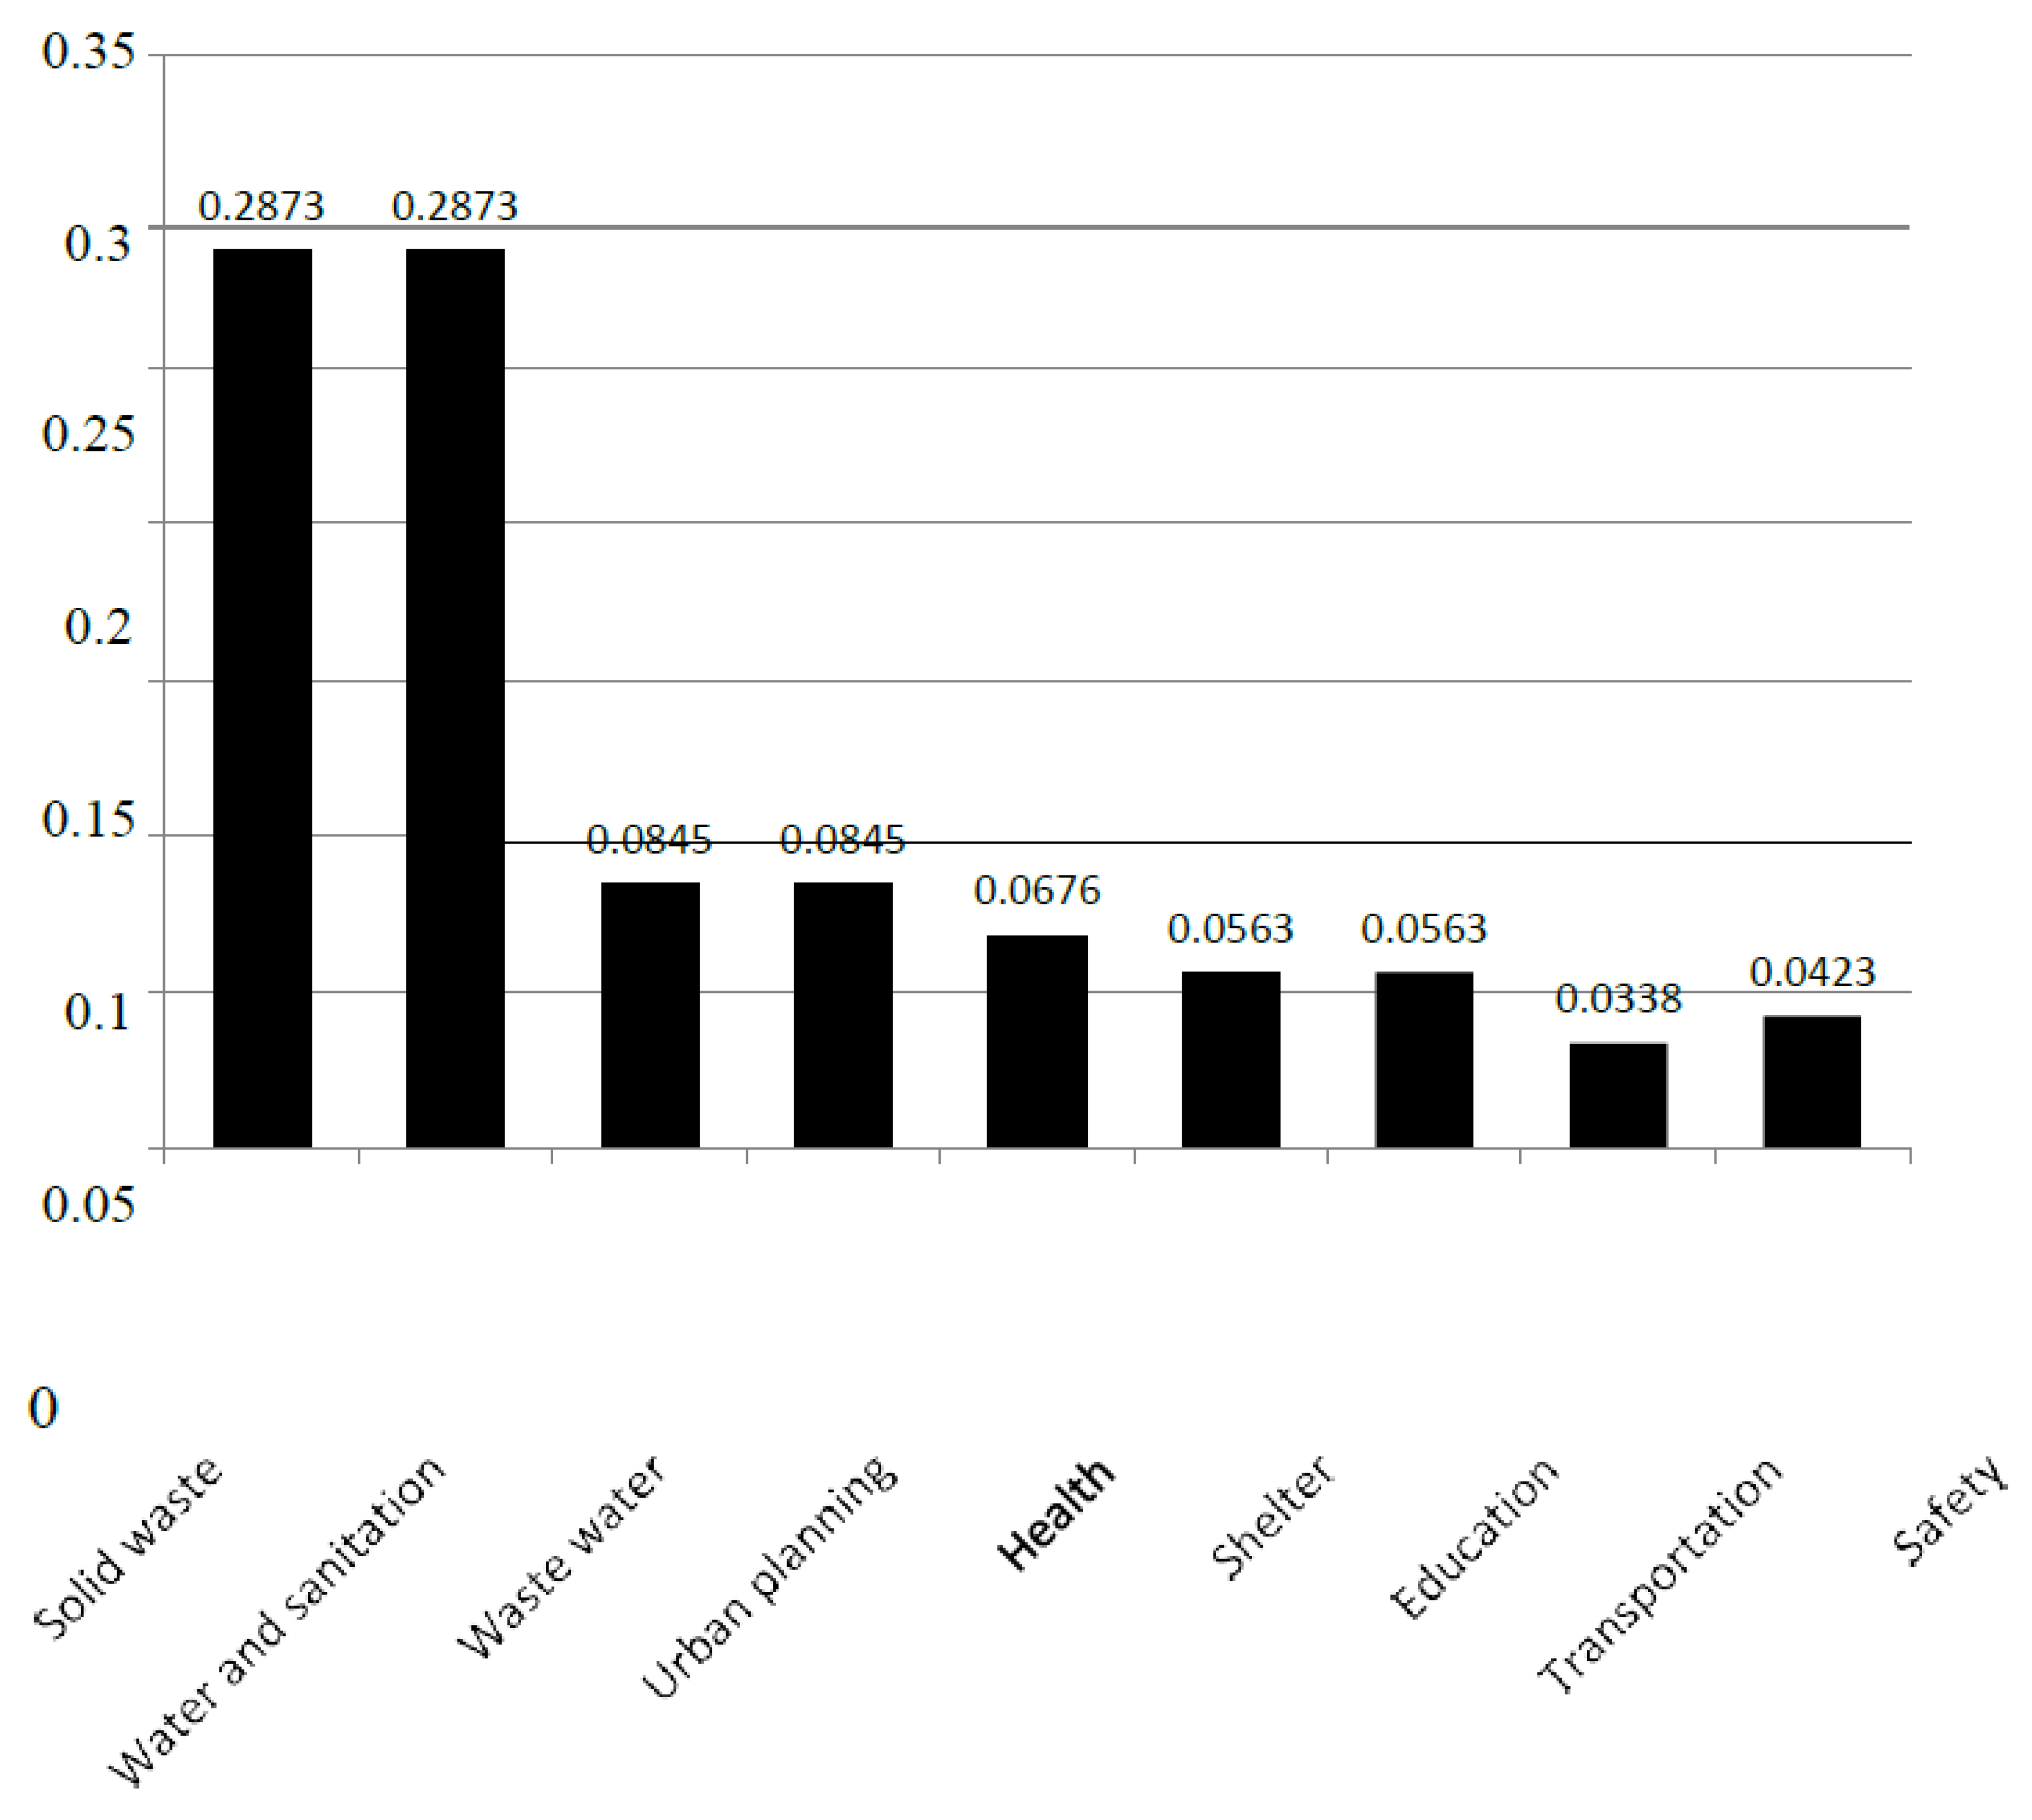
Table 10 displays the pairwise comparison vector for the best criterion, while Table 11 displays the pairwise comparison vector for the worst criteria and as can be observed from Table 12, solid waste and water and sanitation received the highest priority weight (0.28) in the BWM analysis, followed by waste water and urban planning (0.08).

5. Discussion

According to the experts, the top 50% of the criteria, or Rank 1–9 criteria that cut across social and environmental impact dimensions, were selected for the best–worst method of estimating the criteria weights. The best–worst method (BWM) was used to weight the following top 50 percent of criteria (Ranks 1 through 9) because analyzing all 17 criteria simultaneously would be less effective:
  • Solid waste;
  • Sanitation and water;
  • Water waste;
  • Transportation;
  • Health;
  • Shelter;
  • Education;
  • Urban planning;
  • Security.
Using the BWM described in Section 3.1, Table 10 displays the pairwise comparison vector for the best criterion, while Table 11 displays the pairwise comparison vector for the worst criteria. Table 12 and Figure 11 display the ideal weights for the criteria determined by BWM. Following the identification of the criteria’s priority and ideal weights based on a review of the literature and expert consultation, Table 13 lists some indicators that MNEs can help improve. Table 14 indicated the mapping of top smart city themes with SDG 11 targets.
The prioritization of solid waste and water and sanitation (weight = 0.28) underscores its centrality to SDG 6 compliance, particularly Target 6.1 on universal access to safe drinking water. This finding aligns with past studies, which identified water scarcity as a key barrier in urbanizing regions. Further, as can be seen, “Safety” received the lowest ranking among the smart city criteria. This deviation from the global urban planning literature, where safety is typically a top priority, may be influenced by contextual factors. The experts surveyed—primarily urban municipal officials in India—might prioritize infrastructural needs like water, sanitation, and waste management due to their immediate visibility, political mandates, or budget constraints. Cultural perceptions of public safety, regional disparities in crime, and a belief that safety is an outcome of improved infrastructure (e.g., better lighting and public spaces) may also influence this lower ranking. This contrasts with SDG 11.7, which emphasizes the provision of safe, inclusive, and accessible public spaces. Therefore, the observed deprioritization invites further exploration into how localized governance priorities align—or diverge—from global sustainability goals. The lower ranking of ‘Safety’ among smart city criteria may be attributed to expert bias, where municipal officials prioritized infrastructure and economic factors over safety. Additionally, some respondents viewed safety as an outcome of broader smart city policies rather than an independent priority criterion. Thus, the possible reasons could be summarized as follows:
(1)
Expert bias and sampling constraints: The municipal officials surveyed may have put their professional focus on infrastructure, the environment, and economics over safety.
(2)
Comparative weighting against other indicators: The study’s results indicate that environmental resilience, governance efficiency, and mobility infrastructure were seen as more critical for sustainability impact.
(3)
Contextual factors: Some respondents viewed safety as an outcome of broader smart city policies (e.g., public surveillance, law enforcement integration, and digital governance) rather than an independent priority criterion.
Consistency ratio = ξ* = 0.0507 = 0.0097
Consistency index 5.23 (from the consistency index table given with BWM). Since the consistency ratio is quite close to zero, it implies a very good consistency.

6. Conclusions

This research focused on smart city themes that are relevant to multinational corporations and the Sustainable Development Goals. The BWM-based framework provides a replicable tool for aligning corporate strategies with SDG targets, particularly SDG 6 and 11. With the best–worst method, we determined that “Solid Waste”, “Water and Sanitation”, “Waste Water”, and “Urban Planning” are the most salient themes according to expert views. These themes have good correspondences with significant targets in SDG 6, SDG 11, and India’s national action plans. Thus, this study also implies “Solid Waste”, “Water and Sanitation”, “Waste Water”, and “Urban Planning” are the top four priority themes for MNEs investing in smart city sustainability. We also discovered evident correspondences between the prioritization framework and particular sections of the Paris Agreement, namely Articles 7 and 9. The findings emphasize the significance of evidence-based urban policies that are context-specific and offer a model of smart city planning that functions globally and locally. However, the reliance on expert opinions from a single geographic region limits generalizability. Future research should validate this framework across diverse cultural and economic contexts, incorporating quantitative data on implementation costs and ROI. Future research can utilize more cities and countries to further enhance the findings.

6.1. Managerial Implications

It might be worthwhile to highlight the following words from the UN Secretary General address of 18 September 2017: “We can choose to bemoan the lack of financing for the 2030 Agenda in a world awash with so much unproductive and unrewarding finance. Or we can grasp the opportunity to reshape finance, according to our urgent, collective needs. The choice is clear. Let us invest in the 2030 Agenda and finance a better world for all”.
-
António Guterres [44].
This research work has significant implications for managers of multinational enterprises wishing to contribute to the UN Sustainable Development Goals. Amidst growing attention to the ethical, environmental, and social dimensions of business, most often under the corporate social responsibility (CSR) heading, this study provides them with research and evidence-based inputs for effective and efficient decision-making. Based on the above analysis, as can be seen from Figure 11, solid waste and water and sanitation are assigned the top priority and considered most critical by the respondents. These are followed by wastewater, urban planning, health, shelter, education, safety, and transportation. Thus, multinational enterprises could accordingly align their strategies to target prioritizing, monitoring, and controlling their interventions or funding in these areas coupled with increased citizens’ awareness and engagement. Many companies should also perceive longer-term returns from promoting sustainable development, including stronger competitive advantage, preservation of crucial resources and raw materials, favorable corporate image, and opportunities for new product and process development. While creating voluntary environmental programs, often under the label of `corporate citizenship’, the transnational corporations can keep the outcomes of this study in mind and play a pivotal role in the design, diffusion, and consolidation of sustainable development in the context of urban planning and smart cities. Thus, this study pitches a significant scope for MNEs to adopt a triple bottom line approach and target a balance between profit (economy), environment (planet), and society (people) by contributing to the UN SDGs. This study also acts as an enabler to integrate the sustainable development component in decision-making processes by assisting stakeholders with useful information to assist in development of public policies, decision-making, territorial planning, and increasing citizens’ awareness on sustainability issues.

6.2. Practical Implications for Smart City Planning and Policy-Making

The findings of the study can inform smart city policies as follows:
(1)
Strategic policy recommendations: Our prioritization results can guide urban planners and policymakers in allocating resources more effectively to high-impact areas.
(2)
MNE contributions to smart cities: The study reinforces the role of multinational enterprises (MNEs) in financing and implementing urban sustainability solutions, aligning with the SDGs.
(3)
Future research and policy applications: The findings encourage policymakers to consider regional variations, adaptive urban policies, and cross-sector collaborations to enhance the practical implementation of smart city frameworks.
(4)
MNEs can support smart solutions such as IoT-based waste tracking, decentralized water purification systems, and digital health dashboards, thereby operationalizing the SDGs through technology. They can play a vital role in public–private partnerships for water infrastructure and technology transfer programs for waste management. MNEs could collaborate with municipalities to deploy IoT-enabled water quality monitoring systems in Tier-2 cities. Tech firms might establish innovation hubs for frugal waste-to-energy solutions in partnership with local startups.
(5)
The high prioritization of themes such as solid waste and water/sanitation also reflects the alignment between local urban planning priorities and international climate targets under the Paris Agreement and SDG 11. This suggests potential synergies in financing, infrastructure development, and MNE involvement for operationalizing global sustainability frameworks at the city level.
The study’s conclusions are grounded in a dual validation: first, through expert-driven prioritization using BWM, and second, by mapping these priorities to concrete SDG sub-indicators and national action plans. This ensures that the proposed framework is both methodologically sound and policy-relevant, offering actionable insights for MNEs and urban policymakers.

6.3. Limitations and Future of the Study

Due to constraints, especially in terms of resources, some limitations are unavoidable in any research study. However, on a positive note, these limitations also provide an opportunity for extending the work, i.e., future scope of the study. In the current study, considering the involved respondents’ employment with the government department, a possibility cannot be ruled out that responses from some of them might be influenced in favor of few of the indicators with which their performance might be linked. A larger and more diverse group of experts may be considered in future studies along with an inbuilt cross-check to detect such influence. Further, the majority of the respondents are from an engineering and medical education background. So, the views of less educated common people or people from other diverse educational backgrounds can be incorporated in future studies. Also, a limited sample size (36 experts/respondents) with convenience sampling has been used in the current study. A larger sample size may be used in future studies. Last but not the least, using a similar approach, the study can be extended in future to include other themes of smart cities with their associated indicators. The study framework, particularly the application of BWM, can be replicated in other countries or urban contexts with stakeholder-specific data, allowing contextual adaptation.

Author Contributions

Conceptualization, N.S.; Methodology, R.K. and M.A.; Validation, N.S.V.; Formal analysis, N.S.V.; Writing—original draft, N.S.; Writing—review & editing, N.S.V., M.A. and J.R.S.; Supervision, R.K., N.S.V. and J.R.S. All authors have read and agreed to the published version of the manuscript.

Funding

This research received no external funding.

Institutional Review Board Statement

Not applicable.

Informed Consent Statement

Not applicable.

Data Availability Statement

Data are contained within the article.

Conflicts of Interest

The authors declare no conflict of interest.

References

  1. Sharma, N.; Agrawal, R. Environment Impact Assessment: Theory and Practices in South Asia—A Case of Indian Institute of Technology Roorkee, India (The Oldest Engineering Institute of Asia). In Proceedings of the ICRBS-2017, Roorkee, India, 16–27 December 2017. [Google Scholar]
  2. Kumar, S. Why Sustainability and Climate Change Is Everyone’s Business. 2014. Available online: https://mail.google.com/mail/u/0/#search/satish+kumar/p2?projector=1 (accessed on 9 March 2016).
  3. Hansen, J.; Ruedy, R.; Sato, M.; Lo, K. Global surface temperature change. Rev. Geophys. 2010, 48, 1–29. [Google Scholar] [CrossRef]
  4. Horsley, P.M.; Huang, A.R. The Aging Population and Falls: Consequences and Costs. In Medication-Related Falls in Older People; Adis: Cham, Switzerland, 2016; pp. 7–11. [Google Scholar]
  5. Hansen, J.; Kharecha, P.; Sato, M.; Masson-Delmotte, V.; Ackerman, F.; Beerling, D.J.; Hearty, P.J.; Hoegh-Guldberg, O.; Hsu, S.-L.; Rockstrom, J.; et al. Assessing “dangerous climate change”: Required reduction of carbon emissions to protect young people, future generations and nature. PLoS ONE 2013, 8, e81648. [Google Scholar] [CrossRef] [PubMed]
  6. Hallegatte, S.; Green, C.; Nicholls, R.J.; Corfee-Morlot, J. Future flood losses in major coastal cities. Nat. Clim. Change 2013, 3, 802–806. [Google Scholar] [CrossRef]
  7. Earthian, W. 2014. Available online: https://www.wipro.com/newsroom/press-releases/archives/wipro-launches-4th-edition-of-earthian--sustainability-education/#:~:text=Wipro%20Ltd.%20today%20announced%20the%20launch%20of,sustainability%20education%20program%20in%20schools%20and%20colleges (accessed on 30 November 2015).
  8. UN Documents Gathering a Body of Global Agreements. Our Common Future, From One Earth to One World. Available online: http://www.un-documents.net/ocf-ov.htm (accessed on 9 March 2016).
  9. World Bank Group. Word Bank Data 2015. Available online: https://data.worldbank.org/ (accessed on 31 August 2016).
  10. Guterres, A. A UN of the Future to Effectively Serve All Member States; Letter from the Secretary General to United Nations Member States. Available online: https://www.peacewomen.org/sites/default/files/A%20UN%20Of%20The%20Future%20To%20Effectively%20Serve%20All%20Member%20States.pdf (accessed on 31 May 2017).
  11. Ragazzo, L. Urban Development and The World Bank: Historical Perspective and Present-Day Programs. Master’s Thesis, Università Ca’Foscari Venezia, Venezia, Italy, 2021. [Google Scholar]
  12. Kola-Bezka, M.; Kuzel, M. Global Cities and Multinational Enterprises: Integrating the Existing Concepts for Future Research Studies. 2023. Available online: https://repozytorium.umk.pl/handle/item/6977 (accessed on 4 April 2025).
  13. NASSCOM. Catalyzing Change: Study of CSR Trends in the IT-BPM Sector: 2016–17; NASSCOM: Noida, India, 2017. [Google Scholar]
  14. Kramers, A.; Höjer, M.; Lövehagen, N.; Wangel, J. Smart sustainable cities–Exploring ICT solutions for reduced energy use in cities. Environ. Model. Softw. 2014, 56, 52–62. [Google Scholar] [CrossRef]
  15. Brundtland Commission. Report of the World Commission on Environment and Development; United Nations: New York, NY, USA, 1987. [Google Scholar]
  16. United Nations, Department of Economic and Social Affairs, Population Division (2014). World Urbanization Prospects: The 2014 Revision. Available online: https://esa.un.org/unpd/wup/publications/files/wup2014-report.pdf (accessed on 10 March 2018).
  17. Galka, M. What Trump and Hillary Spent vs Every General Election Candidate Since 1960. 2016. Available online: https://www.huffpost.com/entry/56-years-of-presidential-campaign-spending-how-2016_b_5820bf9ce4b0334571e09fc1 (accessed on 10 March 2018).
  18. Central Intelligence Agency (Ed.) The World Factbook 2007; Government Printing Office: Washington, DC, USA, 2007. [Google Scholar]
  19. Kazmi, A.A.; Vellanki, B.P. EIA Course Study -Civil Engineering Deptt., IIT Roorkee. 2014. [Google Scholar]
  20. World Bank Group. World Development Indicators 2014; World Bank Publications: Washington, DC, USA, 2014. [Google Scholar]
  21. Express, F. 13 Crore Population Across 98 Cities Which Is 35% of Urban Population Will Be Covered Under SmartCity Mission. 2015. Available online: https://indianexpress.com/article/business/business-others/plan-to-cover-35-of-urban-india-will-benefit-13-cr-people/ (accessed on 16 August 2016).
  22. Economy, N.C. Better Growth, Better Climate. The New Climate Economy Report; World Resources Institute (WRI), New Climate Economy: Washington, DC, USA, 2014. [Google Scholar]
  23. UN. United Nations General Assembly Draft Outcome Document of the United Nations Summit for the Adoption of the Post-2015 Development Agenda. Available online: https://digitallibrary.un.org/record/800852?ln=en&v=pdf (accessed on 25 September 2015).
  24. Colglazier, W. Sustainable development agenda: 2030. Science 2015, 349, 1048–1050. [Google Scholar] [CrossRef] [PubMed]
  25. ISO. SmartCities Report. 2014. Available online: http://www.iso.org/iso/smart_cities_report-jtc1.pdf (accessed on 31 August 2016).
  26. The Hindu. Centre Unveils List of 98 Smart Cities; UP, TN Strike It Rich. Available online: https://www.thehindu.com/news/national/Centre-releases-list-of-98-cities-for-Smart-City-project/article60492135.ece (accessed on 28 August 2015).
  27. Smart City Council. Definition and Overviews. 2014. Available online: https://smartcitiescouncil.com/ (accessed on 31 August 2016).
  28. Caragliu, A.; Del Bo, C.; Nijkamp, P. Smart Cities in Europe, Series Research Memoranda 0048; VU University Amsterdam, Faculty of Economics, Business Administration and Econometrics: Amsterdam, The Netherlands, 2009. [Google Scholar]
  29. URENIO. Intelligent City Platforms. Available online: https://www.urenio.org/ (accessed on 9 March 2016).
  30. Peris-Ortiz, M.; Bennett, D.; Yábar, D.P.B. (Eds.) Sustainable Smart Cities: Creating Spaces for Technological, Social and Business Development; Springer: Berlin/Heidelberg, Germany, 2016. [Google Scholar]
  31. Hollands, R.G. Will the real smart city please stand up? Intelligent, progressive or entrepreneurial? City 2008, 12, 303–320. [Google Scholar] [CrossRef]
  32. Ministry of Housing and Urban Affairs, Government of India. Smart Cities Mission. 2015. Available online: https://urbanschemes.up.in/Home/smart_city_mission (accessed on 3 August 2016).
  33. SmartCities.gov.in. Available online: http://smartcities.gov.in/ (accessed on 21 September 2016).
  34. UK Government Department for Business, Innovation and Skills. “Smart Cities–Background Paper” (PDF); UK Government Department for Business, Innovation and Skills: London, UK, 2013. [Google Scholar]
  35. Government of India–Ministry of Urban Development. “Draft Concept Note on Smart City Scheme” (PDF). Available online: https://smartcities.gov.in/themes/habikon/files/SmartCityGuidelines.pdf (accessed on 31 August 2015).
  36. Department for Business Innovation and Skills. Smart Cities Background Paper. 2013. Available online: https://assets.publishing.service.gov.uk/government/uploads/system/uploads/attachment_data/file/246019/bis-13-1209-smart-cities-background-paper-digital.pdf (accessed on 30 May 2015).
  37. Ministry of Urban Development, GOI. “Mission Statement and Guidelines–Smart Cities” (PDF). Available online: http://164.100.161.224/upload/uploadfiles/files/SmartCityGuidelines(1).pdf (accessed on 1 February 2016).
  38. Smart City–Definition. Available online: https://www.emerald.com/insight/content/doi/10.1108/09504120910935183/full/html (accessed on 31 August 2015).
  39. Glaeser, E.L.; Berry, C.R. Why Are Smart Places Getting Smarter; Rappaport Institute/Taubman Center Policy Brief: Cambridge, MA, USA, 2006; Volume 2. [Google Scholar]
  40. McIntyre, J.R.; Ivanaj, S.; Ivanaj, V. (Eds.) Strategies for Sustainable Technologies and Innovations; Edward Elgar Publishing: Cheltenham, UK, 2013. [Google Scholar]
  41. Dogar, M.I.; Álvarez, G. National Model United Nations. In Proceedings of the NMUN Galapagoc 2024, San Cristóbal Island, Ecuador, 22 November–1 December 2024. [Google Scholar]
  42. Morteza, A.; Chou, R.A. Distributed Matrix Multiplication: Download Rate, Randomness and Privacy Trade-Offs. In Proceedings of the 2024 60th Annual Allerton Conference on Communication, Control, and Computing, Urbana, IL, USA, 24–27 September 2024; pp. 1–7. [Google Scholar]
  43. Rezaei, J. Best-worst multi-criteria decision-making method: Some properties and a linear model. Omega 2016, 64, 126–130. [Google Scholar] [CrossRef]
  44. The World Population Prospects: 2015 Revision. Available online: https://www.un.org/ (accessed on 6 May 2017).
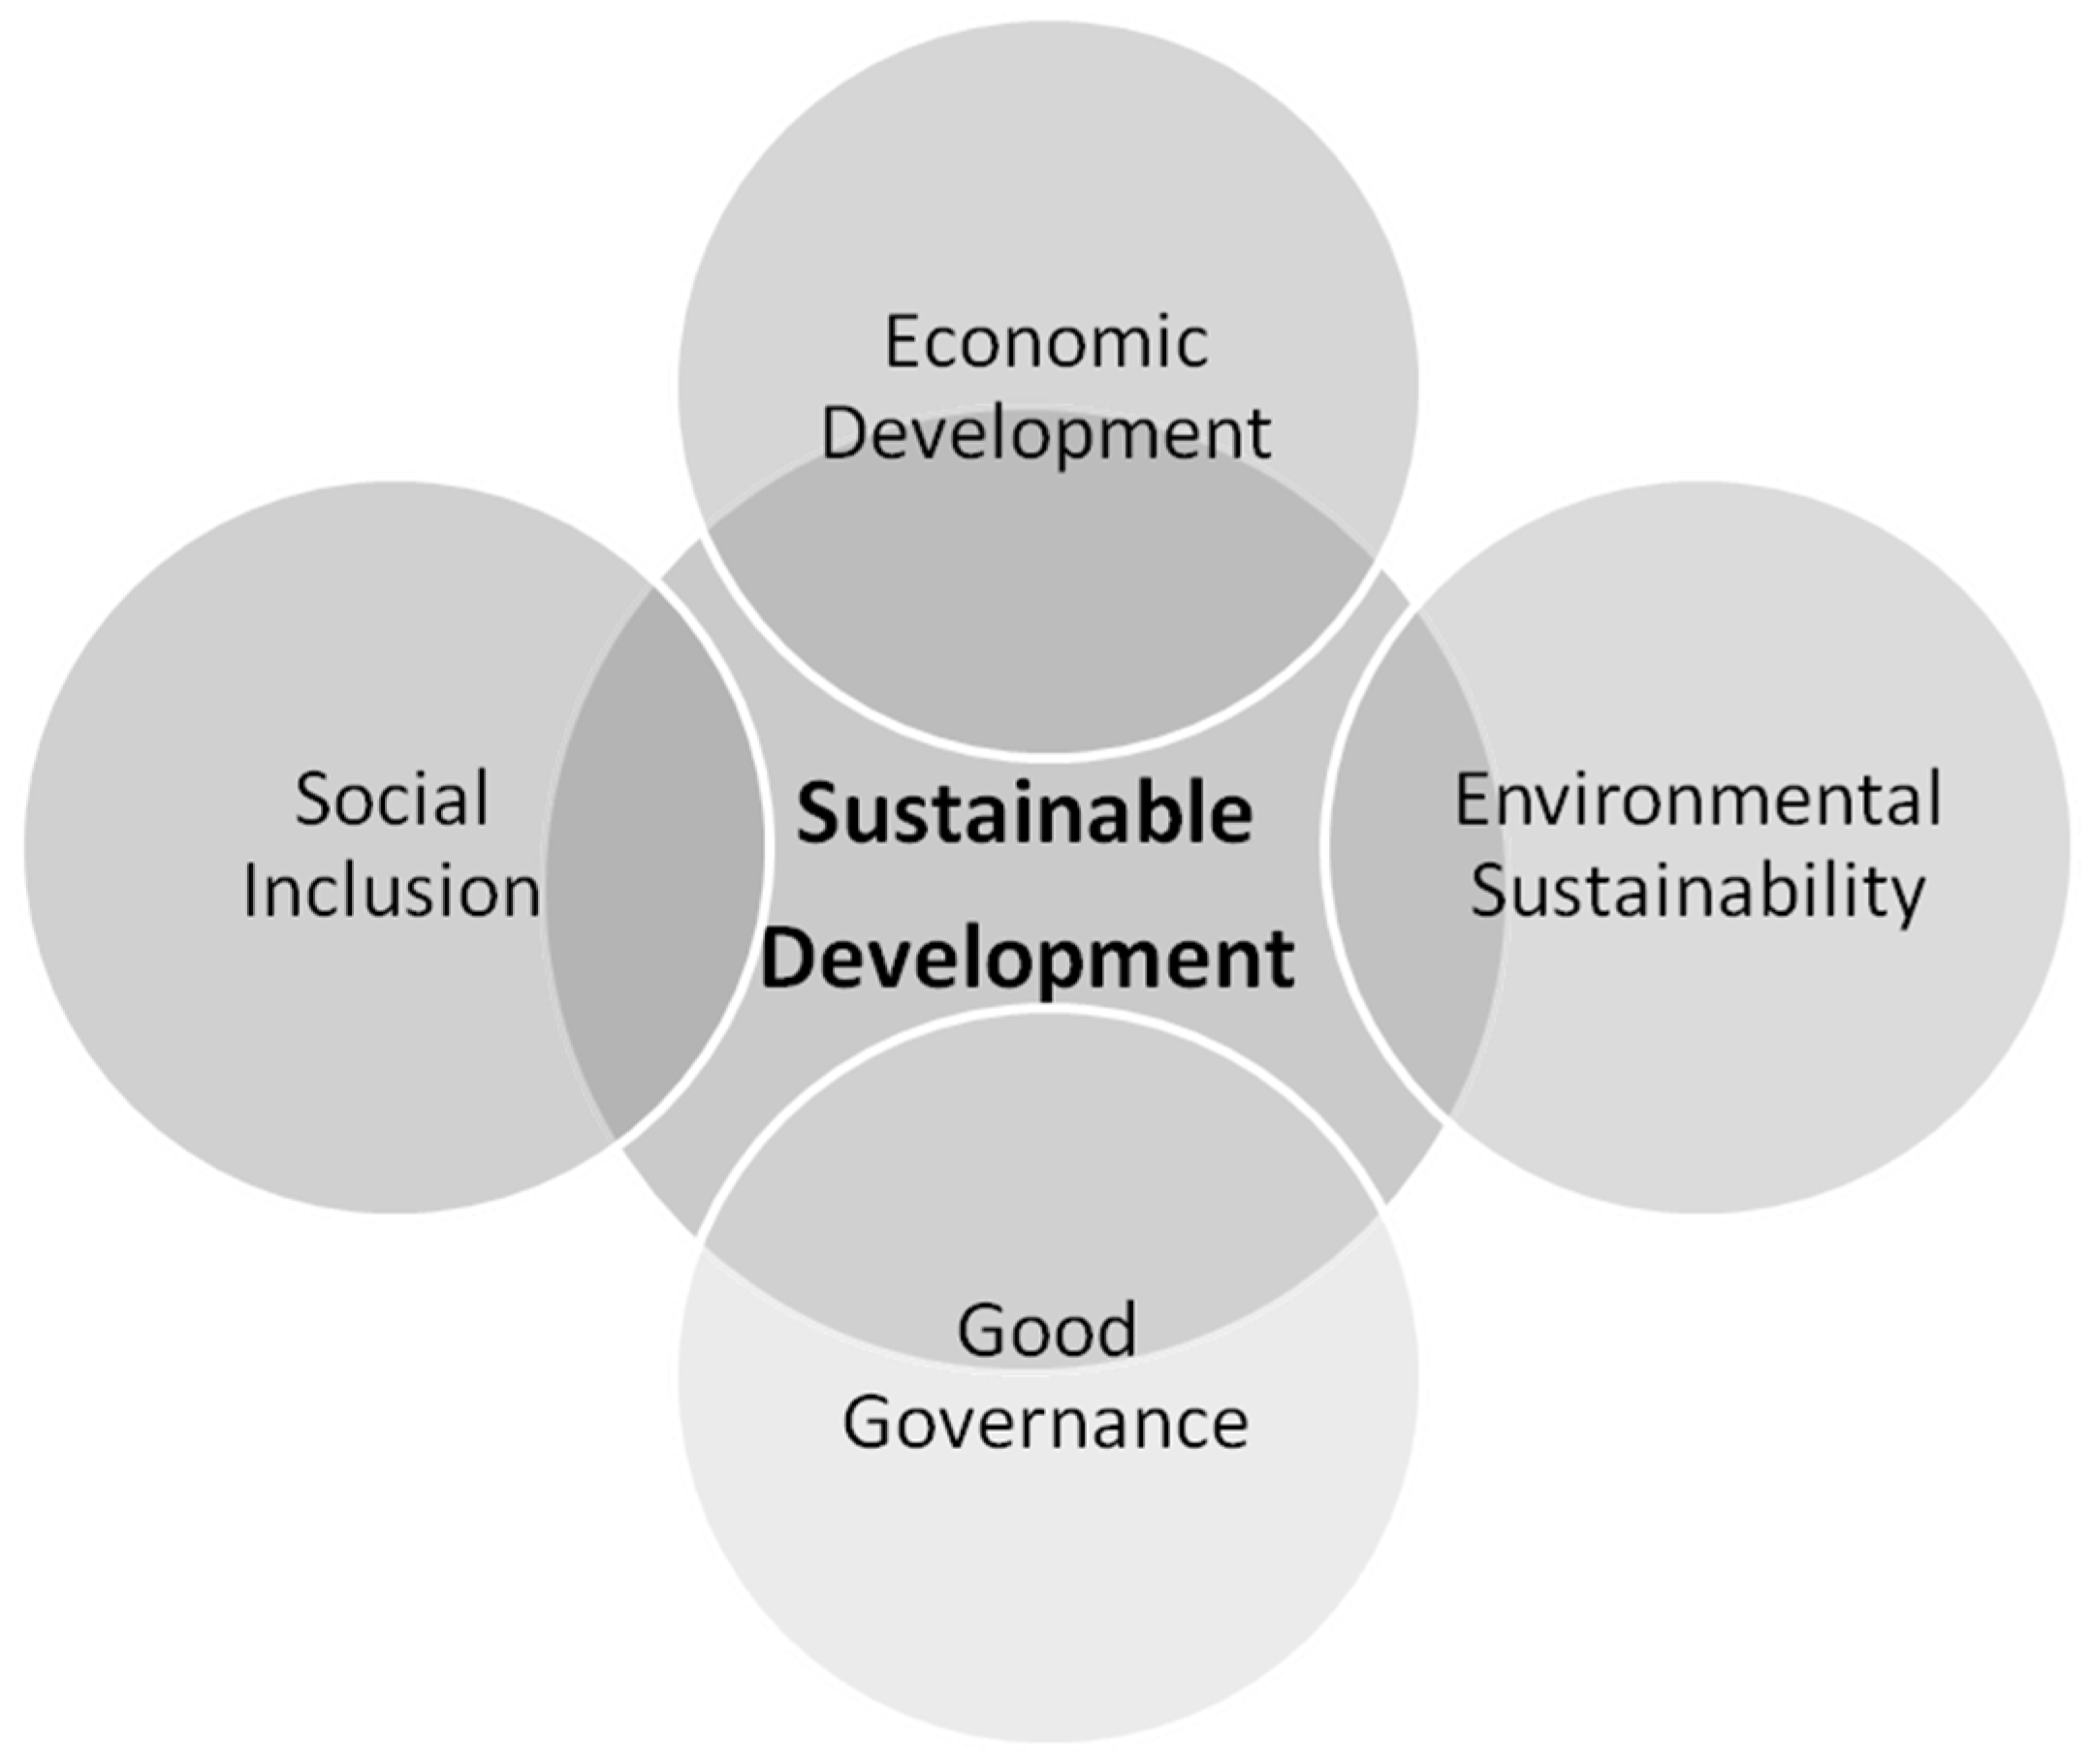
Figure 1. Author-developed diagram illustrating the three interconnected pillars of sustainable development—social, economic, and environmental—based on the conceptual framework presented in the Brundtland Report [15].
Sustainability 17 04251 g001
Figure 2. Author-illustrated depiction of rapid urban population growth as a rationale for focusing on cities. Conceptual basis drawn from data and discussions in [19].
Sustainability 17 04251 g002
Figure 3. Author-developed schematic showing three major economic systems and key transformational drivers, created using ideas discussed in [20]. Arrows indicate an intricate simultaneous interplay of the three major economic systems and key transformational drivers leading to a wider economy and ahigh quality, inclusive and resilient growth which implies a better growth outcome. Note: Cities include urban transport, land use includes forests, and innovation includes economy-wide innovation.
Sustainability 17 04251 g003
Figure 4. Yearly growth of the academic literature on smart cities in the Scopus database, reflecting increasing global research focus on urban sustainability and technological innovation.
Sustainability 17 04251 g004
Figure 5. Geographic distribution of smart city research publications by country, highlighting regional academic leadership and focus areas in urban sustainability (adapted from Scopus and visualized using National Geographic Map Maker).
Sustainability 17 04251 g005
Figure 6. Number of academic articles published in English on the topic of smart cities in the Scopus database by subject area.
Sustainability 17 04251 g006
Figure 7. A summary of smart city concepts.
Sustainability 17 04251 g007
Figure 8. Author-generated illustration of major CSR spending areas by multinational corporations in India, using data extracted from the NASSCOM report [40].
Sustainability 17 04251 g008
Figure 9. Breakdown of the respondents by education.
Sustainability 17 04251 g009
Figure 10. Breakdown of the respondents by department.
Sustainability 17 04251 g010
Figure 11. Optimal weights derived from expert judgment via BWM, highlighting priority smart city intervention areas for MNEs.
Sustainability 17 04251 g011
Table 1. Projected annual flood costs in major global cities by 2050—signaling the urgency for resilient urban infrastructure and smart city interventions.
Sr.
No.
CityCountryContinentEstimated Annual Flood Cost (Billion USD)
1MiamiUSANorth America2.50
2New YorkUSANorth America2.00
3New OrleansUSANorth America1.80
4TampaUSANorth America0.85
5BostonUSANorth America0.79
6GuayaquilEcuadorSouth America3.10
7AbidjanCote d’lvoireAfrica1.00
8MumbaiIndiaAsia6.40
9KolkataIndiaAsia3.30
10ChennaiIndiaAsia0.93
11SuratIndiaAsia0.92
12JakartaIndonesiaAsia1.70
13Ho Chi Minh CityVietnamAsia1.90
14BangkokThailandAsia0.73
15GuangzhouChinaAsia13.20
16ShenzhenChinaAsia3.10
17TianjinChinaAsia2.20
18ZhanjiangChinaAsia0.89
19XiamenChinaAsia0.72
20NagoyaJapanAsia0.64
(Source: [6]).
Table 2. Link between population, economy, and emissions among the various countries across the globe at various stages of development.
Low-Income Countries
USD 1035 or Less GNI/Capita
36 Countries
~0.9 Billion People
Middle-Income Countries
USD 1035–12,616 GNI/
Capita
103 Countries
~4.9 Billion People
High-Income Countries
USD 12,616 or More GNI/Capita
74 Countries
~1.3 Billion People
Top 10 most populous, ordered by GNI Per Capita in 2012 Current
USD
Sustainability 17 04251 i001Sustainability 17 04251 i002Sustainability 17 04251 i003
Share of world GDP in 2012Sustainability 17 04251 i004Sustainability 17 04251 i005Sustainability 17 04251 i006
Share of world GHG emissions in 2010 excluding LUCFSustainability 17 04251 i007Sustainability 17 04251 i008Sustainability 17 04251 i009
Note: GNI per capita is based on the World Bank Atlas Method (current USD). GHG emissions exclude land use, land use change, and forestry (LULUCF). Illustration based on data compiled and interpreted by the authors using information from [9].
Table 3. Pivotal role of cities in sustainability.
Sr.
No.
ImportanceSource
1
  • There is a close link between population economy and emissions among the various countries across the globe at different stages of development.
  • Middle-income and high-income countries have a critical role to play in curbing GHG emissions and achieving environmental sustainability.
  • Approximately 54% of the global human population is living in urban areas.
  • There are three key economic systems, viz., urban systems, land use systems, and energy systems.
  • Contemporary urban systems are expanding rapidly—from fast-growing cities in developing nations to densely populated global megacities—with urban populations expected to increase by over one billion in the next 15 years.
  • Cities currently contribute nearly 80% of the world’s gross domestic product (GDP) and are responsible for approximately 70% of energy consumption and greenhouse gas emissions linked to energy use.
  • A significant portion of this urban expansion lacks proper planning, leading to adverse economic, environmental, and social impacts.
  • As hubs of economic activity, cities are projected to drive much of the global economic expansion in the coming decades, but they also represent a major concentration of greenhouse gas emissions globally.
[20,22]
2
  • The percentage of the global population residing in urban areas is expected to reach 66% by 2050.
  • Sustainable Cities and Communities are one of the key Sustainable Development Goals.
[16,23]
3There is a close resemblance between the population density map and gross domestic product (GDP) density map, indicating that dense human settlements are the predominant centers of economic activity.[18]
4
  • Sustainable Development Goal 11, which focuses on urban development, and Goal 17, which emphasizes partnerships and implementation strategies, intersect with and support the achievement of all other SDGs.
  • While the idea of “smart cities”—which leverage science, technology, innovation, and emerging data for improved urban governance—has gained global momentum, it is not explicitly reflected in the current targets outlined under SDG 11.
[24]
5A smart and sustainable city can be understood as one that leverages information and communication technologies (ICT) and related innovations to enhance the quality of life of its residents, streamline urban operations and service delivery, and foster economic competitiveness. At the same time, it remains committed to addressing the long-term needs of both current and future populations across economic, social, environmental, and cultural dimensions.[25,26,27]
6A city is considered ‘smart’ when it strategically integrates investments in human and social capital along with both conventional infrastructure—such as energy and transportation—and advanced digital technologies. This integration supports sustainable economic progress, enhances residents’ quality of life, and promotes responsible natural resource management, all while fostering active citizen participation and collaborative governance.[28]
7
  • Cities contribute approximately 80% of global GDP, and residents of densely populated urban areas often exhibit lower per capita energy use, require fewer infrastructure resources, consume less overall, and demonstrate higher economic productivity.
  • At their core, cities are concentrations of people and institutions that enable economies of scale in the planning, organization, and provision of essential services.
[29]
8There is a significant role of quality of life and sustainability in the creation and management of smart cities.[30]
9Nearly 50% of the global population is concentrated on only about 1% of the Earth’s land surface.[17]
10Real smart cities will have to take much greater risks with technology, devolve power, tackle inequalities, and redefine what they mean by the term smart itself if they want to retain such a lofty title.[31]
11At the United Nations General Assembly in September 2015, Prime Minister Narendra Modi reiterated India’s commitment to achieving the Sustainable Development Goals (SDGs). He emphasized the vision of transforming Indian cities into engines of inclusive growth—smart, sustainable, and livable—by the year 2030. This declaration echoed earlier national goals aimed at eradicating poverty and ensuring universal access to housing and essential urban services within the first half of the decade.[32,33]
12Under India’s Smart City Mission, 130 million Indians, which is about 35% of the urban population of India, spread across 98 cities, shall be covered.[21]
Table 4. Concepts/definitions of a smart city.
Sr.
No.
Concept/Definition of a Smart CitySource
1The idea of a smart city is dynamic and evolving; it lacks a fixed definition or final destination. Instead, it represents an ongoing journey or set of stages through which cities enhance their livability, resilience, and ability to adapt more effectively to emerging challenges.[34]
2Although one might view a city’s infrastructure and services, reflecting citizens’ aspirations, as a basic requirement for it to be considered “smart”, urban planners strive to enhance the entire urban ecosystem. This holistic approach is framed around four key pillars of development: institutional, physical, social, and economic infrastructure.[35]
3
  • “Smart City” is a multifaceted, fluid term incorporating within its ambit a gamut of wide-ranging domains from urban town planning to traffic management to allocating and coordinating emergency services to stabilizing electricity power grids to higher-education policy to providing a plethora of city information to citizens.
  • The 2010 Shanghai Expo was an early test of many smart city technologies in China, as well as an important promoter of the smart city concept.
[36]
4A smart city integrates technology, government, and society to foster several key features: smart economy, smart mobility, smart environment, smart people, smart living, and smart governance. It is a developed urban area that promotes sustainable economic growth and enhances the quality of life by excelling in sectors such as economy, mobility, environment, people, living conditions, and governance.[37]
5A smart city is an advanced urban area that fosters sustainable economic growth and enhances the quality of life by excelling in several key sectors, including the economy, mobility, environment, community, living conditions, and governance.[38]
6A smart city embeds digital technology throughout its functions to improve efficiency and services. It also ensures sustainability in economic activities and job creation, providing opportunities for a diverse range of residents, irrespective of their education, skills, or income levels.[27]
7A smart city is one which offers sustainability in terms of economic activities and employment opportunities to a wide section of its residents, regardless of their level of education, skills, or income level.[25]
8A city is considered ‘smart’ when investments in human and social capital, along with both traditional infrastructure (like electricity and transport) and modern communication technologies (ICT), drive sustainable economic progress and a high quality of life. This is achieved through the wise management of natural resources and active community involvement.[28]
Table 5. ISO smart city schematic themes.
Sr. No.IndicatorsSr. No.Indicators
1Water and Sanitation10Environment
2Urban Planning11Safety
3Solid Waste12Energy
4Transportation13Recreation
5Wastewater14Governance
6Shelter15Economy
7Health16Telecommunication and Innovation
8Education17Fire and Emergency Response
9Finance
Table 6. Comparison table: BWM vs. other MCDM techniques.
S. No.TechniqueKey FeaturesLimitationsAdvantages of BWM Over This Technique
1.AHP (Analytic Hierarchy Process)Widely used; intuitive; based on pairwise comparisonsHigh number of comparisons; inconsistent judgmentsBWM requires fewer comparisons (2n – 3 vs. n(n – 1)/2), yields higher consistency
2.TOPSIS (Technique for Order of Preference by Similarity to Ideal Solution)Ranks alternatives based on distance from ideal solutionRequires normalization; sensitive to scaleBWM focuses on deriving reliable weights, does not require complex normalization
3.ANP (Analytic Network Process)Considers interdependencies among criteriaComputationally intensive; complex for small samplesBWM is simpler and more practical for problems with fewer experts or limited data
4.VIKOR (VIseKriterijumska Optimizacija I Kompromisno Resenje)Compromise solution approach; useful when decision-maker wants trade-offsSensitive to weight assignment; requires normalizationBWM derives weights based on actual expert preferences, increasing transparency
5.ELECTRESuitable for outranking problems with qualitative dataDifficult to interpret; complex for large datasetsBWM is more intuitive, transparent, and easier to explain to stakeholders
Table 7. Breakdown of the respondents by designation.
Sr. No.DesignationPercentage of the Respondents
1Assistant Executive Engineer33%
2Assistant Engineer11%
3Executive Engineer33%
4Health Officer4%
5Municipal Engineer4%
6Sanitary Inspector7%
7Sanitary Officer4%
8Superintending Engineer4%
Table 8. Ranking of smart city schematic themes based on Z-Scores, reflecting perceived priority areas for urban sustainability.
Sr. No.Smart City ThemeAverage (x)Z-Score = x − μ
σ
Rank
1Solid Waste87.77781.62891
2Water and Sanitation87.44441.57862
3Wastewater83.62961.00333
4Urban Planning83.14810.93074
5Health81.85190.73525
6Shelter80.96300.60126
7Education80.92590.59567
8Transportation80.00000.45598
9Safety78.88890.28849
10Environment75.7407−0.186410
11Finance74.8148−0.326011
12Energy74.0741−0.437712
13Governance70.963−0.906913
14Telecommunication and Innovation70.3704−0.996314
15Recreation69.4444−1.135915
16Economy66.6667−1.554816
17Fire and Emergency Response65.9259−1.666517
Grand Mean (μ)76.9766
Standard Deviation (σ)6.6310
Table 9. Categorization of smart city themes according to triple bottom line dimensions, enabling strategic prioritization of social, environmental, and economic impacts.
People: Social Impact/Development Related CriteriaPlanet: Environment Impact/Development Related Criteria
  • Sub-criteria:
  • Water & Sanitation (Rank 2)
  • Urban Planning (Rank 4)
  • Health (Rank 5)
  • Shelter (Rank 6)
  • Education (Rank 7)
  • Safety (Rank 9)
  • Governance (Rank 13)
  • Telecommunication & Innovation (Rank 14)
  • Recreation (Rank 15)
  • Sub-criteria:
  • Solid Waste (Rank 1)
  • Waste Water (Rank 3)
  • Transportation (Rank 8)
  • Physical Environment (Rank 10)
  • Energy (Rank 12)
Table 10. Pairwise comparison vector for the worst criterion, evaluating relative importance of smart city themes from the perspective of least priority.
CriteriaSolid WasteWater and SanitationWastewaterUrban PlanningHealthShelterEducationTransportationSafety
Best Criterion:
Solid Waste
114456678
Table 11. Pairwise comparison vector for the worst criterion.
CriteriaWorst Criteria: Safety
Solid waste8
Water and sanitation7
Wastewater4
Urban planning4
Health3
Shelter2
Education2
Transportation1
Safety1
Table 12. Optimal weights for priority smart city criteria derived using the best–worst method, informing strategic decision-making for sustainable urban development.
CriteriaOptimal WeightsKsi* (ξ*)
Solid waste0.28730.0507
Water and sanitation0.2873
Wastewater0.0845
Urban planning0.0845
Health0.0676
Shelter0.0563
Education0.0563
Transportation0.0338
Safety0.0422
Table 13. Indicators for some of the priority criteria where MNEs can contribute towards improving them in an urban settlement/smart city.
Sr.
No.
International (ISO 37120:2014)
Themes
Core and Supporting IndicatorsIndia (GoI MoUD Smart City Mission) Core Infrastructure Elements
1.Water and SanitationPercentage of the city population with potable water supply service, percentage of the city population with sustainable access to an improved water source, percentage of the population with access to improved sanitation, percentage of the city’s wastewater receiving secondary treatment, and total domestic water consumption per capita (liters/day).Adequate water supply (smart solution—smart meters and management, leakage identification, preventive main., water quality monitoring
2.WastewaterPercentage of the city population served by wastewater collection, percentage of the city’s wastewater that has received no treatment, percentage of the city’s wastewater receiving primary treatment, percentage of the city’s wastewater receiving secondary treatment, and percentage of the city’s wastewater receiving tertiary treatment.Wastewater to be treated
3.HealthAverage life expectancy, No. of in-patient hospital beds per 100,000 population, No. of physicians per 100,000 population, under-age-five mortality per 1000 live births, No. of nursing and midwifery personnel per 100,000 population, No. of mental health practitioners per 100,000 population, and suicide rate per 100,000 population.[43]
Table 14. Mapping of top smart city themes with SDG 11 targets.
Smart City ThemeRelevant SDG 11 TargetIndicator/Example
Solid Waste11.6: Reduce environmental impact of citiesProportion of urban solid waste regularly collected
Water and Sanitation11.1: Access to basic servicesPercentage of the population with safe drinking water and improved sanitation
Wastewater11.5: Reduce disaster-related lossesImproved drainage and flood-resilient sanitation
Urban Planning11.3: Inclusive and sustainable urbanizationUrban expansion planning policies
Health11.7: Access to safe, inclusive spacesUrban health infrastructure linked to pollution reduction
Disclaimer/Publisher’s Note: The statements, opinions and data contained in all publications are solely those of the individual author(s) and contributor(s) and not of MDPI and/or the editor(s). MDPI and/or the editor(s) disclaim responsibility for any injury to people or property resulting from any ideas, methods, instructions or products referred to in the content.