Article

Research on Assessing Comprehensive Competitiveness of Tourist Destinations Within Cities, Based on Field Theory and Competitiveness Theory

1
School of Geographical Sciences, Nanjing University of Information Science & Technology, Nanjing 210044, China
2
Faculty of Construction and Environment, Hong Kong Polytechnic University, Hong Kong 100872, China
Sustainability 2025, 17(1), 90; https://doi.org/10.3390/su17010090
Submission received: 21 November 2024 / Revised: 16 December 2024 / Accepted: 24 December 2024 / Published: 26 December 2024

Abstract

:
The question of how to assess the comprehensive competitiveness of tourist destinations within cities is an important aspect for determining the potential of a city’s tourism development and its ranking among peers in the field. There are four main parts to the content of this article, which consist of the analysis of competition formation motives based on “Field Theory”, the selection of influencing factors by drawing on Porter’s theory of competitiveness, the construction of an assessment model based on the multi-factors weighted comprehensive evaluation method, and an empirical analysis using Nanjing as the research area. The conclusions are as follows: Firstly, the tourist destination field within a city is composed of three interrelated elements, which are actors, rules, and competition. Under the influence of mainstream social and cultural trends, each tourist destination occupies a certain “position” by relying on the attractiveness formed by various types of capital, and then participates in peer competition within the field. Secondly, the three major influencing aspects of the competitiveness of tourist destinations are element conditions, demand characteristics, and supporting conditions. The key points involved in the three aspects can be summarized into four categories of factors, namely, quality evaluation, popularity level, spatial attractiveness, and emotional cognition, which together constitute the indicator system. Thirdly, there are thirteen tourist destinations in Nanjing that are rated above the average, accounting for about 43% of all the popular destinations. The variation coefficient of competitiveness results is about 35%, indicating a moderate to relatively weak degree of dispersion. Finally, the competitiveness of the thirty hot tourist destinations generally presents a spatial order that gradually weakens in an outward direction from the center zone of the city, forming an overall pattern of cluster groups of well-known tourist destinations in the core of the city, relatively random small clusters in the new main city area, and scattered point distribution in the suburbs.

1. Introduction

Tourist destinations (referring to cities, regions, or micro-specific tourist attractions, and the like) and their images are the basis for the emergence of tourism behavior. Tourism promotion and marketing also heavily rely on the positivity and attractiveness (competitiveness) of the destination’s image. Based on the regional uniqueness of natural and cultural resources, tourist destinations showcase their own image charm and reflect the global landscape through spatial differentiation [1,2]. The spatial value of different tourist destinations attracts a large number of tourists, which in turn leads to the formation of their perceptions and imagery. This is the fundamental role of attraction, and the attractiveness (competitiveness) of tourist destinations plays an important positive role in their all-round operation.
The current dilemma surrounding tourist destinations in big cities can be attributed to the struggle between place and “no place” [1]; that is, a conflict between the original unique sense of place and the blurred sense of modernity, which plays with the traces of historical imprints and the “de-differentiation” landscape of abandoned humanistic spirit. The sense of antiquity that has gone through vicissitudes is not only the lifeblood of a city and its tourist destinations, but also the carrier of precious memories inherited from a long history. It is also a sense of place, humanity, and concreteness that makes a city and a tourist destination worth gazing at [3,4,5,6]. In the era of intelligence, information technology and digital media have quietly embedded themselves in various aspects of tourism, such as promotion, marketing, landscape construction, and event creation. The relative coldness and standardization of modern landscapes, as well as the gradual blurring of traditional boundaries and related differences between functional departments under postmodernism [1], have also had varying degrees of impact on the construction of many urban tourism landscapes. However, these still cannot shake the cultural power, authenticity, and sense of place that historical heritage brings to many tourist cities and destinations. It can be said that there is great beauty in heaven and earth, and each is beautiful in its own way. In the spirit of cultural diversity, it is natural and necessary to evaluate the unique beauty of a region or tourist destination, that is, its overall charm or attractiveness, or competitiveness.
Of course, there may be specific differences between competitiveness and attractiveness in terms of connotation and extension, but under relatively more general and less rigorous conditions, we can consider the attractiveness of a target area as an important support and manifestation of its competitiveness. In addition, the content elements of competitiveness largely depend on attractiveness, even forming close intersections and overlaps with it [1,6,7,8]. Under this cognition, the factors and indicators that affect competitiveness may be introduced into an assessment of tourist attractiveness that covers both spatial and social values.
When measuring the competitiveness of tourist destinations, it is not only necessary to pay attention to relatively objective natural and cultural resource conditions, and a series of supporting conditions (such as transportation, leisure, accommodation, information facilities, etc.), but it is also necessary to consider incorporating a large number of tourists as the main body of demand for comprehensive perception and evaluation [8,9,10]. Although the cultural and subjective nature of landscapes was emphasized by Saul in his book The Earth and Life [2], analyzing comments with different esthetic orientations within a big data framework can uncover the attention hotspots, emotional tendencies, and overall recommendation intentions for almost the entire tourist group for each research object, as well as the charm levels of tourist destinations. This provides a feasible path for highlighting the diverse intentions of demanders and summarizing them in a directional manner.
In the 1960s, Kevin Lynch’s urban imagery analysis method, model, and imagery element theory established a new field of modern regional spatial analysis, and its popularity quickly swept through the Western geography and planning academic circles [3,4]. From then on until the end of the last century, a plethora of diverse research on regional imagery spatial analysis continued to emerge. However, in the mid to late 1990s, interest among foreign scholars in research on regional imagery and spatial cognition declined [4,5]. Up until around 2013, there was a significant decrease in the literature on traditional regional image analysis in foreign countries, and instead, a new type of image perception deep mining and comprehensive analysis was promoted using geographic big data [5]. Based on Internet media data, such as comment texts, videos, and photos from tourism portals and social media websites, and using machine learning technology, scholars can conduct both qualitative and quantitative analyses for a city as a whole or from a certain perspective (relevant perspectives often involve food, events, festivals, specific tourism categories, etc.) to gain insights into urban charm and influence, and this has become a new hotspot in the field of human geography and urban planning.
The analysis of regional imagery has gradually emerged in China since the late 1980s and early 1990s [3,4]. Scholars have utilized classic theories and methods of imagery analysis to conduct more in-depth localized research. Around 2013–2014, some Chinese scholars almost simultaneously started using geographic big data and machine learning technology to promote the related study of the perception and evaluation of the charm of cities or tourist destinations [5]. However, it is rare to find articles incorporating emotional cognition, quality factors, and popularity based on Internet data into a comprehensive indicator system to assess the attractiveness or competitiveness of tourist destinations, especially those within a city. It is worth noting that abundant Internet data could cover a wide range of information, such as emotional orientation, resource landscape descriptions, activity and facility conditions, overall environmental assessments, operation suggestions, and proximity [5]. Sentiment analysis and opinion mining can play a significant role in obtaining tourists’ emotional tendencies by using natural language processing technology, based on extensive Internet text review data. However, up until now, both domestically and internationally, evaluative research on the competitiveness or attractiveness of tourist destinations in many tourist cities, which are intertwined with a sense of locality and modernity, has appeared to be relatively lagging behind. This is also an aspect that our article aims to tackle.
In the past, many scholars have often approached the evaluation of image charm and the influence of tourist destinations from the perspective of image perception, which leans more towards qualitative analysis [3,4,5,6]. The assessment of the competitiveness of tourist destinations is often based on quantitative results to reveal the charm and prosperity level of the tourist destination’s image, which is an effective supplement to the relative subjective perception status in image perception analysis [7,8]. The purpose of competitiveness assessment is that it tends to more accurately and objectively quantify the “position” of the target object in the competition field, and based on this, the spatial order formed by all the competitors in the field can be considered.
When measuring competitiveness, geographic big data can play an effective role, starting from the theory of “tourist gaze” [1,6]. The theory of “tourist gaze” emphasizes that when tourists escape from their daily life and go to a tourist destination with distinct differences, consuming scenery and experiencing culture and natural capital are important activities [6]. This requires comprehensive sensory perception to capture and retain the uniqueness and wonder of the tourist destination’s landscapes and activities. The theory of “tourist gaze” holds that tourists are at the center of the entire process of constructing a tourist destination. At the same time, different groups will have different perspectives, which also explains why the same tourist destination may have different interpretations. These are two aspects highlighted by the gaze theory [1]. Therefore, it is necessary to explore the emotional tendencies of as many gazers as possible, as well as the evaluation of imagery, popularity, and other data for tourist destinations, in order to fully consider the characteristics of the demanders’ side and their relatively objective feedback on a large scale for tourist destinations. This can effectively enhance the objectivity of composite perception evaluation under group gaze.
The assessment of tourist destination competitiveness also needs to pay attention to the influence of cultural characteristics on tourists’ cognition and judgment [1,5,6,9,10]. Culture is the core factor that influences tourists’ perception of tourist destinations, making it easier for us to understand individual differences in their perception of the spatial and societal value (competitiveness) of tourist destinations. At the same time, there is also a noteworthy phenomenon of relative similarity; that is, different tourists often exhibit some common traditions and norms when gazing at the same landscape or tourist destination [1,6]. This is closely related to the tourism “behavior” habits of tourist groups with different cultural tendencies. This is truly reflected in the profound differences in group behavior tendencies, thinking patterns, and esthetic taste orientations in different social divisions. This makes them subconsciously construct a wonderful hierarchical esthetic and emotional habits when perceiving landscapes [11,12]. This is also an important reason why a large number of tourists visiting the same tourist destination can show a relatively convergent perception. Therefore, analyzing group sentiments and extracting group opinions from a large number of complex Internet review text data has become a recognized technical method.
The issues of “habituation” and competition among actors involved in the above analysis are important concepts in Bourdieu’s Field Theory [11,12]. Field Theory was proposed by Pierre Bourdieu, who is a renowned contemporary French sociologist and philosopher, for the analysis of the power relationships and positions of different subjects in social space [11,12,13]. In recent years, this theory has provided a new perspective for understanding and explaining tourism phenomena. Field Theory, as an analytical tool, is widely used in tourism geography to explore power relations, social capital, and cultural production in depth. Under the lens of “power relations”, Field Theory is commonly utilized to analyze how local residents, governments, and commercial interest groups interact and compete for resources and discourse power in the process of tourism development [7,8]. From the framework of Bourdieu’s “capital” theory, some researchers have analyzed the social relationship networks between different groups to explore how these networks affect the development of tourist destinations and community participation [9]. From the perspective of “cultural production”, Field Theory is also utilized to examine the process of cultural production and transformation, among which the question of how to transform a specific culture of a region into economic benefits through tourism is a popular topic [10]. From the perspective of “locality and identity”, scholars mainly focus on its role in the construction of tourist destinations and examine how residents maintain and reshape their local identity through daily practices. At present, some research from China mainly focuses on exploring themes such as actor practice [11], cultural space production [12,13,14,15], industrial space evolution [16], and social space reconstruction [17,18,19] in the tourism field based on Field Theory. From the above, it can be seen that there are currently few publications on the use of Field Theory to analyze the attractiveness (competitiveness) of tourist destinations.
In view of the above explanation, the application of Field Theory to analyze the attractiveness (competitiveness) of tourist destinations will be promoted in this article. The research approach of this article is as follows:
Firstly, a group of tourist destinations in a city are placed within a “field”, and the three major components of the field (actors, rules, competition) and competition tools (capital) in Field Theory are used as a theoretical basis to explore the driving force behind competition among tourist destinations in depth. Furthermore, the key points of the four elements of the Diamond Model in Porter’s theory of competitiveness are referenced in our paper. Based on this, the factors influencing the competitiveness of tourist destinations within cities are selected, and the indicator factors utilized to assess competitiveness are determined. At the same time, the category of “capital” in the Bourdieu field is introduced to correspond with the aspects that affect the competitiveness of tourist destinations, indicating what types of capital produce a marked effect that tourist destinations rely on when competing. Finally, multi-factor weighted synthesis method is utilized to specifically assess the competitiveness of hot tourist destinations within the field (Nanjing city was selected as the empirical area in this article). The specific research approach is shown in Figure 1. Additionally, the weights of factors are calculated using the entropy method. The three influential factors that play an important role in the competitiveness of enterprises (industries, departments, units, etc.), namely factor conditions, demand conditions, and related and supportive industries, are transferred to the evaluation of tourist destination competitiveness and differentiated into (supply side) factor conditions, demand characteristics (performance), and support conditions, respectively. For specific factor indicators, please refer to Section 2, Section 3 and Section 4. This article provides a comprehensive and innovative exploration of the concept, theoretical basis, influencing factors, and assessment method of tourist destination competitiveness, offering a novel perspective for competitiveness research across various domains. Furthermore, measuring tourist destinations’ competitiveness can assist relevant management authorities in enhancing the factors that influence their competitive stance.
We employ a certain degree of innovation in our conception of tourist destination competitiveness, in the consideration of the driving force behind competition formation, the diversity of indicator factors and their calculation efficiency, and the size of the data samples in this article. Firstly, Porter’s competition theory [20] and economic utility theory have been borrowed; meanwhile, spatial agglomeration, accessibility, and other location advantages, as well as emotional evaluation of the demand side, have also been combined to propose a new conceptual framework for tourist destination competitiveness in our paper, which breaks through previous definitions and content categories of tourist destination competitiveness coming from an economic or management perspective. Secondly, Field Theory is integrated into the urban tourist destination system, and the driving force behind the formation of competitiveness among tourist destinations within a city is analyzed based on the three elements of field composition and the theory of capital category. Thirdly, compared with traditional methods that have significant limitations such as complex indicator systems, cumbersome questionnaire survey processes, small data sample sizes, and subjective questionnaire results, four criteria elements have been integrated into the indicator system in this article: quality factor, popularity factor, spatial attractiveness, and demand side emotional factor. In addition, various aspects can be considered in the indicator system, such as disciplinary fields, philosophical perspectives, dimensions, content attributes, characteristics of both the supply and demand sides, and evaluation sources. The indicator system is simultaneously concise and efficient; some factors are evaluated based on Internet review data, which makes great progress in terms of data acquisition efficiency, sample size, the objectivity of tourists’ cognition, and the diversity of evaluation perspectives.

2. Overview of Relevant Research and Selection of Main Indicators in This Article

Attraction (competitiveness) evaluation is an important quantitative research tool for evaluating the image of tourist destinations. The evaluation of the “attractiveness or competitiveness” of tourist destinations has emerged both domestically and internationally since the 1990s, becoming a highly discussed topic in the field of tourism geography [21,22]. Among nearly a hundred related articles, around 30 are highly relevant to this article. After reading, it was discovered that research on spatial competitiveness originated from large-scale regions [22], such as the evaluation method for national (industrial) competitiveness proposed by Porter, M. [20]. Poon (1993) was the first scholar in the field of tourism to conduct research on tourism competitiveness [23]. Subsequently, scholars both domestically and internationally constructed indicator systems and evaluation models to characterize the competitiveness of tourist destinations. Based on questionnaire surveys and other relevant statistical data, various econometric methods were utilized to assess competitiveness [22,24,25]. Foreign scholars have also mainly explored the conceptual frameworks, influencing factors, evaluation methods, and indicator systems of tourist destination competitiveness [22,26]. The spatial scale often involves either a city or regional scale [27,28,29,30], with some studies focusing on the national scale [24,31], and there is relatively little exploration of tourist destinations within cities. Types of tourism landscapes include heritage tourism [22,25], natural landscape tourism [28], green tourism [32], and comprehensive tourism [33]. Recently, some scholars’ research interests have shifted from market share to a sustainability orientation [26]. For example, Wu D et al. (2023) used data envelopment analysis to analyze sustainability and competitiveness by measuring their efficiency [32]. Some scholars have also explored the assessment of the competitiveness of tourist destinations by integrating it with other factors. For example, Selim et al. (2021) constructed a comprehensive index to assess the intelligence and competitiveness of heritage tourist destinations [25], and Wang X et al. (2016) used fuzzy comprehensive multi-level analysis and importance performance analysis to assess tourist preferences for smart tourist attractions [34].
In terms of the influencing factors and indicator system construction of tourist destinations, different researchers have paid attention to different regional scales and exploration directions. At present, selecting factors or related indicators that affect the competitiveness of tourist destinations often involve the following categories:
  • A tourism competitiveness indicator system for cities and higher-level regions, starting from driving factors [24,35].
  • Selected tourist destination competitiveness indicators or variables from the perspectives of cost and benefit [21].
  • Tourist destination competitiveness indicators determined from the perspective of specific destination attributes [36].
  • Comprehensive indicators constructed from the dual dimensions of tourist destinations’ supply and demand [37].
  • A tourist destination sustainability and competitiveness indicator system constructed from the perspective of efficiency evaluation [32].
There have been a number of related studies in the field of urban- and regional-scale tourist destination competitiveness evaluation in the Chinese geographical community [38], but research on the specific attractiveness or competitiveness considerations of tourist destinations within cities is currently lagging behind. Moreover, scholars have published relatively little research on estimating or measuring the competitiveness of micro-scale tourist destinations, while their interest in studying the attractiveness of tourist destinations is relatively stronger [36,37,38]. Considering the intersection between competitiveness and attractiveness, we will now conduct a combined review of research related to attractiveness and competitiveness. Through the analysis of the distribution of primary and secondary themes, it was found that the Chinese academic community mainly selects various types of tourist destinations such as cities [39], rural areas [40], red tourism [41], ancient culture [42], and religion [43], and utilizes traditional econometric methods (such as a factor analysis or analytic hierarchy process [25], fuzzy comprehensive evaluation [41,42,43], an entropy method [40], a mean model, a structural competitiveness model [44], and an importance and perceived performance analysis method [39,45]) to evaluate and assess their attractiveness or competitiveness. Scholars have mainly explored influencing factors [46], tourist perception characteristics [47], and brand enhancement or extension strategies, among other aspects. There are also some studies that comprehensively explore various aspects related to attractiveness [48,49]. Many publications have greatly promoted empirical research on traditional technologies and ideas.
From the above, it can be seen that there are more discussions on the competitiveness or attractiveness of cities and large-scale regions as tourist destinations both domestically and internationally. A relatively mature thinking system has been formed in terms of regional scale, tourism types, indicator system construction, and the determination of technical methods [22,24]. However, at the micro-scale, the definition, theoretical explanation, and model construction for tourist destination competitiveness or attractiveness are relatively lagging behind [22,24]. Additionally, the determination of influencing factors and selection of indicators are also lagging behind. Although some studies have explored issues related to the attractiveness or competitiveness of tourist destinations within cities, traditional econometric methods and questionnaire surveys are often used in them. There are many limitations in terms of the integration and simplification of indicator systems, data size, sample size, research efficiency, and other aspects. Moreover, there has been no systematic research on the micro-level assessment of tourist destination attractiveness or competitiveness from theoretical, methodological, and indicator factor perspectives.
At present, a very small number of domestic studies in China have begun to utilize network platform-related data or artificial intelligence technology to assess the attractiveness or competitiveness of urban or rural tourist destinations. For example, Zhu Zhongyuan et al. utilized network geographic data and traditional research methods to evaluate and analyze the spatial trend of the attractiveness of rural tourist destinations in Jiangxi Province [40]. Bai Hongrui et al. conducted image perception analysis and comprehensive attractiveness evaluation of famous tourist attractions in Nanjing, based on network text data and machine learning-related technology models [50]. The former constructs an evaluation index system for the attractiveness of tourist destinations from five dimensions: recreational value, popularity, satisfaction, positive rating index, and sharing index. However, it lacks official tourist destination rating scales, spatial attractiveness factors, and the analysis of tourists’ emotional tendencies. The latter starts with the three major factors of scale, accessibility, and sentiment analysis to construct an attractiveness assessment model, which is relatively concise and takes into account the official ratings and spatial proximity based on the transportation network. However, it lacks consideration for aspects such as online tourism platform rating, popularity, and spatial agglomeration and clustering effects. It is necessary to expand and improve the indicator system involved.
Based on the advantages and limitations of the above two kinds of indicator systems, combined with Porter’s competitiveness theory framework, there is a list of factors or indicators to be taken into consideration to build a competitiveness evaluation model in our paper, which comprises the quality factor, popularity factor, spatial attractiveness factor, and sentiment (emotional) factor. The “quality factor” reflects recreational value, involving official ratings and tourism portal ratings, and is a collective evaluation of resource endowment. The “popularity factor” involves the number of comments and shared images of scenic spots on selected tourism portal websites. The “spatial attractiveness factor” reflects spatial location advantages, revealing transportation network support, and involving spatial accessibility and spatial agglomeration effects. The spatial agglomeration effect indicator involves the spillover effect of large scenic spots on surrounding small ones, which often occurs around large tourist destinations that rely on mountain and water resources and integrate historical and cultural elements, forming tourist destination clusters or group structures similar to a “centralized economy”. The sentiment (emotional) factor takes into account the positive reviews of tourism portal websites and the emotional tendency of tourist groups, reflecting demand side recognition and revealing demand side perception characteristics. The corresponding theoretical basis for constructing the indicator system can be found in Section 3.3.
There are various aspects covered in the model described in this paper, including the potential of tourist destination quality, proximity, and agglomeration degree based on spatial patterns, the emotional attitudes of tourist groups contributing towards a comprehensive evaluation for tourist destinations, and popularity based on sharing situations. In addition, there are multiple perspectives to be taken into account, such as scale and quality, space and emotion (spatial and non-spatial), characteristics of both the supply and demand sides, local and out-of-town tourist concerns (differing in spatial attractiveness), official and online media evaluations, and objective and subjective evaluations. The model described in this paper aims to combine qualitative and quantitative analysis to evaluate the competitiveness of tourist destinations in a relatively concise, yet efficient and objective, manner. It should be noted that due to the specific and non-universal characteristics of historical, cultural, ecological, and other resources, they are temporarily not included in the indicator system. In terms of scenic area operation strategies and organizational approaches, we have not been able to effectively obtain the relevant data; therefore, the related factors and indicators have not yet been included in the indicator system in this paper.

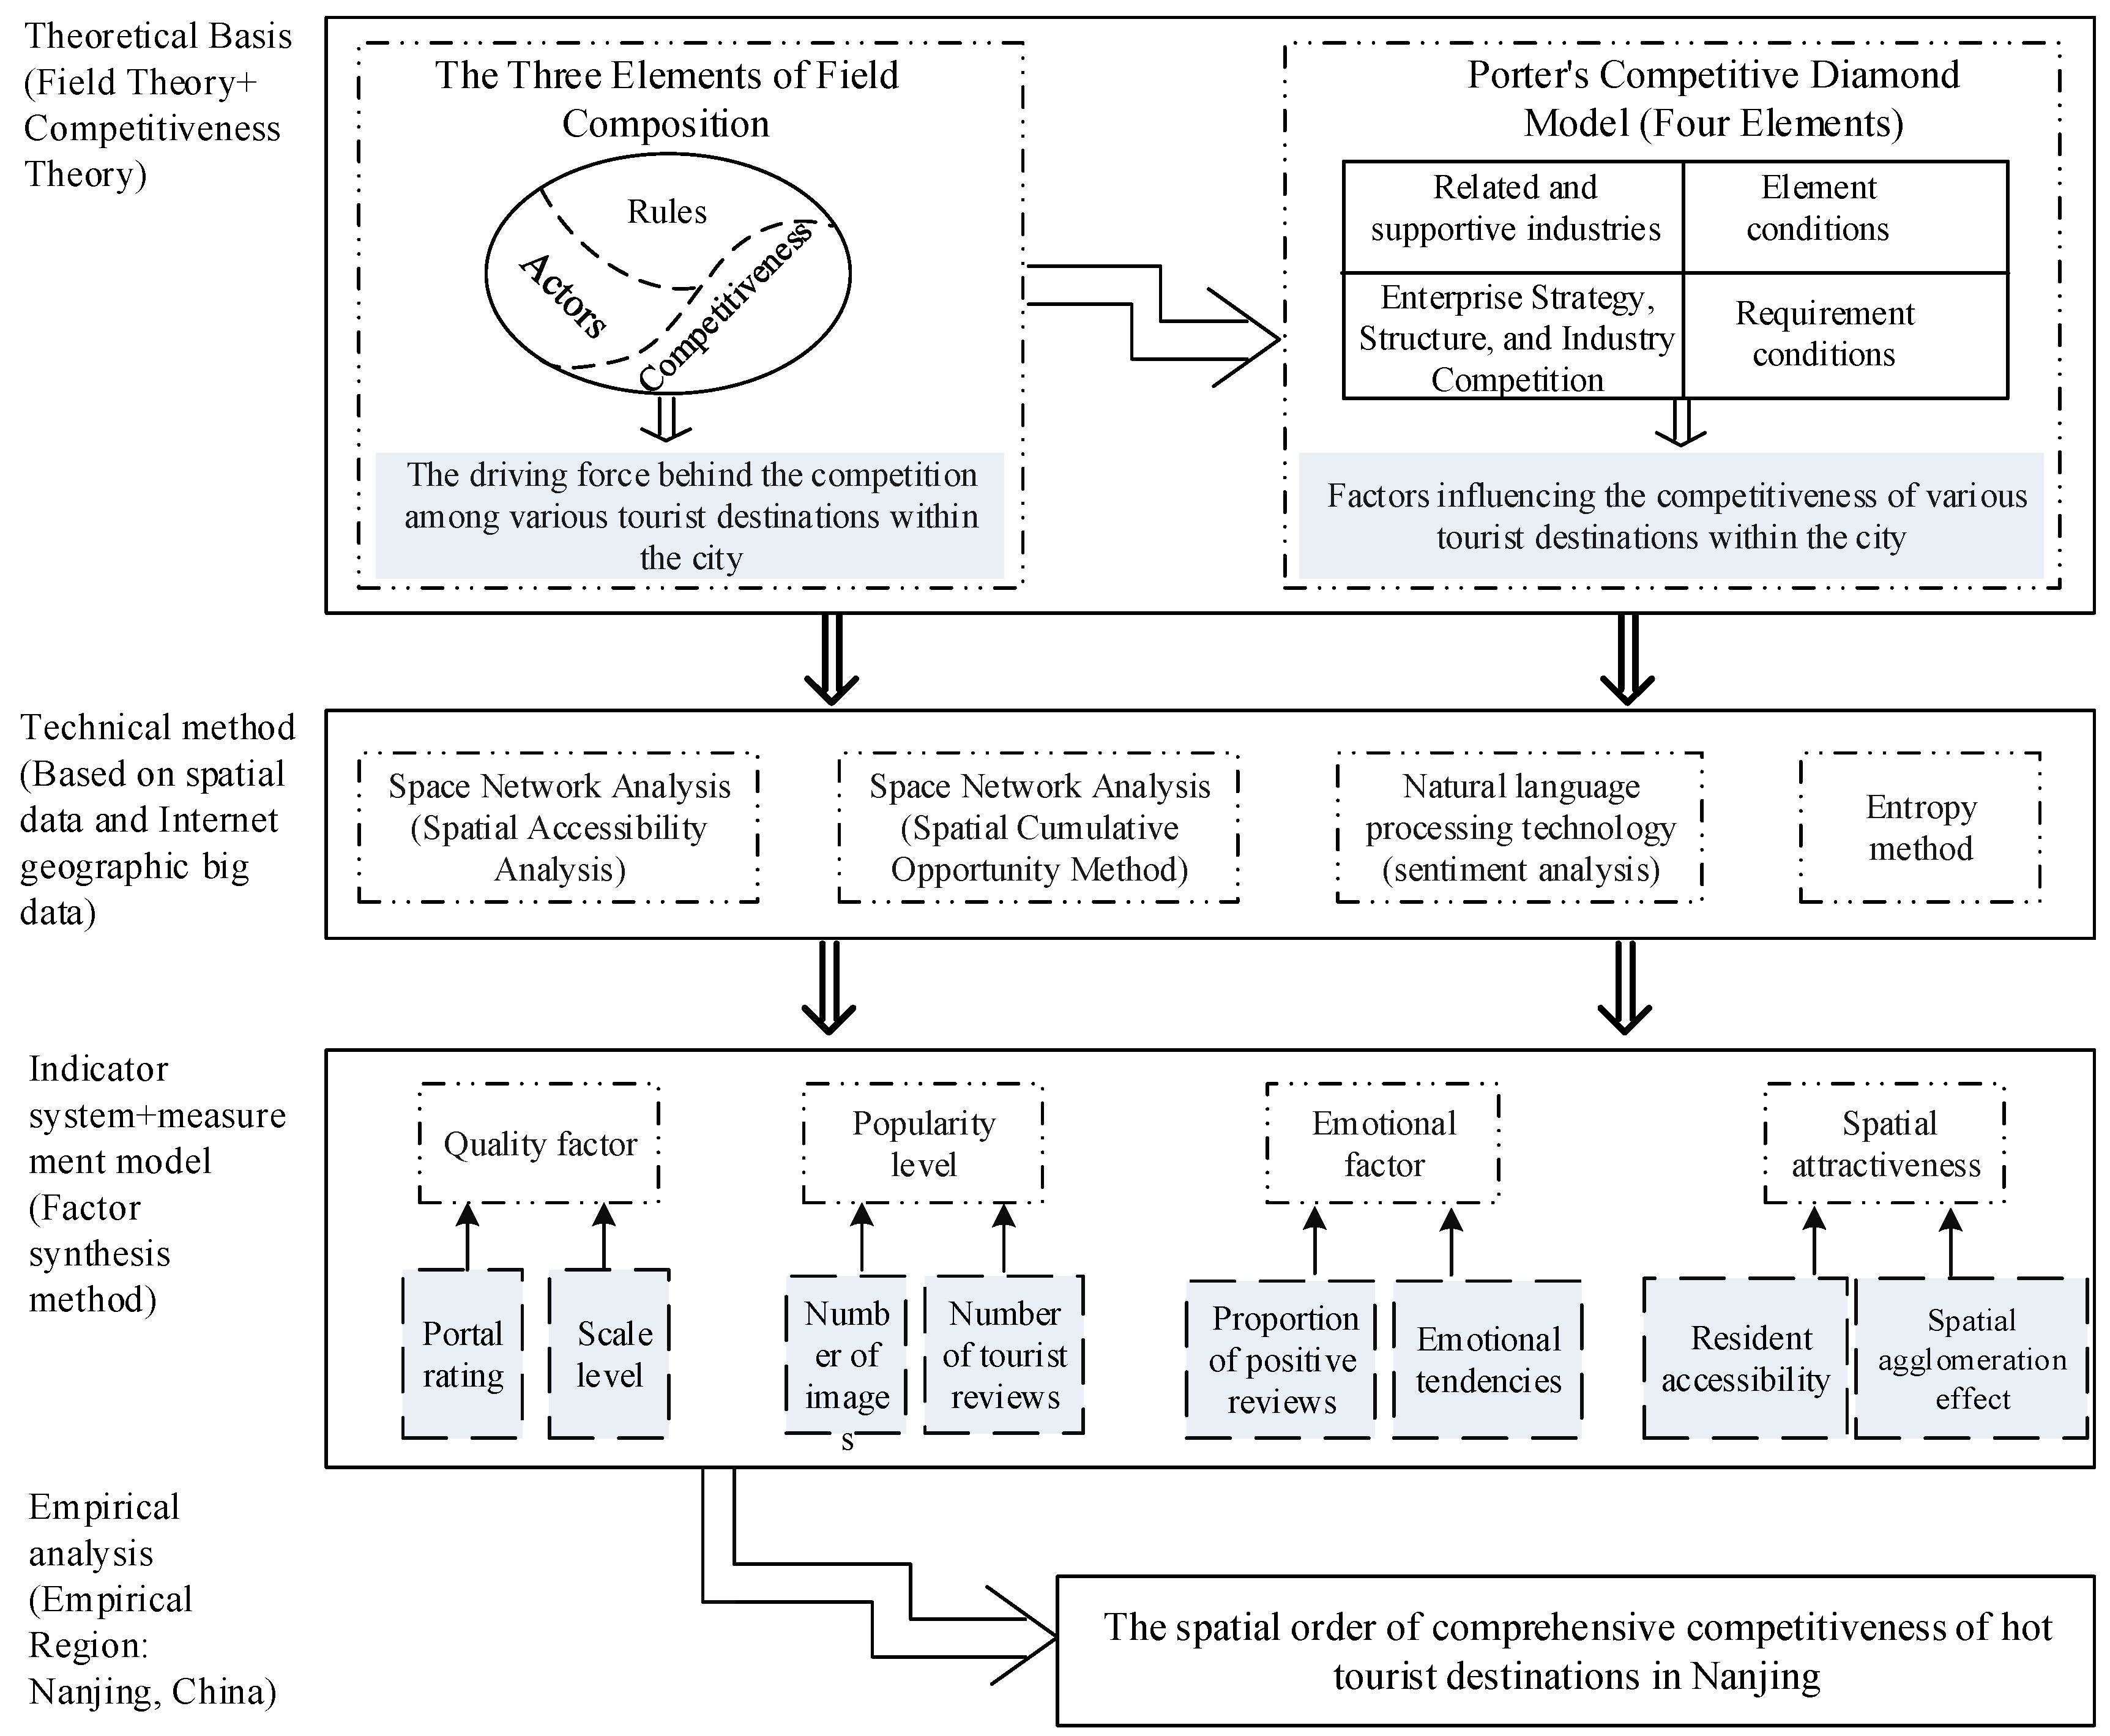
3. Theoretical Basis

3.1. Concept

Many scholars have provided conceptual explanations for the competitiveness of tourist destinations [22], mostly framing them from an economic or management perspective, with little mention of the location advantage brought about by spatial agglomeration, spatial proximity, and demand side emotional recognition. Taking Porter’s framework of competitive advantage [20] and the utility theory in microeconomics as references, combined with the attention paid to spatial location advantage in geography, our article attempts to provide a brief analysis of the concept of tourist destination competitiveness within a city. The competitiveness of a tourist destination within a city refers to the comprehensive effectiveness of a specific tourist destination, based on its own background and attached cultural connotations and functions (element conditions), over a period of time under government management, through various factors such as internal and external factors, spatial and non-spatial factors, and entity and image factors, under a certain management and organizational mode of the operator, based on supporting conditions such as transportation (spatial attractiveness) and other relevant facilities, in attracting a group of tourists to visit or revisit. Among the relevant factors, internal and external factors mainly involve internal cultural connotations and external landscape forms, which can be regarded as elemental conditions. As for spatial and non-spatial factors, spatial elements mainly refer to spatial proximity and spatial agglomeration. Non-spatial elements mainly involve various aspects such as element conditions, demand characteristics, and organizational operation approaches. As for the factors of entity and imagery, material entity factors mainly cover various aspects of the tourist destination such as the background environment, resources, landscape, architecture, facilities, and so on. Imagery factors involve cognitive evaluation and demands from the demand side, while also revealing the demand situation. It can also be considered that this effectiveness is a specific competitive advantage possessed by a tourist destination after competing with a group of competitors within the field in a city, which can enhance or maintain its market position or share [21]. In short, the benchmark competitiveness of tourist destinations is enhanced through competition for “resources” (in a relatively broad sense).

3.2. Analysis of Formation Motives of Competition from the Perspective of Field Theory

Field Theory, proposed by French sociologist Pierre Bourdieu, explains the distribution of various types of capital (economic capital, cultural capital, social capital, and symbolic capital) in social space and the interactive relationships among actors [14,15]. Bourdieu defines a field as an objective network of relationships among various “statuses” (the positions of the subjects) or a configuration structure of social relationships [18,19]. It is a relatively independent social space that contains actors with different capital structures or powers who struggle and negotiate within the field to gain greater capital and status. Bourdieu regards the field as the fundamental analytical unit of social research. Bourdieu’s Field Theory emphasizes the structural and dynamic nature of social space, as well as the behavioral strategies of individuals within it [12,13].
The constituent elements of the field mainly include agents, rules, and competition [16,17]. Agents refer to a group of diverse actors, mainly involving government management departments, tourist destination supply and operation parties (competitors), other industry departments or auxiliary industry staff in the industrial chain, etc. [11,14]. Competition is the dominant operating logic in the game. Meanwhile, there are also some cooperative relationships within the field. This issue can be explained in two aspects. Firstly, the mutual reflection and integration under the agglomeration effect make adjacent series of tourist destinations become a “tourist destination cluster” or group, which reflects a cooperation between subjects based on spatial location. Secondly, other departments or auxiliary industry workers in the industrial chain become auxiliary and cooperative operators. Therefore, the game here involves two situations or behaviors: competition and cooperation. In terms of rules, from a domestic perspective, this mainly covers various policy regulations of the government on tourist destination development, landscape construction, environmental protection, operation, and management, as well as operational supervision requirements and regulations for related industries, and legal or non-legal constraints and norms on tourists’ series of behaviors from local administrative authorities and tourist destination management parties. These constituent elements—agents, rules, and competition—together constitute the internal structure or framework of the tourist field within a certain city.
Among the three elements of the field, the tourist destination is subject to a series of policies and rules, including planning and development, operational management, and industrial construction and development, which serve as administrative constraints and action guidelines. Multiple participants have interactive relationships, while a group of tourist destination operators and managers who participate in the competition for the image and charm of one tourist destination are the main actors. During the competition, the overall attractiveness of the tourist destination is often used as a showcase. Under the influence of mainstream social and cultural trends, subject actors participate in tourism market competition through their capital situation and “ecological position” in the field, which is the main manifestation of actors in the social interaction network. The corresponding rules constrain and guide the process, aspects, and focus of competition among actors, and the process and intensity of competition have a reciprocal effect on the existence of rules. Actors are the subject of competition, and competition is an important form and carrier of interaction among actors. Actors, competition, and rules are interrelated, and together form the tourist destination field within a city.
In this relatively independent and complex social relational network, tourist destinations utilize their various types of capital (corresponding to natural environment, landscape, culture, operation, and other aspects, as shown in Table 1) as “weapons” to form a certain level of attractiveness, thereby occupying a specific “position”. They continuously adopt various strategies and means to engage in competition with peers within the field (Figure 2), in order to acquire more resources and power. During this process, interactions and conversions take place among various types of capital. Competition among tourist destinations based on their attractiveness thus emerges. However, the magnitude of their competitiveness or attractiveness, how to measure it, and what their spatial order is, have become issues that require further exploration.

3.3. Analyzing and Selecting Factors Influencing Tourist Destination Competitiveness by Borrowing Porter’s Competitiveness Theory

The determination of factors and indicator systems affecting the competitiveness of tourist destinations can be inspired by Porter’s competitiveness theory. Since the emergence of Porter’s National Competitiveness Diamond Model, the related concepts of competitiveness assessment have been introduced into multiple fields, and tourism is one of them.
Porter’s Diamond Model was proposed by Michael E. Porter in his book National Competitive Advantage [20,22]. This model is used to explain why certain countries or regions can form a global competitive advantage in specific industries. The Diamond model includes four main factors, namely factor conditions, demand conditions, related and Supporting industries, and firm strategy, structure, and rivalry. The combination of various factors (as shown in Table 2) and two supplementary factors (government and chance) determines the industrial competitiveness of a country or region. The Porter Diamond Model has been widely applied in the formulation of national and regional economic development strategies, the internationalization strategies of enterprises, industrial cluster research and development, education, academic research, and other fields.
Among the four major elements of factor conditions, demand characteristics, related and supporting industries, and enterprise development strategy (operational strategy) and organizational structure, the first three cover relatively clear key points. It is necessary to conduct some further discussion to understand the fourth type of element. For enterprises, development strategies or operational arrangements often involve aspects such as enterprise size, brand level, industrial technology, market scope, product market positioning, capital investment focus, product category, market development approaches, resource presentation methods, marketing methods, sales strategies, management methods, and so on. The organizational structure of enterprises mainly involves enterprise human resources structure, industrial chain structure, etc. The first three types of factors are relatively easy to pinpoint to specific quantitative indicators, while the fourth type is generally more suitable for qualitative analysis.
For tourist destinations, the private sector is often operated and managed by relevant tourism enterprises. Of course, in many cities in China, large and important scenic spots are usually entrusted by government management agencies to related units or departments that have a similar enterprise nature. The fourth type of factor, “corporate strategy, structure, and industry competition”, refers to the internal operational mode, organizational structure, and competitive situation among the enterprises (institutions, units), which can be somewhat correlated with the level of tourist destinations. However, even if the internal operational mode and organizational structure of the relevant units operating the tourist destination can be known or positioned (but the various information involved is difficult to obtain clearly or distinguish between advantages and disadvantages), this is a similar “back-end” operation for the study of tourist destination competitiveness. Simultaneously, the first three types of influencing factors and their subcategories are similar to the performance of the competitiveness “front line”. The “front-line” indicator can reveal the success of the “back-end” operation in reverse. If the “back-end” operation is forcibly extracted and it is considered in parallel with the competitiveness “front-line” indicator system, this would seem unnecessary. Of course, the main difficulty lies in the author’s inability to effectively control the relevant factors of the “back-end” operation in terms of data acquisition and credibility. Regarding horizontal competition, it is certainly obvious that the size and trend of competitiveness among tourist destinations are discussed by comparison with other tourist destinations in our article. Therefore, the fourth category element is temporarily not included in the indicator system of our article.
Given the above understanding of the four major categories of elements and their subordinate content points, these elements and their content points were transferred, adjusted, and applied to the selection and determination of the key elements of tourist destination competitiveness. When measuring the competitiveness of tourist destinations, the measurement mainly considers element conditions, demand characteristics, and supporting conditions. The corresponding relationship between the aforementioned key points and the four major categories of elements in Porter’s industrial competitiveness Diamond model is shown in Table 2.

4. Data Sources, Technical Ideas, and Methods

4.1. Research Object and Data Source

Nanjing is the capital city of Jiangsu Province in eastern China, and one of the three core cities located in the Yangtze River Delta region. By the end of 2023, the permanent population of Nanjing had reached around 9.55 million. Nanjing was once the capital of ten dynasties in history, renowned for its prosperity throughout the country. As a famous historical and cultural city, Nanjing has numerous hot tourist destinations. Nanjing has unique characteristics in its various tourist destinations due to the integration of ancient city heritage, modern style, and landscape culture. Its profound historical connotations and unique Jiangnan natural landscapes complement each other, creating a well-known tourist landscape that integrates history, culture, nature, and modernity.
In particular, under the influence of history in Nanjing, most of the tourist destinations fully display their cultural and ancient charm, forming a series of “microcosms of Eastern civilization”. These showcase the magnificent aura of ancient architecture, captures the quaint charm of Qinhuai, illuminate the radiance of modern civilization, embody the cultural depth and dynastic transitions of the ages, present the misty landscapes and poetic vistas of Jiangnan, or evoke religious imagery. It has become the aspiration of global tourists to shuttle through, wander, and immerse themselves in the long river of history, allowing it to stir the soul, evoke emotions, and inspire insights.
The culmination of cultural landscapes spanning different eras, including the ancient and the modern era, Nanjing City, as an important stop for cultural tourism, has garnered a high level of popularity, resulting in numerous tourism reviews pertaining to it. This provides a high possibility for using machine learning and natural language processing technology to analyze the charm of the city.
Therefore, Nanjing City was selected as the research area. The geographical location and administrative division diagram of Nanjing in China is shown in Figure 3.
The acquisition process of Internet text review data in this paper was as follows: On the basis of comprehensive consideration of research efforts and factors such as the availability, quality, quantity, scale, reliability, and representativeness of tourism portal data, three websites—Ctrip, Mafengwo, and Dianping—were selected as data sources from among the top ten mainstream tourism portals in China. Additionally, spider software such as Octopus or related programs were utilized for data crawling, and comment text data (referred to as comment data) related to 30 hot tourist destinations in Nanjing were collected to be basic data, covering a time span from 1 January 2016 to 1 January 2024. After data cleaning (removing duplicate comments, advertising comments, overly short comments, inappropriate comments, and those with multiple emoticons), approximately 83,501 comment entries (including comment details, rated scenic spots, user-anonymized IDs, posting times, etc.) were selected as the basis for sentiment analysis. The period of data collection for the total number of reviews, images, positive reviews, and overall ratings of each tourist destination from the three major tourism portal websites took place in early January 2024. The websites and date information for the above mentioned data acquisition are as follows: https://you.ctrip.com/sightlist/nanjing9.html (1–8 January 2024); https://www.dianping.com/nanjing/ch35/d1 (1–8 January 2024); https://www.mafengwo.cn/jd/10684/gonglve.html (1–8 January 2024).
The information on 52 tourist areas (scenic spots) with a rating of 2A or above (including 2A) comes from the “List of National Tourist Attractions in Nanjing (as of 21 November 2022)” of the Nanjing Municipal Bureau of Culture and Tourism. The information on nearly 170 scenic spots comes from the Nanjing Cultural and Tourism Information Service Platform (http://www.njlyw.cn/websitenew/web (30 December 2023)). The transportation network is based on relevant information from the Nanjing Transportation Bureau, and the community location is based on relevant information from the Nanjing Planning Bureau. The speed of each level of road is determined according to the “Urban Road Traffic Engineering Project Specification (GB 55011-2021)” [51] issued in China.
There are two national 5A-level tourist attractions in Nanjing, named Zhongshan Scenic Area—Zhongshan Mausoleum Scenic Area, and Confucius Temple—Qinhuai Scenic Belt, which are famous for being places endowed with the fine spirits of the universe or the sounds of oars and lanterns. Since the Eastern Wu Dynasty, Nanjing has gradually become a bustling metropolis, and the charming scenic spots in the ancient capital Jinling have been passed down through the dynasties to today. The characteristic landscapes are connected in chains and dots. They are like tiny stars engraved with culture and immersed in nature in the long river of history, shining brightly and renowned overseas. However, within the two major scenic areas, the scale is huge and there are numerous scenic spots, making it difficult for tourists to form a comprehensive impression of them in a short period of time. From the perspective of competitiveness evaluation, tourists often start from the perception of local scenic spots, and in large scenic areas, they can only construct their own images for some of the scenic spots, making it difficult to form an overall impression. Therefore, multiple tourist attractions within the large scenic area are independently assessed for competitiveness in our paper, in order to make a relatively fair comparison with other attractions that are far smaller in scale and less influential than these two scenic belts.
Thirty representative tourist destinations were filtered as the research objects of this article, which are the top thirty tourist destinations in terms of ranking in the sorting of the total number of comments on the three major tourism portal websites. When numbering on the map, the number of each tourist destination was generally sorted from top to bottom, from left to right, and by district, as shown in Table 3 and Figure 4.

4.2. Technical Methods

4.2.1. Microsoft Azure and Baidu AI Technology—Tourist Sentiment Analysis

“Sentiment analysis and opinion mining” in Microsoft Azure Cognitive Services and “sentiment analysis” in Baidu AI Cloud language processing technology NLP were used for tourist sentiment analysis. When conducting sentiment analysis, Python programs were written for the two major technical platforms. In the specific operation, each piece of comment data in the document was imported into the platform, and the returned data were annotated. Among them, data with a confidence level below 70% in each document had to be removed. Finally, the proportion of positive reviews out of all the reviews in each tourist destination document was calculated to represent the sentiment evaluation value, using the following formula:
E i = P i ÷ M i
In the above formula, E′ represents the evaluation value of emotional tendency, Pi represents the number of positive reviews for tourist destination i, and Mi represents the total number of text reviews for tourist destination i.

4.2.2. Comprehensive Competitiveness Model

Four major factors have been integrated into the competitiveness model framework, including the “quality factor” that reflects tourism value, the “popularity factor” that reflects tourists’ enthusiasm for the destination (level of tourists’ attention), the “spatial attractiveness factor” that characterizes the quality of the spatial location, and the “emotional factor” that reveals tourists’ sentiment tendencies. The comprehensive competitiveness assessment model of tourist destinations was constructed based on the factor synthesis method. The formula is as follows:
C i = W Q Q i + W A A i + W E E i + W s S i
In the above formula, Ci represents the comprehensive competitiveness index of the tourist destination i; Qi represents the “quality factor”; Ai represents the “popularity factor (attention factor)”; Ei represents the “emotional factor”; Si represents the “spatial attractiveness factor”; WQ represents the quality factor coefficient; WA represents the popularity factor coefficient; WE represents the emotional factor coefficient; and WS represents the spatial attractiveness factor coefficient.

4.2.3. Model Entropy Weight Method

The calculation formula for the extreme value standardization of the indicator data is as follows, when the indicators are positive:
x i j = x i j min x i j , , x n j max x i j , , x n j min x i j , , x n j , ( i = 1 , 2 , , n ; j = 1 , 2 , , m )
The calculation formula for the extreme value standardization of the indicator data is as follows, when the indicators are negative:
x i j = max x i j , , x n j x i j max x i j , , x n j min x i j , , x n j , ( i = 1 , 2 , , n ; j = 1 , 2 , , m )
In the above formulas, xij represents the value of the indicator j for the tourist destination i. “i” is any of positive integer from 1, 2, … n, and “n” represents the total number of all the tourist destinations of the study area. “j” is any positive integer from 1, 2, … m, and “m” represents the total number of all the factors, which is four in this article.
The entropy value ej of the indicator j is calculated by the following formula:
P i j = x i j i = 1 n x i j , ( i = 1 , 2 , , n ; j = 1 , 2 , , m )
e j = k i = 1 n p i j ln ( p i j ) , ( i = 1 , 2 , , n ; j = 1 , 2 , , m )
In the above formulas, pij represents the proportion of the jth indicator for the i-th tourist destination among all the tourist destinations; ej ≥ 0, k = 1/ln(n).
In the next step, dj, the information entropy redundancy, that is, the information utility value for indicator j, is calculated as follows:
d j = 1 e j , ( j = 1 , 2 , , m )
Finally, the weight of each indicator, Wj, is calculated using Formula (8):
W j = d j j = 1 m d j , ( j = 1 , 2 , , m )
By calculation using the above Formulas (3)–(8), the weights of the various major factors are as follows:
The weights of the four major categories of factors in this article were determined by the entropy method. As the entropy method is a common econometric model, the formula for this model is not explained. Specifically, the quality factor weight is 11.032%, the popularity factor weight is 51.604%, the emotion factor weight is 17.863%, and the spatial attractiveness factor weight is 19.501%.

4.2.4. How to Calculate the Main Four Factors Based on Their Subordinate Indicators and Other Items for the Subordinate Indicators

The method for calculating and obtaining the values of the four types of factors is described in Table 4. Additionally, there are three more questions that need to be clarified. In terms of the standardization for the above subordinate indicators of the four factors, they were all standardized using extreme value standardization methods. Except for the negative treatment of urban spatial accessibility involved in spatial attractiveness, all the others were standardized positively. In terms of calculating the reachable time within the city, this was obtained by conducting analysis and calculations based on the transportation network, and utilizing the OD minimum cost matrix in the ArcMap (version 10.2, Environmental Systems Research Institute, Inc. RedLands, CA, USA) network analysis module. Additionally, the reason why the emotional factor used both positive ratings and sentiment analysis is that the positive, moderate, and negative reviews directly given in user comments on tourism portal websites can indeed be used to directly reflect the degree of positive sentiment in comments. However, it may not be possible to capture subtle emotional differences in comments, such as tone and wording, and it may be difficult to accurately capture the emotional tendencies in the text, including those subtle emotions that may be overlooked by directly positive, moderate, or negative reviews.

5. Analysis of Results

Based on the entropy method of weight calculation, the comprehensive competitiveness results of 30 popular tourist destinations in Nanjing (Table 5, Figure 4) show that 13 tourist destinations are above the mean, accounting for about 43% of the total number. The variation coefficient of hot tourist destinations competitiveness results is about 35%, indicating a moderate to relatively weak degree of dispersion. There is a significant dispersion among the total competitiveness of tourist destinations, but the intensity of the difference is within an acceptable range. The calculated comprehensive competitiveness results roughly show a spatial order and potential that gradually weakens from the inside out, forming an overall pattern of clusters of well-known tourist destinations in the core of the main city, relatively random small clusters in the new main city area, and scattered point distribution in the suburbs. Among the top 14 tourist destinations in the ranking, the two core urban areas (Xuanwu District and Qinhuai District) almost occupy a large part of them, with only three tourist destinations ranking around 20th. This is quite consistent with their rich historical heritage and cultural and natural landscapes which complement each other (the characteristic scenery of some of the scenic spots is shown in Figure 5). The Gulou District in the main city is known for the “first building in Jiangnan” due to its Yuejiang Tower (shown in Figure 6), which is in the typical imperial architectural style of the Ming Dynasty. The scenic area in which it is located ranks 20th, and tourists can enjoy the blue tiles, red couplets, and colorful doors, while overlooking the Yangtze River and enjoying the scenery of mountains, rivers, and pavilions. Each of the Qixia, Yuhua, and Jianye districts in the new main city area have two hot tourist destinations, ranked between 15th and 25th, forming small-scale tourist areas based on spatial proximity. They have become tourist areas that mainly rely on modern tourism resources and integrate mountains, waters, and ancient cultural landscapes. Tourist attractions such as commemorating martyrs (shown in Figure 7a), comprehensive theme parks (shown in Figure 7b), technology exhibitions and education (shown in Figure 7c), and experiencing the characteristics of the “Riverside” and “Youth Olympic Games” (shown in Figure 8) are also favored by diverse groups. Additionally, appreciating the Buddhist landscape, viewing the red maple leaves covering Qixia Mountain (shown in Figure 9a), experiencing the misty rain of Mochou Lake (shown in Figure 9b), and admiring ancient-style architecture have become the scenic spots that capture the hearts of tourists. In the scattered suburban tourist destinations, each has its own unique craftsmanship. It is commendable that Niushou Mountain in Jiangning District (shown in Figure 10), located adjacent to the main city, has two towering peaks and a shining Buddha roof. It is also worth noting that Pukou District boasts two major tourist attractions: Pearl Spring Scenic Area (shown in Figure 11) and Laoshan Forest Park, located in the suburbs and north of the Yangtze River. Although ranked 23rd and 28th, respectively, the former is known for its integration of mountains, waters, and gardens, as well as the accumulation of Buddhist and Zen culture; the latter is known as the “Green Lung of Nanjing” and the “Pearl of Jiangbei”, and they both have a distinct influence in China. The tourist destinations of the Liuhe, Lishui, and Gaochun districts in the outskirts boast of Ming and Qing architecture, canal transportation scenery, natural stone bridges, the charm of wildlife, and the beauty of slow life. They have become unique tourist destinations in Nanjing, guarding the charm of the ancient capital.
The four major criteria factors have their own characteristics in response to the competitive landscape of tourist destinations. From the perspective of “quality factor” (Figure 12), its pattern is roughly similar to the spatial order of the top 20 tourist destinations in terms of overall competitiveness, but its correspondence with the bottom 10 tourist destinations in terms of overall competitiveness is not strong. As for the “popularity factor”, in the ranking of the data results for this factor, which contributes the most to overall competitiveness, the pattern closely aligns with the top 10 or so in terms of overall competitiveness, but there are local differences when compared to the overall competitiveness pattern beyond the top 10. The coefficient of variation in the tourist “emotional factor” data results is about 5.4%, showing a weak degree of dispersion, and weak correspondence with the competitive spatial order. The overall spatial orders of the “spatial attractiveness factor” and overall competitiveness pattern lack a clear correlation. Overall, the spatial orders of the “quality factor” and “popularity factor” are partially aligned with the overall competitiveness pattern, with the former having a higher degree of resonance than the latter. Meanwhile, the correspondence between the spatial orders of the two criteria factors of “emotional factor” and “spatial attractiveness factor” and the spatial potential of overall competitiveness is weak. In addition, given that the weight proportion of “quality factor” and “popularity factor” is close to 63%, the “emotional factor” and “spatial attractiveness factor” values in tourist destinations with average or above overall competitiveness rankings remain high, which makes the competitive position of well-known scenic spots in the core of the city unshakable, while the overall competitive position of the tourist destinations in new main city area and suburbs gradually weakens.

6. Discussion

6.1. The Transformation of the Spatial Scale in Research Units

The previous trend of focusing on larger-spatial-scale research units (such as cities and above) has been broken, and the consideration of tourist destinations within cities has been highlighted in this article. The model developed by the World Economic Forum is certainly crucial and effective for evaluating the comprehensive competitiveness of tourism or travel development at the national level, focusing on aspects such as “human and cultural resources” and “natural and cultural resources” [24]. Some scholars have applied this model and indicator system to assess the overall competitiveness of the tourism sector at the national level [52], and some scholars have also explored the sustainable tourism development of countries from other perspectives, such as culturalization strategy perspective [53]. Additionally, there are also relevant reports in China on the evaluation of tourism competitiveness based on cities [35], and some scholars have explored the competitiveness, attractiveness, sustainability, efficiency, and other aspects of tourism at the city or administrative district scale [32,54,55]. Moreover, the literature on tourism competitiveness or attractiveness from a specific or narrow perspective has gradually emerged at a relatively micro level of tourist destinations [25,43]. However, there are few studies on measuring the competitiveness of multiple tourist destinations within cities and analyzing their spatial order based on geographic big data and related machine learning methods. Our article attempts to make some advancements in this regard.

6.2. The Diversity of Dimensions and Perspectives Involved in the Indicator System

In this article, the competitiveness index system of tourist destinations is considered from diversified aspects and dimensions. In recent years, it has become a kind of fashion trend worldwide to make some analysis of image perception for certain regions, based on multivariate Internet data and related machine learning models [50,56]. However, studies on the comprehensive evaluation of tourist attractiveness or competitiveness at a relatively micro level are very scarce. In our study, tourist sentiment analysis and opinion mining were conducted by using large-scale Internet text review data and a relevant machine learning model, which formed the basis of the emotional factor. The emotional factor was incorporated into the competitiveness assessment model for tourist destinations, which integrates an emotional factor, spatial attractiveness factor, quality evaluation factor, and popularity factor. The assessment approach constructed in our paper combines qualitative and quantitative analysis, takes into account geographical space and social psychological cognition, and incorporates physical existence and emotional evaluation to assess the comprehensive competitiveness of a group of popular tourist destinations in the urban tourism field.
The assessment method in this article starts from a dual perspective of supply and demand. It focuses on the dimensions of tourist gaze and the cultural construction of tourist destinations. From the aspect of the former (the perspective of demanders), the emotional inclination of tourists is an important manifestation. From the aspect of the latter (the perspective of suppliers), the diversified capital formed based on the resources of tourist destinations is an inherent construction result, which encompasses the “cultural capital”, “symbolic capital”, and “economic capital” of tourist destinations. It also takes into account the relatively emotional subjective image perception of tourists and the relatively physical or objectified spatial attractiveness of tourist destinations. Moreover, this approach integrates qualitative and quantitative analysis. Overall, the perspectives, dimensions, and methods employed in this study are innovative compared to the traditional indicator system construction dominated by the “content module” approach and the assessment methods rooted in conventional practices.

6.3. Improvements in the Objectivity and Accuracy of the Method for Evaluating the Competitiveness of Tourist Destinations

It is possible to assess the competitiveness of tourist destinations within a city in a more concise, efficient, and objective manner by using the method in the paper. In this study, there were not many factor indicators involved in evaluating the competitiveness of tourist destinations. Compared with the multi-level indicator system in traditional research (literature) in the past, this method appears relatively simple on the surface, but in reality, it contains rich perspectives and dimensions. In traditional research, factors that reflect tourism competitiveness often include resources, environment, facilities, convenience, image, services and products, experience, and other aspects, which are complex and difficult to cover in all aspects. The comprehensive evaluation model of tourist destination competitiveness constructed in this study integrates several factors, including quality evaluation, spatial attractiveness, emotional cognition, and popularity. It takes into account both official perspective and demand side (media) aspects, encompassing a comprehensive quality evaluation of tourist destinations, their spatial organization and performance, tourists’ emotional cognition, and the popularity trends of the demand side. The model in this study, based on these aspects, not only fully encompasses those traditional competitive elements of tourist destinations, but also reflects some aspects that are difficult to capture or scientifically quantify in existing research, such as cultural resonance and response, by incorporating the comprehensive emotional cognitive evaluation factor. At the same time, given the difficulty of accurately measuring the impact of tourists’ cultural characteristics on spatial perception in traditional image spatial analysis [56], this study adopted an emotional index that can reveal tourists’ cultural and emotional characteristics to assess their impact on the overall image of the tourist destination. This might promote the evaluation of the tourist destination’s development capacity from the perspective of tourist perception.
Regarding the investigation method and data, compared to traditional research, the concerned approach in this article is more efficient. The network geographic big data utilized in the article are based on the unstructured and open feelings of a large number of tourists from multiple regions, which have the advantages of wide sample coverage, high objective authenticity of evaluation, and diverse and comprehensive perspectives. However, traditional research often utilizes common assessment methods [48] to measure the competitiveness of tourist destinations based on a sampling questionnaire survey targeting a small number of surveyed users. In addition, existing research constructs very complicated indicator systems to assess the attractiveness of certain tourist destinations, some of which are extremely complex, even comprising close to 150 items [25]. On the whole, there are some limitations in the existing traditional research. For example, the research process is relatively cumbersome with a thin data volume, survey results are easily influenced by questionnaire design intentions, and the indicator systems contain relatively limited perspectives.
Consequently, it can be seen that compared to existing traditional research, this article attempts to construct a tourist destination competitiveness evaluation model based on geographic big data, incorporating perceptual indicators such as sentiment analysis, which is superior in terms of data sample acquisition efficiency and breadth, tourists’ comprehensive cognitive authenticity, and tourists’ diverse evaluation perspectives.

6.4. Shortcomings and Prospects

Firstly, the fourth category of factor in Porter’s Diamond Model of Competitiveness, namely corporate strategy, structure, and industry competition, was not included in the selection of factors affecting tourist destination competitiveness, due to relatively shallow research on management and effects. This can be given more attention in the next phase of research. In addition, the limitations on the downloading of comment data allowed by tourism portal websites might lead to some differences between the sentiment analysis results of the research subjects in this study and the actual results corresponding to all the comment data. Addressing this requires finding a more powerful data crawling technique. Furthermore, this article assessed the main scenic spots or attractions separately within two major 5A-level scenic areas, but still treated each attraction as if it were a 5A level, which might lead to local overestimation of the competitiveness score of these attractions. Further research needs to explore how to avoid such issues.

7. Conclusions

This article mainly involved three major parts of work. Firstly, the driving forces behind the competition among tourist destinations within a city were analyzed. Secondly, by drawing inspiration from Porter’s Competitiveness Diamond Model, the criteria for the competitiveness of tourist destinations within a city were selected. Thirdly, the comprehensive competitiveness of popular tourist destinations within the empirical region of Nanjing city were assessed using the factor synthesis method. The research conclusion is as follows:
Firstly, the tourist destination field within a city consists of three major elements, which are actors, rules, and competition. The series of policies and rules related to tourist destinations, from planning and development to operation and management, as well as industrial construction and development, are administrative constraints and action guidelines. Multiple participants have interactive relationships, and those who participate in the competition for tourist destination image charm, specifically groups of tourist destination operators and managers, are the main actors. Under the influence of mainstream social and cultural trends, the main actors occupy a certain “position” by relying on the comprehensive attractiveness formed by various types of capital (natural environment, landscape, culture, operation, etc.) in the tourist destination, and participate in peer competition within the field. This is the main manifestation of the main actors in the social interaction network, where various types of capital interactions are transformed.
Secondly, by drawing on the four key elements and focal points of Porter’s Diamond Model of Competitiveness, and considering its applicability to micro-tourist destinations, three main influencing factors and their subordinate aspects of tourist destination competitiveness within a city were selected and determined after adapting and adjusting the four key competitive elements of Porter’s model. The three major elements are element conditions, demand characteristics, and support conditions. The element conditions involve natural resources, tangible and intangible cultural resources, and their scale and level. The demand characteristics involve emotional factors, popularity, overall ratings, and similar factors. The supporting conditions refer to key aspects such as spatial accessibility based on the transportation network, and the clustering trend with other tourist destinations within a certain transportation time. In view of this, the key points involved in the three aspects can be summarized into four categories of factors, namely quality evaluation (involving official scale rating, the rating from portal websites), popularity level (covering the number of images and comments on portal websites), spatial attractiveness (involving spatial accessibility and spatial agglomeration effect), and emotional cognition (covering tourists’ emotional inclinations and positive rating on portal websites), which together constitute the indicator system in this study.
Thirdly, the comprehensive competitiveness of various tourist destinations in Nanjing generally presents a spatial order and position that gradually weakens in an outward direction from the center zone of the city. As a result, an overall pattern of clusters of well-known tourist destinations in the core of the city, relatively random small clusters in the new main city area, and scattered point distribution in the outer suburbs was formed. Among these, the core large-scale contiguous clusters feature “historical context as the foundation with modern landscapes embedded”, and the tourist destinations in this area rank among the top ones. In the new main urban area, small-scale, single-theme groups are primarily composed of modern tourism resources, integrating ancient mountains and rivers and distinctive cultural landscapes. The scenic spots in this area showcase diverse themes, such as revolutionary spirit, sports themes, technological advancements, ancient-style gardens, religious blessings, and themed entertainment, providing tourists with colorful imagery and perceptions. The tourist destinations are ranked in the middle or below. Among the scattered suburban tourist destinations, there are three different patterns and trends. Jiangning District, which is adjacent to the main city, is famous for the beautiful scenery of Niushou Mountain Buddha Peak, and its competitiveness ranks in the middle and upper reaches. Meanwhile, Pukou District, situated on the outskirts of the city, boasts rich and unique natural landscapes, and the amalgamation of ancient architectural complexes with natural wonders in the outer suburbs creates a modern natural environment that exudes a unique charm of life and living. Far-out suburban tourist destinations rank lower, but each one has its own unique distinctiveness, guarding the charm of the ancient capital.

Funding

This research was funded by Jiangsu Overseas Visiting Scholar Program for University Prominent Young & Middle-aged Teachers and Presidents from Jiangsu Provincial Department of Education, during the period from December 2022 to December 2023.

Institutional Review Board Statement

Ethical review and approval were waived for this study due to the People’s Republic of China (2021), the Regulations on the Administration of Network Data Security of the People’s Republic of China (2024), and the Data Security Law of the People’s Republic of China (2021).

Informed Consent Statement

This analysis does not require informed consent from the relevant comment publishers or website operators due to three aspects. Firstly, the text commentary data used for tourist sentiment analysis in this paper are publicly available information on the Internet. Secondly, all the text commentary data used in the article do not involve privacy issues with the commenters. Thirdly, the analysis work using online text data in this paper is for public welfare research activities.

Data Availability Statement

The geographical data and text review data utilized in our paper are unavailable due to privacy or ethical restrictions.

Acknowledgments

In the phase of manuscript proofreading, Zhao Huiling helped with proofreading parts 4 to 6, and Zhang Ziman helped with proofreading the references. Nanjing Planning Bureau provided some residential area data materials for this study. I am very grateful to the participants for their time and efforts.

Conflicts of Interest

The author declares no conflicts of interest.

References

  1. Williams, S.; Lew, A.A. Tourism Geography: Critical Understandings of Place, Space and Experience, 3rd ed.; Zhang, L.Y., Translator; The Commercial Press: Beijing, China, 2018. [Google Scholar]
  2. Sauer, K. Land and Life; Mei, X.K.; Yu, Y.M., Translators; The Commercial Press: Beijing, China, 2023. [Google Scholar]
  3. Li, X.; Xu, X.Q. A spatial analysis of the image of Guangzhou city. Hum. Geogr. 1993, 3, 27–35. [Google Scholar]
  4. Gu, C.L.; Song, G.C. Urban Image Space and Main Factors in Beijing. Acta Geogr. Sin. 2001, 56, 64–74. [Google Scholar]
  5. Li, Y.; Xu, X.X.; Song, B.; He, H. Impact of Short Food Videos on the Tourist Destination Image—Take Chengdu as an Example. Sustainability 2020, 12, 6739. [Google Scholar] [CrossRef]
  6. Urry, J.; Larson, J. The Tourist Gaze 3.0; Sage: London, UK, 2011. [Google Scholar]
  7. Brouder, P.; Eriksson, R.H. Staying Power: What Influences Micro-firm Survival in Tourism? Tour. Geogr. 2013, 15, 125–144. [Google Scholar] [CrossRef]
  8. Su, M.M.; Wall, G.; Ma, Z. Assessing Ecotourism from a Multi-stakeholder Perspective: Xingkai Lake National Nature Reserve, China. Environ. Manag. 2014, 54, 1190–1207. [Google Scholar] [CrossRef]
  9. Wang, Y.; Fesenmaier, D.R. Collaborative destination marketing: A case study of Elkhart county, Indiana. Tour. Manag. 2007, 28, 863–875. [Google Scholar] [CrossRef]
  10. Ateljevic, I.; Harris, C.; Wilson, E.; Collins, F.L. Getting ‘Entangled’: Reflexivity and the ‘Critical Turn’ in Tourism Studies. Tour. Recreat. Res. 2015, 30, 9–21. [Google Scholar] [CrossRef]
  11. Xie, X.Q. “Field-action analysis”: The tourism struggle of farmers in Xicun, Guizhou province. Hum. Geogr. 2019, 34, 135–142. [Google Scholar]
  12. Yang, X.Z.; Su, Y.Q.; Zhou, L.; Yang, L.; Chen, X. Characteristics and Mechanism of Urban Cultural Space Tourismification Based on Field Theory: A Case Study of Hechai 1972 Industrial Memory Town. Tour. Trib. 2024, 39, 54–70. [Google Scholar]
  13. Jiang, Y.C. An Analysis of Shanghai Textile Creative Park’s Physical Layout and Visitors’ Reactions from a Field Perspective. Master’s Thesis, Shanghai Normal University, Shanghai, China, 1 May 2016. [Google Scholar]
  14. Wu, Z.C.; Zhang, L.Y.; Zheng, Z.Q.; Zhang, B.; Liao, Z. The Production of Space within the Field of Tourism: A Case Study of the Tourism Community of Chaozhou Ancient City. Tour. Trib. 2019, 34, 86–97. [Google Scholar]
  15. Guo, Y.J.; Liang, R.X.; Luo, Q.J. The Process and Effects of Narrative Construction of Hong Kong-Zhuhai-Macao Bridge as a Red Tourism Field: Narrative Theory and Sites of Memory. Tour. Trib. 2022, 37, 87–102. [Google Scholar]
  16. Zhang, D.Y. Aggregation and Radiation of Cultural and Creative Tourism Industry under the Perspective of Field. Master’s Thesis, Southwest University, Chongqing, China, 20 May 2018. [Google Scholar]
  17. Wu, D.; Geng, H. An Analysis of the Inherent Logic of Rural Spatial Restructuring in Southwest Yunnan from the Perspective of Field Theory. Urban Plan. Forum 2023, 4, 41–49. [Google Scholar]
  18. Liu, Y.H.; Zhu, T.K.; Cao, X.J. Everyday Life and Social Space Evolution of Culture-Led Regeneration Based on Field Theory: A Case Study of Pingjiang and Xietang Districts in Suzhou. Trop. Geogr. 2023, 43, 1787–1799. [Google Scholar]
  19. Geng, J.W. A Study on Renewal Strategies for the Vitality of Public Space in Hutongs of Beijing’s Old Town from a Field Perspective. Master’s Thesis, Beijing Jiaotong University, Beijing, China, 1 June 2023. [Google Scholar]
  20. Porter, M.E. The competitive advantage of nations. Harv. Bus. Rev. 1990, 68, 73–93. [Google Scholar] [CrossRef]
  21. Boroomand, B.; Kazemi, A.; Ranjbarian, B. Designing a Model for Competitiveness Measurement of Selected Tourism Destinations of Iran (The Model and Rankings). J. Qual. Assur. Hosp. Tour. 2019, 20, 491–506. [Google Scholar] [CrossRef]
  22. Cronjé, F.D.; Plessis, E. A review on tourism destination competitiveness. J. Hosp. Tour. Manag. 2020, 45, 256–265. [Google Scholar] [CrossRef]
  23. Poon, A. Tourism, Technology and Competitive Strategies; C.A.B. International: Wallingford, UK, 1993; Chapter 9. [Google Scholar]
  24. Calderwood, L.U.; Soshkin, M. The travel and tourism competitiveness report 2019. In Proceedings of the World Economic Forum, Davos, Switzerland, 22–25 January 2019. [Google Scholar]
  25. Selim, M.A.; Abdel-Fattah, N.A.; Hegazi, Y.S. A Composite Index to Measure Smartness and Competitiveness of Heritage Tourism Destination and Historic Building. Sustainability 2021, 13, 13135. [Google Scholar] [CrossRef]
  26. Mendola, D.; Volo, S. Building composite indicators in tourism studies-Measurements and applications in tourism destination competitiveness. Tour. Manag. 2017, 59, 541–553. [Google Scholar] [CrossRef]
  27. Ben-Dalia, S.; Collins-Kreiner, N.; Churchman, A. Evaluation of an Urban Tourism Destination. Tour. Geogr. 2013, 15, 233–249. [Google Scholar] [CrossRef]
  28. Palatková, M.; Zichová, J.; Hrubcová, G. Tourism competitiveness of the czech republic regions and the possibility of the marketing measures performance evaluation using the BSC method. In Proceedings of the 12th Global Forum on Tourism Statistics, Prague, Czech Republic, 15–16 May 2014; pp. 15–16. [Google Scholar]
  29. Zhang, J. Patterns of innovation-driven tourism competitiveness: Insights from 270 Chinese cities. Tour. Manag. 2025, 107, 105063. [Google Scholar] [CrossRef]
  30. Penjišević, I.; Lukić, T.; Milosavljević, S.; Jandžiković, B.; Šabić, D.; Dragojlović, J.; Valjarević, A. Sustainable Tourism near the City—A Case Study of Stolovi Mountain, Serbia. Sustainability 2024, 16, 782. [Google Scholar] [CrossRef]
  31. Petelca, O.; Ptruceanu, C.C.; Garbuz, V.; Beșliu, I. Analysis of travel and tourism competitiveness index in eastern partnership countries. Ann. Univ. Oradea Econ. Sci. Ser. 2023, 3, 235–249. [Google Scholar] [CrossRef] [PubMed]
  32. Wu, D.D.; Li, H.; Wang, Y.H. Measuring sustainability and competitiveness of tourism destinations with data envelopment analysis. J. Sustain. Tour. 2023, 31, 1315–1335. [Google Scholar] [CrossRef]
  33. Ye, Y. Study on the Evaluation Index System of Guangdong’s All-for-One Tourism Destination Competitiveness Based on Factor and Cluster Analysis. Open J. Soc. Sci. 2019, 7, 418–428. [Google Scholar] [CrossRef]
  34. Wang, X.; Li, X.R.; Zhen, F.; Zhang, J. How smart is your tourist attraction?: Measuring tourist preferences of smart tourism attractions via a FCEM-AHP and IPA approach. Tour. Manag. 2016, 54, 309–320. [Google Scholar] [CrossRef]
  35. Liu, D.Q.; Shi, M.Y.; Hao, Z.C.; He, Y.; Ji, S.J.; Liao, B. China’s Urban Leisure and Tourism Competitiveness Report (2020); Social Sciences Academic Press: Beijing, China, 2020; ISBN 9787520176699. [Google Scholar]
  36. Lee, C.F. Understanding the Factors Determining the Attractiveness of Camping Tourism: A Hierarchical Approach. Tour. Plan. Dev. 2020, 17, 556–572. [Google Scholar] [CrossRef]
  37. Gu, X.; Hunt, C.A.; Jia, X.; Niu, L. Evaluating Nature-Based Tourism Destination Attractiveness with a Fuzzy-AHP Approach. Sustainability 2022, 14, 7584. [Google Scholar] [CrossRef]
  38. Zhang, H.; Gu, C.L.; Gu, L.W.; Zhang, Y. The evaluation of tourism destination competitiveness by TOPSIS & information entropy—A case in the Yangtze River Delta of China. Tour. Manag. 2011, 32, 443–451. [Google Scholar]
  39. Wang, M.Y. Research on Evaluation and Enhancement of Tourism Attractiveness of Changchun City Based on IPA Analysis. Master’s Thesis, Northwest Normal University, Lanzhou, China, 1 May 2019. [Google Scholar]
  40. Zhu, Z.Y.; Wang, R.; Hu, J.; Li, Y.J. Evaluation and Spatial Analysis of the Attractiveness of Rural Tourism Destinations in Jiangxi Province Based on Network Information. Resour. Environ. Yangtze Basin 2020, 29, 1713–1722. [Google Scholar]
  41. Yu, C.X. Analysis and Evaluation of the Core Competitiveness of Red Tourist Destinations. Master’s Thesis, Xiangtan University, Xiangtan, China, 1 June 2009. [Google Scholar]
  42. Luo, X.J. Evaluation of Tourism Attractiveness of Qingyan Ancient Town under Spatial Reconstruction. Master’s Thesis, Guizhou University, Guiyang, China, 1 June 2021. [Google Scholar]
  43. Zhang, K. Evaluation of Tourism Attractiveness of Mount Putuo Buddhist Cultural Tourism Area from the Perspective of Tourist Perception. Master’s Thesis, Zhejiang Ocean University, Zhoushan, China, 30 May 2022. [Google Scholar]
  44. Shi, C.Y.; Zhang, J.; You, H.M. Structural Equation Model for tourism destination competitiveness from tourists’ perception perspectives. Geogr. Res. 2008, 3, 703–714. [Google Scholar]
  45. Zhao, X.R. Research on Tourism Attractiveness Evaluation of Xingwen Global Geopark Based on IPA. Master’s Thesis, Chengdu University of Technology, Chengdu, China, 1 April 2020. [Google Scholar]
  46. Zhou, M. Study on the Path of Competitiveness Enhancement of Rural Tourist Places. Master’s Thesis, Nanjing Agricultural University, Nanjing, China, 1 May 2014. [Google Scholar]
  47. Chen, H.B. A Study on the Difference of Perceived Attractiveness of Destination and Its Impact on Tourists Revisitention—Take Hainan for Example. J. Beijing Int. Stud. Univ. 2012, 34, 73–77+82. [Google Scholar]
  48. Peng, Y.J. A Comprehensive Study on the Tourism Attractiveness of Chengdu’s Historic Neighborhoods. Master’s Thesis, Sichuan Normal University, Chengdu, China, 31 March 2019. [Google Scholar]
  49. Huang, X.K. Evaluation of Tourism Attractiveness of Buddhist Cultural Tourism Area Based on Tourist Perception. Master’s Thesis, Nanjing Normal University, Nanjing, China, 6 April 2020. [Google Scholar]
  50. Bai, H.R.; Song, Z.N.; Liang, S.M.; Zhang, P.; Zhang, G. Imagery Perception Analysis and Comprehensive Attraction Evaluation of Tourism Destinations Based on Internet Text Data: Taking Nanjing City as Example. Areal Res. Dev. 2023, 42, 89–94. [Google Scholar]
  51. GB 55011-2021; Urban Road Traffic Engineering Project Specification. China Architecture & Building Press: Beijing, China, 2021.
  52. Băbăț, A.-F.; Mazilu, M.; Niță, A.; Drăguleasa, I.-A.; Grigore, M. Tourism and Travel Competitiveness Index: From Theoretical Definition to Practical Analysis in Romania. Sustainability 2023, 15, 10157. [Google Scholar] [CrossRef]
  53. Jeong, J.Y.; Karimov, M.; Sobirov, Y.; Saidmamatov, O.; Marty, P. Evaluating Culturalization Strategies for Sustainable Tourism Development in Uzbekistan. Sustainability 2023, 15, 7727. [Google Scholar] [CrossRef]
  54. Zekan, B.; Onder, I.; Gunter, U. Benchmarking of Airbnb listings: How competitive is the sharing economy sector of European cities? Tour. Econ. 2019, 25, 1029–1046. [Google Scholar] [CrossRef]
  55. Rheeders, T.; Meyer, D.F. The Development of a Regional Tourism Destination Competitiveness Measurement Instrument. Tour. Hosp. 2023, 4, 1–20. [Google Scholar] [CrossRef]
  56. Jiao, J.; Holmes, M.; Griffin, G.P. Revisiting Image of the City in Cyberspace: Analysis of Spatial Twitter Messages during a Special Event. J. Urban Technol. 2018, 25, 65–82. [Google Scholar] [CrossRef]
Figure 1. Research roadmap.
Sustainability 17 00090 g001
Figure 2. The formation motives for competition among various tourist destinations within the urban tourism field.
Sustainability 17 00090 g002
Figure 3. Geographical location and administrative zoning diagram of Nanjing, China.
Sustainability 17 00090 g003
Figure 4. The layout and competitiveness results of 30 popular tourist destinations in Nanjing.
Sustainability 17 00090 g004
Figure 5. Local scenery of several famous scenic areas with high competitive rankings in Xuanwu District and Qinhuai District in Nanjing. (a) Presidential Palace Scenic Area. (b) Ming Xiaoling Mausoleum Scenic Spot. (c) Sun Yat-sen Mausoleum Scenic Spot. (d) Dabao’en Temple Site Park.
Sustainability 17 00090 g005
Figure 6. Local scenery of Yuejianglou Scenic Area in Gulou District in Nanjing.
Sustainability 17 00090 g006
Figure 7. Local scenery of several famous scenic areas in Yuhua District and Qixia District in Nanjing. (a) Yuhuatai Scenic Area. (b) Happy Valley Scenic Area of Nanjing. (c) Technology Museum of Nanjing.
Sustainability 17 00090 g007
Figure 8. Local scenery of Nanjing Eye Tourist Area.
Sustainability 17 00090 g008
Figure 9. Local scenery of Qixia Mountain Scenic Area and Mochou Lake Park. (a) Red maple leaves of Qixia Mountain. (b) Misty rain of Mochou Lake.
Sustainability 17 00090 g009
Figure 10. Local scenery of Niushou Mountain in Jiangning District.
Sustainability 17 00090 g010
Figure 11. Local scenery of Pearl Spring Scenic Area in Pukou District.
Sustainability 17 00090 g011
Figure 12. The comparison of the values among sub-factors and comprehensive competitiveness.
Sustainability 17 00090 g012
Table 1. Capital categories and corresponding elements related to tourist destination development.
Four Types of CapitalSpecific CategoryCorresponding Elements of Tourist Destinations
Economic capital Mainly refers to the total capital, such as current assets, fixed assets, intangible assets, and deferred assets and the like, invested by tourist destination operation and management institutions in the investment, construction, and operation of tourist destinations. Natural resources and landscape environment of scenic spots can also be included in this category.
Cultural capitalEmbodied formCultural depth, sense of locality, authenticity, historical heritage, local customs, residents’ cultural cultivation, spiritual and emotional state, etc.
Objectified formMaterialized tangible cultural tourism resources, such as celebrity residences, historical sites, sculptures, modern architecture, other landmarks, etc.
Institutionalized formScale rating of scenic spots (tourist destinations) from official or unofficial sources
Social capital The social relationship network of tourist destination operation and management units, as well as the spatial relationship network formed by the tourist destinations in the local or non-local tourist destination system, such as aggregation, mutual reflection or relative independence, exclusion, scattered distribution, etc.
Symbolic capital typical titles (socially recognized and well-known titles) of scenic spots (tourist destinations) from official or unofficial channels
Table 2. Porter’s competitive factors, the influencing factors of tourist destination competitiveness in this article, and the capital categories that correspond to these factors.
Porter’s Four Key Elements of CompetitivenessKey Points CoveredFactors Influencing the Competitiveness of Tourist DestinationsKey Points InvolvedCorresponding Capital
Factor conditionsProduction factors such as natural resources, labor, capital, infrastructure, and technology.Element conditionsNatural resources, tangible and intangible cultural resources, and the scale and level of their formationEconomic capital, cultural capital
Demand conditionsThe characteristics and intensity of market demand for products or services in this industryDemand characteristicsThe demand situation of potential or existing tourists for tourism products or services in tourist destinations can be revealed through aspects such as tourists’ emotional tendencies, popularity, and overall ratings.Cultural capital, symbolic capital
Related and supporting industriesThere are mutually supportive industrial groups within the country.Supporting conditionsThe spatial accessibility based on the transportation network, and the clustering trend with other tourist destinations within a certain transportation time.Economic capital, social capital
Firm strategy, structure, and rivalryHow to manage the operation of enterprises and the competitive situation within the industryOperational strategy and organization mode of one enterprise, and the like This article mainly discusses the quantifiable indicators that can be clearly defined under geographic big data and machine learning technologies, but this element usually needs to be assessed based on questionnaire surveys or interviews, and this article does not considered this for the time being.Economic capital, cultural capital
Table 3. The thirty popular tourist destinations in Nanjing City.
Administrative RegionNameCode
Luhe DistrictJinniu Lake Wildlife KingdomL1
Pukou DistrictLaoshan Forest ParkL2
Pearl Spring Scenic AreaL3
Qixia DistrictQixia Mountain Scenic AreaL4
Happy Valley Scenic AreaL5
Gulou DistrictYuejianglou Scenic AreaL6
Xuanwu DistrictHongshan Forest zooL7
Xuanwu Lake Scenic AreaL8
Sun Yat-sen Mausoleum Scenic SpotL9
Music Platform Scenic SpotL10
Linggu Scenic SpotL11
Ming Xiaoling Mausoleum Scenic SpotL12
Presidential Palace Scenic AreaL13
Nanjing MuseumL14
Jianye DistrictMochou Lake ParkL15
Qinhuai DistrictChaotian Palace Scenic AreaL16
Zhan Landscape GardenL17
Confucius Temple Dacheng HallL18
Jiangnan GongyuanL19
Qinhuai Painting Boat Water TourL20
Bailuzhou ParkL21
Zhonghua Gate WengchengL22
Dabao’en Temple Site ParkL23
Yuhua DistrictYuhuatai Scenic AreaL24
Nanjing Science and Technology MuseumL25
Jianye DistrictNanjing Eye Tourist AreaL26
Jiangning DistrictNiushou Mountain Cultural Tourism AreaL27
Lishui DistrictTianshengqiao Scenic AreaL28
Gaochun DistrictGaochun International Slow CityL29
Gaochun Old StreetL30
Table 4. The methodology for calculating and obtaining the values of the four types of factors.
Factor TypeSubordinate IndicatorsCalculation Methodology of FactorsNotes
Quality factor, QiQsi, the official scale rating for each tourist destination.
Qri, the total rating for each of the three portal websites mentioned above.
Qi is calculated by averaging the standardized value of Qsi and the averaged value of the standardized value of Qri.
Popularity level factor, AiAci and Aii are the number of comments and the number of images for each tourist destination on each tourism portal website, respectively.Ai is obtained by weighted sum of two types of the results obtained by processing the values of the two indicators accordingly, which are, respectively, the average value of the standardized values of Aci and Aii from the three tourism portal websites.The weights of Aci and Aii are 0.75 and 0.25, respectively. The weights were determined by consulting with experts in the field of tourism geography.
Emotional factor, EiEpri, the positive rating for each tourist destination on three tourism portal websites.
Esti, the sentiment tendency analysis result of each tourist destination based on the text comment data on each tourism portal website.
The sentiment factor is calculated by averaging the averaged value of the standardized values for Epri and the standardized value of Esti.
Spatial attractiveness factor, SiSrsi, rating score for the number of scenic spots covered within 10 min of driving time for each spot, which is more concerned with non-local tourists.
Sati, the average time from each tourist destination to all communities, which is more concerned with local tourists.
Si is obtained by weighting the standardized values of Srsi (the aggregation effect indicator) and Sati (the urban spatial accessibility), with weights of 0.59 and 0.41, respectively. The weights of Srsi and Sati were obtained by averaging the respective proportions of local and non-local tourists involved in two reports, from the China Jiangsu Network (1 August 2023, https://baijiahao.baidu.com/s?id=1772991715781654723&wfr=spider&for=pc) and from the Nanjing Daily (1 January 2024, https://travel.sohu.com/a/748650560_121388342).
Table 5. Comprehensive competitiveness evaluation results of popular tourist destinations in Nanjing.
NameCodeEvaluation ResultsRanking
Presidential Palace Scenic AreaL130.6922 1
Ming Xiaoling Mausoleum Scenic SpotL120.6916 2
Xuanwu Lake Scenic AreaL80.6806 3
Nanjing MuseumL140.6744 4
Sun Yat-sen Mausoleum Scenic SpotL90.6056 5
Niushou Mountain Cultural Tourism AreaL270.6007 6
Dabao’en Temple Site ParkL230.5910 7
Qinhuai Painting Boat Water TourL200.5795 8
Hongshan Forest zooL70.5717 9
Jiangnan GongyuanL190.5443 10
Zhan Landscape GardenL170.5350 11
Zhonghua Gate WengchengL220.4649 12
Bailuzhou ParkL210.4516 13
Chaotian Palace Scenic AreaL160.4220 14
Qixia Mountain Scenic AreaL40.4196 15
Yuhuatai Scenic AreaL240.4094 16
Mochou Lake Park L150.3928 17
Confucius Temple Dacheng HallL180.3899 18
Linggu Scenic SpotL110.3890 19
Yuejianglou Scenic AreaL60.3696 20
Music Platform Scenic SpotL100.3657 21
Happy Valley Scenic AreaL50.3546 22
Pearl Spring Scenic AreaL30.3079 23
Nanjing Science and Technology MuseumL250.3064 24
Nanjing Eye Tourist AreaL260.2608 25
Jinniu Lake Wildlife KingdomL10.2607 26
Tianshengqiao Scenic AreaL280.2369 27
Laoshan Forest ParkL20.2308 28
Gaochun International Slow CityL290.2090 29
Gaochun Old StreetL300.1867 30
Disclaimer/Publisher’s Note: The statements, opinions and data contained in all publications are solely those of the individual author(s) and contributor(s) and not of MDPI and/or the editor(s). MDPI and/or the editor(s) disclaim responsibility for any injury to people or property resulting from any ideas, methods, instructions or products referred to in the content.

