Abstract
Green construction evaluation systems can assist building stakeholders in scientifically evaluating the carbon emission performance of construction projects. However, most green construction evaluation tools and methods fail to explicitly incorporate construction carbon emission indicators, let alone a quantitative evaluation. Therefore, this study proposes a carbon emission evaluation system based on the entropy–TOPSIS and K-means methods for foundation construction projects. In this study, we innovatively divided the carbon emission of the foundation construction process into three phases, namely, transportation emission, excavation and earthwork emission, and pile work emission, considering their different emission characteristics and reduction difficulties by nature. Different from traditional carbon evaluation methods, the carbon emission of the three phases were evaluated separately against the baseline value obtained from local construction quota. After that, the emission performance of the three phases was weighted and evaluated based on the entropy–TOPSIS method, and then rated via the K-means method. Based on a case study of 19 residential buildings, the weights of the three construction phases were 27.66% (transportation), 42.34% (excavation and earthwork), and 29.99% (pile work). The carbon performance of the 19 cases were rated by the K-means method into four levels: six cases were rated “Excellent”, five were rated “Good”, five were rated “Fair”, and three were rated “Poor”. The proposed method was expected to objectively and scientifically evaluate and rate the carbon emission of the foundation construction process, and provided a theoretical basis for decision makers to identify emission hotspots and formulate specific carbon reduction measures.
1. Introduction
The construction industry experienced a boom in the early 20th century and began to develop rapidly. This development not only initiated rapid economic growth but also consumed large amounts of natural resources and energy, which has had significant impacts on the environment. According to the International Energy Agency (IEA) [1], the construction industry accounted for over one-third of global carbon dioxide (CO2) emission, including those of the different building life cycle stages, i.e., construction, operation, and demolition. In China, the total carbon emission from the construction industry was approximately 5.08 billion tons in 2020, accounting for 51% of the country’s total carbon emission [2], which underscores the critical need for low-carbon construction and sustainable development.
The concept and purpose of green building are the implementation of sustainable development. Green buildings require maximum resource conservation, environmental protection, and pollution reduction throughout their entire life cycles. The existing green building evaluation systems lack carbon emission analysis and evaluation for the different building life cycle stages, especially the construction stage. In China, many scholars believed that the scope and dimensions of the existing green building evaluation systems need to be expanded to fully evaluate the entire life cycle of a building [3,4,5,6]. A similar problem exists in the global construction sector [7,8,9]. Moreover, there is a lack of an analysis of clear quantitative carbon evaluation for the construction stage [3,4,5,6,9]. Therefore, a carbon emission evaluation system that consists of quantitative emission indicators is urgently needed for construction processes to improve the existing green building evaluation systems and thereby further assist building stakeholders in the implementation of carbon reduction strategies.
The building construction process can be divided into several stages, including the foundation construction, main structure construction, and decoration and equipment installation. The foundation is an important component of a building, and its primary functions are to ensure the load bearing stability of the upper structure and improve the safety and durability of the building. As a result, foundation construction projects usually have long project periods, require large quantities of works, and involve a variety of materials, complex processes, and construction machinery. According to statistics, the GDP of China’s construction industry reached CNY 30.45 trillion in 2019, of which foundation construction projects accounted for about 14.1% [10]. During building construction, the carbon emission from the foundation construction could account for as much as 26% of the total carbon emission [11]. The energy efficiency and carbon reduction of a building foundation have a significant impact on the sustainability of the whole building [12,13].
With the rapid development of China’s economy, the amount of land for construction is decreasing in urban areas. Buildings are becoming higher and deeper, increasing the demands for underground space development. Today, with increasingly complex underground conditions, higher standards for construction techniques, environmental protection, and construction management are being proposed for foundation construction projects. However, the current methods and standards for assessing green building construction do not meet the current practical needs, as a clear quantitative carbon evaluation for the construction process is lacking [3,4,5,6,9,14,15]. Moreover, foundation construction is a complex, time-consuming, and resource-demanding process that can be further divided into three phases: transportation, excavation and earthwork, and pile work. The construction methods, technical requirements, costs, construction machinery, and materials of these three phases are different; therefore, so are their construction complexities, carbon emission intensities, and emission reduction potentials. As a result, it is hard to accurately reflect the emission characteristics and reduction difficulties of the three construction phases by directly quantifying and rating their carbon emission. The ultimate target of carbon evaluation is to formulate and develop proper carbon reduction measures and strategies; however, the existing carbon evaluation methods can hardly assist stakeholders in this for specific foundation construction processes. Therefore, a comprehensive, phased evaluation system for the carbon emission of foundation construction is yet to receive in-depth studies.
As mentioned above, the carbon emission performance of foundation construction is determined via the carbon emission of the three separated phases, which makes it a multi-criteria decision-making problem. Among the numbers of reviewed multi-criteria decision analysis (MCDA) methods, the entropy-based technique for order preference by similarity to the ideal solution (entropy–TOPSIS) method showed great potential and has been applied in this study. Therefore, this study aimed to propose a comprehensive method to scientifically calculate and evaluate the carbon emission of foundation construction projects via the entropy–TOPSIS theory. With the proposed method, the carbon performances of the different foundation construction phases can be evaluated, and the overall carbon performance can be rated accordingly. By adopting the proposed evaluation method, the stakeholders can not only be revealed with the carbon performance of foundation construction projects, but also be informed with the emission hotspots of the construction process and their carbon reduction potentials.
2. Literature Review
2.1. Current Research on a Green Construction Evaluation System
Establishing a green construction evaluation system is a hot topic in the relevant research field. At present, research on a green construction evaluation system focuses on two aspects. On one hand, many researchers have compared and analyzed the green construction evaluation systems of different countries and areas [16,17,18]. They found that all studied countries and areas were actively seeking green construction development paths that are suitable for their own national conditions. The Building Research Establishment Environmental Assessment Method (BREEAM) developed by the United Kingdom is one of the earliest green building evaluation systems, with the evaluation criteria covering multiple dimensions of environment impacts such as energy, materials, and indoor environment. The Leadership in Energy and Environmental Design (LEED) green building rating system issued in the United States is one of the most recognized green building evaluation systems, with a particular emphasis on energy efficiency and indoor environmental quality. The Comprehensive Assessment System for Built Environment Efficiency (CASBEE) is a method for evaluating and rating the environmental performance of buildings developed in Japan. It places emphasis on the environmental efficiency of buildings, resource conservation and waste management. However, neither BREEAM, LEED nor CASBEE provided a comprehensive quantitative assessment of construction phase carbon emission [9]. In China, the existing green construction evaluation system is still incomplete and in its infancy stage. The relevant evaluation standards in China include the GB/T 51366-2019 “Standard for Building Carbon Emission Calculation” [19], the GB/T 50378-2019 “Assessment Standard for Green Building” [20], and the GB/T 50640-2010 “Evaluation Standard for Green Construction of Building” [21]. The GB/T 51366-2019 standard [19] merely introduces the methods and rules pertaining to the calculation of energy consumption carbon emission of the different building life cycle stages, without a specific evaluation of carbon emission. The emphasis of the GB/T 50378-2019 standard [20] is on the evaluation of the overall green performances of buildings, while the assessment of the energy and carbon emission of the construction processes is relatively simple and fails to provide quantitative carbon emission indicators during building construction. The GB/T 50640-2010 standard [21] is tailor-made for evaluating the green performances of building construction processes, but its evaluation system is relatively macro and lacks quantitative indicators. Overall, the foci and methods of the above-mentioned three standards are different. There are obvious deficiencies in their carbon evaluations for construction, and none of them are able to comprehensively quantify and evaluate carbon emission during building construction. Consequently, they can hardly assist the building stakeholders in the further management and control of construction carbon emission.
On the other hand, a considerable amount of research has focused on the evaluation methods adopted in the current green building evaluation systems. Many researchers have proposed various theories and methods to evaluate and rate the green performance of construction projects to better understand their environmental impacts and implement impact reduction strategies. Among them, the analytic hierarchy process (AHP) has been extensively studied [22,23]. Some previous studies have combined the AHP subjective weighting and entropy weighting methods in their green building evaluation [24,25]. Some researchers have proposed the combination of AHP and fuzzy evaluation methods [26,27], and some have evaluated green construction projects by establishing a grey clustering comprehensive evaluation model [28,29]. Overall, the researchers in this field have conducted a series of explorations using different methods to determine and rate the green construction performance levels. However, previous studies have their own emphasis on the actual construction project, and there were very few applications of specific carbon emission indicators. Moreover, most of the studied indicators were qualitative, with fewer quantitative indicators.
2.2. Current Research on Foundation Construction Carbon Emission
The building construction process can be divided into three main stages, namely foundation construction, main structure construction, and decoration and equipment installation, which differ in their work amounts, complexities, and construction duration. Moreover, the construction materials, mechanical equipment, and construction techniques involved in the three stages are largely varied. Therefore, the carbon emission amounts and emission characteristics of the three construction stages are significantly different. The carbon emission of the main structure construction made up the largest proportion, followed by those of the foundation construction [30]. Liu et al. [31] found that the carbon emission of the foundation construction accounted for about 18% of the total carbon emission during the entire construction period, with the carbon emission during the excavation stage being particularly prominent. According to the study by Wu et al. [32], the land surveying and foundation construction contributed the most to the total project carbon emission, accounting for over 50%.
Although there is plenty of research on carbon emission throughout the entire building life cycle, research on carbon emission evaluation systems specifically for foundation construction is still relatively scarce. The foundation construction process is the initial stage of construction, and the relevant carbon emission has not received sufficient attention for a long time. Moreover, the existing research mainly focused on the carbon emission calculations of specific foundation types, construction technologies, or individual cases [33,34,35]. Therefore, these studies have not yet formed a systematic and widely adopted framework for the evaluation of foundation construction carbon emission [36].
Researchers have proposed various assessment methods to better address the challenge of foundation construction carbon emission, among which the life cycle assessment (LCA) and building information modeling (BIM) methods are frequently used. Pujadas Gispert et al. [37] used the LCA method to evaluate the environmental impacts of different foundation construction systems. Li et al. [38] analyzed the carbon emission trend of the construction process of precast concrete piles through LCA. The application of the BIM technique has further improved the carbon emission quantification and evaluation of building construction [39,40,41]. Moreover, the process-based method has also been widely applied in the quantification and evaluation of carbon emission in foundation construction [33,34]. Although different techniques to quantify and evaluate the carbon emission of foundation construction were adopted in these studies, the researchers evaluated the foundation construction stage as a whole and did not consider the different carbon emission characteristics of the different phases (transportation, excavation and earthwork, and pile work), and have not distinguished the carbon performance of them.
2.3. Current Research on Multi-Criteria Decision Analysis (MCDA) Methods
Given that the carbon emission of the different foundation construction phases (transportation, excavation and earthwork, pile work) have different characteristics and potential in emission reduction, they should be evaluated separately and assigned with different weights. This terms the carbon emission evaluation into a multi-criteria decision problem. Traditional MCDA methods include the analytic hierarchy process (AHP) [42], TOPSIS [43], entropy–TOPSIS, and fuzzy comprehensive evaluation, etc.; newly emerging MCDA methods include the Stochastic Identification of Weights (SITW) method [44], ranking comparison (RANCOM) method [45], expected solution point integrated characteristic objects method (ESP-COMET) [46], etc.
The AHP method was introduced by Saaty [42] in the 1970s, which is an MCDA method widely adopted in the fields of management, engineering, and business. This method decomposes elements that are related to decision-making into hierarchically structured levels containing goals, criteria, and solution plans. It conducts pairwise comparisons of criteria based on their relative importance. It provides a clear decision-making process that helps decision-makers consider various issues comprehensively. This method is simple and straightforward, and is able to combine qualitative and quantitative criteria. It requires a limited amount of quantitative information to solve complex decision-making problems. However, the AHP method has strong subjectivity that the pairwise comparisons largely rely on the subjective judgment of decision-makers. Additionally, it requires consistency testing and may sometimes require multiple adjustments to the judgment matrix.
The TOPSIS method, also known as the optimal solution distance method, is a comprehensive evaluation method that evaluates objects by calculating their distance between ideal and negative ideal solutions [43]. The evaluation objects are ranked based on their distances (proximities) to the ideal solutions. This method comprehensively evaluates multiple objects, fully considering the importance of each indicator. The TOPSIS model uses objective data for evaluation, avoiding the influence of subjective factors and making the evaluation results fair and objective. Moreover, this method has no strict limitations on data sample size and indicator quantity, making it suitable for both small sample data and large systems with multiple evaluation units and indicators. It is flexible and convenient. However, the TOPSIS method does not consider the correlation between criteria, and it requires data samples to have a normal distribution to achieve the best evaluation accuracy. The entropy–TOPSIS model is an extension of the TOPSIS method which integrates weight assignment to each criterion/indicator. The weights of the criteria/indicators are assigned by applying the entropy theory, and the comprehensive evaluation of the weighted criteria/indicators is then determined using the TOPSIS theory. Entropy refers to the degree of disorder in a system, and it is the measure of the uncertainty of an indicator. The entropy method is used to determine the indicator weights based on the information provided by each piece of indicator data. The higher the entropy value of a indicator, the higher the degree of its disorder/confusion, which indicates that it provides less useful information and is not as capable in comprehensive evaluation. Consequently, the weight assigned to it is less.
The fuzzy comprehensive evaluation is a comprehensive evaluation method based on fuzzy mathematics. This method converts qualitative evaluation into quantitative evaluation based on the membership theory of fuzzy mathematics. It can effectively solve fuzzy, qualitative, or non deterministic problems. It has been widely used in various fields, including medicine, construction industry, environmental quality supervision, water conservancy engineering, etc. However, the calculation is complex and the determination of indicator weight vectors is subjective. It requires a lot of data and information, making it difficult to conduct effective evaluation when data is limited. Alongside that, the evaluation result is a vector rather than a clear point value, which contains rich information but also increases the result complexity.
In recently years, newly developed MCDA methods provide us broader perspectives and more choices. The Stochastic Identification of Weights (SITW) method is a criterium weight assigning method introduced by Kizielewicz and Sałabun [44]. A feature of the SITW method is to determine the optimal weights by using stochastic optimization technique, e.g., the particle swarm optimization technique, which aims to find the optimal solution by iterating the position of each particle. This weighting method was compared with the traditional ones, including the entropy weighting method and standard deviation weighting method, through a case study by Kizielewicz and Sałabun [44]. The results indicated that the SITW method outperformed the latter two. The ranking comparison (RANCOM) method [45] was developed to fill the gap of expert hesitation and judgement error in most subjective weighting methods such as AHP. This method is suitable to handle expert inaccuracies for problems with five or more criteria [45]. The expected-solution-point-integrated characteristic objects method (ESP-COMET) was introduced to address the issue of personal preferences in the decision making problem, e.g., selection of the most suitable car based on individual needs [46]. Although the above emerging MCDA methods provide us rich alternatives and more accurate solutions in different scenarios, their application in broader fields needs an in-depth investigation.
By reviewing the above MCDA methods and considering the data characteristics of this study, the entropy–TOPSIS method has significant advantages in dealing with the carbon emission evaluation in this study. The merit of the entropy–TOPSIS method is that it can eliminate the result bias caused by subjective assignment, avoid the influence of subjective factors, and improve the objectivity and accuracy of the evaluation results. The entropy–TOPSIS method has been applied in the fields of urban-scale, low-carbon development, energy consumption, and environmental management. Its objectivity and adaptability make it suitable for carbon emission evaluation for building construction. Zhang et al. [47] adopted the entropy–TOPSIS method to quantify the impacts of the factors affecting urban carbon emission and evaluated the low-carbon economy of cities. Zou et al. [48] evaluated the effects of the Energy Green Consumption Revolution using the entropy–TOPSIS method. In the field of energy consumption and environmental management, the entropy–TOPSIS method has been applied in water resource management [49]. Yu et al. [50] proposed an entropy–TOPSIS decision-making model to evaluate the impacts of industrial wastewater treatment projects. In summary, the entropy–TOPSIS method has been widely used, and previous studies have demonstrated its flexibility and superiority in various fields. Although this method has not yet been widely used for construction carbon emission evaluation, its adaptation has significant potential for carbon emission evaluation of the building construction stage.
2.4. Current Research on Evaluation Rating Based on Machine Learning
In previous studies, various machine learning algorithms have been applied to data rating. Commonly adopted machine learning algorithms include random forest [51], support vector machine [52], neural network [53], K-means clustering algorithm [54], etc. Among them, the K-means clustering algorithm has received much attention. The K-means clustering algorithm is an unsupervised learning method that divides data into a K number of groups. When clustering data, the K-means clustering method minimizes the variance within the clusters and maximizes the variance between different clusters. Therefore, it can automatically divide data into different clusters and help identify the intrinsic patterns and structures of the data [55,56]. Moreover, the K-means clustering algorithm was highly efficient and simple to use when handling large-scale data [57]. In addition, it performed well in detecting outliers, thus improving the accuracy and reliability of data clustering [58]. Therefore, the K-means clustering algorithm has become an important tool in data rating.
2.5. Summary of Current Research
According to the review of the existing research on green construction evaluation, foundation construction carbon emission, the entropy–TOPSIS comprehensive evaluation theory, and the machine learning based rating method, it was found that construction industry stakeholders are paying increasing attention to the implementation of “green” and “low-carbon” construction. However, the development and implementation of sustainable construction are still in their early stages in many countries, including China. The comprehensive evaluation method for low-carbon construction is still under development. A summary of the literature review is as follows:
- The existing green building evaluation systems mainly relied on qualitative indicators, rather than quantitative indicators, especially when they were used to evaluate the sustainability of the building construction stage.
- Research on the carbon emission evaluation of building foundation construction was still relatively scarce. The relevant research was still limited to specific technologies or foundation types and has not yet formulated a systematic and widely applicable evaluation framework for carbon emission.
- The entropy–TOPSIS method has significant advantages in dealing with the multi-indicator weighting and decision-making problem. It has significant potential in carbon emission evaluation for foundation construction.
- The K-means clustering algorithm was significant for tackling evaluation rating problems. Its advantages included high efficiency, simplicity, mass data processing, outlier detection, and applicability to different fields.
The aim of this study was to establish a quantitative and grade-based carbon evaluation system for foundation construction that is applicable to the sustainable development of the construction industry. The proposed system enables the scientific measurement and evaluation of foundation construction carbon emission, thereby promoting higher standards, stricter requirements, and wider application in the development of green buildings.
The corresponding objectives of this study are as follows:
- To establish a carbon emission calculation model for the foundation construction stage to accurately quantify the actual emission value;
- To determine the carbon emission baseline value via the quota method and thereby obtain the carbon emission performance value by comparing the actual and baseline emission values;
- To formulate a carbon emission evaluation system for foundation construction via the entropy–TOPSIS theory to obtain a comprehensive evaluation index;
- To establish a carbon emission rating system using the K-means clustering method.
3. Method and Model Development
To achieve the above objectives, this study was carried out with the following steps:
- Step 1. Calculate the actual (E) and baseline (E’) carbon emission at each foundation construction phase.
- Step 2. Calculate the carbon emission performance value at each foundation construction phase.
- Step 3. Assign weight (W) to the carbon emission performance of each phase and obtain the comprehensive evaluation index (C) of the foundation construction via the entropy–TOPSIS theory.
- Step 4. Rate the carbon emission performance via the K-means clustering algorithm.
3.1. Actual (E) and Baseline (E’) Carbon Emission
3.1.1. Scope of Carbon Emission Quantification
Before calculating the carbon emission of foundation construction, it is essential to define the system boundary, which stipulates what activities and emission sources should be covered. The foundation type studied in this research was pile foundations, including precast concrete pile foundations and cast-in-place pile foundations. A diagram of the pile foundation construction process is shown in Figure 1. As shown in Figure 1, the scope of carbon emission in this study is circle with a dashed line. The scope of carbon emission included three construction phases, namely on-site and off-site transportation, excavation and earthwork, and pile work. The emission sources of the transportation phase comprised the on-site and off-site transportation activities of building materials and prefabricated components, including direct emission, i.e., fuel combustion of transportation vehicles, and indirect emission, i.e., electricity consumption of electric vehicles. The transportation activities covered the transportation of building material products from the processing plant to the construction site and that of prefabricated components from the prefabrication factory to the construction site. The emission sources of the excavation and earthwork and pile work included the fuel combustion and electricity consumption of construction machinery within the site boundary.
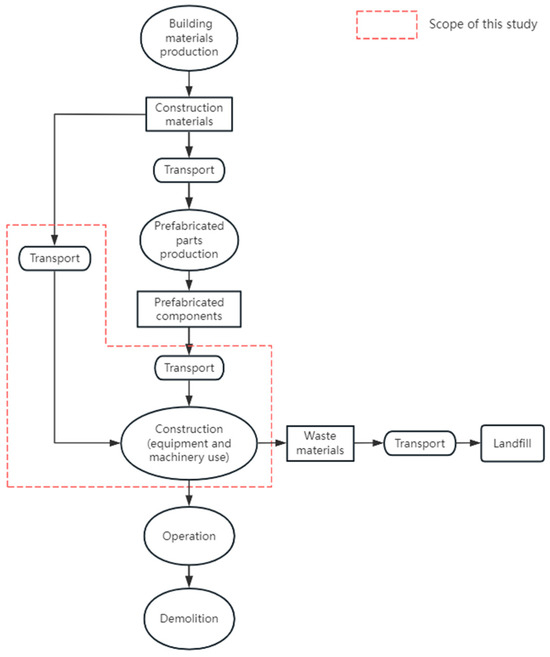
Figure 1.
Diagram of the pile foundation construction process and the scope of this study.
In order to evaluate and compare the carbon emission of different cases in a scientific way, the function unit of carbon emission evaluation in this study was per m2 of the construction area, i.e., kgCO2e/m2.
3.1.2. Carbon Emission Quantification Model—Actual Emission
In this study, the actual construction emission values were calculated according to the national standard GB/T 51366-2019 “Calculation Standard for Building Carbon Emissions” [19]. The carbon emission intensities of the transportation, excavation and earthwork, and pile work were calculated using Equations (1)–(3). The actual activity data involved in the equations were obtained by collecting relevant data and information of the actual construction processes, including site records, on-site surveys, questionnaires collected from contractors, construction organization design plans, construction method statements, drawings, etc.
Quantification model of transportation-phase carbon emission (Et):
where
- is the actual carbon emission intensity of transportation phase, in ;
- is the actual weight of the ith type of building material or prefabricated component, in tons;
- is the actual transportation distance of the ith type of building material or prefabricated component, in km;
- is the carbon emission factor of unit weight transportation distance of the ith type of building material or prefabricated component under actual transportation mode, in ;
- is building construction area as in design drawing, in m2.
Quantification model of excavation-and-earthwork-phase carbon emission (Ee):
where
- is the actual carbon emission intensity of excavation and earthwork phase, in ;
- is the actual quantity of work of the ith item of excavation and earthwork, in m3;
- is the actual number of machine shift of the jth type of machinery for the ith item of excavation and earthwork, in No. of shift per m3;
- is the energy consumption per unit shift of the jth type of machinery, in kg/shift;
- is the carbon emission factor of ith type of energy, in or ;
- is building construction area as in design drawing, in m2.
Quantification model of pile-work-phase carbon emission (Ep):
where
- is the actual carbon emission intensity of pile work phase, in ;
- is the actual quantity of work of the ith item in of the pile work, in m3 or in tons;
- is the actual number of machine shift of the jth type of machinery for the ith item of pile work, in No. of shift per m3;
- is the energy consumption per unit shift of the jth type of machinery, in kg/shift;
- is the carbon emission factor of ith type of energy, in or ;
- is building construction area as in design drawing, in m2.
3.1.3. Carbon Emission Quantification Model—Baseline Emission
In addition to the actual carbon emission, the carbon emission baseline values were calculated to determine the carbon emission performance of each construction phase. Carbon emission baseline values are the benchmark reference values of the carbon emission and represent the average technical level of the construction industry in a region. These values provide a basis for formulating the carbon emission reduction plans and policies. In this study, the carbon emission baseline values were calculated using information provided in construction quotas and bills of quantities. Construction quotas break down construction works into standardized construction processes according to the characteristics of the works and are issued by local governments or construction-related authorities. Thus, construction quotas usually stand for the average resource consumption (in materials, manpower, and machine shifts) that is required to complete one unit of quantity of construction work quantity in a specific region [59]. For example, casting 10 m3 of cast-in-place pile requires 2405 kg of cement, 5328 kg of sand, 2.304 concrete pump shifts, and 2.304 rotary drilling rig shifts; completing 1000 m3 of earthwork requires 3.93 excavator shifts and 6.88 bulldozer shifts. In China, different provinces and cities adopt their own local construction quotas. In this study, the Comprehensive Quota for Housing Construction and Decoration Engineering in Guangdong Province (2018) [60] was adopted for calculating the carbon emission baseline values. The quotas of the different kinds of construction processes listed in the above standard were formulated based on the average levels of the construction techniques and work conditions in Guangdong Province.
The carbon emission baseline values for the three foundation construction phases were calculated according to the following models.
Quantification model of transportation-phase baseline carbon emission (Et’):
where
- is the baseline carbon emission intensity of transportation phase, in ;
- is the weight of the ith type of building material or prefabricated component obtained from construction quota, in tons;
- is the baseline transportation distance of the ith type of building material or prefabricated component, in km;
- is the carbon emission factor of unit weight transportation distance of the ith type of building material or prefabricated component under baseline transportation mode, in ;
- is building construction area as in design drawing, in m2.
Quantification model of excavation-and-earthwork-phase baseline carbon emission (Ee’):
where
- is the baseline carbon emission intensity of excavation and earthwork phase, in ;
- is the quantity of work of the ith item of excavation and earthwork as listed in construction quotas, in m3;
- is the number of machine shift of the jth type of machinery for the ith item of excavation and earthwork as listed in construction quotas, in No. of shift per m3;
- is the energy consumption per unit shift of the jth type of machinery as listed in construction quotas, in kg/shift;
- is the carbon emission factor of ith type of energy, in or ;
- is building construction area as in design drawing, in m2.
Quantification model of pile-work-phase baseline carbon emission (Ep’):
where
- is the baseline carbon emission intensity of pile work phase, in ;
- is the quantity of work of the ith item of pile work as listed in construction quotas, in m3;
- is the number of machine shift of the jth type of machinery for the ith item of pile work as listed in construction quotas, in No. of shift per m3;
- is the energy consumption per unit shift of the jth type of machinery as listed in construction quotas, in kg/shift;
- is the carbon emission factor of ith type of energy, in or ;
- is building construction area as in design drawing, in m2.
3.2. Carbon Emission Performance Value of Foundation Construction (P)
The carbon emission performance value (P) played a crucial role in the carbon emission evaluation of the foundation construction. It defined the carbon emission performances of the different foundation construction phases (transportation, excavation and earthwork, pile work) against the regional average carbon performances. The carbon emission performance value (P) was calculated by comparing the baseline (E’) and actual (E) emission values, as defined in Equation (7). The carbon emission performance values of the three construction phases were denoted as Pt (the transportation phase), Pe (the excavation and earthwork phase), and Pp (the pile work phase). The clear division of these three carbon emission performance values was able to reflect the carbon emission characteristics of each construction phase during the foundation construction. Consequently, the specific carbon reduction measures for each construction phase can be precisely implemented:
where
- P is the carbon emission performance values;
- E’ is the carbon emission baseline values calculated based on local construction quotas;
- E is the actual carbon emission value calculated based on the actual activity data of a specific construction project.
According to Equation (7), P < 1 indicates the carbon emission of a construction phase of a specific foundation construction project is greater than the baseline value, implying that this construction phase has a poor carbon emission performance and needs improvement. In such case, the construction plan, process, and applied techniques need to be reviewed and improved, and proper carbon reduction measures need to be implemented to mitigate the carbon emission. In contrast, P > 1 indicates the carbon emission of a construction phase is less than the baseline value, implying this construction phase performs well in carbon emission control and meets the green construction requirements. This usually indicates that the energy efficiency during the construction process is high, and that the construction activities have achieved good environmental protection results.
3.3. Comprehensive Carbon Emission Evaluation via the Entropy–TOPSIS Method
In the previous step, the carbon emission performance values for transportation (Pt), earthwork construction (Pe), and pile foundation construction (Pp) were determined. In this step, the comprehensive evaluation index (C) integrated the carbon emission performances of the three phases into an indicator to measure the overall carbon emission performance of the entire foundation construction. The comprehensive evaluation index made it possible to evaluate the overall carbon emission intensity of foundation construction cases. However, due to differences in data sources, activity measurement units, construction techniques, environmental conditions, and other factors that affected the carbon emission of the three construction stages, it’s inadequate to evaluate the carbon performance of the whole foundation construction process by simply summing up the emission performance values of the three phases. Therefore, different weights needed to be assigned to the carbon emission performances at different phases to reflect their relative importance in the comprehensive evaluation. The purpose of assigning weights was to ensure that the carbon emission performance of each construction phase contributes to the overall comprehensive evaluation based on its actual impacts to achieve more objective and accurate evaluation results. Thus, there are two tasks in this section: assigning weights to the three performance values (Pt, Pe, Pp) based on the entropy theory, and determining the comprehensive evaluation index (C) through the TOPSIS method.
The comprehensive evaluation index (C) can not only be used to clarify the advantages and disadvantages of the carbon emission performance of each construction case, but also provides an objective basis for carbon emission management during the construction process. Based on this evaluation index, the carbon emission performances of different foundation construction cases can be then ranked through the K-means method, thereby providing decision support for improving the construction technology and carbon emission efficiency.
The detail steps for obtaining the comprehensive evaluation index (C) through the entropy–TOPSIS method are as follows:
- Step 1. Establish the initial matrix.
The carbon emission performance values (P) of each phase of the foundation construction cases were used as the raw data and an initial matrix was established, as illustrated in Equation (8). We assumed that there were m number of evaluation objects (i.e., different foundation construction cases) and n number of indicators of each evaluation object. In this study, there were three indicators for each foundation construction case, i.e., the carbon emission performances of the three construction phases of each case.
where
- X is the carbon emission performance values (P);
- i is the ith evaluation object (i = 1, 2, 3, … m);
- j is the jth indicator of the ith evaluation object, (j = 1, 2, 3, … n).
- Step 2. Normalize the raw data and set the positive indicators
To avoid the influence of different indicator dimensions on the evaluation results, the three carbon emission performance values (P) of each case should be normalized. This study adopted the min-max normalization to convert all data into 0–1 interval via Equation (9).
where
- is the standardized value of the carbon emission performance values (P);
- is the maximum carbon emission performance values (P);
- is the minimum carbon emission performance values (P).
- Step 3. Calculate the weights (W) of indicators
In this step, the weighting matrix of the carbon emission performance values and their entropy values () were calculated using Equations (10) and (11), respectively. Based on the entropy values of the indicators, their weights (W) were determined using Equation (12).
where
- is the weighting matrix of the normalized carbon emission performance values (P);
- is the entropy value of each indicator;
- is the weights of each indicator.
- Step 4. Calculate the positive and negative ideal solutions
Based on the normalized raw data matrix in Step 1 and the indicator weights calculated in Step 3, the standardized decision matrix was illustrated, as in Equation (13). Next, the optimal solution (positive ideal solution) and worst solution (negative ideal solution) of the dataset were determined using Equations (14) and (15), respectively.
where
- V is the standardized decision matrix with weighted evaluation objects;
- is the weighted evaluation objects;
- is the positive ideal solution of the data set;
- is the negative ideal solution of the data set.
- Step 5. Calculate the distance between each object and the positive/negative ideal solutions
Then, the distance (i.e., relative proximity) between each evaluation object and the positive/negative ideal solution was calculated using Equations (16) and (17).
where
- is the distance between each evaluation indicator and the positive ideal solution;
- is the distance between each evaluation indicator and the negative ideal solution.
- Step 6. Obtain the comprehensive evaluation index of each evaluation object
The comprehensive evaluation index () of each evaluation object is the closeness of the evaluation object to the optimal solution and is obtained via Equation (18). The greater the value of the , the more superior the evaluation object.
where
- is the comprehensive evaluation index.
3.4. Classifying the Carbon Emission Performance via the K-Means Theory
To establish a scientific carbon emission rating system, it was necessary to rate the comprehensive evaluation index calculated in the previous section. In this step, the K-means clustering algorithm was used to classify the carbon emission performances of the foundation construction cases. The procedure of the K-means clustering algorithm is as follows.
- Step 1. Use the elbow method to continuously change and determine the number of clusters, K.
- Step 2. Randomly select K number of initial centroids of data, i.e., the comprehensive evaluation index matrix (Ci).
- Step 3. Use the Euclidean distance as the similarity criterion, calculate the sum of squares to each centroid, and calculate the distance between each data point and the initial centroids using Equation (19).
- is the distance between each datum and the initial centroids;
- is the comprehensive evaluation index of the relative proximity of the i-th plan;
- is the comprehensive evaluation index of the k-th centroid.
- Step 4. Group the data according to the distance to a certain centroid. If a data point is closest to a certain centroid, then it belongs to that cluster.
- Step 5. Search for new centroids based on the average distance of each cluster.
- Step 6. Repeat Step 3 to calculate the distance between the data points to the newly selected centroids. Then, repeat Steps 4 and 5 until no data points are newly assigned to a cluster.
4. Case Study
In this study, we selected the foundation construction of 19 residential buildings in the infrastructure construction project of an economic industrial parks in Guangzhou as an example. The construction area of each case study building ranged from 765.68 to 1372.39 m2; each building was 13 to 14 stories high. These buildings were all prefabricated reinforced concrete structure with frame structure and shear wall structure. Their foundation types were precast concrete pipe pile and cast-in-place pile foundations. The main contractor of this infrastructure construction project was China Construction First Group Corporation Limited. The form of contract was engineering, procurement and construction (EPC) contract. The construction period of the entire project was from September 2022 to August 2025, and the foundation construction started from February 2023. All data used in this study were collected during February 2023 to May 2024.
4.1. Quantifying the Carbon Emission of Foundation Construction
4.1.1. Transportation-Phase Carbon Emission
As stated in the Method and Model Development Section, the actual and baseline carbon emission of transportation were calculated using Equations (1) and (4), respectively. Building Case 1 was taken as example to demonstrate the quantification of carbon emission.
Actual Transportation Phase Carbon Emission
The transportation carbon emission comprised the transportation of both building materials and prefabricated components. In this case study, three key foundation construction materials, namely sand and gravel, concrete, and steel, and two types of prefabricated components, namely prestressed concrete pipe piles and steel pipe piles were considered. Taking building Case 1 as an example, all relevant activity data and emission factors are listed in Table 1. The actual activity data of transportation phase were collected through site visits and interviews with the contractor. The emission factors of different transportation modes were adopted from GB/T 51366-2019 “Standard for Building Carbon Emission Calculation” [19], which was widely used in many relevant studies.

Table 1.
Activity data and actual carbon emission of material and prefabricated component transportation (Case 1).
The carbon quantification results indicated that the carbon emission generated from the transportation of steel and prestressed concrete pipe piles were 4642.53 kgCO2e and 3874.54 kgCO2e, respectively, the highest among all the materials and components. This was due to the long transportation distance and large consumption quantity of these two materials/components. The overall carbon emission during the transportation phase of Case 1 was 12,576.90 kgCO2e. According to Equation (1), the carbon emission intensity of the actual transportation was 9.55 kgCO2e/m2 given the construction area of Case 1 building equaling to 1316.47 m2.
Baseline Carbon Emission of the Transportation Phase
Building Case 1 was taken as example to demonstrate the quantification of transportation phase carbon emission of baseline condition. All relevant activity data and emission factors are listed in Table 2. In the baseline condition, it was assumed that all the transportation modes were road transportation. The transportation vehicles were the same as they were in actual situations. However, different from the actual transportation situation, in the baseline condition, the transportation vehicles were assumed to operate at full load in each journey and the carbon emission of the return journey were ignored. Regarding the prefabricated components used in the baseline condition, their transportation was arranged according to the layout plan, and the baseline transportation distance was assumed to be 40 km. As in the actual condition, the emission factors of different transportation modes were also adopted from GB/T 51366-2019 “Standard for Building Carbon Emission Calculation” [19].
Table 2.
Activity data and baseline carbon emission of material and prefabricated component transportation (Case 1).
In the baseline condition, the carbon emission of transportation of steel and prestressed concrete pipe piles ranked first and second, generating 5902.28 kgCO2e and 4504.10 kgCO2e carbon emission, respectively. The overall baseline carbon emission of the transportation phase of the foundation construction was 14,472.76 kgCO2e. According to Equation (4), the carbon emission intensity of the baseline transportation was 10.99 kgCO2e/m2, given the construction area of Case 1 building equaling to 1316.47 m2.
4.1.2. Excavation-and-Earthwork-Phase Carbon Emission
The actual and baseline carbon emission of the excavation and earthwork were calculated using Equations (2) and (5), respectively. Building Case 1 was taken as an example to demonstrate the quantification of carbon emission.
Actual Excavation-and-Earthwork-Phase Carbon Emission
The carbon emission of the excavation and earthwork phase was mainly generated from operation of construction machinery which was powered by three types of energy, namely diesel oil, gasoline and grid electricity. The relevant activity data of Case 1 and emission factors are shown in Table 3. The actual activity data, including the data of the actual quantity of work, energy consumption, machinery shifts, and soil transportation, were collected from site records, on-site investigations, etc. The emission factors of diesel oil (3.10 kgCO2e/kg) and gasoline (2.93 kgCO2e/kg) were adopted from the GB/T 51366-2019 “Standard for Building Carbon Emission Calculation” [19]. The emission factor of grid electricity (0.43 kgCO2e/kWh) was extracted from the lasted public announcement released by the Ministry of Ecology and Environment and the National Bureau of Statistics [61].
Table 3.
Activity data and actual carbon emission of excavation and earthwork (Case 1).
As shown in Table 3, the actual total carbon emission of the excavation and earthwork of Case 1 was 30,412.98 kgCO2e, with an overall carbon emission intensity of 23.10 kgCO2e/m2, as calculated according to Equation (2). The calculation results also indicated that dump trucks accounted for 58.67% of the total emission which was the most important construction machinery in this construction phase. The crawler single-bucket hydraulic excavators were the second most used machinery in this construction phase, accounting for 29.91% of the total carbon emission.
Baseline Carbon Emission of the Excavation and Earthwork Phase
In the baseline carbon emission calculation, the necessary data required in Equation (5), i.e., type of machinery, number of operation shifts, and type of energy, were extracted from the Comprehensive Quota for Housing Construction and Decoration Engineering in Guangdong Province (2018) [60]. The relevant activity data of Case 1 and the emission factors used in this construction phase are listed in Table 4. As in the actual condition, the emission factor of diesel oil was adopted from the GB/T 51366-2019 “Standard for Building Carbon Emission Calculation” [19], and the emission factor of grid electricity was extracted from the public announcement released by the Ministry of Ecology and Environment and the National Bureau of Statistics [61].
Table 4.
Activity data and baseline carbon emission of excavation and earthwork (Case 1).
As shown in Table 4, the baseline emission of the excavation and earthwork of Case 1 was 55,689.23 kgCO2e, with an emission intensity of 42.30 kgCO2e/m2, as calculated according to Equation (5). The dump trucks, shovel excavators, and crawler single-bucket hydraulic excavators were the machinery with the highest carbon emission in this construction phase. This was because they had more working shifts than the other machines and equipment, accounting for 60.62%, 17.81%, and 13.16% of the total emission, respectively. Moreover, dump trucks and crawler single-bucket hydraulic excavators had larger unit energy consumption than the other machinery, leading to higher carbon emission.
4.1.3. Pile-Work-Phase Carbon Emission
The actual and baseline carbon emission of the pile work was calculated using Equations (3) and (6), respectively. Building Case 1 was taken as example to demonstrate the quantification of carbon emission.
Actual Carbon Emission of the Pile Work Phase
The carbon emission of the pile work phase was mainly generated from machinery operations. The actual activity data, including data on the actual quantity of work, energy consumption, machinery shifts, and waste transportation, were collected from site records and on-site investigations. The activity data of Case 1 and emission factors used in this phase are shown in Table 5. The emission factor of diesel oil was adopted from the GB/T 51366-2019 “Standard for Building Carbon Emission Calculation” [19], and the emission factor of grid electricity was extracted from the public announcement released by the Ministry of Ecology and Environment and the National Bureau of Statistics [61].
Table 5.
Activity data and actual carbon emission of pile work (Case 1).
As shown in Table 5, the actual carbon emission of the pile work phase of Case 1 was 20,980.83 kgCO2e, with an emission intensity of 15.94 kgCO2e/m2, as calculated according to Equation (3). It indicated that in actual construction, the operation of crawler single-bucket hydraulic excavators generated 6151.55 kgCO2e carbon emission, accounting for 29.32% of the total emission and ranking the first, followed by rotary excavators (4770.22 kgCO2e, 22.74%) and static pile presses (4202.82 kgCO2e, 20.03%).
Baseline Carbon Emission of Pile Work Phase
In the baseline carbon emission calculation of Case 1, the activity data required in Equation (6), i.e., type of machinery, number of operation shifts, and type of energy, were extracted from the Comprehensive Quota for Housing Construction and Decoration Engineering in Guangdong Province (2018) [60]. The activity data and emission factors of this phase are listed in Table 6. The emission factors of diesel oil and gasoline were adopted from the GB/T 51366-2019 “Standard for Building Carbon Emission Calculation” [19], and the emission factor of grid electricity was extracted from the public announcement released by the Ministry of Ecology and Environment and the National Bureau of Statistics [61].
Table 6.
Activity data and baseline carbon emission of pile work (Case 1).
As shown in Table 6, the baseline carbon emission of the pile work phase of Case 1 was 24,191.34 kgCO2e, with an emission intensity of 18.38 kg kgCO2e/m2, as calculated according to Equation (6). It indicated that the operation of static pile drivers generated 7474.73 kgCO2e carbon emission, accounting for 30.90% of the total emission and ranking the first, followed by crawler rotary drilling rigs (4294.31 kgCO2e, 17.75%) and AC arc welding machines (3268.80 kgCO2e, 13.51%).
Similar to Case 1, the actual and baseline carbon emission intensities of the remaining 18 cases were calculated and are shown in Table 7.
Table 7.
Actual (E) and baseline (E’) carbon emission intensity of 19 cases.
4.2. Calculating the Carbon Emission Performance Values (P) of Different Phases
Based on the above quantification of the actual and baseline carbon emission intensities of the three construction phases of the 19 cases, the carbon emission performance values (P) were obtained using Equation (7), and the results are listed in Table 8. It is shown that the maximum carbon performance value was Pe = 1.918 for Case 11, which means that the excavation and earthwork emission of this case performed the best out of all the cases. The minimum carbon performance value was Pp = 0.479 for Case 4, which means that the pile work emission of this case performed the worst out of all the cases.
Table 8.
Carbon emission performance values (P) of three phases of 19 cases.
4.3. Comprehensive Evaluation of Carbon Emission via the Entropy–TOPSIS Method
In this step, the comprehensive evaluation of the carbon emission of each foundation construction case was conducted using the entropy–TOPSIS method. Based on Equations (8) and (9), the normalized matrix of the carbon emission performance values (P) of 19 cases was obtained. In this study, the evaluation indicators were the carbon emission performances of three phases, i.e., Pt, Pe, and Pp. Their entropy values (e) and weights (W) were determined using Equations (11) and (12), listed in Table 9.
Table 9.
Entropy values (e) and weights (W) of the three indicators.
Next, the positive and negative ideal solutions of the emission performance values were calculated using Equations (14) and (15), respectively. Then, the distances between each indicator and the positive/negative ideal solutions were calculated using Equations (16) and (17), respectively. The calculation results are visualized in Figure 2; the detailed figures of the distances between indicator and the positive/negative ideal solutions are presented in the Appendix A, Table A1.
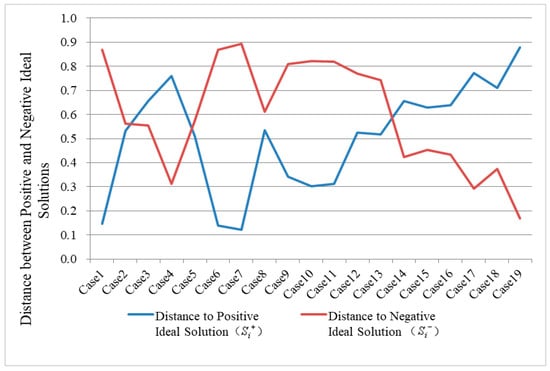
Figure 2.
Distances between the positive and negative ideal solutions of 19 cases.
The and values represent the distance between the evaluation object (i.e., the carbon emission performance value) and the optimal and worst solutions, respectively. The greater the value of an evaluation object, the greater the distance between it and the optimal solution. In contrast, the greater the value of the evaluation object, the greater the distance between it and the worst solution. Therefore, the evaluation object with a smaller value and greater value is the better one, i.e., it has a better carbon emission performance. According to Figure 2, the difference in and for Case 7 was the greatest among all the cases, i.e., = 0.122 and = 0.893, indicating that Case 7 performed the best in terms of carbon emission. In contrast, Case 19 performed the worst, with = 0.880, = 0.170, indicating that Case 19 performed the worst in terms of carbon emission.
Based on the above principle, the comprehensive evaluation indices (C) of the 19 cases were obtained using Equation (18) and visualized in Figure 3. The values of C were between 0 and 1. The greater the C value, the better the carbon emission performance, and vice versa. The comprehensive evaluation index (C) was used to clarify the advantages and disadvantages of the carbon emission performance of each construction case. According to Figure 3, Case 7 had the greatest C value (C7 = 0.880), indicating that its overall carbon performance was better than the other cases. In contrast, Case 19 had the smallest C value (C9 = 0.162), indicating that its overall carbon emission performance was worse than the other cases and therefore needed improvement in its construction techniques, organization, and carbon management. The C values of 11 cases were greater than 0.5, while most cases (i.e., 14 cases) had C values between 0.25 and 0.75, accounting for 73.68% of the total 19 cases.
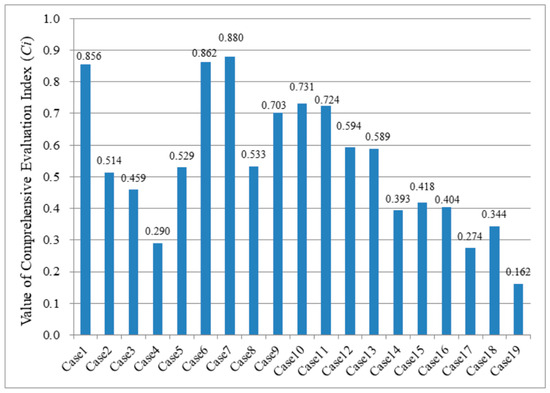
Figure 3.
Comprehensive evaluation indices (C) of 19 construction cases.
4.4. Classifying Carbon Emission Performance via the K-Means Theory
In the previous step, the comprehensive carbon performance of each case was evaluated. In this step, all the cases were grouped according to their comprehensive evaluation indices (C) to formulate a scientific carbon emission rating system.
In the K-means clustering algorithm, the K value is the number of clusters, which, in this study, was the tiers of the proposed rating system. The K value was determined via the elbow method, and the results are illustrated in Figure 4. The curve in Figure 4 represents the loss function of the K-means clustering; the horizontal axis is the number of clusters (K), and the vertical axis is the loss of clustering. The loss is the sum of the squared distances from all the samples to the centroids of their clusters, also known as the sum of squared errors. The smaller the loss value, the better the clustering effect. The optimal number of clusters can be determined by observing the curve where the slope tends to be flat. According to the loss curve in Figure 4, when K < 4, the loss value was high, and increasing the K value significantly reduced the loss; when K = 4, the rate of the loss reduction significantly slowed down, which indicates that the K had reached the optimal value. Moreover, according to previous research, a lot of environmental rating systems and tools adopt a four- or five-tier rating structure. Therefore, in this study, the four-tier rating system was adopted. The four-tier rating system classified the carbon performances into four levels: Excellent, Good, Average, and Poor.
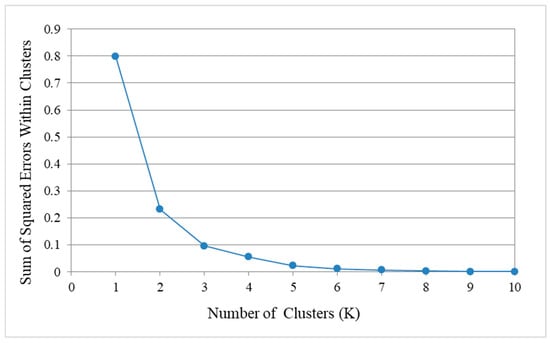
Figure 4.
Number of clusters and corresponding loss.
Based on the K-means clustering method, the centroids of the four clusters and the data points (the comprehensive evaluation index (C)) belonging to each cluster were determined via trial and error. The clustering results are listed in Table 10 and visualized in Figure 5. The “Excellent” cluster consisted of construction cases with comprehensive evaluation indices (C) greater than 0.7. Out of the 19 foundation construction cases, 6 obtained the “Excellent” grade, with an interval of the emission comprehensive evaluation index (C) between 0.712 and 0.874. Five cases (26.32%) were classified as “Good” and five cases (26.32%) were classified as “Fair”, with C value intervals of 0.515–0.589 and 0.363–0.445, respectively. Most cases were assigned to the “Excellent” and “Good” clusters. Three cases (i.e., 15.79% of the total cases) were classified as “Poor”, performing approximately 85% worse on average. The variances (the sixth column of Table 10) of all four clusters were smaller than 0.006, indicating that the clustering result was sufficiently sound.
Table 10.
Clusters of the carbon performance rating system.
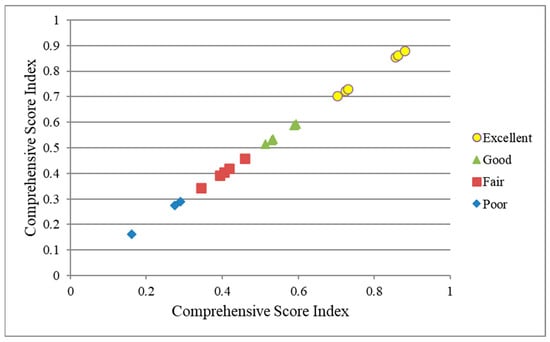
Figure 5.
Four-tier carbon emission rating system based on the K-means clustering algorithm.
5. Discussion
5.1. Carbon Emission Hotspots
The actual carbon emission proportion of each construction phase of the 19 cases are visualized in Figure 6 in the form of stacked bar chart, to provide a better understanding of their carbon emission impacts. Detailed figures of the proportions can be found in the Appendix A, Table A2.
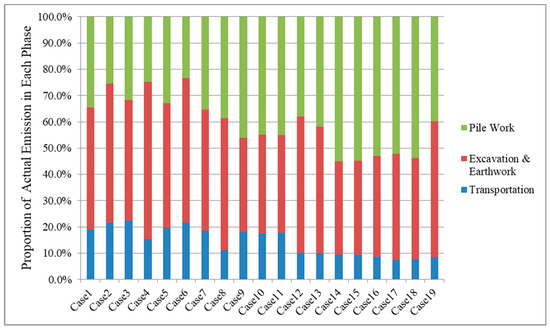
Figure 6.
Stacked bar chart of the actual carbon emission proportions of three construction phases in the 19 cases.
The average proportions of the actual carbon emission for the transportation, excavation and earthwork, and pile work phases of the 19 cases were 14.42%, 44.98%, and 40.60%, respectively. As can be seen in Figure 6, although the emission proportions of each construction phase were different from case to case, the excavation and earthwork and pile work phases emitted significantly more carbon than the transportation phase. Therefore, the carbon reduction strategy should focus on these phases.
To better identify the emission sources and formulate tailor-made carbon reduction measures, the construction activities of the three phases were further broken down, as detailed in Table 11. As shown in Table 11, the top five activities in terms of the total carbon emission were the operations of the following: dump trucks in the excavation and earthwork phase (375,769 kgCO2e); crawler single-bucket hydraulic excavators in the excavation and earthwork phase (191,547 kgCO2e); crawler single-bucket hydraulic excavators in the pile work phase (175,978 kgCO2e); rotary excavators in the pile work phase (136,462 kgCO2e); and static pile presses in the pile work phase (126,717 kgCO2e). They accounted for 26.23%, 13.37%, 12.28%, 9.52%, and 8.84% of the total carbon emission of all the activities in the 19 foundation construction cases, respectively. The sum of the carbon emission of these five activities accounted for 70.25% of the total emission. Therefore, they should be targeted first when planning and implementing energy-saving and carbon reduction measures. There are various methods to reduce the carbon emission of construction, such as replacing traditional fuels with clean fuels (bio-diesel, electric vehicles, etc.), optimizing the construction organization design to reduce the number of machinery shifts, adopting new construction techniques (e.g., 3D printing [62]), and using recyclable construction materials (e.g., recycling engineering muck [63]). However, carbon reduction strategies are beyond the scope of this study and are a topic for future research.
Table 11.
Breakdown of actual carbon emission according to construction activities.
5.2. Impact of Assigning Weights to Different Construction Phases
A majority of green building evaluation systems evaluate and rate the carbon emission directly according to the value of the total carbon emission or average unit carbon emission. However, in this study, we innovatively divided the foundation construction carbon emission into three phases and assigned weights to them based on the entropy theory. Moreover, the rating system proposed in this study was based on comprehensive carbon emission indices rather than absolute carbon emission amounts. It considered factors including different construction techniques, emission reduction priorities, emission reduction potentials of the different construction phases, which is a more scientific and reliable approach than those of traditional rating systems.
Table 12 demonstrates the significantly different results obtained in the carbon performance rating using the traditional rating system compared to those obtained using the proposed rating system. One can tell that, in the traditional rating system, the carbon emission performances of the 19 cases were ranked according to the unit carbon emission per construction area. It is shown that in traditional rating system, Case 4 ranked 10th, with carbon emission intensity of 57.79 kgCO2e/m2; however, it ranked 17th with the proposed rating system, which indicates a “Poor” carbon performance. This is because Case 4 had a higher Ee (a poor carbon emission performance in the excavation and earthwork phase), but unfortunately Ee had a higher weight than those of the other two phases. As indicated in Table 9, the weight of the carbon emission of the excavation and earthwork phase (We = 42.36%) was 1.23 times that of the transportation phase (Wt = 27.66%) and 1.41 times that of the pile work phase (Wp = 29.99%). Therefore, although the absolute value of the Case 4 carbon emission intensity was not large (i.e., ranking 10th), its comprehensive evaluation index was relatively small (C7 = 0.29), ranking 17th out of the 19 cases. It can be concluded that the weights of carbon emission in the three construction phases had a significant impact on the evaluation and rating results.
Table 12.
Carbon emission performance ratings of 19 cases by actual carbon emission intensity and comprehensive evaluation index.
To better understand the two rankings’ correlation and critically compare the two ranking methods, several metrics were employed to check the ranking differences and similarity between them. These metrics include two traditional metrics that assess the similarity and degree of interdependence between different ordered datasets, namely Spearman’s rank coefficient of correlation [64] and Kendall rank correlation coefficient [65]. The Spearman’s coefficient ranges between −1 and +1. The value of +1 indicates a perfect positive correlation between the rankings, implying the two rankings are identical. In contrast, the value of −1 indicates the two rankings are completely negative correlated, implying opposing ranks assigned by the two methods. If the Spearman’s coefficient equals to 0, it means no correlation between the two rankings. The results of Kendall coefficient apply the same rule as Spearman’s coefficient. Apart from the two traditional metrics, a relatively new metrics introduced by Sałabun and Urbaniak [66] was also used to check the correlation between the two rankings as it overcomes the deficiency of the traditional ones. The WS ranges from 0 to 1. If the WS of two rankings is smaller than 0.234, they have low ranking similarity; if the WS is greater than 0.808, they have high similarity; if the WS is between 0.352 and 0.689, the two rankings have a medium level of similarity [66]. The Spearman’s coefficient, Kendall coefficient, and WS can be obtained from Equations (20), (21), and (22), respectively.
where
- is the Spearman’s rank coefficient of correlation;
- is the difference between the ranks;
- is the number of elements in the ranking.
- is the Kendall rank correlation coefficient;
- is the number of compatible pairs;
- is the number of non-compliant pairs;
- is the number of elements in the ranking.
- WS is the Wojciech Sałabun coefficient of rankings similarity;
- is the place in the ranking for the i-th element in respectively ranking x;
- is the place in the ranking for the i-th element in respectively ranking y;
- is the number of elements in the ranking.
The Spearman’s coefficient, Kendall coefficient, and WS of the two rankings were 0.356, 0.560, and 0.537, respectively. All of the three similarity coefficients indicated the two rankings had a medium level of positive similarity. This meant that there was a certain degree of consistency in the rating order between the two rating systems, but there were also significant differences. The three similarity coefficients had good consistency in this case.
5.3. Significance of Baseline Carbon Emission
As shown in Figure 7, the average actual carbon emission of the 19 cases was 8.96 kgCO2e/m2 (14.42%) in the transportation phase, 31.58 kgCO2e/m2 (44.98%) in the excavation and earthwork phase, and 30.58 kgCO2e/m2 (40.60%) in the pile work phase, while the average baseline carbon emission of the 19 cases was 8.73 kgCO2e/m2 (12.04%) in the transportation phase, 37.193 kgCO2e/m2 (52.27%) in the excavation and earthwork phase, and 28.27 kgCO2e/m2 (35.68%) in the pile work phase. A comparison of the two results indicated that there was difference between the actual measured carbon emission calculated according to actual activity data and the baseline carbon emission calculated using construction quotas. Based on this difference, the emission performance values and comprehensive indices of the 19 cases were obtained.
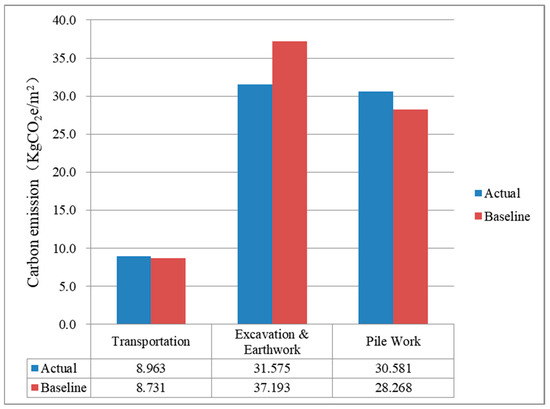
Figure 7.
Comparison of actual and baseline carbon emission of three foundation construction phases.
According to Figure 7, the average actual carbon emission of the transportation and pile work phases of the 19 cases was both higher than their baseline values, indicating that the average carbon performances of these 19 cases in these two phases were slightly worse than the average level in Guangdong Province. In contrast, the average actual carbon emission of the excavation and earthwork phase of the 19 cases was lower than the baseline value, indicating that the average carbon performance of this construction phase of the 19 cases was better than the average construction level in Guangdong Province.
Many previous studies have proposed different ways to determine the baseline values of energy consumption or carbon emission. In some studies, the baseline was obtained based on collections of large amounts of local actual data. However, this method is inadvisable to be used to determine the baseline for each case, as the cases are characterized by different types of pile foundations and construction environments. The method proposed in this study can be used to quantify the machinery energy consumption based on the actual quantity of work and the corresponding construction quota, and then determine the carbon emission baseline value. The proposed approach has sound universality and can be applied to various types of foundation construction projects, and even to other construction processes. Besides, for the rapidly developing regions and countries, such as South Asia and Africa, carbon emission database or benchmarks of construction sectors has not yet been established due to lack of regional and organizational statistical data. The proposed evaluation method has great potential to be applied in this regions and countries, as the stakeholders, e.g., the contractors, can build their own emission baseline for each construction project.
6. Conclusions and Future Research
In this paper, a scientific and universally applicable carbon emission evaluation method and rating system for foundation construction was proposed. In the method proposed in this study, the foundation construction carbon emission was divided into three phases, and the ratio of the baseline and actual carbon emission of each phase (transportation, excavation and earthwork, pile work) was used as the evaluation indicator. Then, weights were assigned to each indicator via entropy theory, and the carbon performances of the foundation construction cases were evaluated via the TOPSIS method. Finally, the K-means method was used to rate the carbon evaluation results of the construction cases into different rating levels. The proposed evaluation and rating method were verified through a case study of 19 residential buildings in Guangzhou. The following conclusions can be drawn from this study:
- (1)
- The average proportions of the actual carbon emission of the 19 cases during the transportation, excavation and earthwork, and pile work phases were 14.42%, 44.98%, and 40.60%, respectively. It indicated excavation and earthwork phase emitted the greatest amount of carbon.
- (2)
- The top five activities generating the highest carbon emission accounted for 70.25% of the total carbon emission. Therefore, they were the emission hotspots that require proper carbon reduction measures.
- (3)
- The carbon emission performance values of the 19 cases ranged from 0.479 to 1.918, indicating that their carbon emission performances varied significantly and hence required different carbon management strategies.
- (4)
- The weights of the three foundation construction phases were Wt = 27.66%, We = 42.36%, and Wp = 29.99%, respectively. It indicates the carbon emission of the excavation and earthwork phase had the greatest impact on the final evaluation results.
- (5)
- The 19 cases were classified into four carbon emission levels. Six cases were rated “Excellent”, accounting for 31.58% of all cases; five cases were rated “Good”, accounting for 26.32%; five cases were rated “Fair”, accounting for 26.32%; and three cases were rated “Poor”, accounting for 15.79%.
- (6)
- The results indicated that the proposed method can be used to scientifically evaluate and rate the carbon emission performance of the foundation construction process.
The contributions and significance of this study lies in two aspects. First, this study evaluated the carbon performance against the baseline values calculated based on the local construction quota, which reflected the local construction sector average level. Therefore, the proposed evaluate system is expected to assist the building contractors in revealing their emission performance against the local average emission level without establishing a carbon emission database. It is also able to help the contractors to identify the emission hotspots of construction process and formulating specific carbon reduction measures. Secondly, the study divided the foundation construction emission into three phases, and then weighted and evaluated them separately, considering that the different construction phases have different emission characteristics and emission reduction difficulties. As a result, the proposed method can provide a objective and scientific way of carbon evaluation. In conclusion, the proposed evaluation system has significant potential for practical applications in the construction industry and help contractors, governments (policymakers) and building regulatory departments initiate effective carbon reduction strategies, incentive and penalty measures, and regulations to achieve construction sustainability.
This study also provides potential directions for future research. In future research, this evaluation method should be tested using a larger scale of case study and broader databases to further validate its rationality and effectiveness. In additional, the spectrum of building types in this study should be extended to include more building types and sizes, including office buildings, hospitals, and schools. Besides, the study should be extended to incorporate modern multi-criteria decision making methods such as SITW, RANCOM, ESP-COMET and etc. Moreover, carbon reduction measures and the reduction potentials of these measures should be further studied based on the evaluation results of this study.
Author Contributions
Conceptualization, Y.C., Y.F. and G.H.; methodology, Y.C., Y.F. and G.H.; data collection and extraction, G.H. and X.W.; data analysis, G.H. and Y.C.; writing—original draft preparation, Y.C. and G.H.; writing—review and editing, Y.C.; graphic editing and formatting, G.H. and X.W.; data curation, D.L. All authors have read and agreed to the published version of the manuscript.
Funding
This research received no external funding.
Institutional Review Board Statement
Not applicable.
Informed Consent Statement
Not applicable.
Data Availability Statement
Some or all data, models, or code that support the findings of this study are available from the corresponding author upon reasonable request.
Acknowledgments
Appreciation is given to the faculty staff of the School of Civil and Transportation Engineering, Guangdong University of Technology for their administrative and technical supports. Appreciation is also given to the Guangzhou Airport Construction & Investment Group Co., Ltd. for their support and data provision to this study.
Conflicts of Interest
Author Dongxu Li was employed by the company Guangzhou Airport Construction & Investment Group Co., Ltd. The remaining authors declare that the research was conducted in the absence of any commercial or financial relationships that could be construed as a potential conflict of interest.
Appendix A
Table A1.
Calculation results of the distance to the positive and negative ideal solution, and comprehensive evaluation index via the entropy–TOPSIS method.
Table A1.
Calculation results of the distance to the positive and negative ideal solution, and comprehensive evaluation index via the entropy–TOPSIS method.
| Case | Distance to the Positive Ideal Solution () | Distance to the Negative Ideal Solution () | Comprehensive Evaluation Index (Ci) |
|---|---|---|---|
| Case 1 | 0.146 | 0.868 | 0.856 |
| Case 2 | 0.532 | 0.562 | 0.514 |
| Case 3 | 0.656 | 0.556 | 0.459 |
| Case 4 | 0.759 | 0.311 | 0.290 |
| Case 5 | 0.510 | 0.573 | 0.529 |
| Case 6 | 0.139 | 0.868 | 0.862 |
| Case 7 | 0.122 | 0.893 | 0.880 |
| Case 8 | 0.535 | 0.611 | 0.533 |
| Case 9 | 0.341 | 0.808 | 0.703 |
| Case 10 | 0.303 | 0.822 | 0.731 |
| Case 11 | 0.313 | 0.820 | 0.724 |
| Case 12 | 0.526 | 0.769 | 0.594 |
| Case 13 | 0.517 | 0.742 | 0.589 |
| Case 14 | 0.655 | 0.425 | 0.393 |
| Case 15 | 0.629 | 0.452 | 0.418 |
| Case 16 | 0.637 | 0.433 | 0.404 |
| Case 17 | 0.772 | 0.292 | 0.274 |
| Case 18 | 0.711 | 0.373 | 0.344 |
| Case 19 | 0.880 | 0.170 | 0.162 |
Table A2.
Proportion of the actual carbon emission of each construction phase in 19 cases.
Table A2.
Proportion of the actual carbon emission of each construction phase in 19 cases.
| Case | Total Carbon Emission (kgCO2e) | Transportation | Excavation and Earthwork | Pile Work |
|---|---|---|---|---|
| Case 1 | 63,970.72 | 19.66% | 47.54% | 32.80% |
| Case 2 | 40,438.6 | 21.73% | 52.88% | 25.39% |
| Case 3 | 34,698.71 | 22.37% | 45.87% | 31.75% |
| Case 4 | 54,829.45 | 15.42% | 59.74% | 24.84% |
| Case 5 | 43,367.29 | 21.59% | 55.02% | 23.39% |
| Case 6 | 66,743.64 | 18.96% | 46.61% | 34.43% |
| Case 7 | 68,415.89 | 18.50% | 46.14% | 35.36% |
| Case 8 | 106,670.7 | 11.18% | 50.16% | 38.66% |
| Case 9 | 47,686.7 | 18.19% | 35.71% | 46.10% |
| Case 10 | 43,809.85 | 17.67% | 37.38% | 44.94% |
| Case 11 | 43,600.63 | 17.79% | 37.23% | 44.98% |
| Case 12 | 117,693.3 | 10.03% | 51.93% | 38.05% |
| Case 13 | 130,257.6 | 9.85% | 48.37% | 41.77% |
| Case 14 | 79,026.41 | 9.54% | 35.41% | 55.05% |
| Case 15 | 82,592.66 | 9.37% | 35.77% | 54.86% |
| Case 16 | 102,763.7 | 8.59% | 38.34% | 53.07% |
| Case 17 | 112,013.4 | 7.41% | 40.38% | 52.21% |
| Case 18 | 123,274.2 | 7.61% | 38.50% | 53.89% |
| Case 19 | 70,820.97 | 8.47% | 51.67% | 39.87% |
| Average: | 14.42% | 44.98% | 40.60% |
References
- 2021 Global Status Report for Buildings and Construction. Available online: https://www.unep.org/zh-hans/resources/baogao/2021quanqiujianzhuhejianzaoyezhuangkuangbaogao (accessed on 19 October 2024).
- China Association of Building Energy Efficiency. China Building Energy Conservation Association. Research report on China building energy consumption and carbon emissions (2023). Constr. Archit. 2024, 2, 46–59. (In Chinese) [Google Scholar]
- Wang, S.; Guo, Y.; Zhang, H.; Gao, M. A Life-Cycle Carbon Emissions Evaluation Model for Traditional Residential Houses: Applying to Traditional Dong Dwellings in Qandongnan, Guizhou Province, China. Sustainability 2023, 15, 13468. [Google Scholar] [CrossRef]
- Liu, K.; Leng, J. Quantified CO2-Related Indicators for Green Building Rating Systems in China: Comparative Study with Japan and Taiwan. Indoor Built Environ. 2021, 30, 763–776. [Google Scholar] [CrossRef]
- Wang, K.; Ma, Y. Research on Green Building Evaluation System based on Building Carbon Emission Analysis. Energy Conserv. 2021, 40, 75–77. (In Chinese) [Google Scholar]
- Liu, K.; Leng, J. Comparative Study on CO2 Reduction Indicators of Green Building Assessment Systems in Asia. Archit. Tech. 2020, 7, 14–17. (In Chinese) [Google Scholar]
- Hu, M.; Esram, N.W. The Status of Embodied Carbon in Building Practice and Research in the United States: A Systematic Investigation. Sustainability 2021, 13, 12961. [Google Scholar] [CrossRef]
- Yu, M.; Robati, M.; Oldfield, P.; Wiedmann, T.; Crawford, R.; Nezhad, A.A.; Carmichael, D. The Impact of Value Engineering on Embodied Greenhouse Gas Emissions in the Built Environment: A Hybrid Life Cycle Assessment. Build. Environ. 2020, 168, 106452. [Google Scholar] [CrossRef]
- Ng, S.T.; Chen, Y.; Wong, J.M.W. Variability of Building Environmental Assessment Tools on Evaluating Carbon Emissions. Environ. Impact Assess. Rev. 2013, 38, 131–141. [Google Scholar] [CrossRef]
- Lin, S. 2019 National Construction Industry Development Big Data Analysis Report. Constr. Archit. 2020, 13, 12–23. (In Chinese) [Google Scholar]
- Fang, Y.; Ng, S.T.; Ma, Z.; Li, H. Quota-Based Carbon Tracing Model for Construction Processes in China. J. Clean. Prod. 2018, 200, 657–666. [Google Scholar] [CrossRef]
- Hamza, O.; Abogdera, A.; Zoras, S. Emissions-Based Options Appraisal for Modular Building Foundations: A Case Study. Eng. Sustain. 2024, 177, 162–173. [Google Scholar] [CrossRef]
- Minunno, R.; O’Grady, T.; Morrison, G.M.; Gruner, R.L. Exploring Environmental Benefits of Reuse and Recycle Practices: A Circular Economy Case Study of a Modular Building. Resour. Conserv. Recycl. 2020, 160, 104855. [Google Scholar] [CrossRef]
- Jayawardana, J.; Sandanayake, M.; Jayasinghe, J.A.S.C.; Kulatunga, A.K.; Zhang, G.A. Comparative Life Cycle Assessment of Prefabricated and Traditional Construction—A Case of a Developing Country. J. Build. Eng. 2023, 72, 106550. [Google Scholar] [CrossRef]
- Lin, L.; Yin, X.; Zhong, S.; Lin, K.; Huang, Y.; Feng, W. Carbon Emissions of Operation Stage of Residential Buildings in Hot Summer and Warm Winter Zone in China. In Proceedings of the International Conference on Construction and Real Estate Management 2022, Online, 17–18 December 2022; pp. 227–235. [Google Scholar] [CrossRef]
- Zhu, B.; Liu, G. The Development Model of Sustainable Campus Based on Green Buildings: A Systematic Comparative Study between Japan and China. Eng. Constr. Archit. Manag. 2023. [Google Scholar] [CrossRef]
- Cao, Y.; Xu, C.; Kamaruzzaman, S.N.; Aziz, N.M. A Systematic Review of Green Building Development in China: Advantages, Challenges and Future Directions. Sustainability 2022, 14, 12293. [Google Scholar] [CrossRef]
- Zhang, Y.; Wang, J.; Hu, F.; Wang, Y. Comparison of Evaluation Standards for Green Building in China, Britain, United States. Renew. Sustain. Energy Rev. 2017, 68, 262–271. [Google Scholar] [CrossRef]
- GB/T 51366-2019; Standard for Building Carbon Emission Calculation. National Standard: Beijing, China, 2019.
- GB/T 50378-2019; Assessment Standard for Green Building. National Standard: Beijing, China, 2019.
- GB/T 50640-2010; Evaluation Standard for Green Construction of Building. National Standard: Beijing, China, 2010.
- Dubey, M.K.; Raj, V.; Kumar, M.; Garg, V. Need for Rating System for Assessing Sustainability of Built Environment during Construction Stage. Total Environ. Res. Themes 2023, 7, 100061. [Google Scholar] [CrossRef]
- Ma, Q.; Lu, L.; Li, Q.; Wang, Z. Green Construction Grade Evaluation of Large Channels Based on Uncertain AHP-Multidimensional Cloud Model. Sustainability 2022, 14, 6143. [Google Scholar] [CrossRef]
- Vyas, G.S.; Jha, K.N.; Rajhans, N.R. Identifying and Evaluating Green Building Attributes by Environment, Social, and Economic Pillars of Sustainability. Civ. Eng. Environ. Syst. 2019, 36, 133–148. [Google Scholar] [CrossRef]
- Qiao, Y.; Wang, J.; Wang, Y. Sustainability Evaluation of Green Building Construction Based on a Combination Method of Weighting and Improved Matter-Element Extension. AIMS Math. 2024, 9, 24418–24442. [Google Scholar] [CrossRef]
- Liu, L.; Zhang, Y.; Zhao, L.; Zhan, C.; Liang, C. An Attempt to Evaluate the Green Construction of Large-Scale Hydropower Projects: Taking Wudongde Hydropower Station on the Jinsha River, China as an Example. Sustainability 2022, 14, 194. [Google Scholar] [CrossRef]
- Xiao, Y.; Zhang, Y. Evaluation and Suggestions on Green Development of Shanghai Port Based on AHP and Fuzzy Comprehensive Evaluation Method. In Proceedings of the Sixth International Conference on Electromechanical Control Technology and Transportation (ICECTT 2021), Chongqing, China, 14–16 May 2021; Volume 12081. [Google Scholar]
- Wang, Q.; Kang, X.; Nian, C. Research on Green Construction Evaluation of Prefabricated Buildings based on Grey Clustering. Eng. J. Wuhan Univ. 2023, 56, 567–574. (In Chinese) [Google Scholar] [CrossRef]
- An, M.; Liu, M.; Wu, H. Study on the Influence of Prefabricated Building Demonstration City Policy on Carbon Emission in the Construction Industry. Huanjing Kexue Xuebao/Acta Sci. Circumstantiae 2024, 44, 464–476. [Google Scholar] [CrossRef]
- Zhang, X.; Wang, F. Assessment of Embodied Carbon Emissions for Building Construction in China: Comparative Case Studies Using Alternative Methods. Energy Build. 2016, 130, 330–340. [Google Scholar] [CrossRef]
- Liu, M.; Li, P.; Jia, S.; Liu, X.; Wang, H. Carbon Emissions Assessment of Civil Building during Construction Period. Constr. Sci. Technol. 2018, 19, 67–71. (In Chinese) [Google Scholar] [CrossRef]
- Wu, W.; Sun, P.; Zhou, H. The Case Study of Carbon Emission in Building Construction Process. IOP Conf. Ser. Earth Environ. Sci. 2019, 371, 022011. [Google Scholar] [CrossRef]
- Sandanayake, M.; Zhang, G.; Setunge, S. Environmental Emissions at Foundation Construction Stage of Buildings—Two Case Studies. Build. Environ. 2016, 95, 189–198. [Google Scholar] [CrossRef]
- Luo, W.; Sandanayake, M.; Zhang, G. Direct and Indirect Carbon Emissions in Foundation Construction—Two Case Studies of Driven Precast and Cast-in-Situ Piles. J. Clean. Prod. 2019, 211, 1517–1526. [Google Scholar] [CrossRef]
- Hu, H.; Li, C.; Xu, Z.; Gui, Y.; Zong, L.; Shi, J. Calculation Example of Full Cycle Carbon Emission of Super Deep Foundation Pit and Carbon Reduction Measures. Mater. Green Constr. 2023, 1, 132–145. (In Chinese) [Google Scholar]
- Li, L.; Chen, K. Quantitative Assessment of Carbon Dioxide Emissions in Construction Projects: A Case Study in Shenzhen. J. Clean. Prod. 2017, 141, 394–408. [Google Scholar] [CrossRef]
- Pujadas-Gispert, E.; Sanjuan-Delmás, D.; Josa, A. Environmental Analysis of Building Shallow Foundations: The Influence of Prefabrication, Typology, and Structural Design Codes. J. Clean. Prod. 2018, 186, 407–417. [Google Scholar] [CrossRef]
- Li, X.-J.; Zheng, Y.-D. Using LCA to Research Carbon Footprint for Precast Concrete Piles during the Building Construction Stage: A China Study. J. Clean. Prod. 2020, 245, 118754. [Google Scholar] [CrossRef]
- Wang, J.; Hou, X.; Deng, X.; Han, H.; Zhang, L. Application of BIM in Tunnel Design with Compaction Pile Reinforced Foundation Carrying Carbon Assessment Based on Advanced Dynamo Visual Programming: A Case Study in China. Sustainability 2022, 14, 16222. [Google Scholar] [CrossRef]
- Ullah, H.; Zhang, H.; Huang, B.; Gong, Y. BIM-Based Digital Construction Strategies to Evaluate Carbon Emissions in Green Prefabricated Buildings. Buildings 2024, 14, 1689. [Google Scholar] [CrossRef]
- Ding, Y.; Guo, Z.-Z.; Zhou, S.-X.; Wei, Y.-Q.; She, A.-M.; Dong, J.-L. Research on Carbon Emissions during the Construction Process of Prefabricated Buildings Based on BIM and LCA. J. Asian Archit. Build. Eng. 2024, 1–13. [Google Scholar] [CrossRef]
- Saaty, T.L. A Scaling Method for Priorities in Hierarchical Structures. J. Math. Psychol. 1977, 15, 234–281. [Google Scholar] [CrossRef]
- Hwang, C.-L.; Yoon, K.P. Multiple Attribute Decision Making: Methods and Applications—A State-of-the-Art Survey; Lecture Notes in Economics and Mathematical Systems; Springer: Berlin, Germany, 1981; Volume 186, ISBN 978-3-540-10558-9. [Google Scholar]
- Kizielewicz, B.; Sałabun, W. SITW Method: A New Approach to Re-Identifying Multi-Criteria Weights in Complex Decision Analysis. Spectr. Mech. Eng. Oper. Res. 2024, 1, 215–226. [Google Scholar] [CrossRef]
- Więckowski, J.; Kizielewicz, B.; Shekhovtsov, A.; Sałabun, W. RANCOM: A Novel Approach to Identifying Criteria Relevance Based on Inaccuracy Expert Judgments. Eng. Appl. Artif. Intell. 2023, 122, 106114. [Google Scholar] [CrossRef]
- Shekhovtsov, A.; Kizielewicz, B.; Sałabun, W. Advancing Individual Decision-Making: An Extension of the Characteristic Objects Method Using Expected Solution Point. Inf. Sci. 2023, 647, 119456. [Google Scholar] [CrossRef]
- Zhang, P.; Gao, H.; Zhang, D.; Zhou, E.; Khan, F. Charting a Sustainable Tomorrow: Advancing Urban Low-Carbon Economies through Comprehensive Evaluation and Promotion. PLoS ONE 2024, 19, e0299688. [Google Scholar] [CrossRef]
- Zou, T.; Guo, P.; Wu, Q. Applying an Entropy-Weighted TOPSIS Method to Evaluate Energy Green Consumption Revolution Progressing of China. Environ. Sci. Pollut. Res. 2023, 30, 42267–42281. [Google Scholar] [CrossRef]
- Li, M.; Sun, H.; Singh, V.P.; Zhou, Y.; Ma, M. Agricultural Water Resources Management Using Maximum Entropy and Entropy-Weight-Based TOPSIS Methods. Entropy 2019, 21, 364. [Google Scholar] [CrossRef]
- Yu, X.; Suntrayuth, S.; Carayannis, E.G.; Sindakis, S.; Showkat, S. Advancing Industrial Wastewater Treatment through Comprehensive Evaluation and Innovative Technology: A G1-Entropy Improved TOPSIS Model Approach. J. Technol. Transf. 2023. [Google Scholar] [CrossRef]
- Niroomand, N.; Bach, C.; Elser, M. Segment-Based CO2 Emission Evaluations From Passenger Cars Based on Deep Learning Techniques. IEEE Access 2021, 9, 166314–166327. [Google Scholar] [CrossRef]
- Sundaram, A.; Varghese, I.K.; RejiKumar, G. Machine Learning Approaches for Real-Time Carbon Emission Prediction and Mitigation. In Proceedings of the 2023 IEEE Technology & Engineering Management Conference: Asia Pacific (TEMSCON-ASPAC), Bengaluru, India, 14–16 December 2023; pp. 1–7. [Google Scholar]
- Wang, X. Teaching Quality Evaluation for English Grading Based on Neural Network. In Advances in Transdisciplinary Engineering; IOS Press: Amsterdam, The Netherlands, 2024; Volume 47, pp. 548–558. [Google Scholar] [CrossRef]
- Papadopoulos, S.; Kontokosta, C.E. Grading Buildings on Energy Performance Using City Benchmarking Data. Appl. Energy 2019, 233–234, 244–253. [Google Scholar] [CrossRef]
- Vera, J.F.; Angulo, J.M. An MDS-Based Unifying Approach to Time Series K-Means Clustering: Application in the Dynamic Time Warping Framework. Stoch. Environ. Res. Risk Assess. 2023, 37, 4555–4566. [Google Scholar] [CrossRef]
- Zheng, X.; Chen, Y.; Lin, C.; Zhang, W.; Zhou, X. Rating of Catering Enterprises Based on Fuzzy Hierarchy and K-Means Clustering. Int. J. Wirel. Mob. Comput. 2021, 20, 77. [Google Scholar] [CrossRef]
- Zhang, L.; Bai, X.; Chen, Y.; Wang, T.; Hu, F.; Li, M. Research on Power Market User Credit Evaluation Based on K-Means Clustering and Contour Coefficient. In Proceedings of the 2020 3rd International Conference on Robotics, Control and Automation Engineering (RCAE), Chongqing, China, 5–8 November 2020; pp. 64–68. [Google Scholar]
- Ma, Q.; Zhang, D.; Che, J.; Li, C. Research on student quality evaluation system based on K-means clustering algorithm. Comput. Program. Ski. Maint. 2023, 4, 54–56. (In Chinese) [Google Scholar] [CrossRef]
- Fang, Y.; Lu, X.; Li, H. A Random Forest-Based Model for the Prediction of Construction-Stage Carbon Emissions at the Early Design Stage. J. Clean. Prod. 2021, 328, 129657. [Google Scholar] [CrossRef]
- Department of Housing and Urban-Rural Development of Guangdong Province. Guangdong Building Construction and Decoration Engineering Comprehensive Quota (2018); National Standard: Guangdong, China, 2018. [Google Scholar]
- Ministry of Ecology and Environment and the National Bureau of Statistics. Announcement by the Ministry of Ecology and Environment and the National Bureau of Statistics on the Publish of Carbon Dioxide Emission Factors for Electricity in 2021. Available online: https://wzq1.mee.gov.cn/xxgk2018/xxgk/xxgk01/202404/t20240412_1070565.html (accessed on 10 December 2024).
- Wang, Q.-C.; Yu, S.-N.; Chen, Z.-X.; Weng, Y.-W.; Xue, J.; Liu, X. Promoting Additive Construction in Fast-Developing Areas: An Analysis of Policies and Stakeholder Perspectives. Dev. Built. Environ. 2023, 16, 100271. [Google Scholar] [CrossRef]
- Yuan, B.; Liang, J.; Huang, X.; Huang, Q.; Zhang, B.; Yang, G.; Wang, Y.; Yuan, J.; Wang, H.; Yuan, P. Eco-Efficient Recycling of Engineering Muck for Manufacturing Low-Carbon Geopolymers Assessed through LCA: Exploring the Impact of Synthesis Conditions on Performance. Acta Geotech. 2024. [Google Scholar] [CrossRef]
- Spearman, C. The Proof and Measurement of Association between Two Things. Am. J. Psychol. 1987, 100, 441–471. [Google Scholar] [CrossRef]
- Kendall, M.G. A New Measure of Rank Correlation. Biometrika 1938, 30, 81–93. [Google Scholar] [CrossRef]
- Sałabun, W.; Urbaniak, K. A New Coefficient of Rankings Similarity in Decision-Making Problems. In Computational Science—ICCS 2020; Krzhizhanovskaya, V.V., Závodszky, G., Lees, M.H., Dongarra, J.J., Sloot, P.M.A., Brissos, S., Teixeira, J., Eds.; Springer International Publishing: Cham, Switzerland, 2020; pp. 632–645. [Google Scholar]
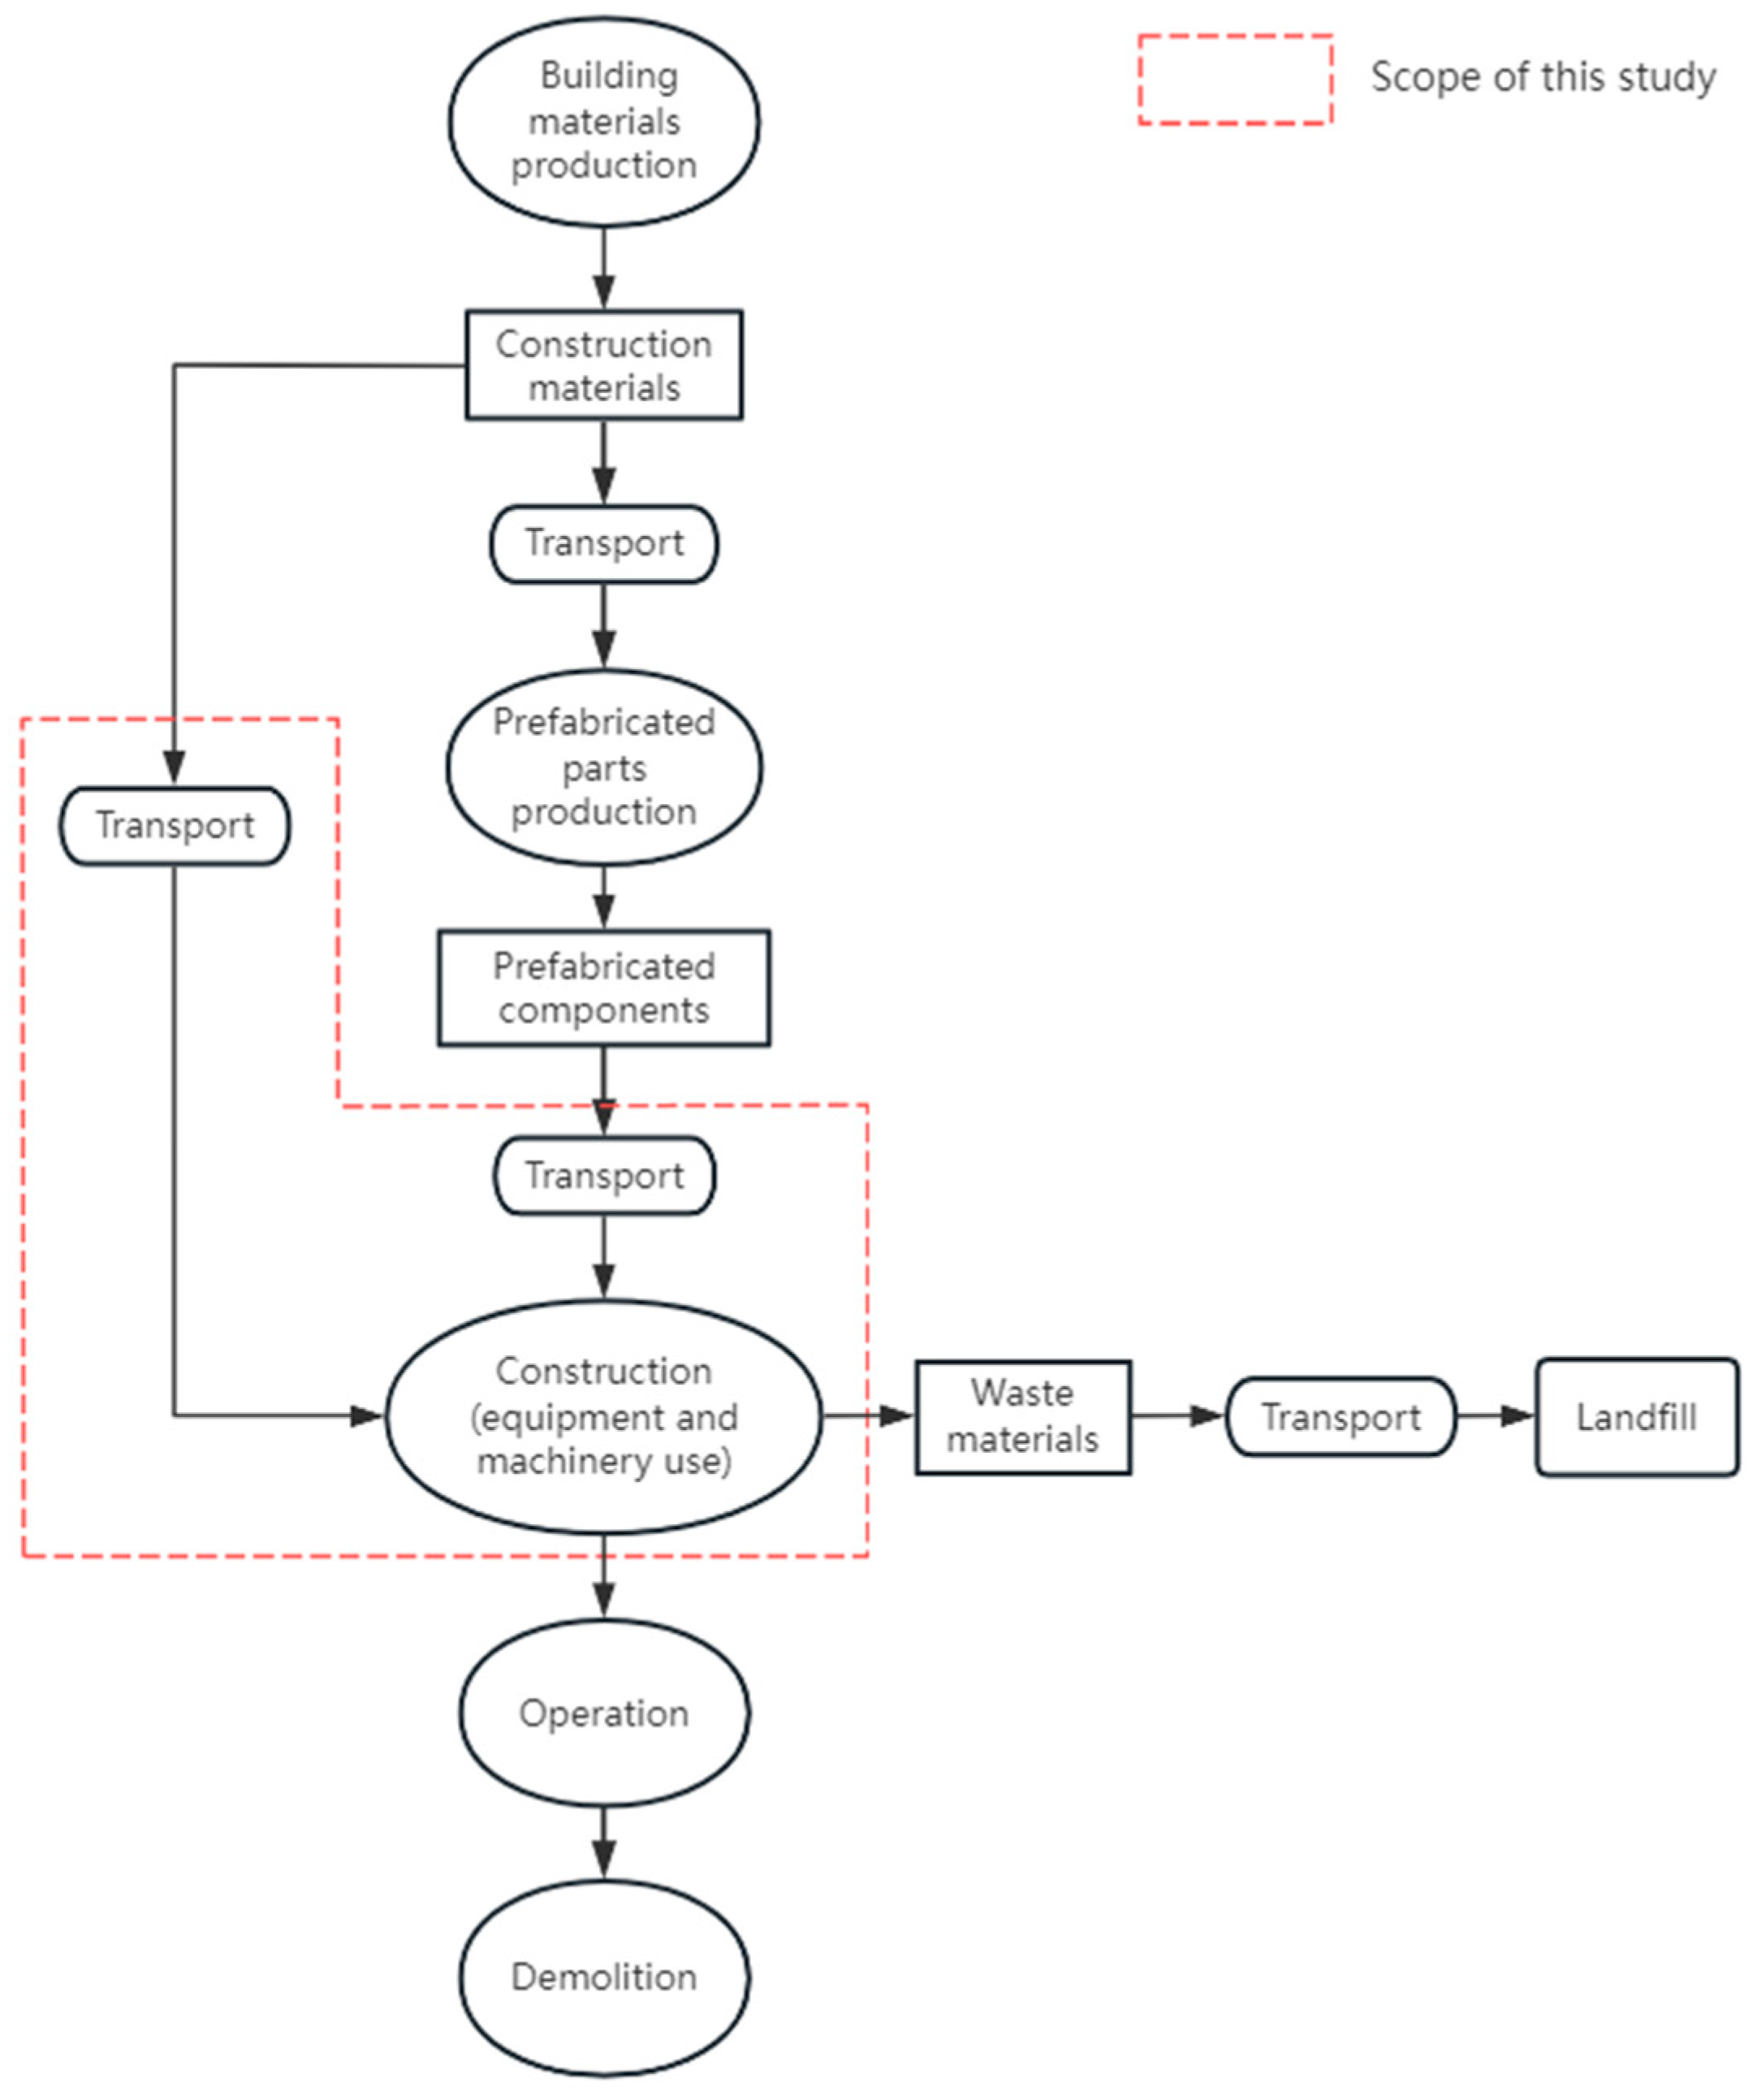
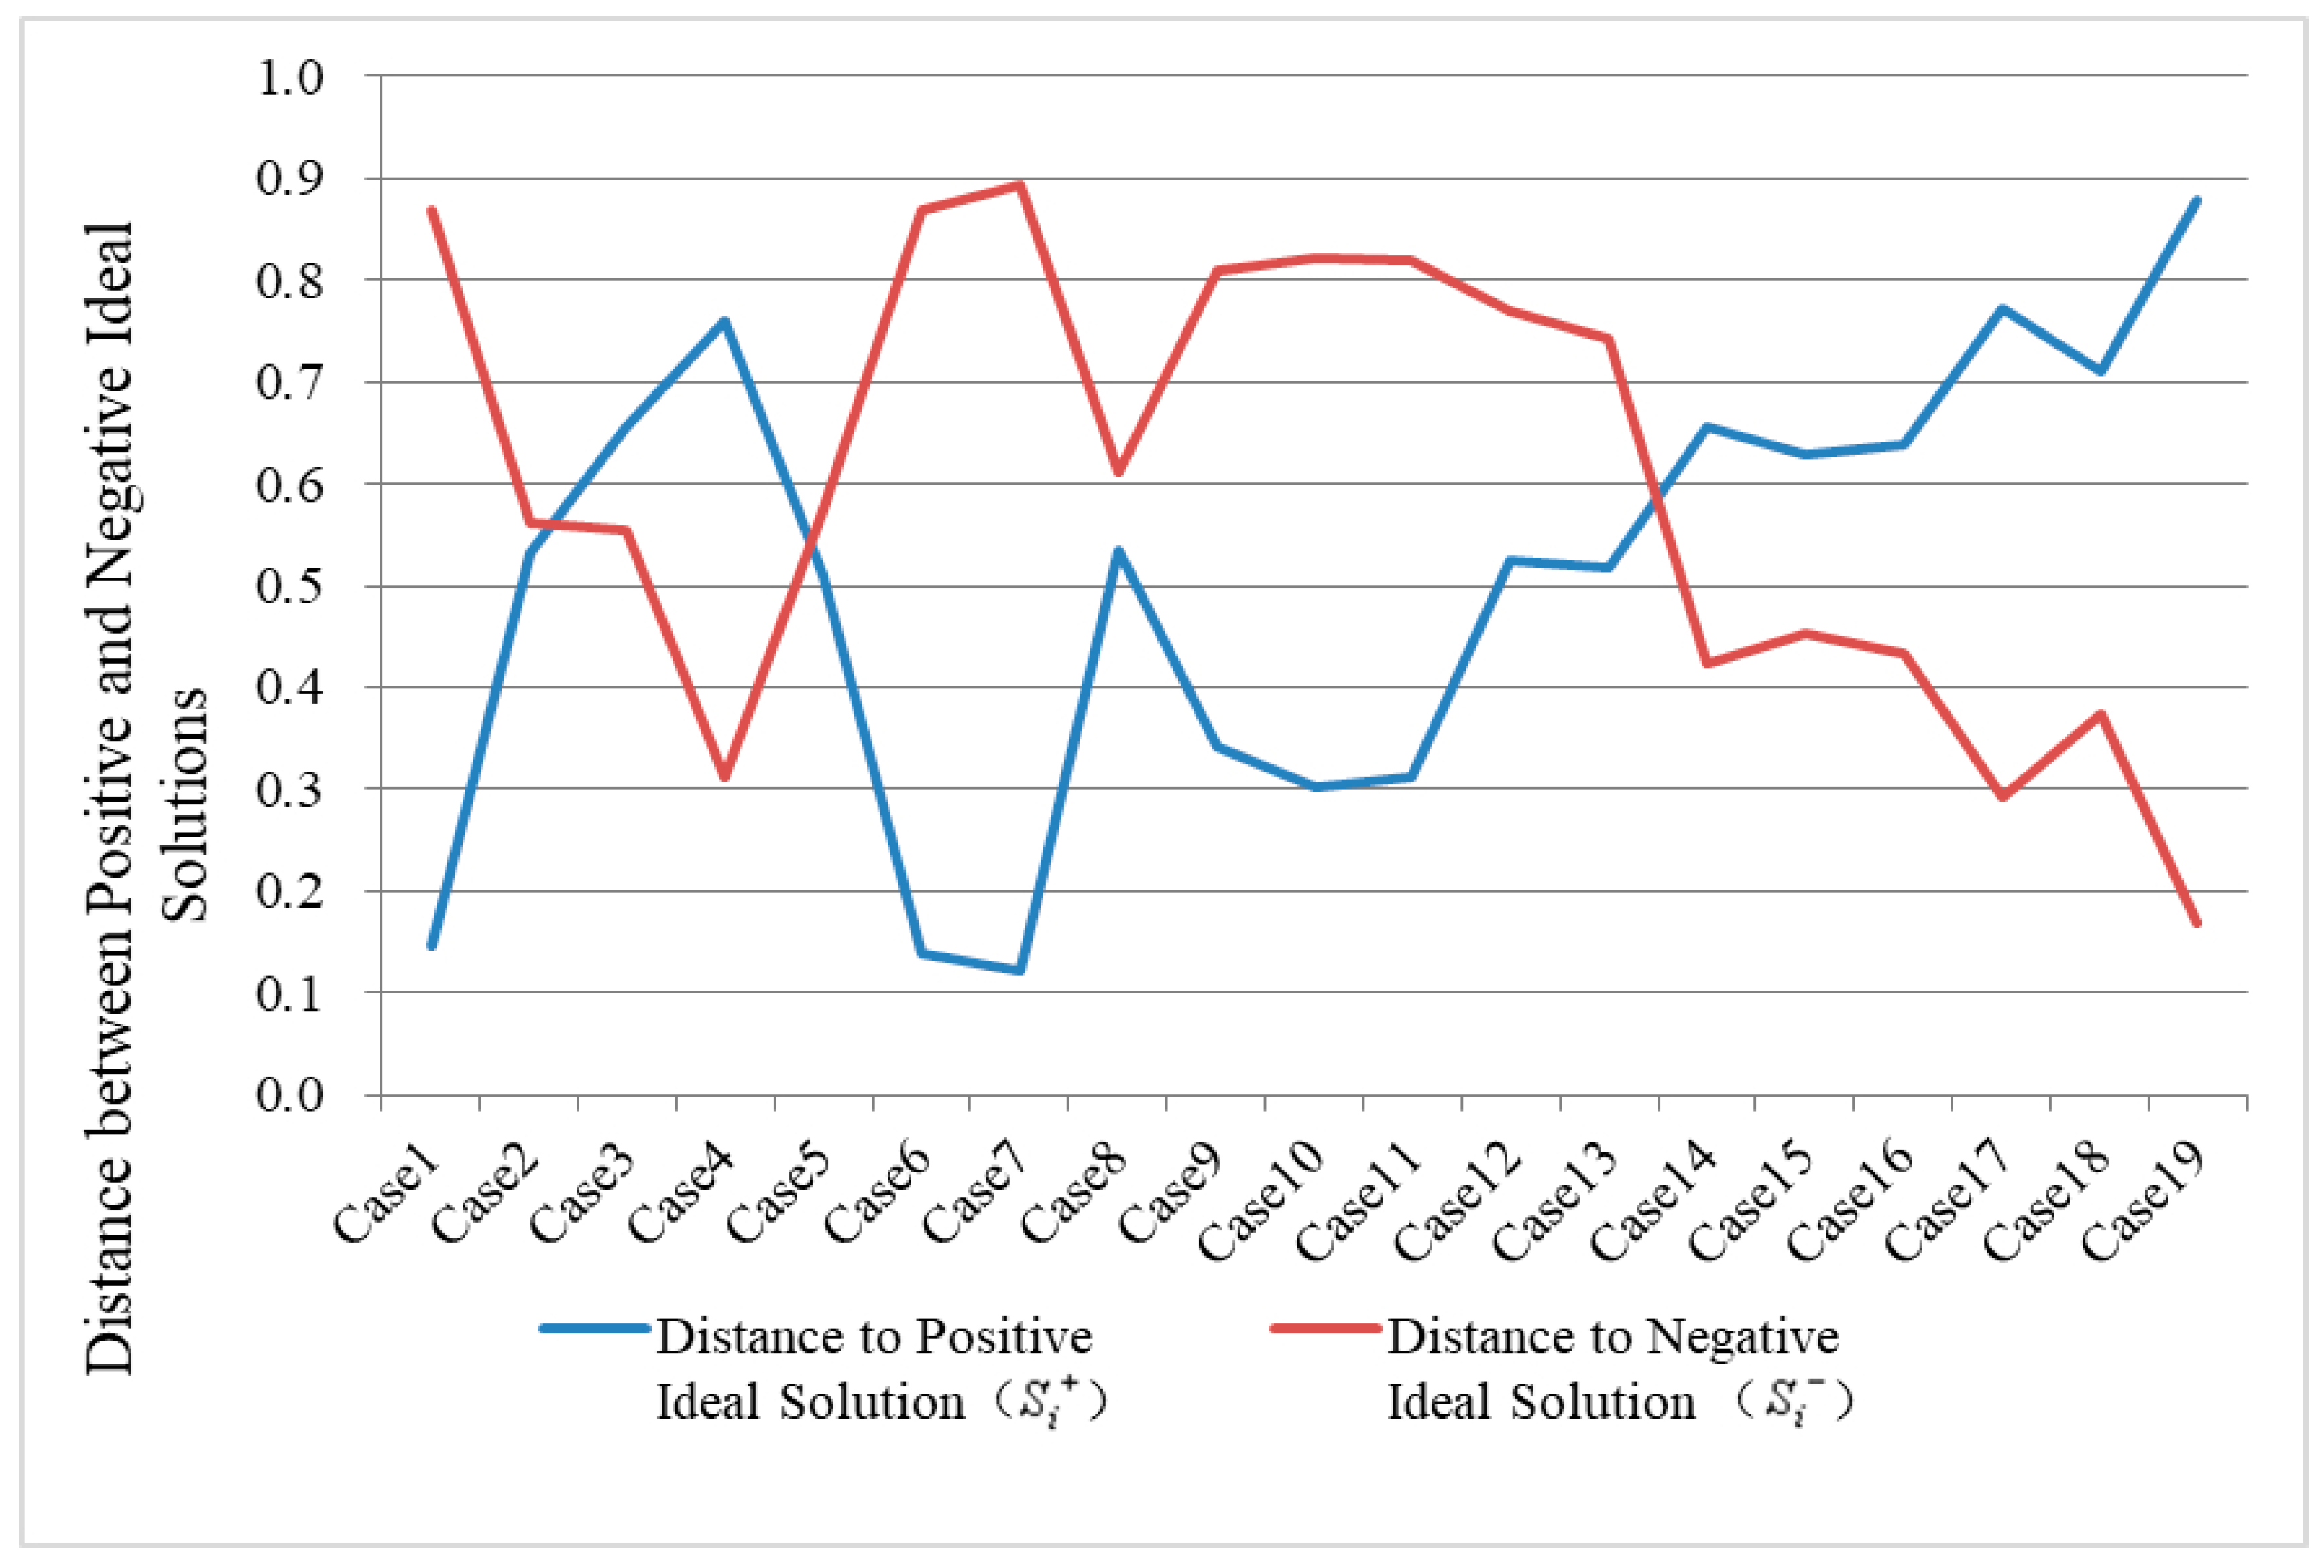
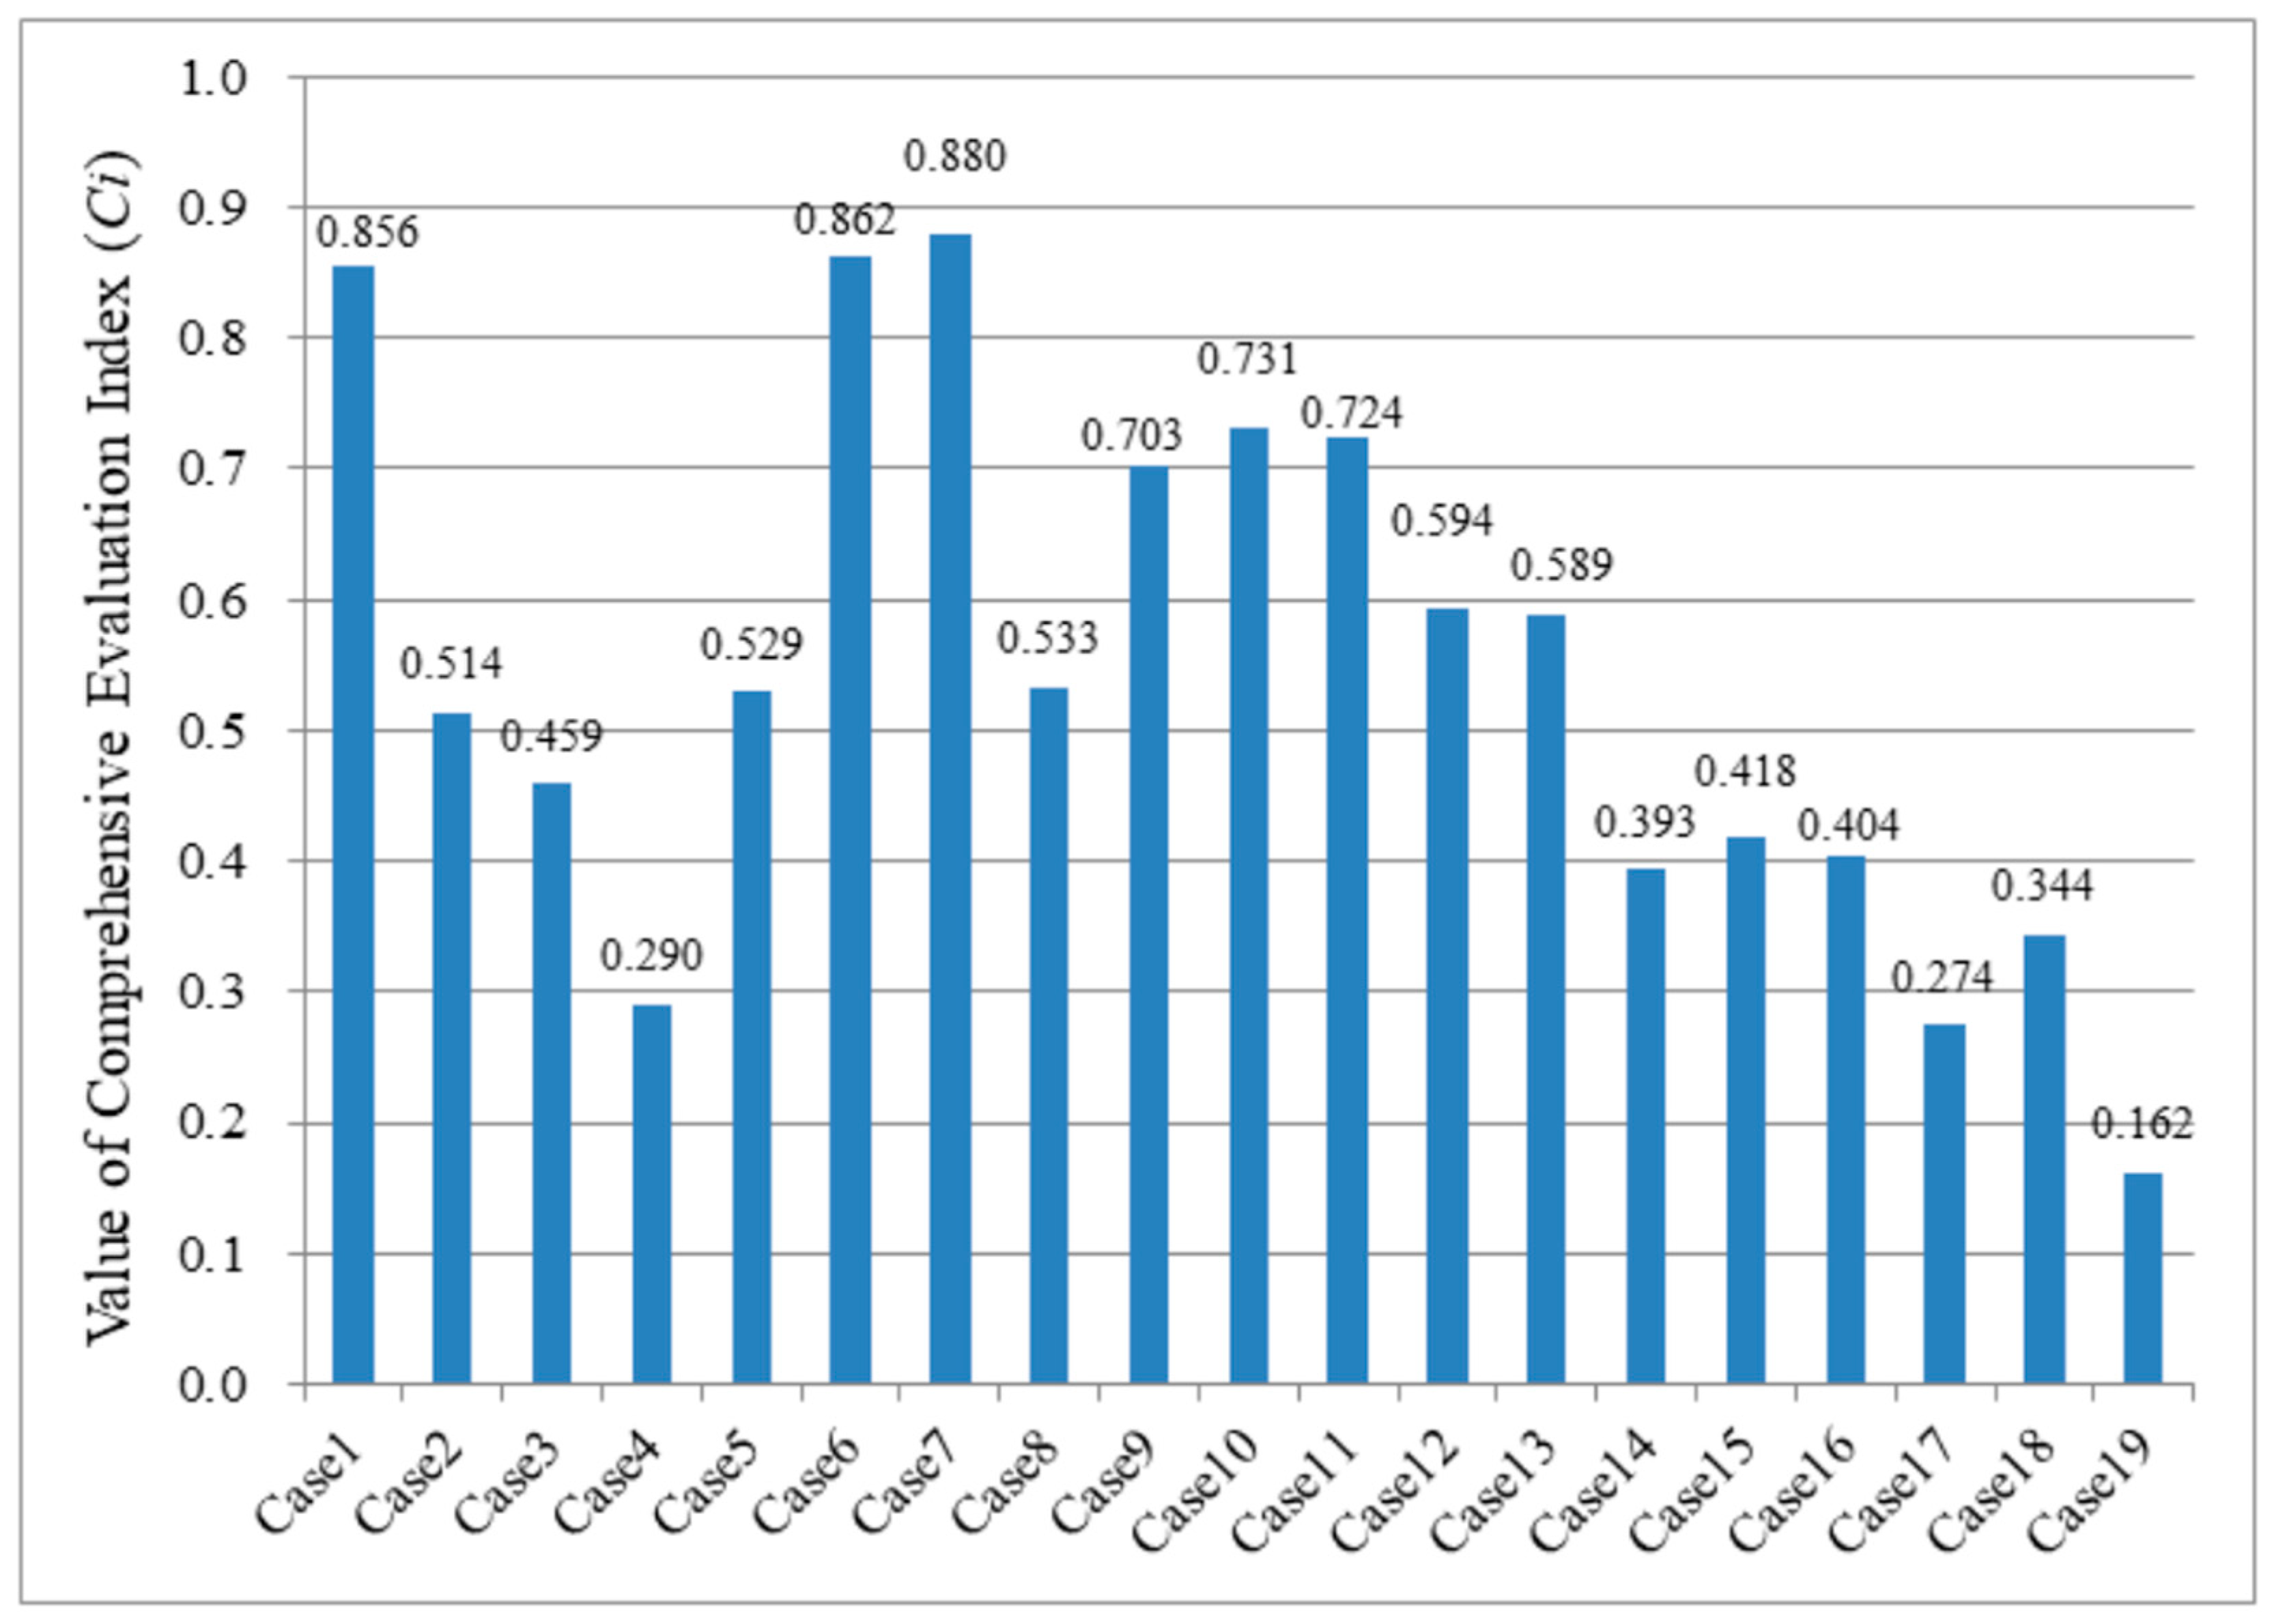
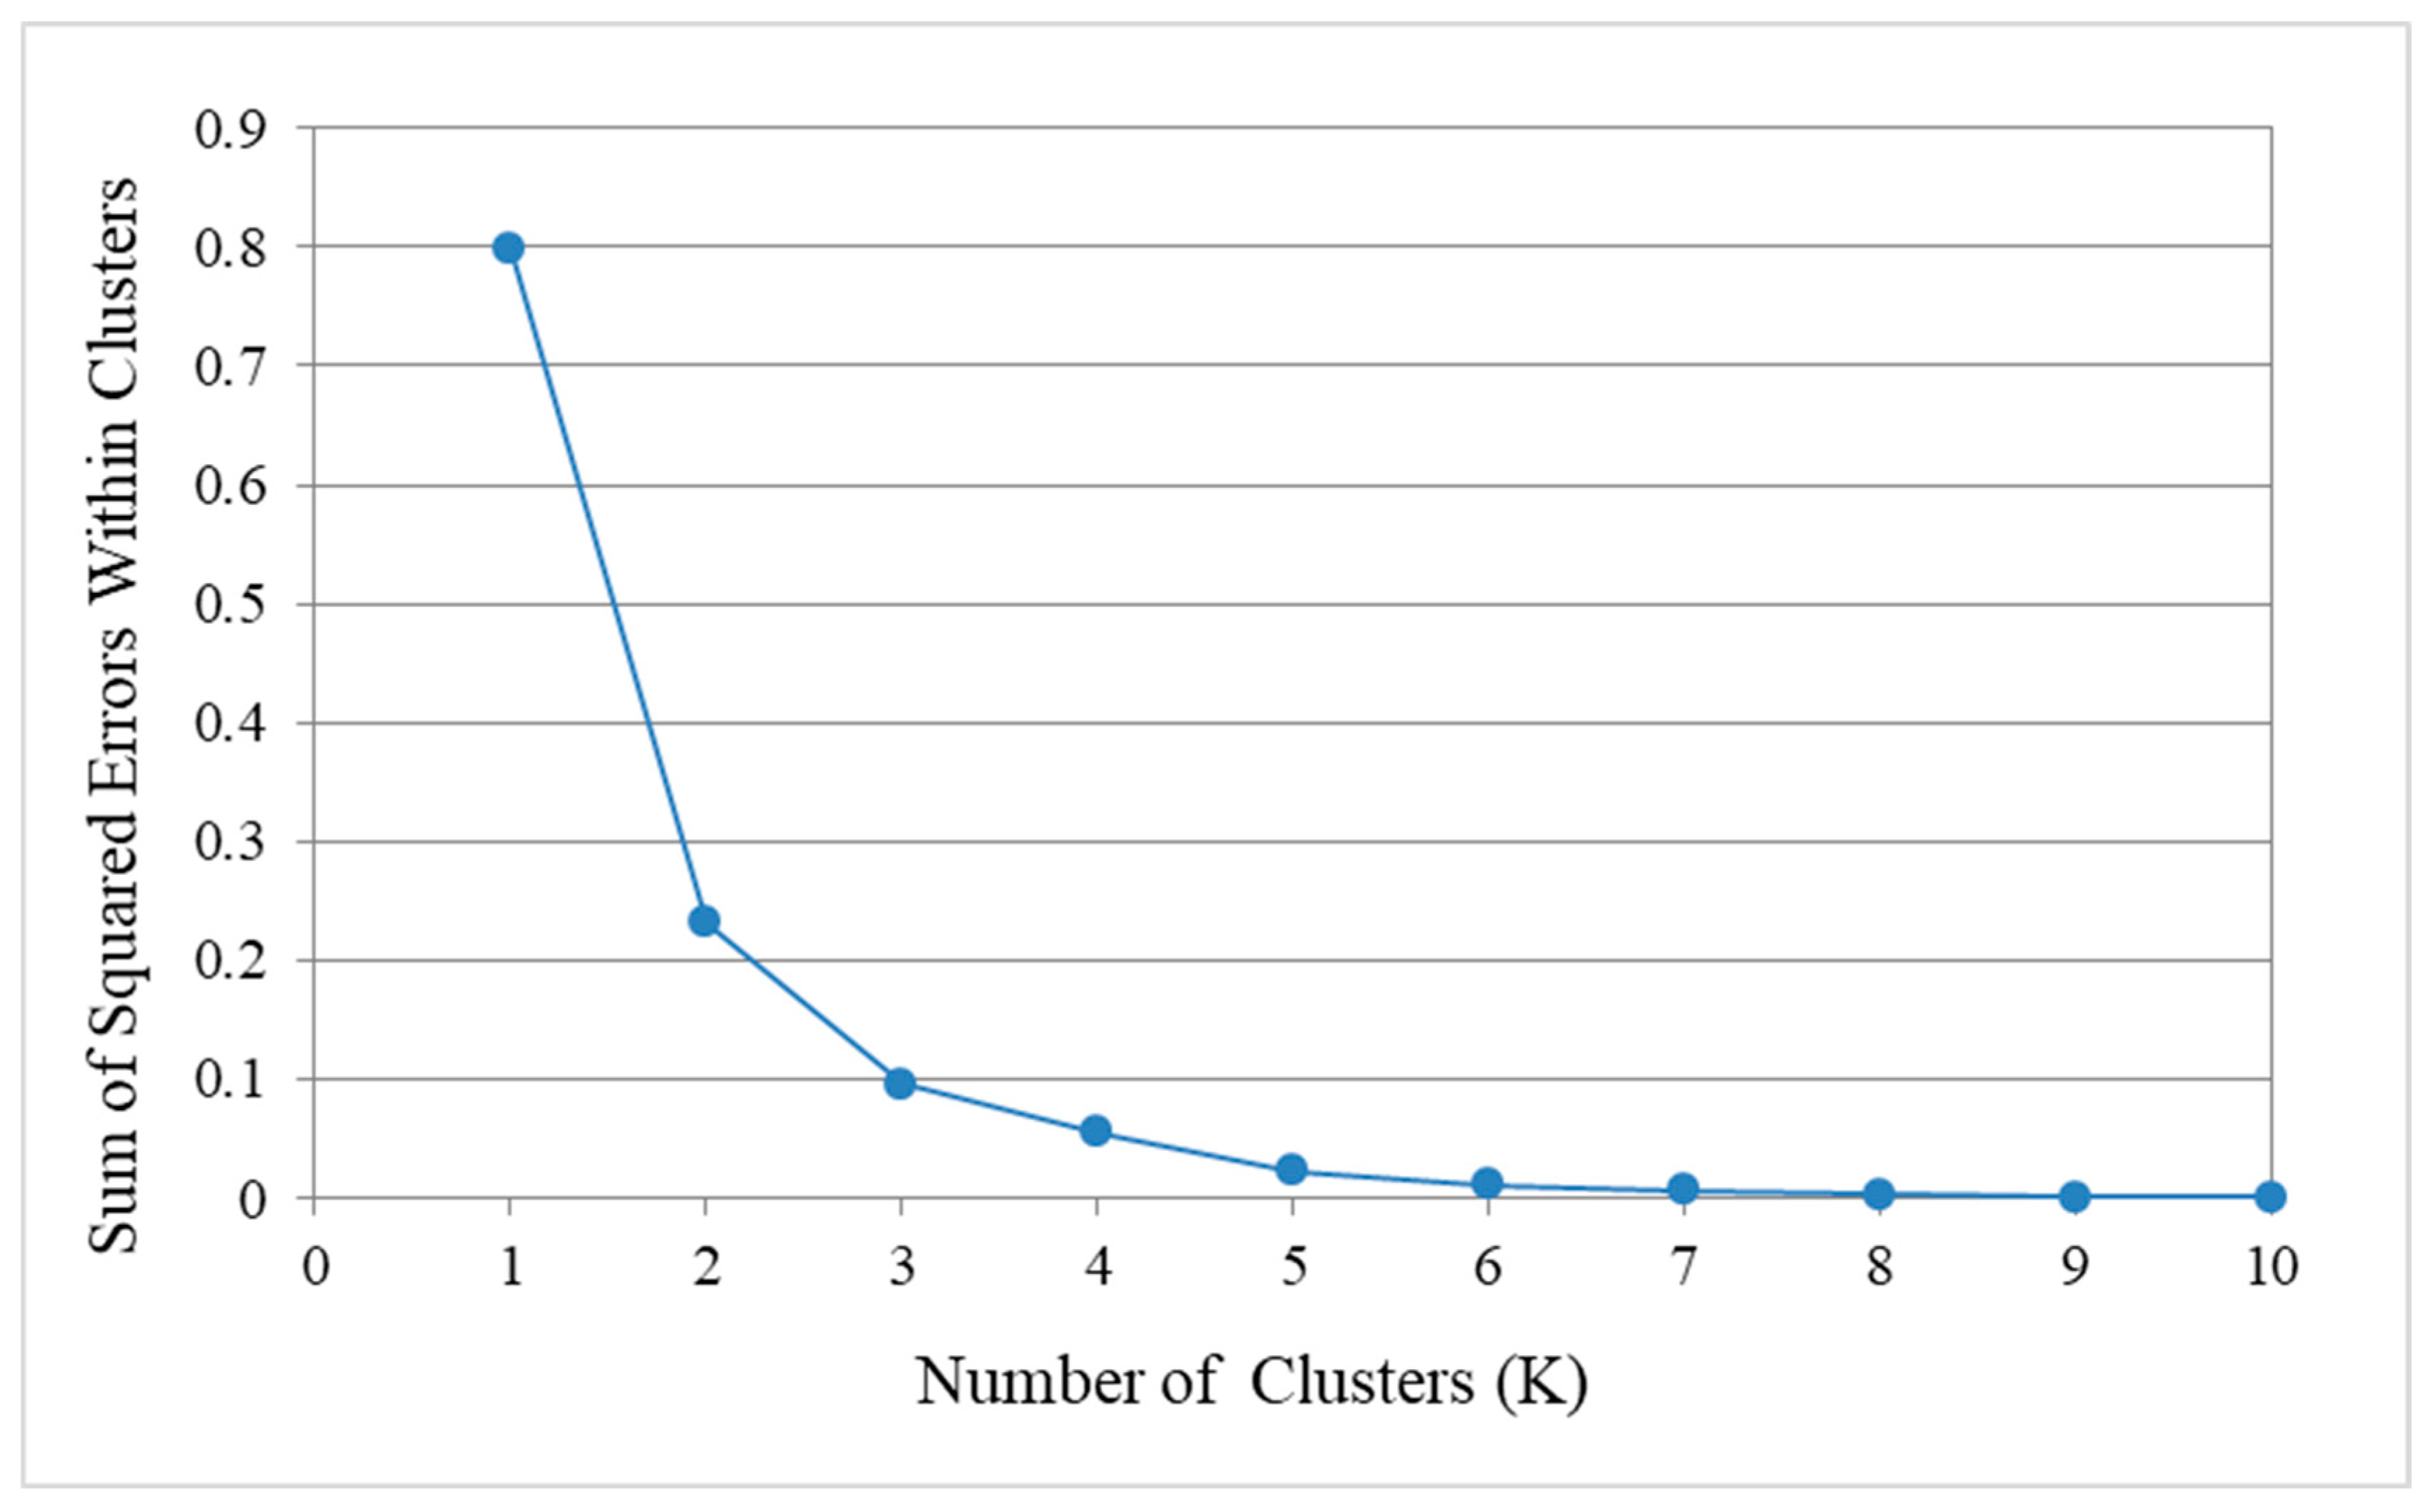
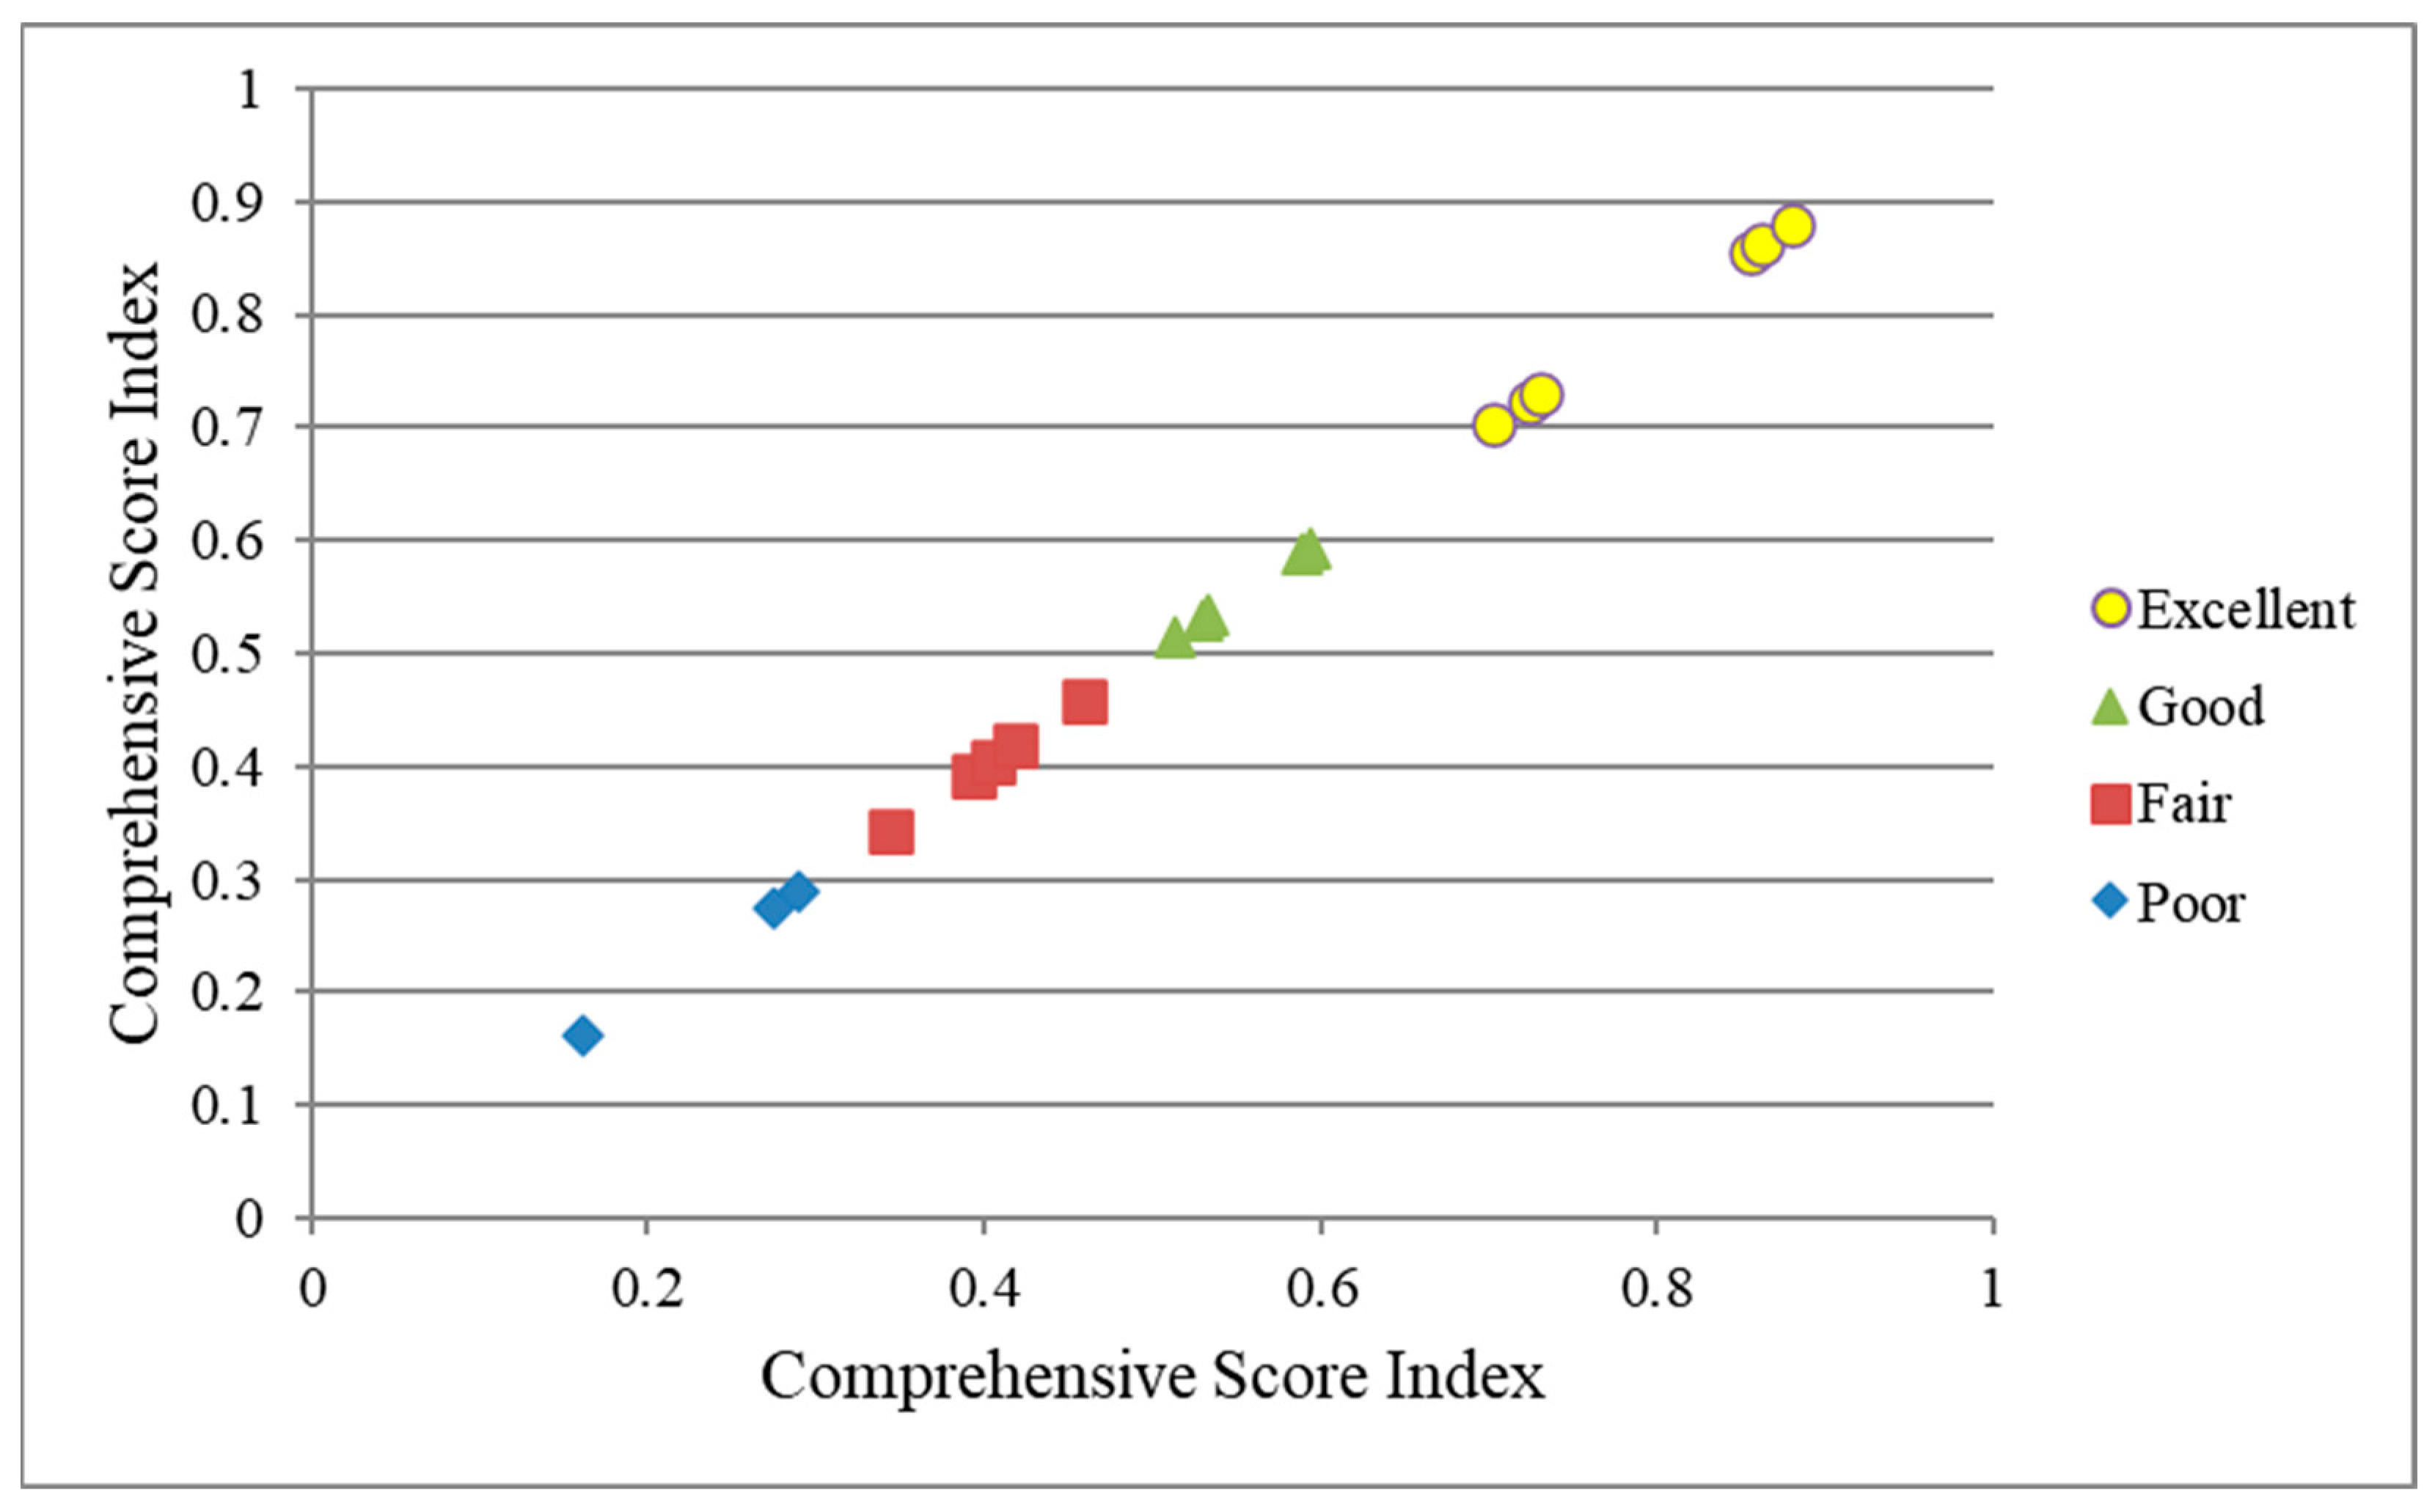
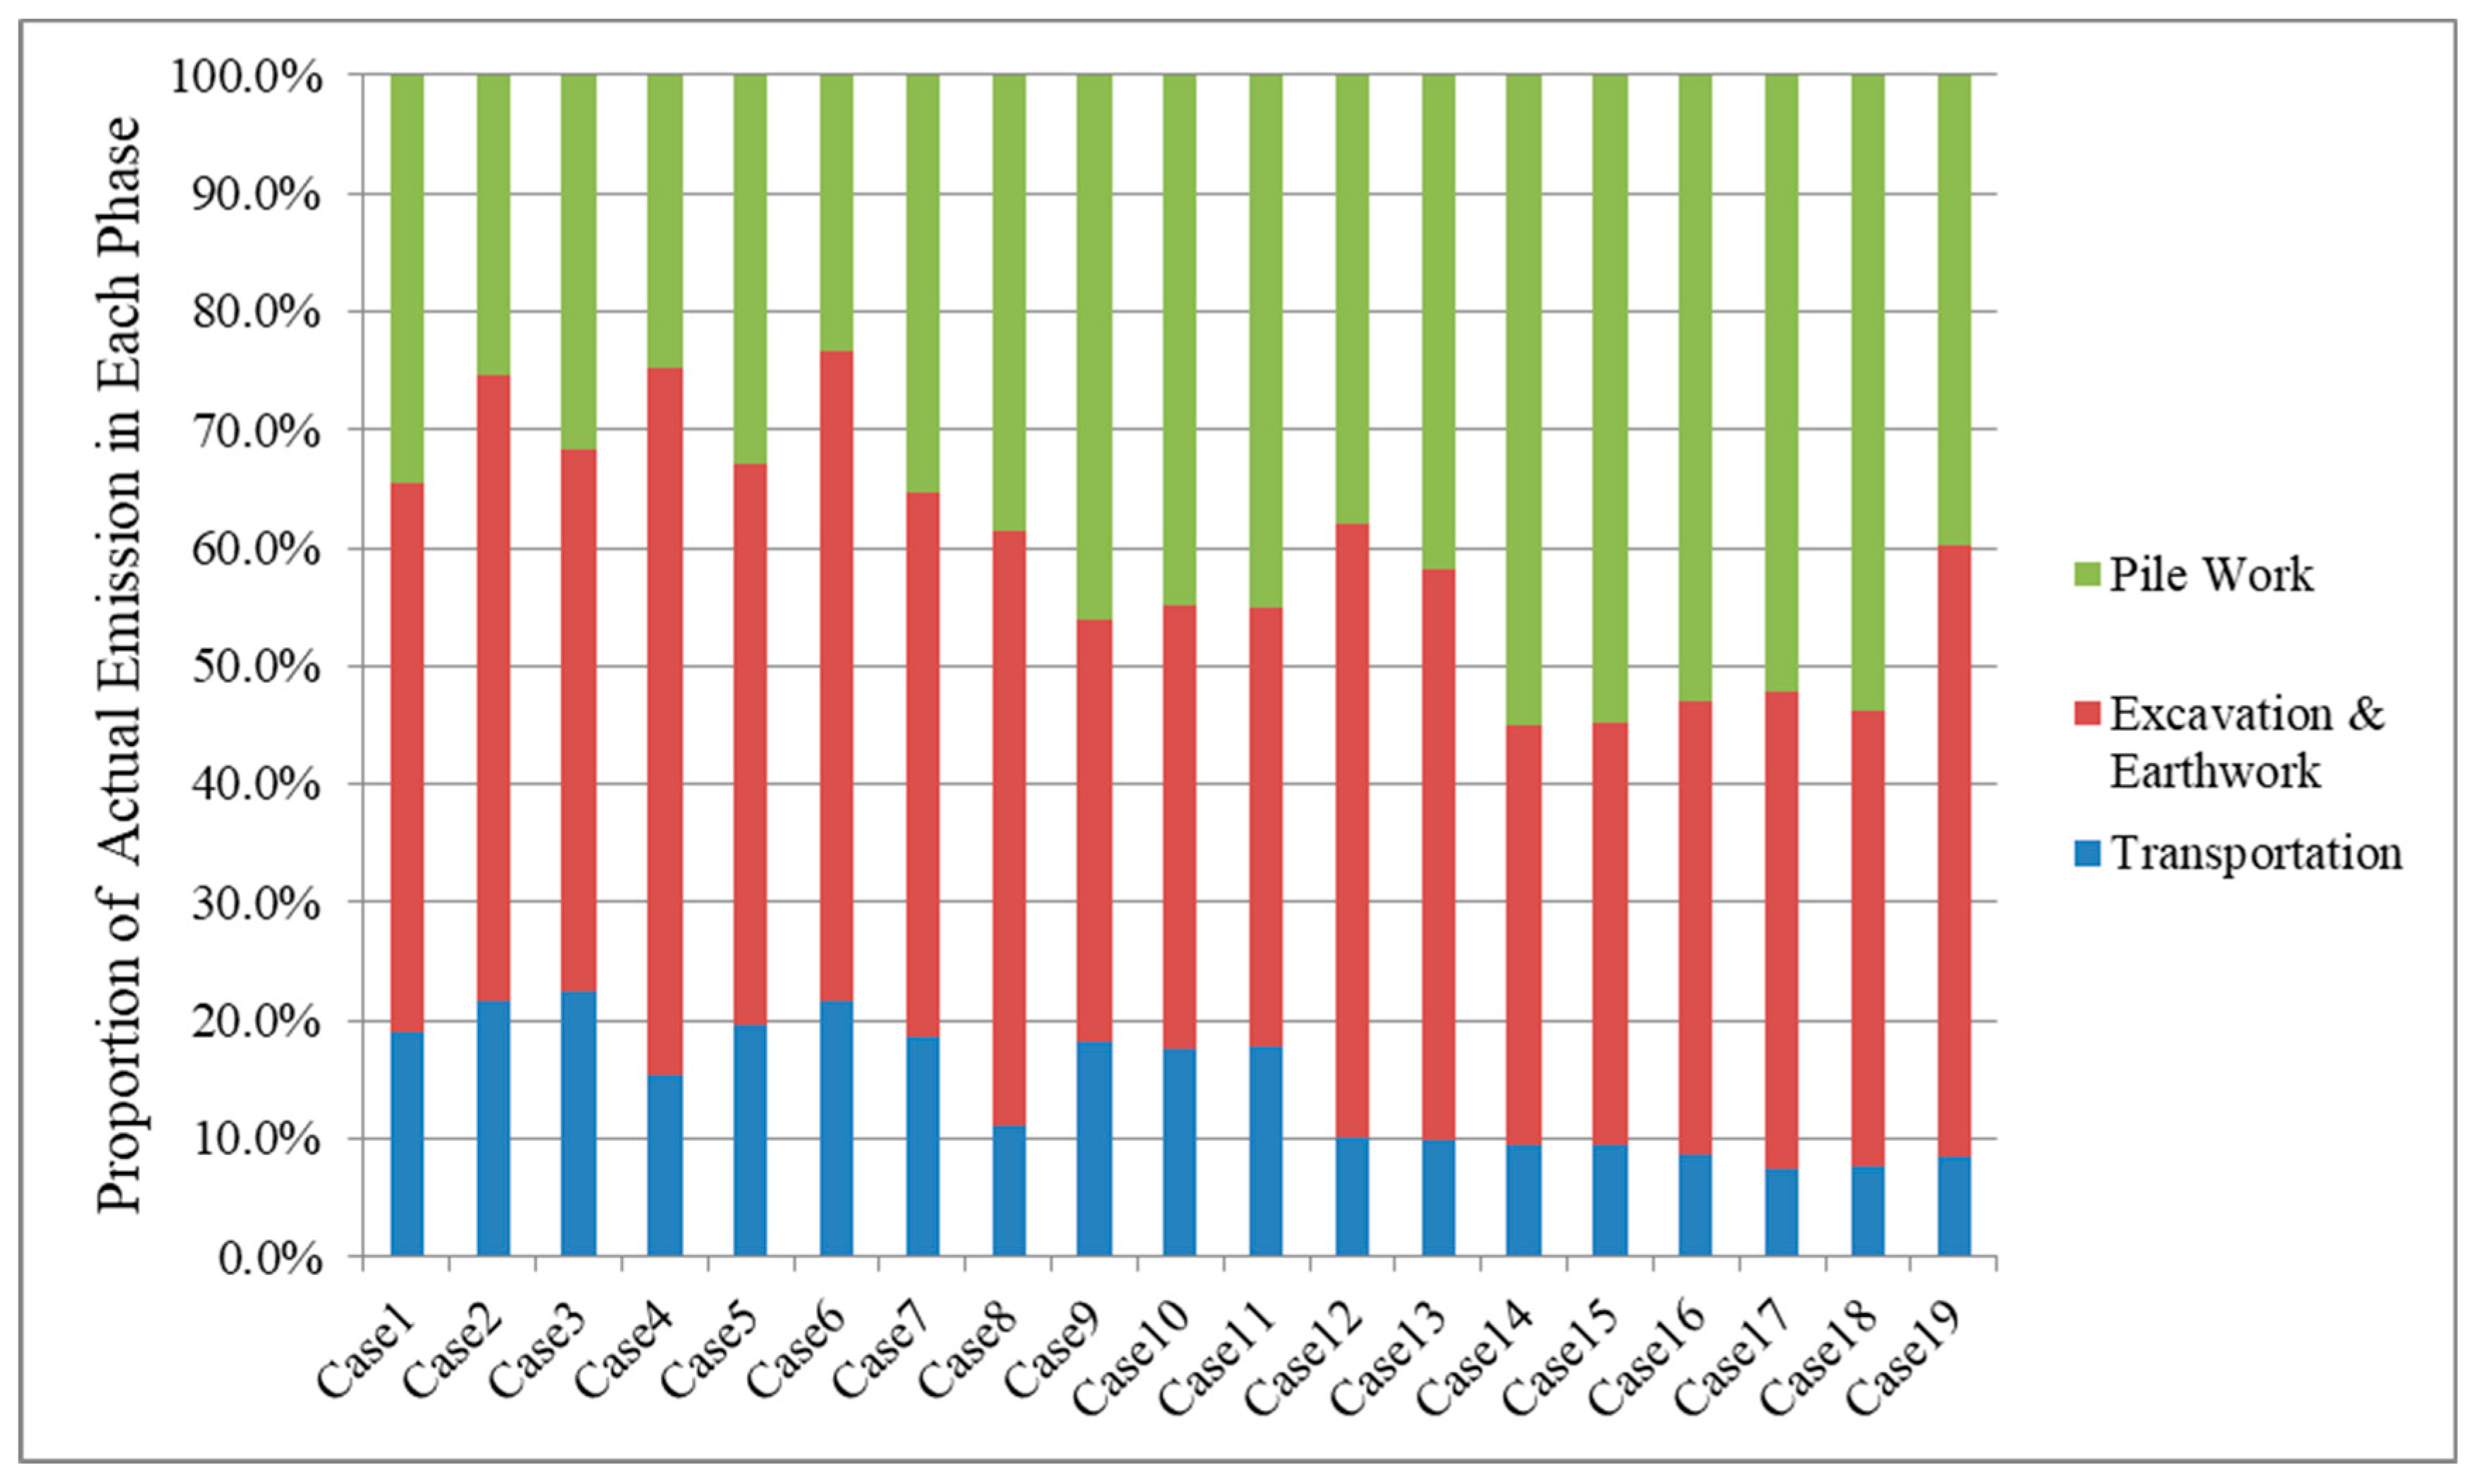

Disclaimer/Publisher’s Note: The statements, opinions and data contained in all publications are solely those of the individual author(s) and contributor(s) and not of MDPI and/or the editor(s). MDPI and/or the editor(s) disclaim responsibility for any injury to people or property resulting from any ideas, methods, instructions or products referred to in the content. |
© 2025 by the authors. Licensee MDPI, Basel, Switzerland. This article is an open access article distributed under the terms and conditions of the Creative Commons Attribution (CC BY) license (https://creativecommons.org/licenses/by/4.0/).