
Carbon Emission Evaluation System for Foundation Construction Based on Entropy–TOPSIS and K-Means Methods


Abstract
1. Introduction
2. Literature Review
2.1. Current Research on a Green Construction Evaluation System
2.2. Current Research on Foundation Construction Carbon Emission
2.3. Current Research on Multi-Criteria Decision Analysis (MCDA) Methods
2.4. Current Research on Evaluation Rating Based on Machine Learning
2.5. Summary of Current Research
- The existing green building evaluation systems mainly relied on qualitative indicators, rather than quantitative indicators, especially when they were used to evaluate the sustainability of the building construction stage.
- Research on the carbon emission evaluation of building foundation construction was still relatively scarce. The relevant research was still limited to specific technologies or foundation types and has not yet formulated a systematic and widely applicable evaluation framework for carbon emission.
- The entropy–TOPSIS method has significant advantages in dealing with the multi-indicator weighting and decision-making problem. It has significant potential in carbon emission evaluation for foundation construction.
- The K-means clustering algorithm was significant for tackling evaluation rating problems. Its advantages included high efficiency, simplicity, mass data processing, outlier detection, and applicability to different fields.
- To establish a carbon emission calculation model for the foundation construction stage to accurately quantify the actual emission value;
- To determine the carbon emission baseline value via the quota method and thereby obtain the carbon emission performance value by comparing the actual and baseline emission values;
- To formulate a carbon emission evaluation system for foundation construction via the entropy–TOPSIS theory to obtain a comprehensive evaluation index;
- To establish a carbon emission rating system using the K-means clustering method.
3. Method and Model Development
- Step 1. Calculate the actual (E) and baseline (E’) carbon emission at each foundation construction phase.
- Step 2. Calculate the carbon emission performance value at each foundation construction phase.
- Step 3. Assign weight (W) to the carbon emission performance of each phase and obtain the comprehensive evaluation index (C) of the foundation construction via the entropy–TOPSIS theory.
- Step 4. Rate the carbon emission performance via the K-means clustering algorithm.
3.1. Actual (E) and Baseline (E’) Carbon Emission
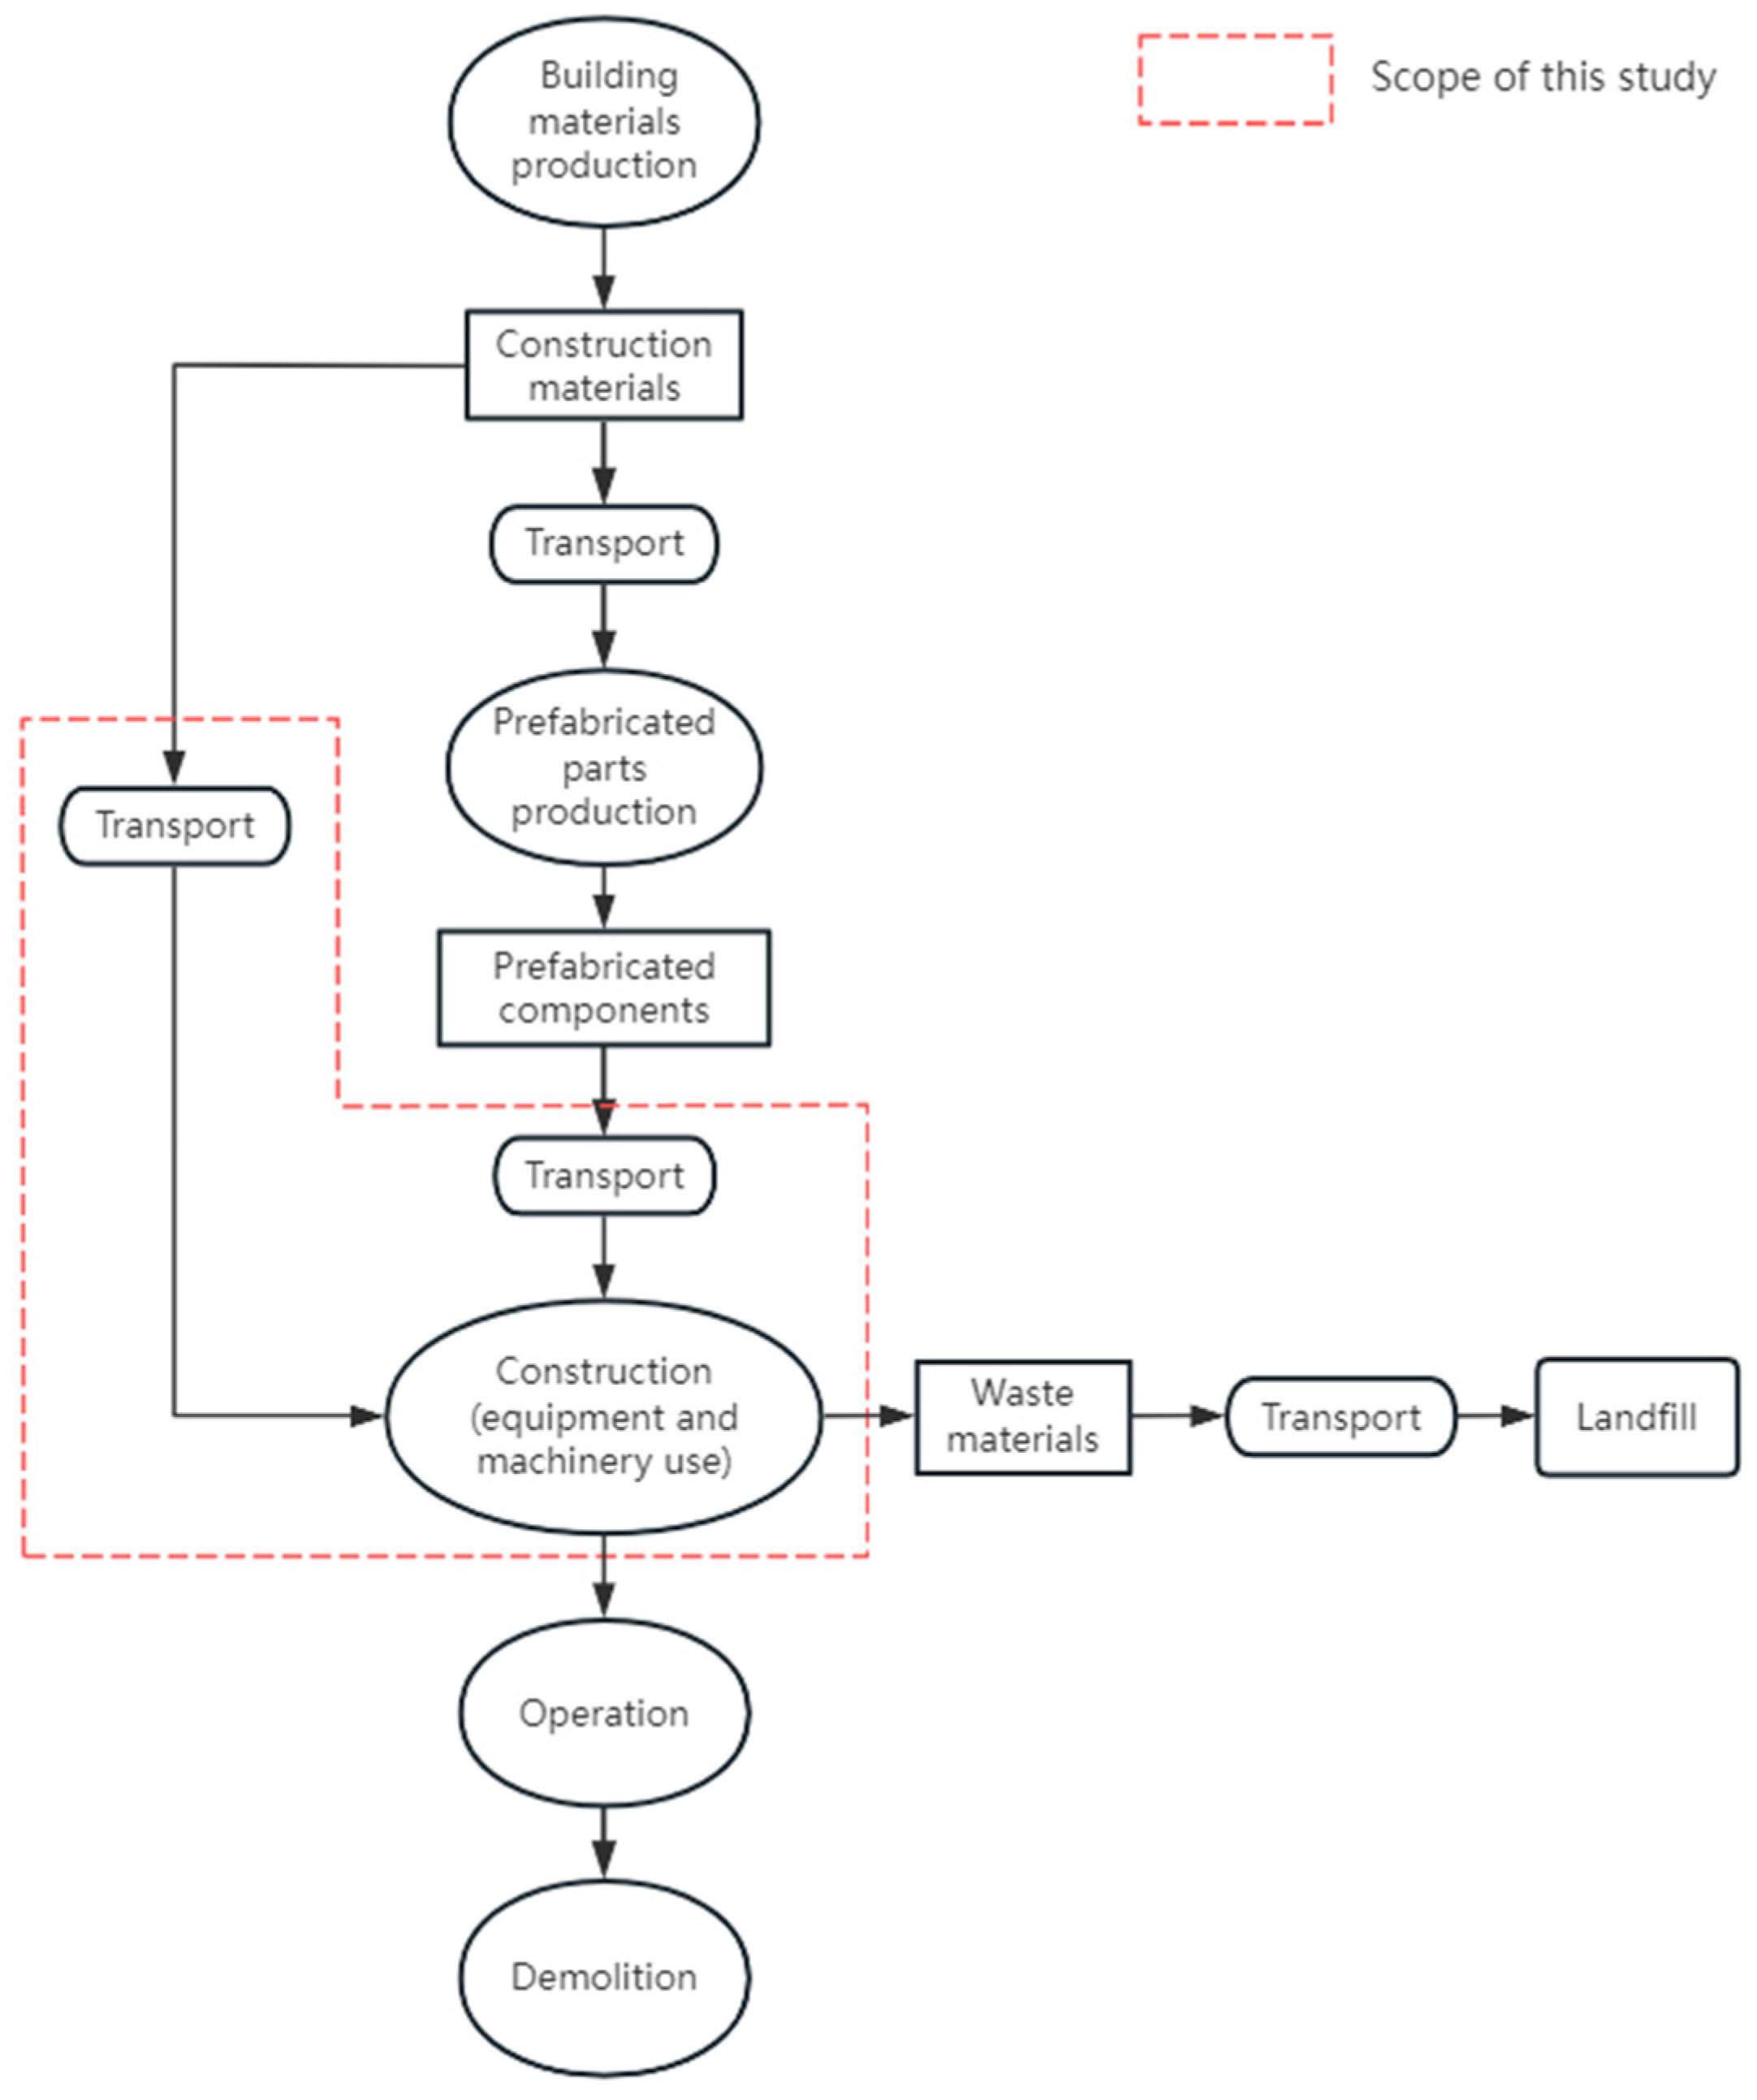
3.1.1. Scope of Carbon Emission Quantification
3.1.2. Carbon Emission Quantification Model—Actual Emission
- is the actual carbon emission intensity of transportation phase, in ;
- is the actual weight of the ith type of building material or prefabricated component, in tons;
- is the actual transportation distance of the ith type of building material or prefabricated component, in km;
- is the carbon emission factor of unit weight transportation distance of the ith type of building material or prefabricated component under actual transportation mode, in ;
- is building construction area as in design drawing, in m2.
- is the actual carbon emission intensity of excavation and earthwork phase, in ;
- is the actual quantity of work of the ith item of excavation and earthwork, in m3;
- is the actual number of machine shift of the jth type of machinery for the ith item of excavation and earthwork, in No. of shift per m3;
- is the energy consumption per unit shift of the jth type of machinery, in kg/shift;
- is the carbon emission factor of ith type of energy, in or ;
- is building construction area as in design drawing, in m2.
- is the actual carbon emission intensity of pile work phase, in ;
- is the actual quantity of work of the ith item in of the pile work, in m3 or in tons;
- is the actual number of machine shift of the jth type of machinery for the ith item of pile work, in No. of shift per m3;
- is the energy consumption per unit shift of the jth type of machinery, in kg/shift;
- is the carbon emission factor of ith type of energy, in or ;
- is building construction area as in design drawing, in m2.
3.1.3. Carbon Emission Quantification Model—Baseline Emission
- is the baseline carbon emission intensity of transportation phase, in ;
- is the weight of the ith type of building material or prefabricated component obtained from construction quota, in tons;
- is the baseline transportation distance of the ith type of building material or prefabricated component, in km;
- is the carbon emission factor of unit weight transportation distance of the ith type of building material or prefabricated component under baseline transportation mode, in ;
- is building construction area as in design drawing, in m2.
- is the baseline carbon emission intensity of excavation and earthwork phase, in ;
- is the quantity of work of the ith item of excavation and earthwork as listed in construction quotas, in m3;
- is the number of machine shift of the jth type of machinery for the ith item of excavation and earthwork as listed in construction quotas, in No. of shift per m3;
- is the energy consumption per unit shift of the jth type of machinery as listed in construction quotas, in kg/shift;
- is the carbon emission factor of ith type of energy, in or ;
- is building construction area as in design drawing, in m2.
- is the baseline carbon emission intensity of pile work phase, in ;
- is the quantity of work of the ith item of pile work as listed in construction quotas, in m3;
- is the number of machine shift of the jth type of machinery for the ith item of pile work as listed in construction quotas, in No. of shift per m3;
- is the energy consumption per unit shift of the jth type of machinery as listed in construction quotas, in kg/shift;
- is the carbon emission factor of ith type of energy, in or ;
- is building construction area as in design drawing, in m2.
3.2. Carbon Emission Performance Value of Foundation Construction (P)
- P is the carbon emission performance values;
- E’ is the carbon emission baseline values calculated based on local construction quotas;
- E is the actual carbon emission value calculated based on the actual activity data of a specific construction project.
3.3. Comprehensive Carbon Emission Evaluation via the Entropy–TOPSIS Method
- Step 1. Establish the initial matrix.
- X is the carbon emission performance values (P);
- i is the ith evaluation object (i = 1, 2, 3, … m);
- j is the jth indicator of the ith evaluation object, (j = 1, 2, 3, … n).
- Step 2. Normalize the raw data and set the positive indicators
- is the standardized value of the carbon emission performance values (P);
- is the maximum carbon emission performance values (P);
- is the minimum carbon emission performance values (P).
- Step 3. Calculate the weights (W) of indicators
- is the weighting matrix of the normalized carbon emission performance values (P);
- is the entropy value of each indicator;
- is the weights of each indicator.
- Step 4. Calculate the positive and negative ideal solutions
- V is the standardized decision matrix with weighted evaluation objects;
- is the weighted evaluation objects;
- is the positive ideal solution of the data set;
- is the negative ideal solution of the data set.
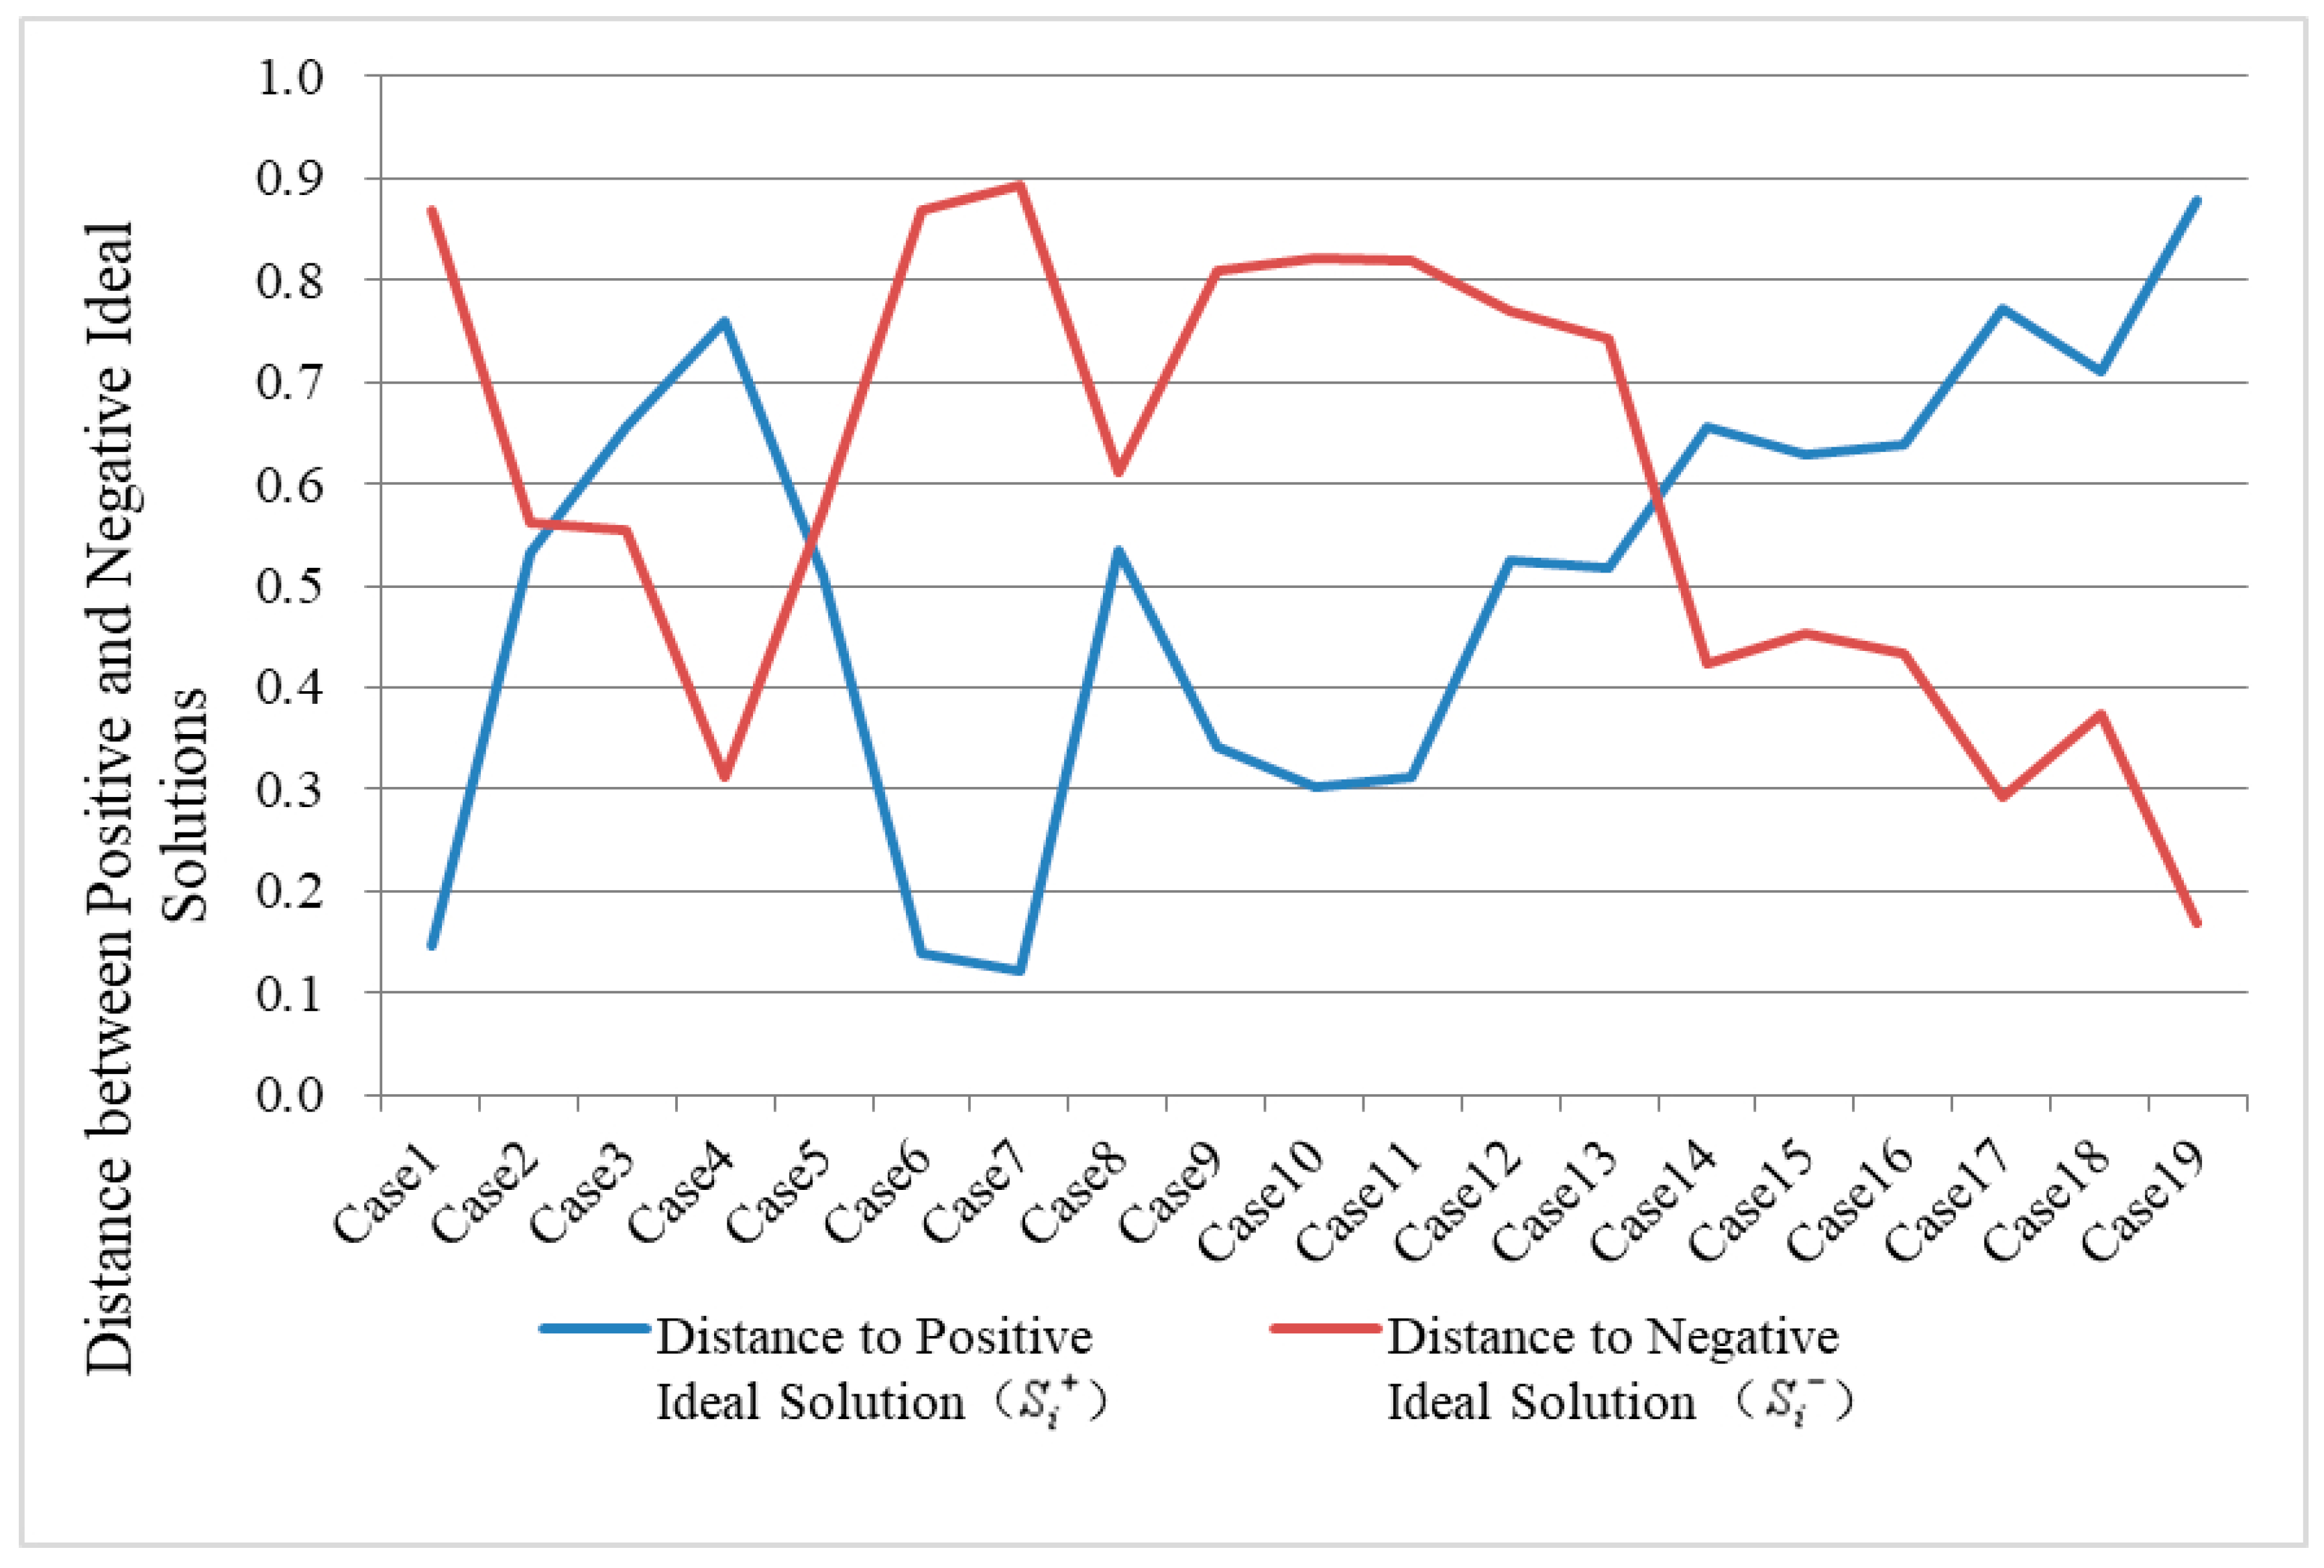
- Step 5. Calculate the distance between each object and the positive/negative ideal solutions
- is the distance between each evaluation indicator and the positive ideal solution;
- is the distance between each evaluation indicator and the negative ideal solution.
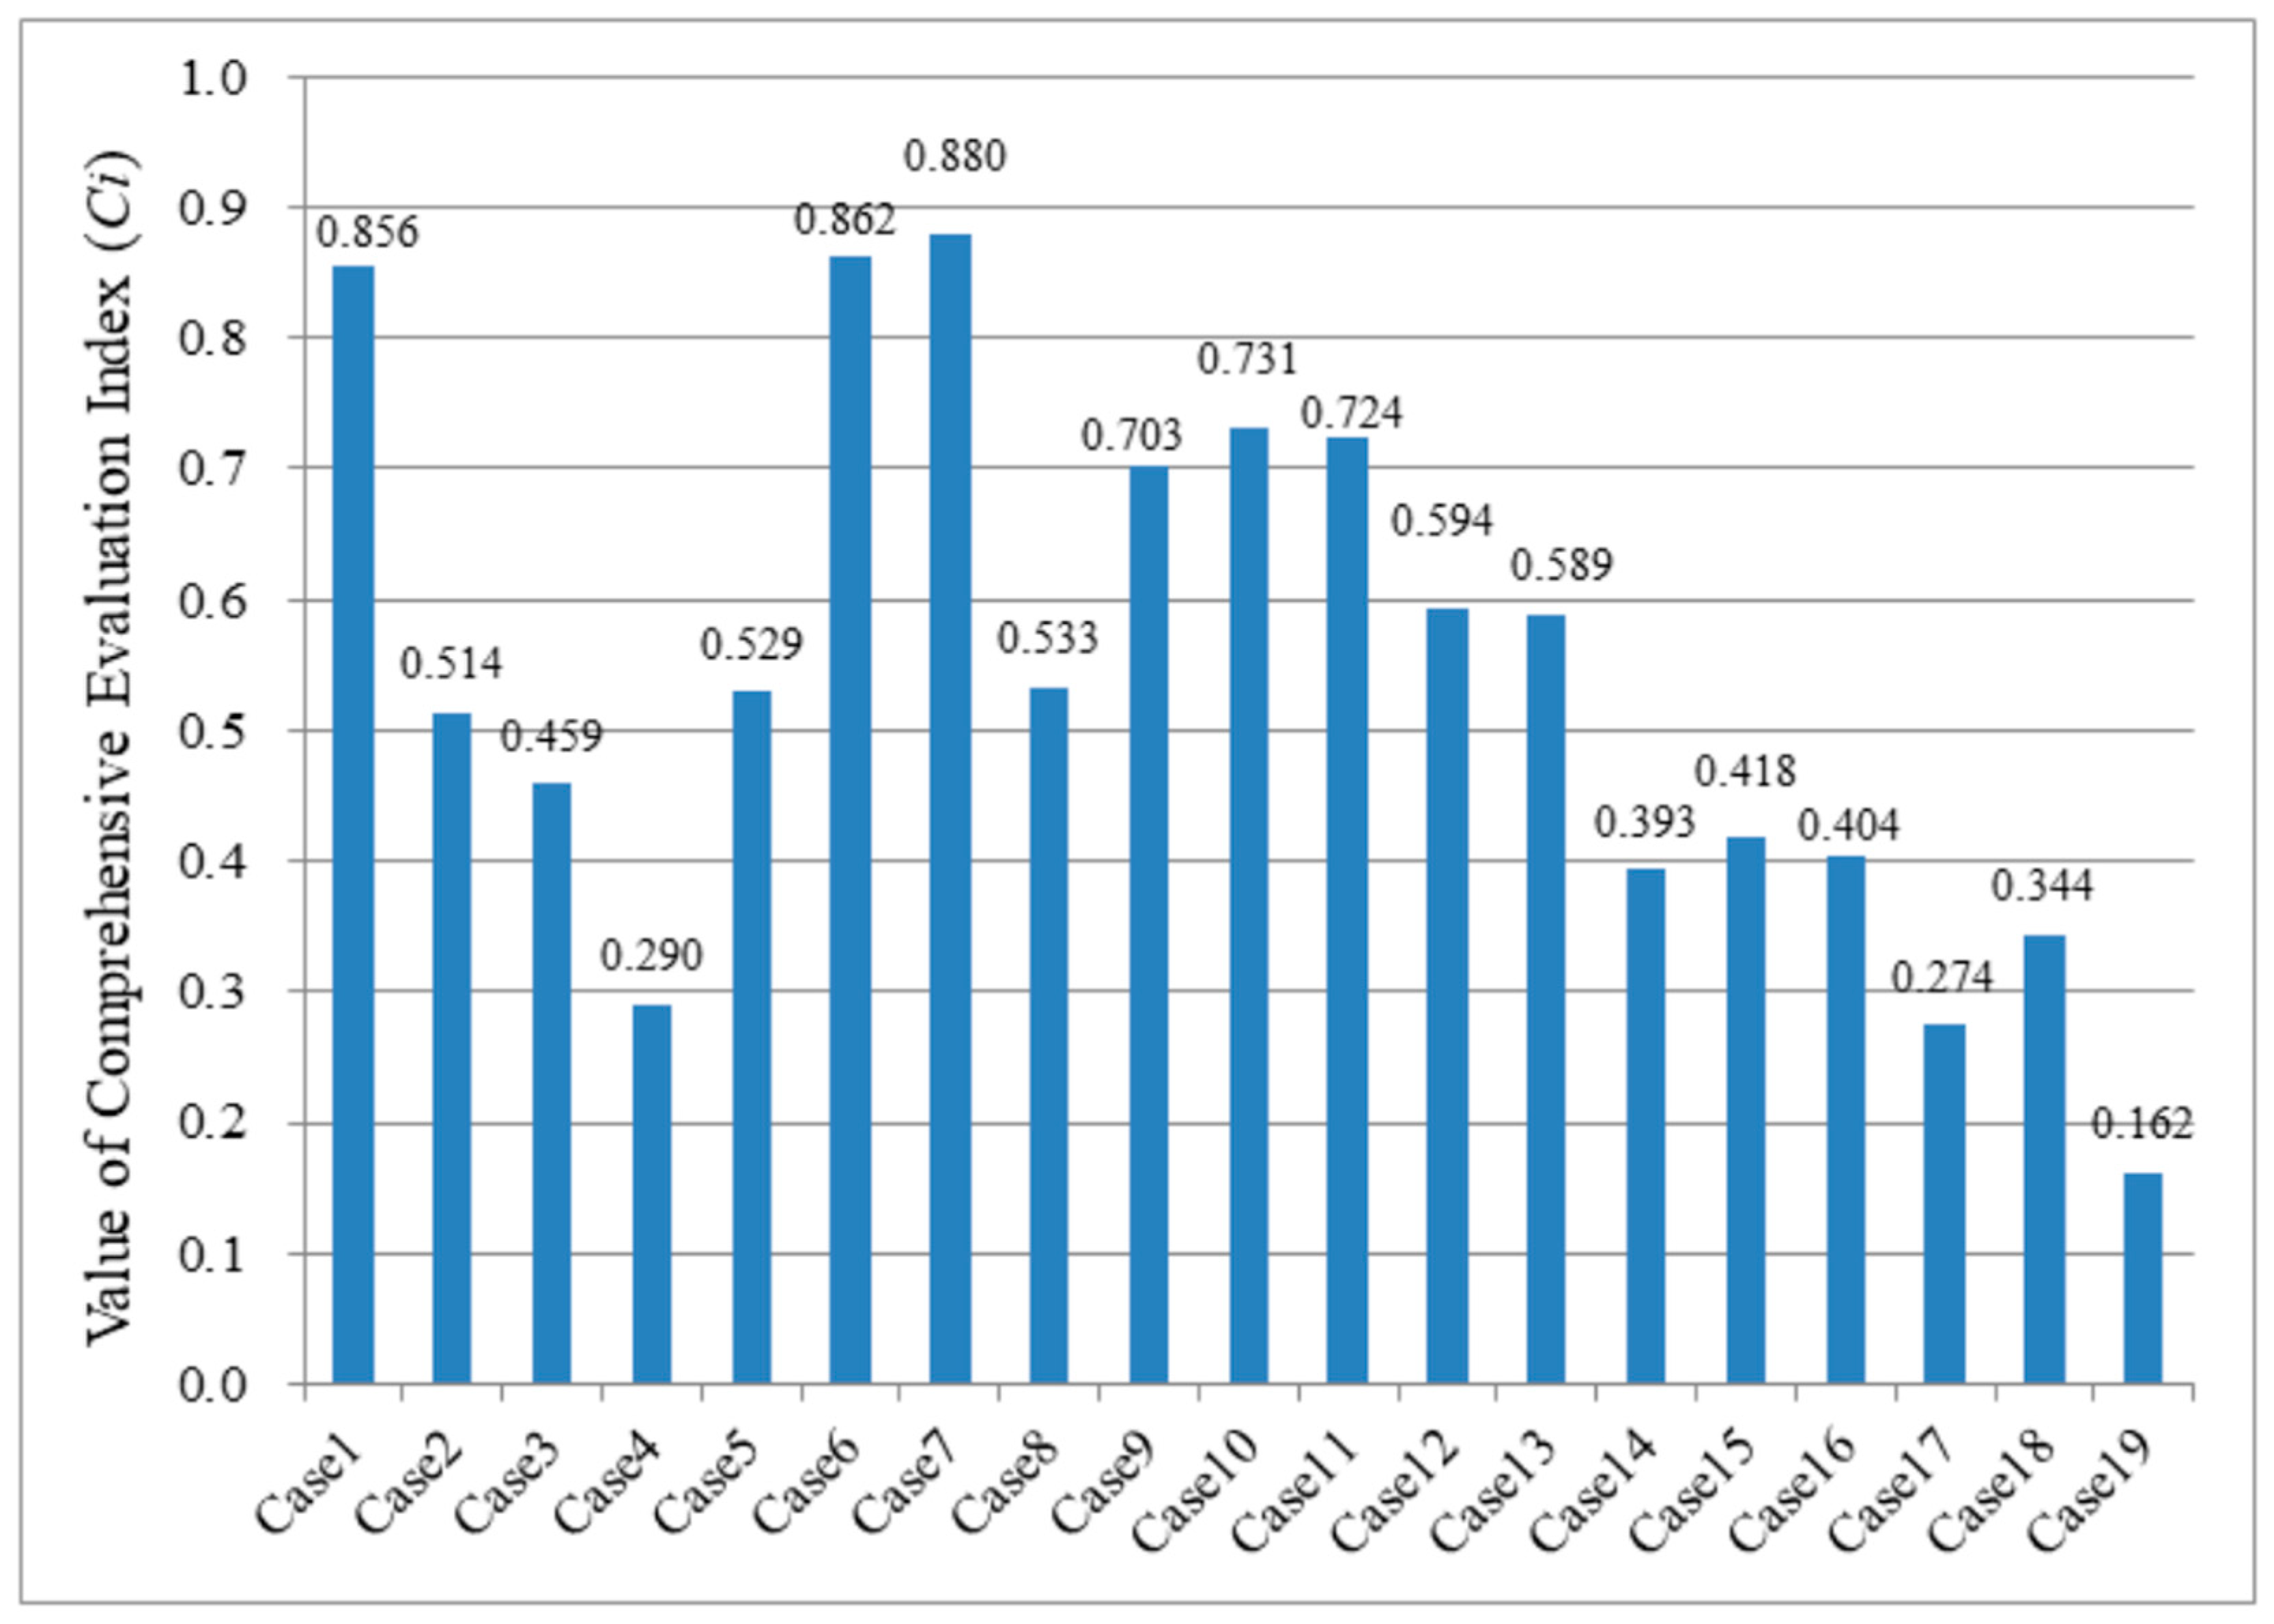
- Step 6. Obtain the comprehensive evaluation index of each evaluation object
- is the comprehensive evaluation index.
3.4. Classifying the Carbon Emission Performance via the K-Means Theory
- Step 1. Use the elbow method to continuously change and determine the number of clusters, K.
- Step 2. Randomly select K number of initial centroids of data, i.e., the comprehensive evaluation index matrix (Ci).
- Step 3. Use the Euclidean distance as the similarity criterion, calculate the sum of squares to each centroid, and calculate the distance between each data point and the initial centroids using Equation (19).
- is the distance between each datum and the initial centroids;
- is the comprehensive evaluation index of the relative proximity of the i-th plan;
- is the comprehensive evaluation index of the k-th centroid.
- Step 4. Group the data according to the distance to a certain centroid. If a data point is closest to a certain centroid, then it belongs to that cluster.
- Step 5. Search for new centroids based on the average distance of each cluster.
- Step 6. Repeat Step 3 to calculate the distance between the data points to the newly selected centroids. Then, repeat Steps 4 and 5 until no data points are newly assigned to a cluster.
4. Case Study
4.1. Quantifying the Carbon Emission of Foundation Construction
4.1.1. Transportation-Phase Carbon Emission
Actual Transportation Phase Carbon Emission
Baseline Carbon Emission of the Transportation Phase
4.1.2. Excavation-and-Earthwork-Phase Carbon Emission
Actual Excavation-and-Earthwork-Phase Carbon Emission
Baseline Carbon Emission of the Excavation and Earthwork Phase
4.1.3. Pile-Work-Phase Carbon Emission
Actual Carbon Emission of the Pile Work Phase
Baseline Carbon Emission of Pile Work Phase
4.2. Calculating the Carbon Emission Performance Values (P) of Different Phases
4.3. Comprehensive Evaluation of Carbon Emission via the Entropy–TOPSIS Method
4.4. Classifying Carbon Emission Performance via the K-Means Theory
5. Discussion
5.1. Carbon Emission Hotspots
5.2. Impact of Assigning Weights to Different Construction Phases
- is the Spearman’s rank coefficient of correlation;
- is the difference between the ranks;
- is the number of elements in the ranking.
- is the Kendall rank correlation coefficient;
- is the number of compatible pairs;
- is the number of non-compliant pairs;
- is the number of elements in the ranking.
- WS is the Wojciech Sałabun coefficient of rankings similarity;
- is the place in the ranking for the i-th element in respectively ranking x;
- is the place in the ranking for the i-th element in respectively ranking y;
- is the number of elements in the ranking.
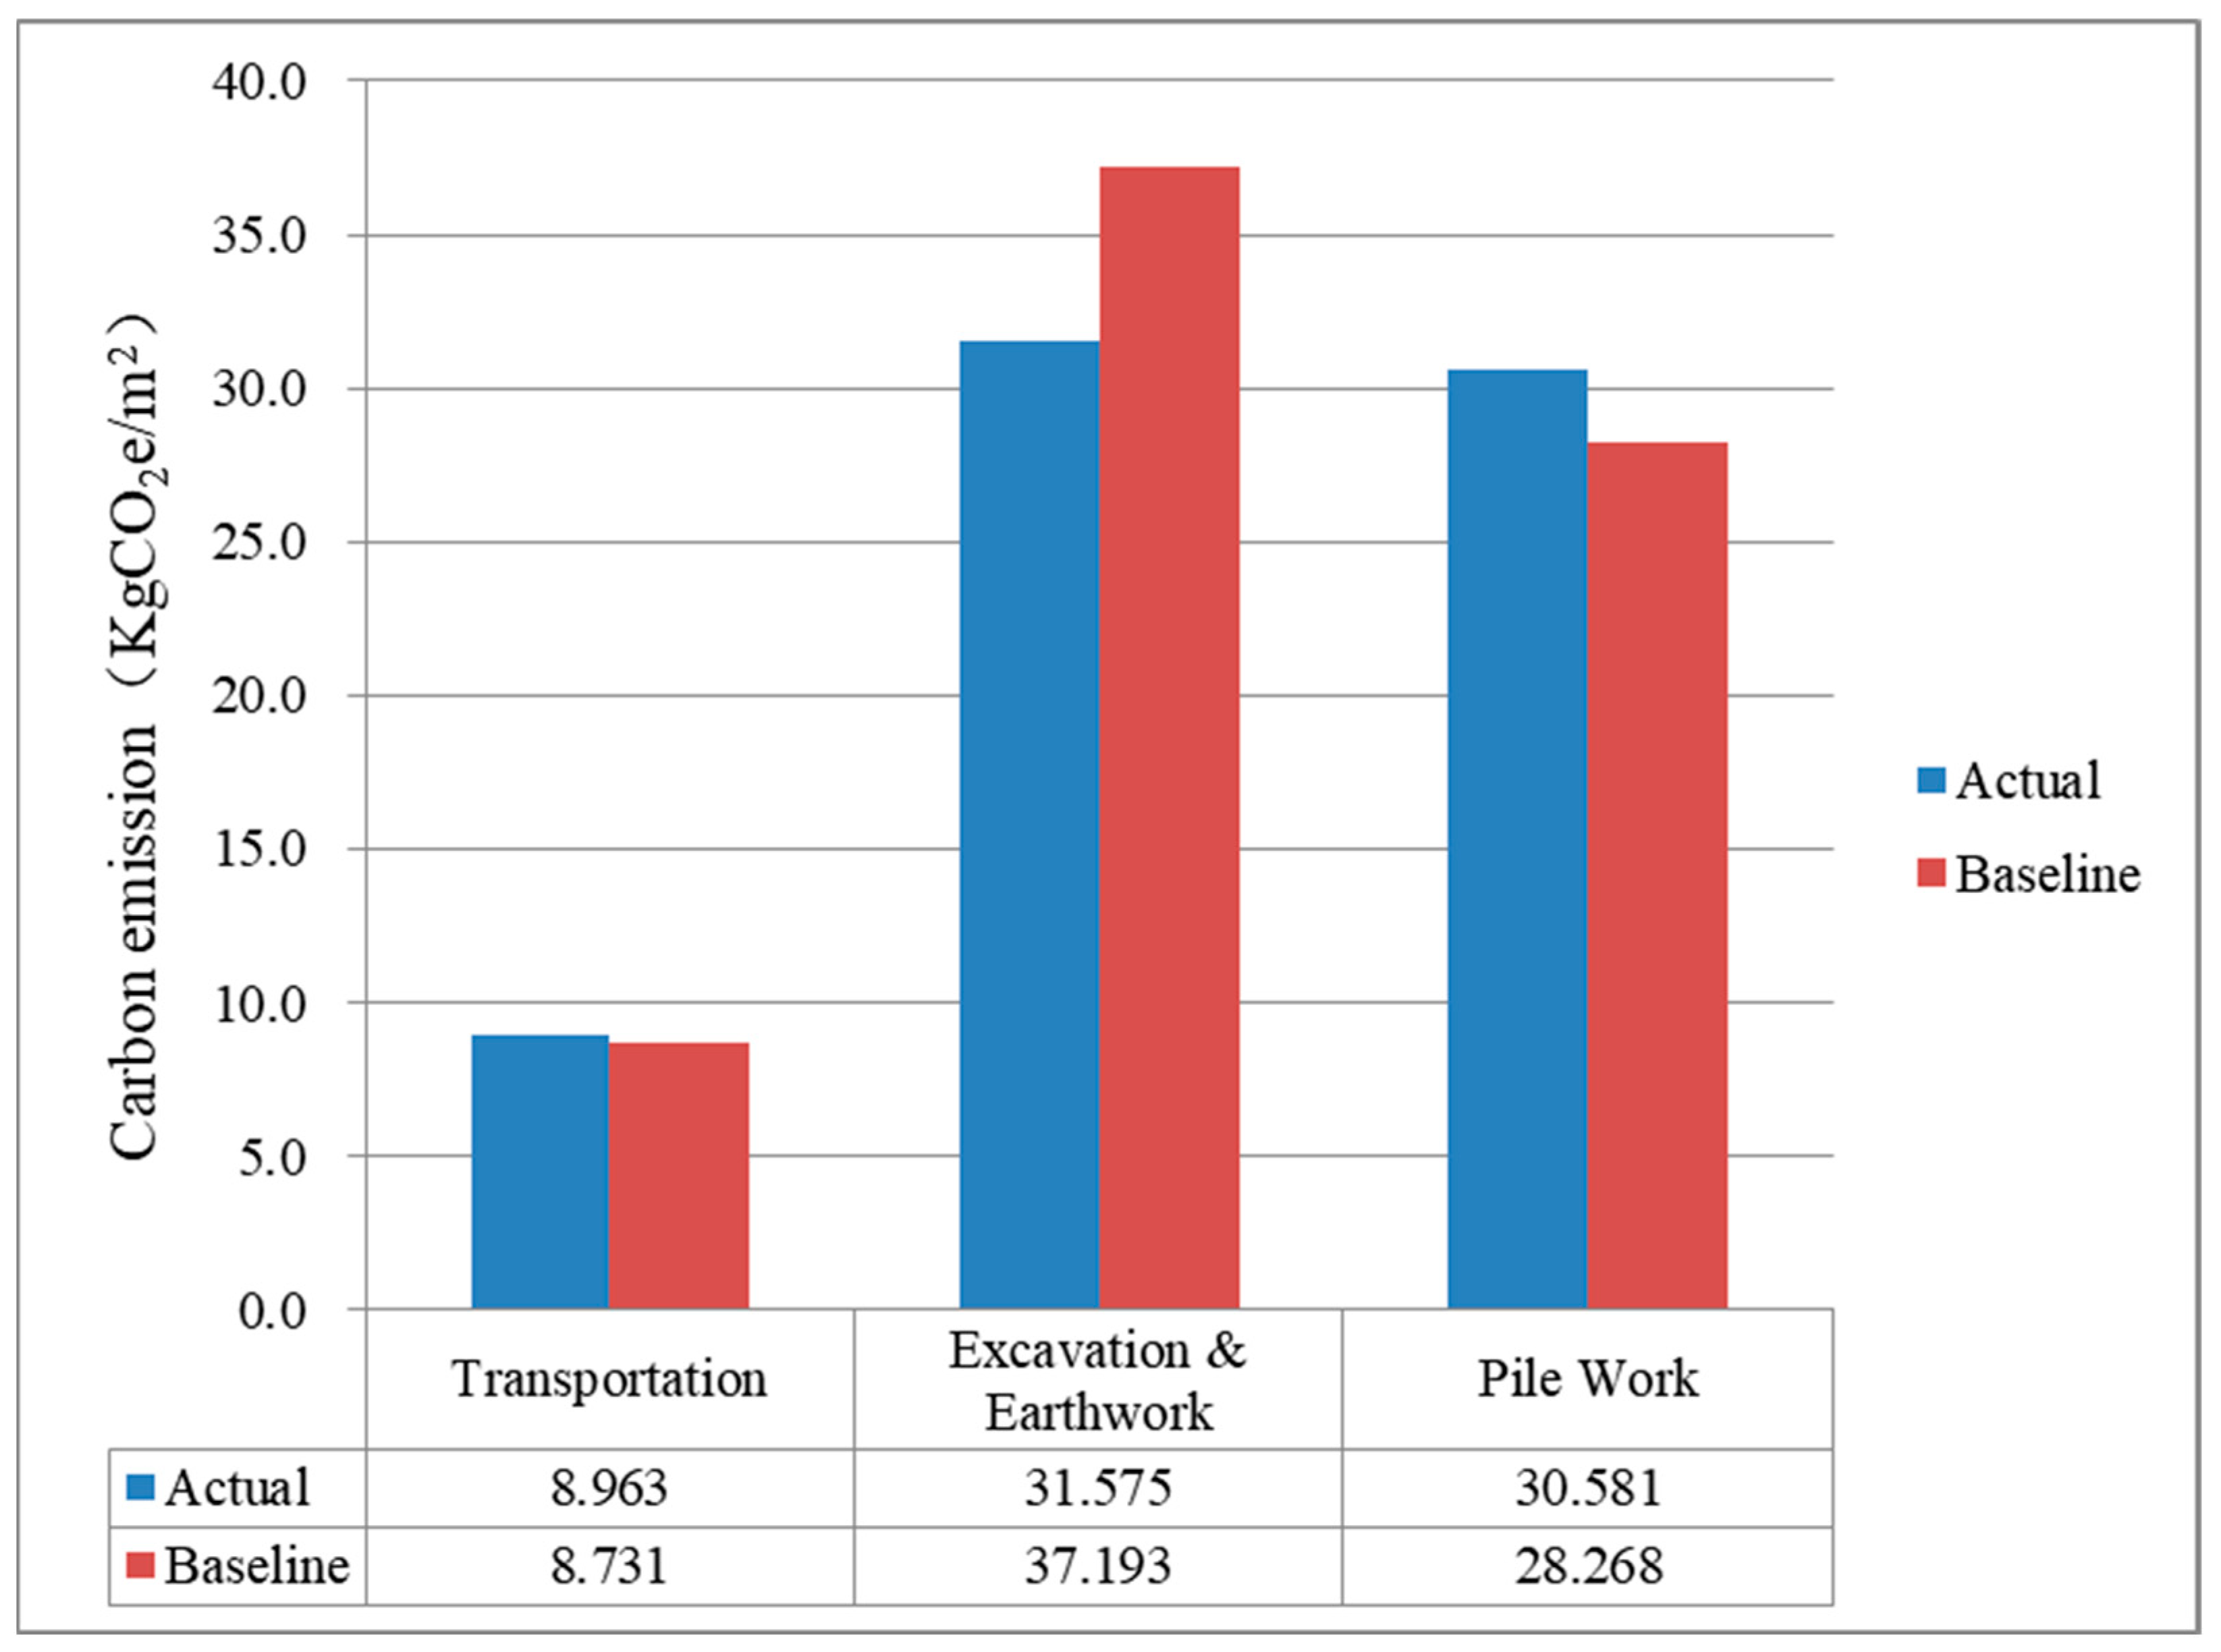
5.3. Significance of Baseline Carbon Emission
6. Conclusions and Future Research
- (1)
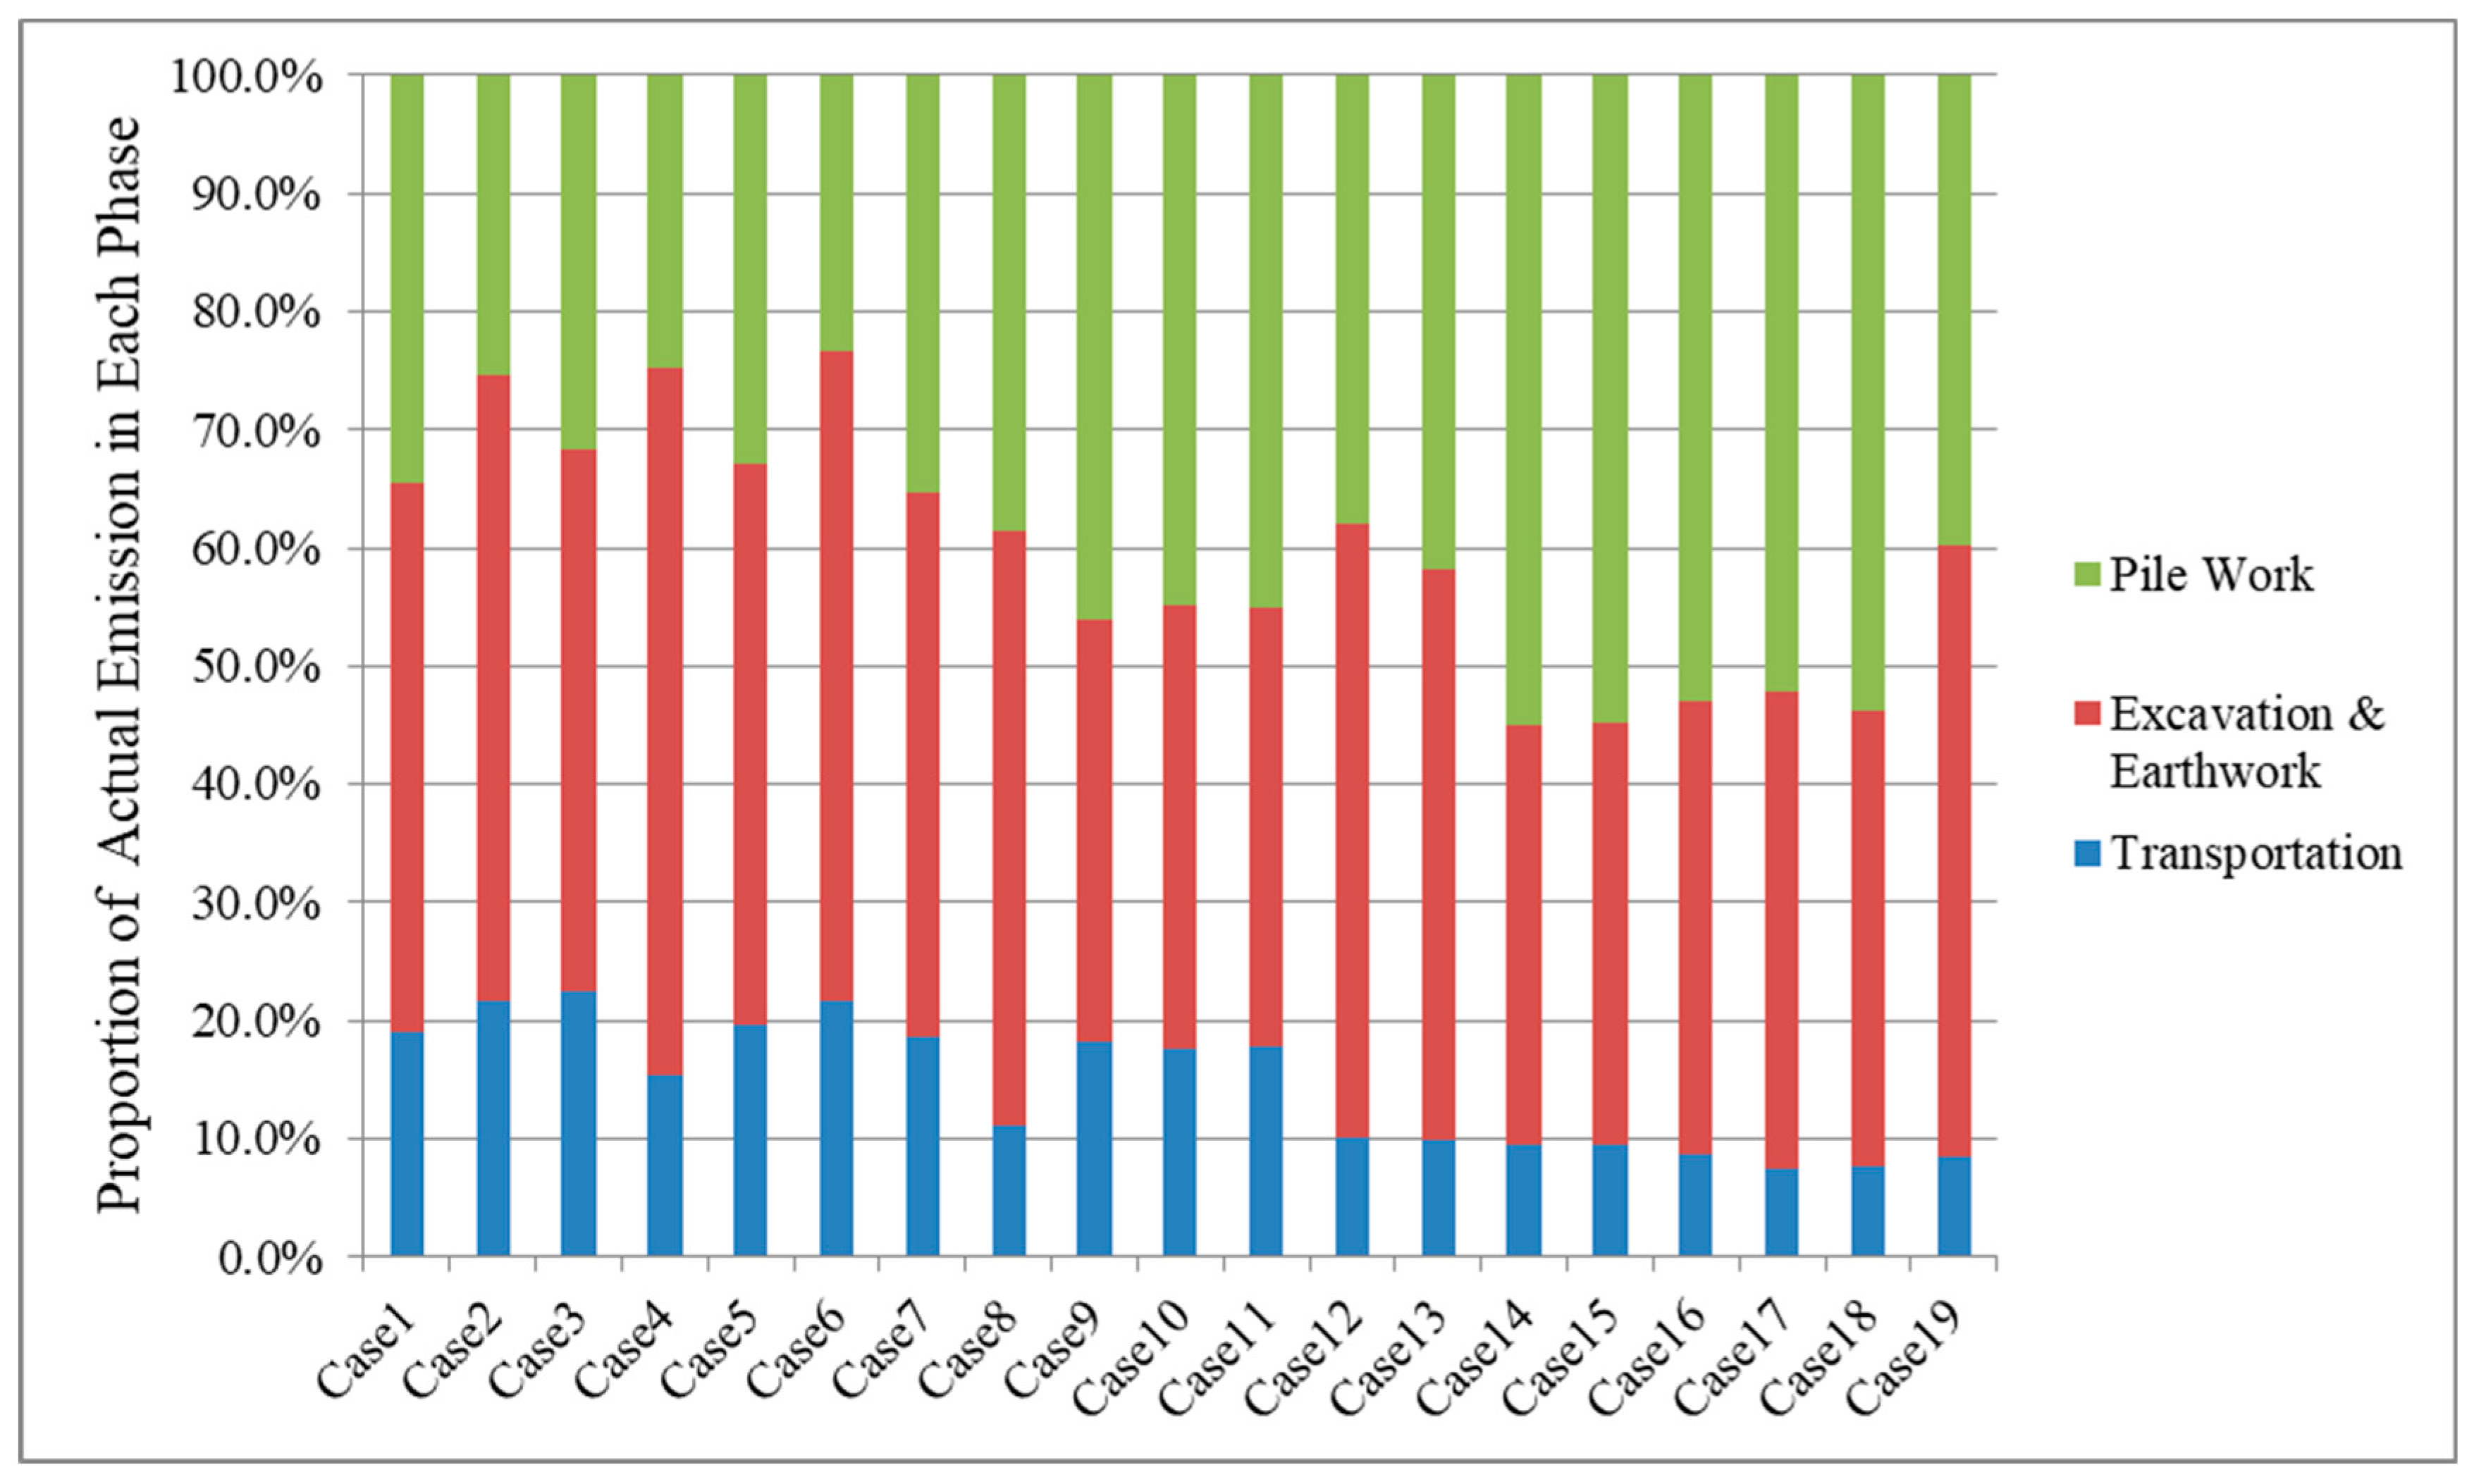
- The average proportions of the actual carbon emission of the 19 cases during the transportation, excavation and earthwork, and pile work phases were 14.42%, 44.98%, and 40.60%, respectively. It indicated excavation and earthwork phase emitted the greatest amount of carbon.
- (2)
- The top five activities generating the highest carbon emission accounted for 70.25% of the total carbon emission. Therefore, they were the emission hotspots that require proper carbon reduction measures.
- (3)
- The carbon emission performance values of the 19 cases ranged from 0.479 to 1.918, indicating that their carbon emission performances varied significantly and hence required different carbon management strategies.
- (4)
- The weights of the three foundation construction phases were Wt = 27.66%, We = 42.36%, and Wp = 29.99%, respectively. It indicates the carbon emission of the excavation and earthwork phase had the greatest impact on the final evaluation results.
- (5)
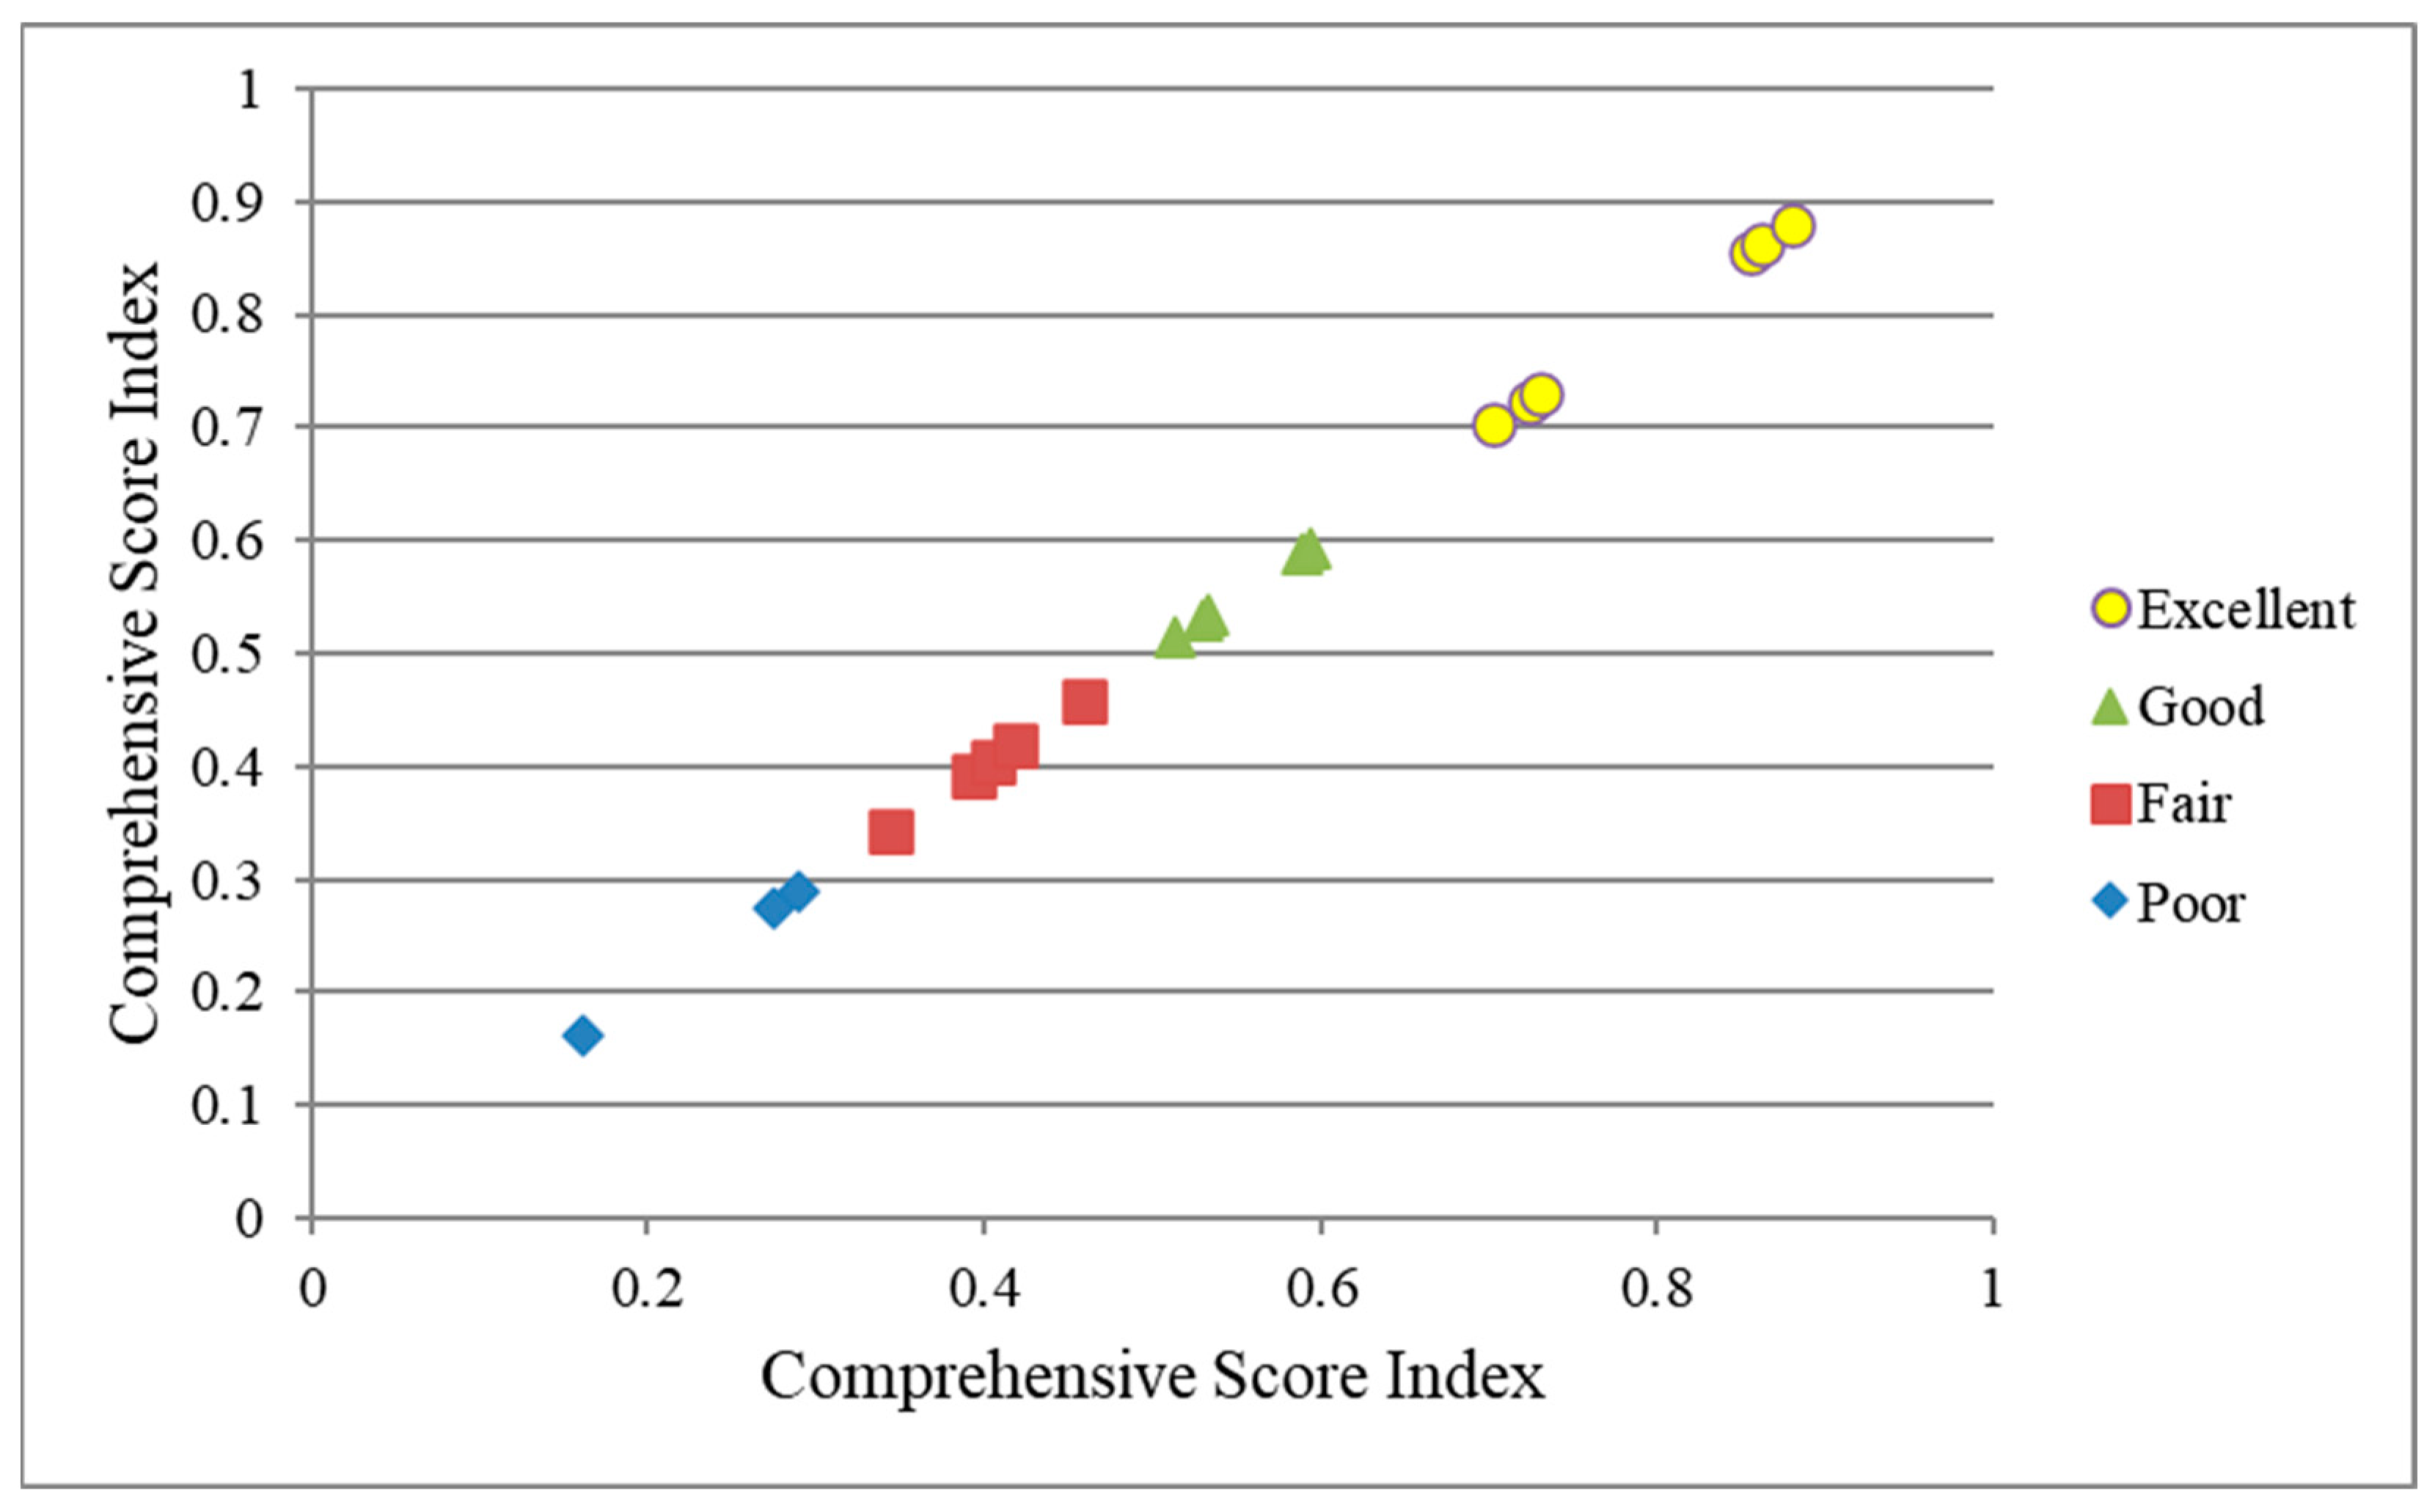
- The 19 cases were classified into four carbon emission levels. Six cases were rated “Excellent”, accounting for 31.58% of all cases; five cases were rated “Good”, accounting for 26.32%; five cases were rated “Fair”, accounting for 26.32%; and three cases were rated “Poor”, accounting for 15.79%.
- (6)
- The results indicated that the proposed method can be used to scientifically evaluate and rate the carbon emission performance of the foundation construction process.
Author Contributions
Funding
Institutional Review Board Statement
Informed Consent Statement
Data Availability Statement
Acknowledgments
Conflicts of Interest
Appendix A

| Case | Distance to the Positive Ideal Solution () | Distance to the Negative Ideal Solution () | Comprehensive Evaluation Index (Ci) |
|---|---|---|---|
| Case 1 | 0.146 | 0.868 | 0.856 |
| Case 2 | 0.532 | 0.562 | 0.514 |
| Case 3 | 0.656 | 0.556 | 0.459 |
| Case 4 | 0.759 | 0.311 | 0.290 |
| Case 5 | 0.510 | 0.573 | 0.529 |
| Case 6 | 0.139 | 0.868 | 0.862 |
| Case 7 | 0.122 | 0.893 | 0.880 |
| Case 8 | 0.535 | 0.611 | 0.533 |
| Case 9 | 0.341 | 0.808 | 0.703 |
| Case 10 | 0.303 | 0.822 | 0.731 |
| Case 11 | 0.313 | 0.820 | 0.724 |
| Case 12 | 0.526 | 0.769 | 0.594 |
| Case 13 | 0.517 | 0.742 | 0.589 |
| Case 14 | 0.655 | 0.425 | 0.393 |
| Case 15 | 0.629 | 0.452 | 0.418 |
| Case 16 | 0.637 | 0.433 | 0.404 |
| Case 17 | 0.772 | 0.292 | 0.274 |
| Case 18 | 0.711 | 0.373 | 0.344 |
| Case 19 | 0.880 | 0.170 | 0.162 |
| Case | Total Carbon Emission (kgCO2e) | Transportation | Excavation and Earthwork | Pile Work |
|---|---|---|---|---|
| Case 1 | 63,970.72 | 19.66% | 47.54% | 32.80% |
| Case 2 | 40,438.6 | 21.73% | 52.88% | 25.39% |
| Case 3 | 34,698.71 | 22.37% | 45.87% | 31.75% |
| Case 4 | 54,829.45 | 15.42% | 59.74% | 24.84% |
| Case 5 | 43,367.29 | 21.59% | 55.02% | 23.39% |
| Case 6 | 66,743.64 | 18.96% | 46.61% | 34.43% |
| Case 7 | 68,415.89 | 18.50% | 46.14% | 35.36% |
| Case 8 | 106,670.7 | 11.18% | 50.16% | 38.66% |
| Case 9 | 47,686.7 | 18.19% | 35.71% | 46.10% |
| Case 10 | 43,809.85 | 17.67% | 37.38% | 44.94% |
| Case 11 | 43,600.63 | 17.79% | 37.23% | 44.98% |
| Case 12 | 117,693.3 | 10.03% | 51.93% | 38.05% |
| Case 13 | 130,257.6 | 9.85% | 48.37% | 41.77% |
| Case 14 | 79,026.41 | 9.54% | 35.41% | 55.05% |
| Case 15 | 82,592.66 | 9.37% | 35.77% | 54.86% |
| Case 16 | 102,763.7 | 8.59% | 38.34% | 53.07% |
| Case 17 | 112,013.4 | 7.41% | 40.38% | 52.21% |
| Case 18 | 123,274.2 | 7.61% | 38.50% | 53.89% |
| Case 19 | 70,820.97 | 8.47% | 51.67% | 39.87% |
| Average: | 14.42% | 44.98% | 40.60% |
References
- 2021 Global Status Report for Buildings and Construction. Available online: https://www.unep.org/zh-hans/resources/baogao/2021quanqiujianzhuhejianzaoyezhuangkuangbaogao (accessed on 19 October 2024).
- China Association of Building Energy Efficiency. China Building Energy Conservation Association. Research report on China building energy consumption and carbon emissions (2023). Constr. Archit. 2024, 2, 46–59. (In Chinese) [Google Scholar]
- Wang, S.; Guo, Y.; Zhang, H.; Gao, M. A Life-Cycle Carbon Emissions Evaluation Model for Traditional Residential Houses: Applying to Traditional Dong Dwellings in Qandongnan, Guizhou Province, China. Sustainability 2023, 15, 13468. [Google Scholar] [CrossRef]
- Liu, K.; Leng, J. Quantified CO2-Related Indicators for Green Building Rating Systems in China: Comparative Study with Japan and Taiwan. Indoor Built Environ. 2021, 30, 763–776. [Google Scholar] [CrossRef]
- Wang, K.; Ma, Y. Research on Green Building Evaluation System based on Building Carbon Emission Analysis. Energy Conserv. 2021, 40, 75–77. (In Chinese) [Google Scholar]
- Liu, K.; Leng, J. Comparative Study on CO2 Reduction Indicators of Green Building Assessment Systems in Asia. Archit. Tech. 2020, 7, 14–17. (In Chinese) [Google Scholar]
- Hu, M.; Esram, N.W. The Status of Embodied Carbon in Building Practice and Research in the United States: A Systematic Investigation. Sustainability 2021, 13, 12961. [Google Scholar] [CrossRef]
- Yu, M.; Robati, M.; Oldfield, P.; Wiedmann, T.; Crawford, R.; Nezhad, A.A.; Carmichael, D. The Impact of Value Engineering on Embodied Greenhouse Gas Emissions in the Built Environment: A Hybrid Life Cycle Assessment. Build. Environ. 2020, 168, 106452. [Google Scholar] [CrossRef]
- Ng, S.T.; Chen, Y.; Wong, J.M.W. Variability of Building Environmental Assessment Tools on Evaluating Carbon Emissions. Environ. Impact Assess. Rev. 2013, 38, 131–141. [Google Scholar] [CrossRef]
- Lin, S. 2019 National Construction Industry Development Big Data Analysis Report. Constr. Archit. 2020, 13, 12–23. (In Chinese) [Google Scholar]
- Fang, Y.; Ng, S.T.; Ma, Z.; Li, H. Quota-Based Carbon Tracing Model for Construction Processes in China. J. Clean. Prod. 2018, 200, 657–666. [Google Scholar] [CrossRef]
- Hamza, O.; Abogdera, A.; Zoras, S. Emissions-Based Options Appraisal for Modular Building Foundations: A Case Study. Eng. Sustain. 2024, 177, 162–173. [Google Scholar] [CrossRef]
- Minunno, R.; O’Grady, T.; Morrison, G.M.; Gruner, R.L. Exploring Environmental Benefits of Reuse and Recycle Practices: A Circular Economy Case Study of a Modular Building. Resour. Conserv. Recycl. 2020, 160, 104855. [Google Scholar] [CrossRef]
- Jayawardana, J.; Sandanayake, M.; Jayasinghe, J.A.S.C.; Kulatunga, A.K.; Zhang, G.A. Comparative Life Cycle Assessment of Prefabricated and Traditional Construction—A Case of a Developing Country. J. Build. Eng. 2023, 72, 106550. [Google Scholar] [CrossRef]
- Lin, L.; Yin, X.; Zhong, S.; Lin, K.; Huang, Y.; Feng, W. Carbon Emissions of Operation Stage of Residential Buildings in Hot Summer and Warm Winter Zone in China. In Proceedings of the International Conference on Construction and Real Estate Management 2022, Online, 17–18 December 2022; pp. 227–235. [Google Scholar] [CrossRef]
- Zhu, B.; Liu, G. The Development Model of Sustainable Campus Based on Green Buildings: A Systematic Comparative Study between Japan and China. Eng. Constr. Archit. Manag. 2023. [Google Scholar] [CrossRef]
- Cao, Y.; Xu, C.; Kamaruzzaman, S.N.; Aziz, N.M. A Systematic Review of Green Building Development in China: Advantages, Challenges and Future Directions. Sustainability 2022, 14, 12293. [Google Scholar] [CrossRef]
- Zhang, Y.; Wang, J.; Hu, F.; Wang, Y. Comparison of Evaluation Standards for Green Building in China, Britain, United States. Renew. Sustain. Energy Rev. 2017, 68, 262–271. [Google Scholar] [CrossRef]
- GB/T 51366-2019; Standard for Building Carbon Emission Calculation. National Standard: Beijing, China, 2019.
- GB/T 50378-2019; Assessment Standard for Green Building. National Standard: Beijing, China, 2019.
- GB/T 50640-2010; Evaluation Standard for Green Construction of Building. National Standard: Beijing, China, 2010.
- Dubey, M.K.; Raj, V.; Kumar, M.; Garg, V. Need for Rating System for Assessing Sustainability of Built Environment during Construction Stage. Total Environ. Res. Themes 2023, 7, 100061. [Google Scholar] [CrossRef]
- Ma, Q.; Lu, L.; Li, Q.; Wang, Z. Green Construction Grade Evaluation of Large Channels Based on Uncertain AHP-Multidimensional Cloud Model. Sustainability 2022, 14, 6143. [Google Scholar] [CrossRef]
- Vyas, G.S.; Jha, K.N.; Rajhans, N.R. Identifying and Evaluating Green Building Attributes by Environment, Social, and Economic Pillars of Sustainability. Civ. Eng. Environ. Syst. 2019, 36, 133–148. [Google Scholar] [CrossRef]
- Qiao, Y.; Wang, J.; Wang, Y. Sustainability Evaluation of Green Building Construction Based on a Combination Method of Weighting and Improved Matter-Element Extension. AIMS Math. 2024, 9, 24418–24442. [Google Scholar] [CrossRef]
- Liu, L.; Zhang, Y.; Zhao, L.; Zhan, C.; Liang, C. An Attempt to Evaluate the Green Construction of Large-Scale Hydropower Projects: Taking Wudongde Hydropower Station on the Jinsha River, China as an Example. Sustainability 2022, 14, 194. [Google Scholar] [CrossRef]
- Xiao, Y.; Zhang, Y. Evaluation and Suggestions on Green Development of Shanghai Port Based on AHP and Fuzzy Comprehensive Evaluation Method. In Proceedings of the Sixth International Conference on Electromechanical Control Technology and Transportation (ICECTT 2021), Chongqing, China, 14–16 May 2021; Volume 12081. [Google Scholar]
- Wang, Q.; Kang, X.; Nian, C. Research on Green Construction Evaluation of Prefabricated Buildings based on Grey Clustering. Eng. J. Wuhan Univ. 2023, 56, 567–574. (In Chinese) [Google Scholar] [CrossRef]
- An, M.; Liu, M.; Wu, H. Study on the Influence of Prefabricated Building Demonstration City Policy on Carbon Emission in the Construction Industry. Huanjing Kexue Xuebao/Acta Sci. Circumstantiae 2024, 44, 464–476. [Google Scholar] [CrossRef]
- Zhang, X.; Wang, F. Assessment of Embodied Carbon Emissions for Building Construction in China: Comparative Case Studies Using Alternative Methods. Energy Build. 2016, 130, 330–340. [Google Scholar] [CrossRef]
- Liu, M.; Li, P.; Jia, S.; Liu, X.; Wang, H. Carbon Emissions Assessment of Civil Building during Construction Period. Constr. Sci. Technol. 2018, 19, 67–71. (In Chinese) [Google Scholar] [CrossRef]
- Wu, W.; Sun, P.; Zhou, H. The Case Study of Carbon Emission in Building Construction Process. IOP Conf. Ser. Earth Environ. Sci. 2019, 371, 022011. [Google Scholar] [CrossRef]
- Sandanayake, M.; Zhang, G.; Setunge, S. Environmental Emissions at Foundation Construction Stage of Buildings—Two Case Studies. Build. Environ. 2016, 95, 189–198. [Google Scholar] [CrossRef]
- Luo, W.; Sandanayake, M.; Zhang, G. Direct and Indirect Carbon Emissions in Foundation Construction—Two Case Studies of Driven Precast and Cast-in-Situ Piles. J. Clean. Prod. 2019, 211, 1517–1526. [Google Scholar] [CrossRef]
- Hu, H.; Li, C.; Xu, Z.; Gui, Y.; Zong, L.; Shi, J. Calculation Example of Full Cycle Carbon Emission of Super Deep Foundation Pit and Carbon Reduction Measures. Mater. Green Constr. 2023, 1, 132–145. (In Chinese) [Google Scholar]
- Li, L.; Chen, K. Quantitative Assessment of Carbon Dioxide Emissions in Construction Projects: A Case Study in Shenzhen. J. Clean. Prod. 2017, 141, 394–408. [Google Scholar] [CrossRef]
- Pujadas-Gispert, E.; Sanjuan-Delmás, D.; Josa, A. Environmental Analysis of Building Shallow Foundations: The Influence of Prefabrication, Typology, and Structural Design Codes. J. Clean. Prod. 2018, 186, 407–417. [Google Scholar] [CrossRef]
- Li, X.-J.; Zheng, Y.-D. Using LCA to Research Carbon Footprint for Precast Concrete Piles during the Building Construction Stage: A China Study. J. Clean. Prod. 2020, 245, 118754. [Google Scholar] [CrossRef]
- Wang, J.; Hou, X.; Deng, X.; Han, H.; Zhang, L. Application of BIM in Tunnel Design with Compaction Pile Reinforced Foundation Carrying Carbon Assessment Based on Advanced Dynamo Visual Programming: A Case Study in China. Sustainability 2022, 14, 16222. [Google Scholar] [CrossRef]
- Ullah, H.; Zhang, H.; Huang, B.; Gong, Y. BIM-Based Digital Construction Strategies to Evaluate Carbon Emissions in Green Prefabricated Buildings. Buildings 2024, 14, 1689. [Google Scholar] [CrossRef]
- Ding, Y.; Guo, Z.-Z.; Zhou, S.-X.; Wei, Y.-Q.; She, A.-M.; Dong, J.-L. Research on Carbon Emissions during the Construction Process of Prefabricated Buildings Based on BIM and LCA. J. Asian Archit. Build. Eng. 2024, 1–13. [Google Scholar] [CrossRef]
- Saaty, T.L. A Scaling Method for Priorities in Hierarchical Structures. J. Math. Psychol. 1977, 15, 234–281. [Google Scholar] [CrossRef]
- Hwang, C.-L.; Yoon, K.P. Multiple Attribute Decision Making: Methods and Applications—A State-of-the-Art Survey; Lecture Notes in Economics and Mathematical Systems; Springer: Berlin, Germany, 1981; Volume 186, ISBN 978-3-540-10558-9. [Google Scholar]
- Kizielewicz, B.; Sałabun, W. SITW Method: A New Approach to Re-Identifying Multi-Criteria Weights in Complex Decision Analysis. Spectr. Mech. Eng. Oper. Res. 2024, 1, 215–226. [Google Scholar] [CrossRef]
- Więckowski, J.; Kizielewicz, B.; Shekhovtsov, A.; Sałabun, W. RANCOM: A Novel Approach to Identifying Criteria Relevance Based on Inaccuracy Expert Judgments. Eng. Appl. Artif. Intell. 2023, 122, 106114. [Google Scholar] [CrossRef]
- Shekhovtsov, A.; Kizielewicz, B.; Sałabun, W. Advancing Individual Decision-Making: An Extension of the Characteristic Objects Method Using Expected Solution Point. Inf. Sci. 2023, 647, 119456. [Google Scholar] [CrossRef]
- Zhang, P.; Gao, H.; Zhang, D.; Zhou, E.; Khan, F. Charting a Sustainable Tomorrow: Advancing Urban Low-Carbon Economies through Comprehensive Evaluation and Promotion. PLoS ONE 2024, 19, e0299688. [Google Scholar] [CrossRef]
- Zou, T.; Guo, P.; Wu, Q. Applying an Entropy-Weighted TOPSIS Method to Evaluate Energy Green Consumption Revolution Progressing of China. Environ. Sci. Pollut. Res. 2023, 30, 42267–42281. [Google Scholar] [CrossRef]
- Li, M.; Sun, H.; Singh, V.P.; Zhou, Y.; Ma, M. Agricultural Water Resources Management Using Maximum Entropy and Entropy-Weight-Based TOPSIS Methods. Entropy 2019, 21, 364. [Google Scholar] [CrossRef]
- Yu, X.; Suntrayuth, S.; Carayannis, E.G.; Sindakis, S.; Showkat, S. Advancing Industrial Wastewater Treatment through Comprehensive Evaluation and Innovative Technology: A G1-Entropy Improved TOPSIS Model Approach. J. Technol. Transf. 2023. [Google Scholar] [CrossRef]
- Niroomand, N.; Bach, C.; Elser, M. Segment-Based CO2 Emission Evaluations From Passenger Cars Based on Deep Learning Techniques. IEEE Access 2021, 9, 166314–166327. [Google Scholar] [CrossRef]
- Sundaram, A.; Varghese, I.K.; RejiKumar, G. Machine Learning Approaches for Real-Time Carbon Emission Prediction and Mitigation. In Proceedings of the 2023 IEEE Technology & Engineering Management Conference: Asia Pacific (TEMSCON-ASPAC), Bengaluru, India, 14–16 December 2023; pp. 1–7. [Google Scholar]
- Wang, X. Teaching Quality Evaluation for English Grading Based on Neural Network. In Advances in Transdisciplinary Engineering; IOS Press: Amsterdam, The Netherlands, 2024; Volume 47, pp. 548–558. [Google Scholar] [CrossRef]
- Papadopoulos, S.; Kontokosta, C.E. Grading Buildings on Energy Performance Using City Benchmarking Data. Appl. Energy 2019, 233–234, 244–253. [Google Scholar] [CrossRef]
- Vera, J.F.; Angulo, J.M. An MDS-Based Unifying Approach to Time Series K-Means Clustering: Application in the Dynamic Time Warping Framework. Stoch. Environ. Res. Risk Assess. 2023, 37, 4555–4566. [Google Scholar] [CrossRef]
- Zheng, X.; Chen, Y.; Lin, C.; Zhang, W.; Zhou, X. Rating of Catering Enterprises Based on Fuzzy Hierarchy and K-Means Clustering. Int. J. Wirel. Mob. Comput. 2021, 20, 77. [Google Scholar] [CrossRef]
- Zhang, L.; Bai, X.; Chen, Y.; Wang, T.; Hu, F.; Li, M. Research on Power Market User Credit Evaluation Based on K-Means Clustering and Contour Coefficient. In Proceedings of the 2020 3rd International Conference on Robotics, Control and Automation Engineering (RCAE), Chongqing, China, 5–8 November 2020; pp. 64–68. [Google Scholar]
- Ma, Q.; Zhang, D.; Che, J.; Li, C. Research on student quality evaluation system based on K-means clustering algorithm. Comput. Program. Ski. Maint. 2023, 4, 54–56. (In Chinese) [Google Scholar] [CrossRef]
- Fang, Y.; Lu, X.; Li, H. A Random Forest-Based Model for the Prediction of Construction-Stage Carbon Emissions at the Early Design Stage. J. Clean. Prod. 2021, 328, 129657. [Google Scholar] [CrossRef]
- Department of Housing and Urban-Rural Development of Guangdong Province. Guangdong Building Construction and Decoration Engineering Comprehensive Quota (2018); National Standard: Guangdong, China, 2018. [Google Scholar]
- Ministry of Ecology and Environment and the National Bureau of Statistics. Announcement by the Ministry of Ecology and Environment and the National Bureau of Statistics on the Publish of Carbon Dioxide Emission Factors for Electricity in 2021. Available online: https://wzq1.mee.gov.cn/xxgk2018/xxgk/xxgk01/202404/t20240412_1070565.html (accessed on 10 December 2024).
- Wang, Q.-C.; Yu, S.-N.; Chen, Z.-X.; Weng, Y.-W.; Xue, J.; Liu, X. Promoting Additive Construction in Fast-Developing Areas: An Analysis of Policies and Stakeholder Perspectives. Dev. Built. Environ. 2023, 16, 100271. [Google Scholar] [CrossRef]
- Yuan, B.; Liang, J.; Huang, X.; Huang, Q.; Zhang, B.; Yang, G.; Wang, Y.; Yuan, J.; Wang, H.; Yuan, P. Eco-Efficient Recycling of Engineering Muck for Manufacturing Low-Carbon Geopolymers Assessed through LCA: Exploring the Impact of Synthesis Conditions on Performance. Acta Geotech. 2024. [Google Scholar] [CrossRef]
- Spearman, C. The Proof and Measurement of Association between Two Things. Am. J. Psychol. 1987, 100, 441–471. [Google Scholar] [CrossRef]
- Kendall, M.G. A New Measure of Rank Correlation. Biometrika 1938, 30, 81–93. [Google Scholar] [CrossRef]
- Sałabun, W.; Urbaniak, K. A New Coefficient of Rankings Similarity in Decision-Making Problems. In Computational Science—ICCS 2020; Krzhizhanovskaya, V.V., Závodszky, G., Lees, M.H., Dongarra, J.J., Sloot, P.M.A., Brissos, S., Teixeira, J., Eds.; Springer International Publishing: Cham, Switzerland, 2020; pp. 632–645. [Google Scholar]

| Material and Component | Actual Consumption Mi (t) | Transportation Distance Di (km) | Mode of Transportation | Emission Factor of Transportation Mode (kgCO2e)/(t·km) | Carbon Emission (kgCO2e) |
|---|---|---|---|---|---|
| Sand and gravel | 19.72 | 500 | Heavy diesel truck (load capacity: 30 t) | 0.078 | 769.21 |
| Concrete | 993.51 | 25 | Heavy diesel truck (load capacity: 18 t) | 0.129 | 3204.06 |
| Steel | 119.04 | 500 | Heavy diesel truck (load capacity: 30 t) | 0.078 | 4642.53 |
| Prestressed concrete pipe piles | 4617.83 | 40 | Heavy diesel truck (load capacity: 46 t) | 0.057 | 3874.54 |
| Steel pipe piles | 37.97 | 40 | Heavy diesel truck (load capacity: 46 t) | 0.057 | 86.56 |
| Total: | 12,576.90 |
| Material and Component | Actual Consumption Mi (t) | Transportation Distance Di (km) | Mode of Transportation | Emission Factor of Transportation Mode (kgCO2e)/(t·km) | Carbon Emission (kgCO2e) |
|---|---|---|---|---|---|
| Sand and gravel | 28.63 | 500 | Heavy diesel truck (load capacity: 30 t) | 0.078 | 1116.69 |
| Concrete | 364.77 | 25 | Heavy diesel truck (load capacity: 18 t) | 0.129 | 2823.33 |
| Steel | 151.34 | 500 | Heavy diesel truck (load capacity: 30 t) | 0.078 | 5902.28 |
| Prestressed concrete pipe piles | 5368.16 | 40 | Heavy diesel truck (load capacity: 46 t) | 0.057 | 4504.10 |
| Steel pipe piles | 55.42 | 40 | Heavy diesel truck (load capacity: 46 t) | 0.057 | 126.36 |
| Total: | 14,472.76 |
| Machinery | Total Working Days * | Quantity (Piece) | Unit Energy Consumption Per Machinery | Carbon Emission Factor of Energy | Carbon Emission (kgCO2e) |
|---|---|---|---|---|---|
| Crawler single-bucket hydraulic excavators | 4.69 | 8 | 78.2 (kg/d) | Diesel oil: 3.10 (kgCO2e/kg) | 9095.50 |
| Crawler bulldozers (105 kW) | 4.69 | 2 | 60.8 (kg/d) | Diesel oil: 3.10 (kgCO2e/kg) | 1767.02 |
| Dump trucks (8 t) | 7.03 | 20 | 40.9 (kg/d) | Diesel oil: 3.10 (kgCO2e/kg) | 17,843.13 |
| Sprinklers (4000 L) | 4.69 | 1 | 30.2 (kg/d) | Gasoline: 2.93 (kgCO2e/kg) | 414.76 |
| Steel wheel internal combustion rollers (6 t) | 4.69 | 1 | 12.2 (kg/d) | Diesel oil: 3.10 (kgCO2e/kg) | 177.28 |
| Electric tampers | 4.69 | 15 | 16.6 (kWh/d) | Electricity: 0.43 (kgCO2e/kWh) | 504.96 |
| Self-propelled scrapers (3 t) | 4.69 | 1 | 42.0 (kg/d) | Diesel oil: 3.10 (kgCO2e/kg) | 610.32 |
| Total: | 30,412.98 |
| Machinery | Quantity (Shift *) | Unit Energy Consumption | Carbon Emission Factor | Carbon Emission (kgCO2e) |
|---|---|---|---|---|
| Crawler bulldozers (75 kw) | 11.98 | 56.5 (kg/shift) | Diesel oil: 3.10 (kgCO2e/kg) | 2098.73 |
| Crawler single-bucket hydraulic excavators | 37.51 | 63.0 (kg/shift) | Diesel oil: 3.10 (kgCO2e/kg) | 7326.00 |
| Shovel excavators | 97.99 | 32.7 (kg/shift) | Diesel oil: 3.10 (kgCO2e/kg) | 9917.76 |
| Electric tampers | 360.22 | 16.6 (kWh/shift) | Electricity: 0.43 (kgCO2e/kWh) | 2586.78 |
| Dump trucks (15 tons) | 205.76 | 52.9 (kg/shift) | Diesel oil: 3.10 (kgCO2e/kg) | 33,759.97 |
| Total: | 55,689.23 |
| Machinery | Total Working Days * | Quantity (Piece) | Unit Energy Consumption Per Machinery | Carbon Emission Factor | Carbon Emission (kgCO2e) |
|---|---|---|---|---|---|
| Static pile presses (4500 KN) | 6.63 | 2 | 102.3 (kg/d) | Diesel oil: 3.10 (kgCO2e/kg) | 4202.82 |
| Truck cranes (25 t) | 6.63 | 2 | 40.7 (kg/d) | Diesel oil: 3.10 (kgCO2e/kg) | 1674.14 |
| Walking electric pile drivers (45 kw) | 6.63 | 1 | 309.5 (kWh/d) | Electricity: 0.43 (kgCO2e/kWh) | 887.69 |
| Rotary excavators (1000 mm) | 5.25 | 2 | 146.6 (kg/d) | Diesel oil: 3.10 (kgCO2e/kg) | 4770.22 |
| Crawler cranes (40 t) | 5.25 | 2 | 63.5 (kg/d) | Diesel oil: 3.10 (kgCO2e/kg) | 2068.09 |
| Crawler single-bucket hydraulic excavators | 5.25 | 6 | 63.0 (kg/d) | Diesel oil: 3.10 (kgCO2e/kg) | 6151.55 |
| Ammeters | 11.88 | 1 | 238.6 (kWh/d) | Electricity: 0.43 (kgCO2e/kWh) | 1226.32 |
| Total: | 20,980.83 |
| Machinery | Quantity (Shift *) | Unit Energy Consumption | Carbon Emission Factor | Total Carbon Emission (kgCO2e) |
|---|---|---|---|---|
| Vibratory pile drivers | 1.26 | 17.43 (kg/shift) | Diesel oil: 3.10 (kgCO2e/kg) | 67.84 |
| Vibratory pile drivers | 1.26 | 131.25 (kWh/shift) | Electricity: 0.43 (kgCO2e/kWh) | 71.29 |
| Truck cranes (10 tons) | 23.82 | 29.42 (kg/shift) | Diesel oil: 3.10 (kgCO2e/kg) | 2172.01 |
| Rotary drilling rigs | 6.16 | 142.25 (kWh/shift) | Electricity: 0.43 (kgCO2e/kWh) | 378.85 |
| Slurry pumps (100 mm) | 9.82 | 234.60 (kWh/shift) | Electricity: 0.43 (kgCO2e/kWh) | 996.67 |
| AC arc welding machines | 78.28 | 96.53 (kWh/shift) | Electricity: 0.43 (kgCO2e/kWh) | 3268.80 |
| Crawler hydraulic excavators (1 m3 bucket) | 6.89 | 63.00 (kg/shift) | Diesel oil: 3.10 (kgCO2e/kg) | 1345.47 |
| Crawler rotary drilling rigs (1000 mm) | 9.45 | 146.56 (kg/shift) | Diesel oil: 3.10 (kgCO2e/kg) | 4294.31 |
| Crawler cranes (40 tons) | 5.12 | 63.54 (kg/shift) | Diesel oil: 3.10 (kgCO2e/kg) | 1008.46 |
| Mud tank trucks (5000 liters) | 5.08 | 31.57 (kg/shift) | Gasoline: 2.93 (kgCO2e/kg) | 469.43 |
| Crawler rotary drilling rigs (1500 mm) | 2.11 | 164.32 (kg/shift) | Diesel oil: 3.10 (kgCO2e/kg) | 1074.56 |
| Static pile drivers | 25.05 | 96.25 (kg/shift) | Diesel oil: 3.10 (kgCO2e/kg) | 7474.73 |
| Truck cranes (16 tons) | 11.62 | 35.85 (kg/shift) | Diesel oil: 3.10 (kgCO2e/kg) | 1291.64 |
| Rebar cutting machines | 8.27 | 32.10 (kWh/shift) | Electricity: 0.43 (kgCO2e/kWh) | 114.88 |
| Rebar bending machines | 29.33 | 12.80 (kWh/shift) | Electricity: 0.43 (kgCO2e/kWh) | 162.41 |
| Total: | 24,191.34 |
| Case | Construction Area (m2) | Transportation | Excavation and Earthwork | Pile Work | |||
|---|---|---|---|---|---|---|---|
| Et (kgCO2e/m2) | Et’ (kgCO2e/m2) | Ee (kgCO2e/m2) | Ee’ (kgCO2e/m2) | Ep (kgCO2e/m2) | Ep’ (kgCO2e/m2) | ||
| Case 1 | 1316.47 | 9.55 | 10.99 | 42.30 | 23.10 | 15.94 | 18.38 |
| Case 2 | 894.97 | 9.82 | 8.17 | 38.93 | 23.89 | 11.47 | 8.58 |
| Case 3 | 765.68 | 10.14 | 6.27 | 34.79 | 20.79 | 14.39 | 10.75 |
| Case 4 | 948.71 | 8.91 | 7.72 | 37.94 | 34.53 | 14.36 | 6.88 |
| Case 5 | 993.53 | 9.43 | 8.25 | 39.09 | 24.01 | 10.21 | 7.63 |
| Case 6 | 1344.87 | 9.41 | 11.17 | 41.38 | 23.13 | 17.09 | 19.68 |
| Case 7 | 1363.64 | 9.28 | 11.29 | 42.30 | 23.15 | 17.74 | 20.42 |
| Case 8 | 1344.78 | 8.87 | 11.17 | 43.82 | 39.79 | 30.66 | 24.40 |
| Case 9 | 958.2 | 9.05 | 7.83 | 33.93 | 17.77 | 22.94 | 26.42 |
| Case 10 | 936.82 | 8.26 | 7.57 | 33.50 | 17.48 | 21.02 | 24.18 |
| Case 11 | 932.12 | 8.32 | 7.51 | 33.40 | 17.42 | 21.04 | 24.21 |
| Case 12 | 1333.2 | 8.85 | 11.18 | 40.32 | 45.84 | 33.59 | 44.09 |
| Case 13 | 1372.39 | 9.35 | 11.42 | 41.28 | 45.91 | 39.65 | 51.52 |
| Case 14 | 859.04 | 8.78 | 6.62 | 31.95 | 32.58 | 50.64 | 52.78 |
| Case 15 | 884.82 | 8.75 | 6.99 | 32.56 | 33.39 | 51.21 | 54.99 |
| Case 16 | 1095 | 8.07 | 8.58 | 36.18 | 35.98 | 49.80 | 34.45 |
| Case 17 | 999.49 | 8.30 | 7.70 | 33.72 | 45.26 | 58.51 | 40.19 |
| Case 18 | 1113.53 | 8.43 | 8.63 | 35.55 | 42.62 | 59.66 | 41.31 |
| Case 19 | 686.63 | 8.73 | 6.83 | 33.70 | 53.29 | 41.12 | 26.26 |
| Case | Transport-Phase Carbon Emission Performance (Pt) | Excavation and Earthwork-Phase Carbon Emission Performance (Pe) | Pile-Work-Phase Carbon Emission Performance (Pp) |
|---|---|---|---|
| Case 1 | 1.1507 | 1.8311 | 1.1530 |
| Case 2 | 0.8324 | 1.6294 | 0.7473 |
| Case 3 | 0.6182 | 1.6735 | 0.7471 |
| Case 4 | 0.8661 | 1.0989 | 0.4793 |
| Case 5 | 0.8749 | 1.6279 | 0.7475 |
| Case 6 | 1.1870 | 1.7892 | 1.1516 |
| Case 7 | 1.2159 | 1.8275 | 1.1509 |
| Case 8 | 1.2597 | 1.1013 | 0.7959 |
| Case 9 | 0.8654 | 1.9093 | 1.1515 |
| Case 10 | 0.9159 | 1.9163 | 1.1506 |
| Case 11 | 0.9024 | 1.9180 | 1.1507 |
| Case 12 | 1.2631 | 0.8795 | 1.3128 |
| Case 13 | 1.2206 | 0.8990 | 1.2994 |
| Case 14 | 0.7540 | 0.9809 | 1.0423 |
| Case 15 | 0.7994 | 0.9752 | 1.0738 |
| Case 16 | 1.0638 | 1.0056 | 0.6916 |
| Case 17 | 0.9273 | 0.7450 | 0.6869 |
| Case 18 | 1.0239 | 0.8341 | 0.6924 |
| Case 19 | 0.7821 | 0.6324 | 0.6385 |
| Indicator | Entropy Value (e) | Weight (W) |
|---|---|---|
| Transport emission performance | 0.945 | 27.66% |
| Excavation and earthwork emission performance | 0.916 | 42.36% |
| Pile work emission performance | 0.941 | 29.99% |
| Cluster | Range of the C Value | No. of Cases | Proportion | Average C Value of the Cluster | Variance |
|---|---|---|---|---|---|
| Excellent | 0.712–0.874 | 6 | 31.58% | 0.267773 | 0.005893 |
| Good | 0.515–0.589 | 5 | 26.32% | 0.464449 | 0.003707 |
| Fair | 0.363–0.445 | 5 | 26.32% | 0.628814 | 0.004156 |
| Poor | 0.172–0.312 | 3 | 15.79% | 0.810480 | 0.005837 |
| Phase | Construction Activity | Case 1 | Case 2 | Case 3 | Case 4 | Case 5 | Case 6 | Case 7 | Case 8 | Case 9 | Case 10 | Case 11 | Case 12 | Case 13 | Case 14 | Case 15 | Case 16 | Case 17 | Case 18 | Case 19 | Total |
|---|---|---|---|---|---|---|---|---|---|---|---|---|---|---|---|---|---|---|---|---|---|
| Transportation | Sand and gravel | 769 | 481 | 368 | 497 | 536 | 786 | 797 | 786 | 449 | 434 | 430 | 779 | 802 | 379 | 398 | 547 | 465 | 547 | 320 | 10,570 |
| Concrete | 3204 | 2005 | 1533 | 2071 | 2235 | 3273 | 3319 | 3273 | 1871 | 1806 | 1791 | 3245 | 3340 | 1579 | 1658 | 2279 | 1939 | 2278 | 1331 | 44,029 | |
| Steel | 4643 | 2905 | 2221 | 3001 | 3238 | 4743 | 4809 | 4742 | 2711 | 2616 | 2596 | 4702 | 4840 | 2288 | 2402 | 3303 | 2809 | 3300 | 1929 | 63,796 | |
| Prestressed concrete pipe piles | 3875 | 3396 | 3643 | 2885 | 3356 | 3754 | 3622 | 2978 | 3546 | 2795 | 2848 | 2781 | 3502 | 3079 | 3048 | 2524 | 2897 | 3040 | 2344 | 59,911 | |
| Steel pipe piles | 87 | 0 | 0 | 0 | 0 | 101 | 110 | 146 | 97 | 92 | 90 | 295 | 352 | 215 | 234 | 180 | 189 | 220 | 71 | 2479 | |
| Excavation and Earthwork | Crawler single-bucket hydraulic excavators | 9096 | 6395 | 4761 | 9796 | 7135 | 9303 | 9440 | 16,003 | 5093 | 4898 | 4855 | 18,277 | 18,845 | 8369 | 8836 | 11,782 | 13,528 | 14,193 | 10,943 | 191,547 |
| Crawler bulldozers (105 kW) | 1767 | 1242 | 925 | 1903 | 1386 | 1807 | 1834 | 3109 | 989 | 952 | 943 | 3551 | 3661 | 1626 | 1717 | 2289 | 2628 | 2757 | 2126 | 37,213 | |
| Dump trucks | 17,843 | 12,545 | 9339 | 19,218 | 13,998 | 18,250 | 18,519 | 31,394 | 9992 | 9609 | 9524 | 35,855 | 36,968 | 16,418 | 17,333 | 23,114 | 26,538 | 27,843 | 21,468 | 375,769 | |
| Sprinklers (4000 L) | 415 | 292 | 217 | 447 | 325 | 424 | 430 | 730 | 232 | 223 | 221 | 833 | 859 | 382 | 403 | 537 | 617 | 647 | 499 | 8735 | |
| Combustion rollers (6 t) | 177 | 125 | 93 | 191 | 139 | 181 | 184 | 312 | 99 | 95 | 95 | 356 | 367 | 163 | 172 | 230 | 264 | 277 | 213 | 3733 | |
| Electric tampers | 505 | 355 | 264 | 544 | 396 | 516 | 524 | 888 | 283 | 272 | 270 | 1015 | 1046 | 465 | 491 | 654 | 751 | 788 | 608 | 10,634 | |
| Self-propelled scrapers (3 t) | 610 | 429 | 319 | 657 | 479 | 624 | 633 | 1074 | 342 | 329 | 326 | 1226 | 1264 | 562 | 593 | 791 | 908 | 952 | 734 | 12,853 | |
| Pile Work | Static pile presses | 4206 | 4920 | 5278 | 7750 | 4860 | 4075 | 3932 | 7982 | 3849 | 3034 | 3092 | 7770 | 9787 | 12,352 | 12,228 | 7381 | 8475 | 8891 | 6856 | 126,717 |
| Truck cranes | 1673 | 1960 | 2102 | 3087 | 1936 | 1621 | 1564 | 3180 | 1531 | 1207 | 1230 | 2794 | 3519 | 4441 | 4397 | 2654 | 3047 | 3197 | 2465 | 47,605 | |
| Walking electric pile drivers | 888 | 1039 | 1115 | 1637 | 1026 | 861 | 830 | 1686 | 813 | 641 | 653 | 1481 | 1866 | 2355 | 2331 | 1407 | 1616 | 1695 | 1307 | 25,248 | |
| Rotary excavators | 4773 | 0 | 0 | 0 | 0 | 5559 | 6080 | 9256 | 5349 | 5053 | 4988 | 10,984 | 13,136 | 8030 | 8737 | 14,855 | 15,601 | 18,155 | 5906 | 136,462 | |
| Crawler cranes | 2069 | 0 | 0 | 0 | 0 | 2410 | 2636 | 4013 | 2319 | 2191 | 2162 | 4762 | 5695 | 3481 | 3788 | 6440 | 6764 | 7871 | 2560 | 59,162 | |
| Crawler single-bucket hydraulic excavators | 6155 | 0 | 0 | 0 | 0 | 7169 | 7840 | 11,937 | 6898 | 6516 | 6432 | 14,165 | 16,940 | 10,355 | 11,268 | 19,157 | 20,118 | 23,412 | 7616 | 175,978 | |
| Ammeters | 1226 | 2350 | 2522 | 1145 | 2322 | 1284 | 1312 | 3182 | 1223 | 1049 | 1053 | 2821 | 3468 | 2488 | 2560 | 2641 | 2860 | 3211 | 1524 | 40,240 |
| Case | Actual Carbon Emission Intensity (kgCO2e/m2) | Ranking Based on Actual Carbon Emission Intensity | Comprehensive Evaluation Index (C) | Ranking Based on Comprehensive Evaluation Index |
|---|---|---|---|---|
| Case 1 | 48.60 | 6 | 0.86 | 3 |
| Case 2 | 45.18 | 2 | 0.51 | 11 |
| Case 3 | 45.32 | 3 | 0.46 | 12 |
| Case 4 | 57.79 | 10 | 0.29 | 17 |
| Case 5 | 43.65 | 1 | 0.53 | 10 |
| Case 6 | 49.63 | 7 | 0.86 | 2 |
| Case 7 | 50.17 | 9 | 0.88 | 1 |
| Case 8 | 79.32 | 11 | 0.53 | 9 |
| Case 9 | 49.77 | 8 | 0.70 | 6 |
| Case 10 | 46.76 | 4 | 0.73 | 4 |
| Case 11 | 46.78 | 5 | 0.72 | 5 |
| Case 12 | 88.28 | 12 | 0.59 | 7 |
| Case 13 | 94.91 | 16 | 0.59 | 8 |
| Case 14 | 91.99 | 13 | 0.39 | 15 |
| Case 15 | 93.34 | 14 | 0.42 | 13 |
| Case 16 | 93.85 | 15 | 0.40 | 14 |
| Case 17 | 112.07 | 19 | 0.27 | 18 |
| Case 18 | 110.71 | 18 | 0.34 | 16 |
| Case 19 | 103.14 | 17 | 0.16 | 19 |
Disclaimer/Publisher’s Note: The statements, opinions and data contained in all publications are solely those of the individual author(s) and contributor(s) and not of MDPI and/or the editor(s). MDPI and/or the editor(s) disclaim responsibility for any injury to people or property resulting from any ideas, methods, instructions or products referred to in the content. |
© 2025 by the authors. Licensee MDPI, Basel, Switzerland. This article is an open access article distributed under the terms and conditions of the Creative Commons Attribution (CC BY) license (https://creativecommons.org/licenses/by/4.0/).
Share and Cite
Chen, Y.; He, G.; Fang, Y.; Li, D.; Wang, X. Carbon Emission Evaluation System for Foundation Construction Based on Entropy–TOPSIS and K-Means Methods. Sustainability 2025, 17, 369. https://doi.org/10.3390/su17010369
Chen Y, He G, Fang Y, Li D, Wang X. Carbon Emission Evaluation System for Foundation Construction Based on Entropy–TOPSIS and K-Means Methods. Sustainability. 2025; 17(1):369. https://doi.org/10.3390/su17010369
Chicago/Turabian StyleChen, Yuan, Genglong He, Yuan Fang, Dongxu Li, and Xi Wang. 2025. "Carbon Emission Evaluation System for Foundation Construction Based on Entropy–TOPSIS and K-Means Methods" Sustainability 17, no. 1: 369. https://doi.org/10.3390/su17010369
APA StyleChen, Y., He, G., Fang, Y., Li, D., & Wang, X. (2025). Carbon Emission Evaluation System for Foundation Construction Based on Entropy–TOPSIS and K-Means Methods. Sustainability, 17(1), 369. https://doi.org/10.3390/su17010369