Article

Optimization of Stamping Process Parameters for Sustainable Manufacturing: Numerical Simulation Based on AutoForm

1
The Higher Educational Key Laboratory for Flexible Manufacturing Equipment Integration of Fujian Province, Xiamen Institute of Technology, Xiamen 361000, China
2
State Key Laboratory for Manufacturing Systems Engineering, Xi’an Jiaotong University, Xi’an 710049, China
3
College of Engineering, Nanjing Agricultural University, Nanjing 210031, China
4
College of Biosystems Engineering and Food Science, Zhejiang University, Hangzhou 310058, China
5
Xiamen Swire Engine Service Co., Ltd., Xiamen 361021, China
*
Author to whom correspondence should be addressed.
Sustainability 2025, 17(1), 341; https://doi.org/10.3390/su17010341
Submission received: 5 December 2024 / Revised: 25 December 2024 / Accepted: 2 January 2025 / Published: 5 January 2025

Abstract

:
To address the increasing demand for sustainable manufacturing in the automotive industry, this study focuses on the optimization of stamping process parameters for heavy truck seat reinforcement plates. Finite element analysis software and AutoForm R7 were utilized to develop a numerical simulation model for the stamping process, aiming to enhance material utilization and reduce waste. The research aimed to predict forming defects and explore the effects of blank holder force, friction coefficient, and drawbead resistance coefficient on springback, wrinkles, and strain, with an emphasis on improving production efficiency and minimizing resource consumption. The forming quality was optimized through adjustments in blank holder force, friction coefficient, and drawbead resistance coefficient, demonstrating the potential for eco-friendly manufacturing. Multi-objective optimization was performed to identify the optimal parameter combination, achieving sustainable outcomes with improved forming precision and reduced material waste. Results revealed that the optimal parameter combination (A4B4C2) included a blank holder force of 500 kN, a friction coefficient of 0.18, and a drawbead resistance coefficient of 0.25. These settings minimized material thinning (11.6%), excessive thickening (7.4%), and springback (0.905 mm), aligning with sustainable production standards.

1. Introduction

In the context of sustainable manufacturing, achieving high production quality while minimizing resource consumption and environmental impact has become a pressing challenge for the manufacturing industry [1,2]. As a cornerstone of modern industrial development, the automotive industry is under increasing pressure to adopt sustainable practices in response to stringent environmental regulations and societal demands for greener manufacturing [3,4]. Stamping technology, as a critical process in the production of automotive components, significantly influences material utilization, energy consumption, and waste management [5,6]. Despite considerable advancements in stamping techniques, traditional processes often suffer from defects such as springback, wrinkling, and uneven strain distribution, resulting in material waste and reduced processing efficiency [7,8,9].
In recent years, numerical simulation and process parameter optimization have emerged as effective tools to address challenges in stamping. Research using software such as Dynaform 7.2 and ABAQUS 6.13 has demonstrated that simulating the effects of different process parameters on forming behaviour can effectively mitigate issues like wrinkling and springback [10,11]. For instance, Yu et al. employed a reverse algorithm to calculate the initial blank shape and simulate cold stamping processes under various parameters, significantly enhancing process stability [10]. Similarly, Ran et al. utilized AutoForm to conduct forming and springback analyses on automotive panels, optimizing drawbead designs and improving the robustness of stamped parts [12]. However, these studies predominantly focus on optimizing individual defects and lack a comprehensive analysis of the combined effects of multiple process parameters on forming quality.
This study addresses the reinforcement plate of heavy truck seats, a critical component with stringent performance and reliability requirements. By leveraging the finite element analysis software AutoForm, a numerical model of the stamping process is constructed to predict and analyze the distribution and mechanisms of forming defects. Furthermore, a multi-objective optimization approach is adopted to systematically investigate the effects of blank holder force, friction coefficient, and drawbead resistance coefficient on springback, wrinkling, and strain distribution, ultimately determining the optimal parameter combination.
The primary objective of this research is to enhance forming quality while achieving sustainable stamping processes through reduced material waste and defect rates. The findings provide quantifiable technical references for process optimization in the automotive industry and offer a replicable pathway for integrating numerical simulation with sustainable development in other manufacturing fields.

2. Formability Analysis and Process Design of Reinforcement Plate

2.1. Formability Analysis

The reinforcement plate plays a crucial role in reinforcing the connection to the inner plate, effectively withstanding transverse tensile stresses and longitudinal compressive stresses to ensure the seat’s structural stability and safety, as illustrated in Figure 1. During the forming process, certain geometries undergo significant deformation, particularly in areas with intricate arc corners, culminating in arched and curved surfaces that amplify the complexity of the forming procedure. Furthermore, the presence of grooves and process holes in varying dimensions and orientations introduces additional challenges to the already intricate forming process.
The reinforcement plate constitutes a critical component of the seat, demanding rigorous adherence to material specifications to ensure optimal performance under high-stress conditions. Fabricated from cold-rolled steel DC04, DC04 is very suitable for high strength and toughness of the stamping processing field, because it has stable chemical composition, excellent stamping performance, and excellent mechanical properties. Hence, this paper chooses DC04 as the material for research, DC04 mainly contains Fe as the basic component, along with elements such as C, Si, Mn, P, S, and so on. The C is generally below 0.08%, which endows it with good cold working performance. The Si is usually around 0.03%, and the Mn is approximately 0.4%. The mechanical properties of DC04 are listed in Table 1. After cold rolling, the DC04 material is strengthened, which is suitable for stamping automotive parts. Moreover, the reinforcement plate features a uniform thickness of 1.5 mm [13,14], contributing to consistent mechanical performance and manufacturability.

2.2. Process Design

To optimize material utilization, the reinforcement plate’s forming process implements a one-out-of-two discharging method. The main dimensions of the reinforcement plate are illustrated in Figure 1. As illustrated in Figure 2, the plate’s surface comprises three critical zones—zone A, zone B, and zone C. Initially, a preliminary step arch is formed, which is subsequently refined through shaping, flaring, and punching processes. A strategic approach is required to ensure forming quality. The process begins with drawing, followed by two shaping stages to accommodate the significant step difference between A1 and A2. In the first shaping stage, flanging is combined to adjust the lapping surfaces of B1 and B2 upward, while A2 is shaped downward along a specific curvature, ensuring precision in zones B and A2. Subsequently, zones A, C1, and C2 are adjusted in accordance with the solid model. Further precise shape modifications ensure the accuracy of the workpiece’s geometry and dimensions. Finally, lateral adjustments to the workpiece ensure the positional alignment between the punching hole and the shaped surface [15,16,17]. The process flow of reinforcement plate forming is detailed in Table 2, and the forming process is shown in Figure 3, Figure 4, Figure 5 and Figure 6.

3. Simulation of the Forming Process of the Reinforcement Plate

3.1. Simulation Model Building and Pre-Processing

The reinforcement plate forming process was simulated using AutoForm software. The triangular mesh was selected for discretization. It has unique advantages in conforming to complex shapes. It can closely follow the undulations of the curved surface and present complex geometric shapes in a relatively fine mesh layout. So, the mesh tolerance error was set to 0.05 mm. The tiny value aimed to ensure a high degree of restoration of the real shape of the reinforcement plate by the mesh model, effectively avoiding the deviation of the simulation results caused by the approximation error of the model. The maximum element size was taken as 30 mm. The selection of this parameter was the result of careful trade-offs between computational efficiency and model accuracy. The maximum adaptive level was set to 6 levels. It provided sufficient space for such dynamic adjustments, so the mesh could be optimized in real time according to the state of the model. The maximum element angle was set to 22.5°, This parameter restricts the size range of the interior angles of the triangular mesh elements. Reasonable control of the element angle helps to maintain the mesh quality and avoid the appearance of overly long and narrow or deformed mesh elements. The fillet penetration parameter limits the penetration depth of the mesh at the fillet. To prevent the occurrence of incorrect stress concentration or material penetration during the simulation process due to unreasonable mesh division, the fillet penetration was set to 0.22 mm. The normal angle between adjacent meshes was not allowed to exceed 10°. This setting can ensure the smoothness and continuity of the transition between the meshes.
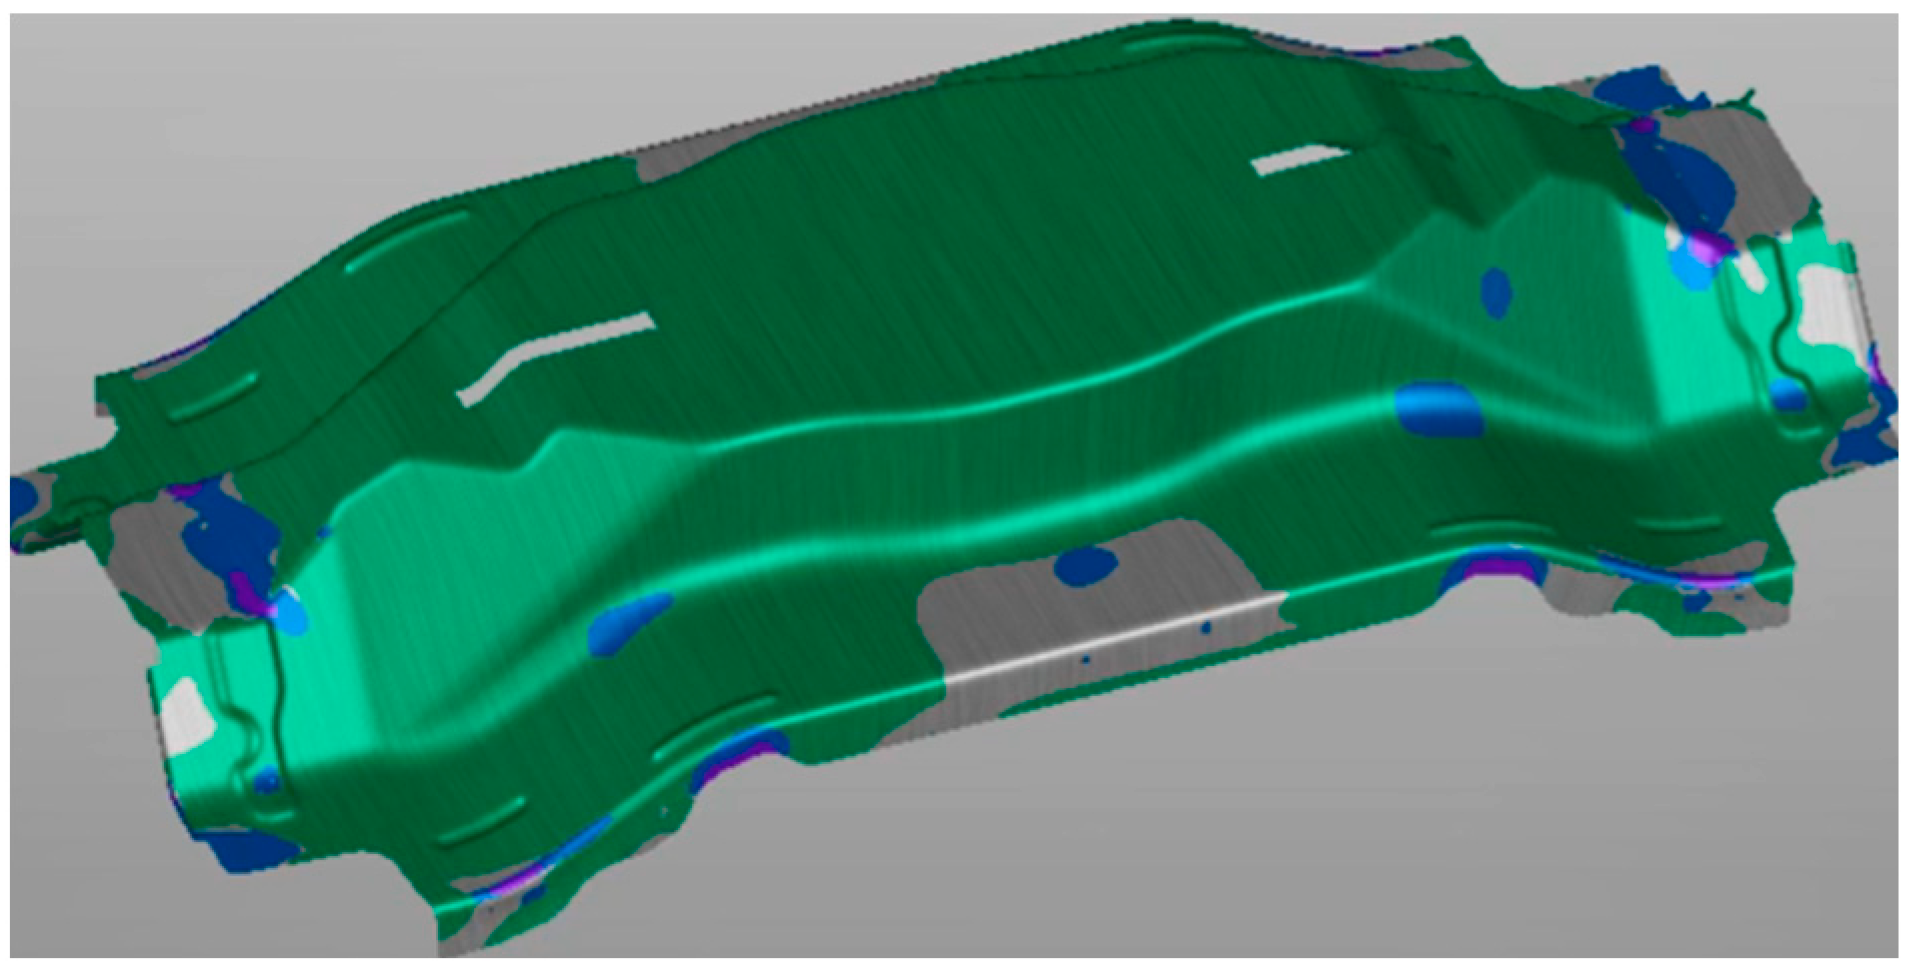
After the above elaborate parameter settings, the finally generated mesh model had 1378 initial mesh elements. The meshing of the reinforcement plate is shown in Figure 7. The EPS-11 elastoplastic shell element was chosen as the element type. This type of element has 11 integration points in the thickness direction. Compared with traditional element types, its outstanding advantage lies in its ability to capture the stress changes in the thickness direction more sensitively and improve the calculation accuracy.
In the software settings of Autoform, the stamping direction of the reinforcement plate is selected according to the die interference situation, the drawing angle, as well as the die closing height and the die edge structure. As shown in Figure 8, this direction can achieve seamless closure between the die and the punch, simplify the design of the die surface, and regulate the material flow, thus minimizing the forming defects of the reinforcement plate.
In the software settings of Autoform, the setting of the binder surface is of great importance. For the reinforcement plate in this paper, a shaped binder surface [18] is adopted, as specifically shown in Figure 9. This kind of binder surface mainly squeezes the sheet metal along the die fillet and forms the outer contour of the workpiece under the pressure of the punch, so as to ensure the overall forming of the reinforcement plate, realize the uniform flow of the sheet metal, and prevent the possible forming defects during the stamping process.
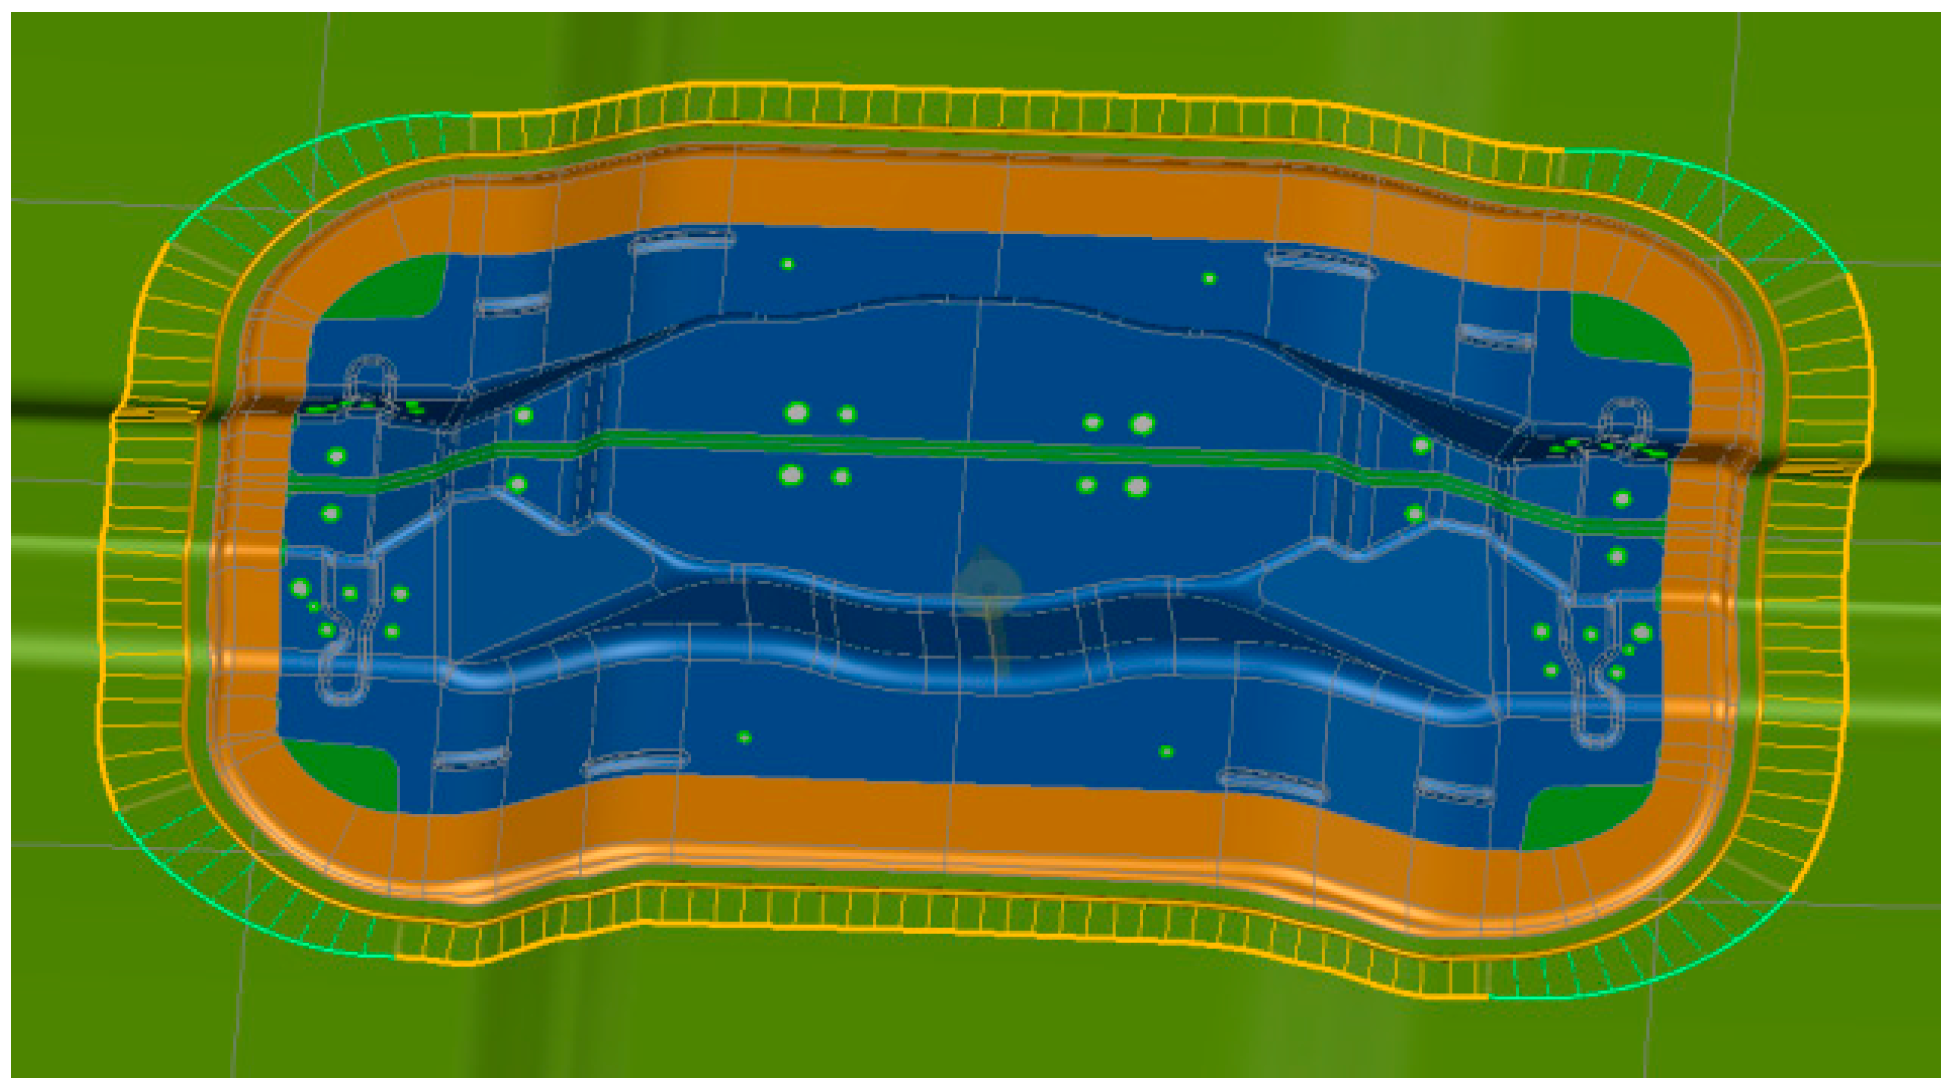
Since the drawing depth in the A1 region of the reinforcement plate is relatively large, it is essential to set drawing beads to prevent wrinkling in the A1 region. In the simulation using Autoform in this paper, semicircular and rectangular drawing beads [19] are selected, and two sets of equivalent drawing bead strips are set along the horizontal and vertical directions, respectively. The horizontal width and drag coefficient of the drawing beads are 10 mm and 0.35, respectively, while the longitudinal width and drag coefficient are 9 mm and 0.8, respectively. Moreover, the horizontal drawing beads are 15 mm away from the parting line. The specific setting of the drawing beads is shown in Figure 10.
In the simulation using the Autoform software, the insert block-type trimming knife is chosen for the reinforcement plate, as specifically shown in Figure 11. Compared with the whole trimming tool, the insert block-type trimming knife can reduce tool interference and solve the problem of tool avoidance. Moreover, it has more obvious advantages in terms of the overall structure and improving the simulation efficiency.
The flanging punch in Region B, as shown in Figure 12, is set in the Form Flanging module of Autoform. The bottom pressure of this flanging punch is 80 kN, and the top pressure is 40 kN [20]. To prevent the flanging process from affecting the precision of the punching process, the flanging process is placed as the final step of the forming process, namely, Operation 40.
In order to prevent the deformation processes such as drawing and flanging from affecting the precision of holes and ensure the dimensional and positional tolerances of the holes, the side punching process of the reinforcement plate is set as the final step of all processes. Meanwhile, to avoid interference between the side punching and other separation processes, the design scheme of the side punching is shown in Figure 13.

3.2. The Optimal Optimization Index Determination via Orthogonal Testing

The orthogonal test method was employed to identify the optimal optimization index. The factors chosen for the test include blank holding force (A), friction coefficient (B), and drag coefficient of the drawbar (C), all of which significantly impact the forming quality of the reinforcement plate. With a fixed stamping speed of 1000 mm/s and a die gap of 1.5 mm (convex-concave), four levels were designated for each of the three test factors (A, B, and C), based on the preliminary value range determined from single-factor analysis. The factor level table for the orthogonal test is presented in Table 3 [21].
The orthogonal table was constructed based on the L16 (43) standard, incorporating three factors and four levels. Numerical simulations were then performed using AutoForm software, with 16 iterations conducted to evaluate the maximum springback, thickening rate, and thinning rate across the forming process [22,23]. The orthogonal test results for each group are summarized in Table 4. Notably, all maximum thinning rates were below 25%, indicating that there is no risk of reinforcement plate breakage. As a result, the optimization indexes were identified as the dimension accuracy influence index and the wrinkling influence index for the reinforcement plate after forming, specifically the maximum springback and thickening rate.

3.3. Test Result Analysis

3.3.1. Range Analysis

Based on the simulation results presented in Table 3, range analysis was first applied for the investigation. For each factor at each level, the range was calculated as the difference between the maximum values of the average index for the test results of each factor. The formula for calculating the range analysis is given as follows [24]:
k i j = K i j ¯ R = k max k min
In this formula, i represents each factor, j represents each level, kij corresponds to the average index of the test results for any test factor under each level, and R corresponds to the range.
A larger range indicates a stronger influence of the factor on the optimization index within the test-level value range. Using the above formula, the range analysis results for the maximum springback are presented in Table 5.
From Table 5, it is evident that among the factors influencing the maximum springback, the drag coefficient (C) of the drawbar shows the highest range value, followed by the friction coefficient (B). This suggests that these two process parameters have the most substantial effect on the springback of the reinforcement plate after forming. Hence, the optimal parameter combination is identified as A3B3C4, where the blank holding force is set to 800 kN, the friction coefficient is 0.16, the transverse drawbar resistance coefficient is 0.45, and the longitudinal drawbar resistance coefficient is 0.84. With a fixed stamping speed of 1000 mm/s and a gap of 1.5 mm between the convex and concave dies, numerical simulations of the reinforcement plate forming were performed using the aforementioned parameters. The sheet thickness cloud diagram and springback simulation results of the reinforcement plate are shown in Figure 14. It can be seen from Figure 14a that under this group of parameters, the maximum thickness of the reinforcement plate after forming is 1.639 mm, the minimum thickness is 1.298 mm, the maximum thickening rate is 9.2%, and the maximum thinning rate is 13.5%, which meets the production requirements. As can be seen from Figure 14b, under this group of parameters, the maximum springback amount of the reinforcement plate after forming is 1.106 mm, but the springback amount is relatively large in the orthogonal table.
Based on the range analysis conducted for the maximum thickening rate in Table 6, the optimal parameter combination is identified as A3B2C3. This means that the blank holding force is set to 800 kN, the friction coefficient is 0.15, the transverse drawbar resistance coefficient is 0.40, and the longitudinal drawbar resistance coefficient is 0.82. With the stamping speed fixed at 1000 mm/s and a gap of 1.5 mm between the convex and concave dies, other parameters including stamping oil remain constant. Numerical simulations of the reinforcement plate forming process are performed using these parameters. The resulting sheet thickness cloud diagram and springback simulation results of the reinforcement plate are shown in Figure 15. It can be seen from Figure 15a that under this group of parameters, the maximum thickness of the reinforcement plate after forming is 1.612 mm, the minimum thickness is 1.276 mm, the maximum thinning rate is 14.9%, which meets the production requirements, and the maximum thickening rate is 8.5%. The thickening rate in the orthogonal table is the smallest among all the tests. As can be seen from Figure 15b, under this group of parameters, the maximum springback amount of the reinforcement plate after forming is 0.973 mm, indicating relatively high dimensional accuracy. Therefore, the forming quality of the reinforcement plate is the best under the parameter combination of A3B2C3.

3.3.2. Variance Analysis

Variance analysis is conducted to examine the test data by calculating the degrees of freedom, the sum of squared deviations, and the F-value for each factor. If the computed F-value surpasses the critical value F α(fi, fE), represented as F > F α(fi, fE), this indicates that the factor in question significantly impacts the test indexes. Additionally, a larger difference value signifies a more substantial effect of the corresponding factor [25,26]. Using the results from the 16 groups of orthogonal tests, the selected test factors, levels, and optimization indicators were entered into SPSS 20 software to compute the degrees of freedom (f), sum of squared deviations (S), F-value, and the corresponding significance of influence. The variance analysis results for the optimization objective of maximum springback are presented in Table 7, while Table 8 outlines the results for the optimization of the maximum thickening rate.
As shown in Table 7 and Table 8, during the press moulding process, the factors’ influence on the maximum springback, in decreasing order of significance, is C > B > A. Conversely, the factors’ influence on the maximum thickening rate, in decreasing order of significance, is A > B > C.

3.4. Multi-Objective Optimization of Process Parameters

When the maximum springback is prioritized as the optimization index, the optimal parameter combination is identified as A3B3C4. However, in this case, the maximum thickening rate approaches its limit, resulting in a higher risk of wrinkling. In contrast, when the maximum thickening rate is considered the optimization index, the optimal parameter combination shifts to A3B2C3, leading to a larger maximum springback of the reinforcement plate. This highlights that the influence of different factors varies across optimization indexes, making it difficult to simultaneously minimize both springback and wrinkle indexes. Therefore, multi-objective optimization is essential to determine the optimal parameter combination and ensure the overall forming quality of the reinforcement plate.
In this study, grey relational theory is utilized to optimize the combination of process parameters. Grey relational theory enables the prediction of unknown information based on known data, thereby facilitating an understanding of the overall system dynamics [27,28,29]. The core principle of this theory involves establishing a correlation analysis model for comparison sequences and reference sequences. It comprehensively analyzes and measures the correlation degree between each influencing factor and the optimization target by calculating the average correlation degree. To preprocess the original data obtained from the 16 groups of orthogonal tests, the threshold method is applied for dimensionless processing. The calculation formula for the threshold method is shown in Formula (2) [25]. The test results after dimensionless processing are presented in Table 9.
y ( k ) = x ( k ) min k n x ( k ) max k n x ( k ) min k n x ( k )
In this formula, x(k) represents the original data, y(k) represents the processed data, and n represents the number of data.
The reference sequence, denoted as Y0 = {0.898, 8.4}, was established based on the minimum values of the maximum springback and maximum thickening rate obtained from the orthogonal test. The calculation process involved determining the absolute differences between the corresponding elements of the 16 groups of reference sequences and comparison sequences. Subsequently, the correlation coefficients between each factor and individual targets were computed. The correlation degrees between each factor and multiple targets were then derived by solving the weighted average of the correlation coefficients [26]. The calculation formulas for the grey correlation coefficient and grey correlation degree are provided in Formulas (3) and (4), respectively.
ξ i ( k ) = min i min k x 0 ( k ) x i ( k ) + ρ max i max k x 0 ( k ) x i ( k ) x 0 ( k ) x i ( k ) + ρ max i max k x 0 ( k ) x i ( k )
In Formula (3), ζi(k) is the correlation coefficient, ρ represents the resolution coefficient, which is used to adjust the proportions of each term in the formula, and usually ρ = 0.5. k is an index, and i and j are indices used for iteration. This formula is used to compare the similarity between two sequences xi(k) and x0(k).
r ( x 0 , x i ) = 1 n k = 1 n λ k ξ i ( k )
In Formula (4), λk denotes the proportion of weight, where the weight proportions assigned to the maximum springback and maximum thickening rate after the overall forming of the reinforcement plate are considered equal, i.e., λ1 = λ2 = 0.5. ζi(k) is the correlation coefficient.
The correlation coefficients and correlation degrees of the experimental data of 16 groups are presented in Table 10.
Range analysis of the average correlation degree of each factor to the optimization index is presented in Table 11. Based on Table 11, when both the maximum springback and maximum thickening rate are considered the comprehensive optimization indexes, the friction coefficient (B) exhibits the largest range value, followed by the blank holding force (A). This indicates that these two process parameters have the most significant influence on the springback and thickening of the reinforcement plate after forming. Consequently, the optimal parameter combination ascertained Via grey relational analysis is A4B4C2. It corresponds to a blank holding force of 500 kN, a friction coefficient of 0.18, and a drawbar drag coefficient of 0.25. Meanwhile, other parameters, with stamping oil inclusive, remain constant.
Variance analysis was performed on the average correlation values, as presented in 
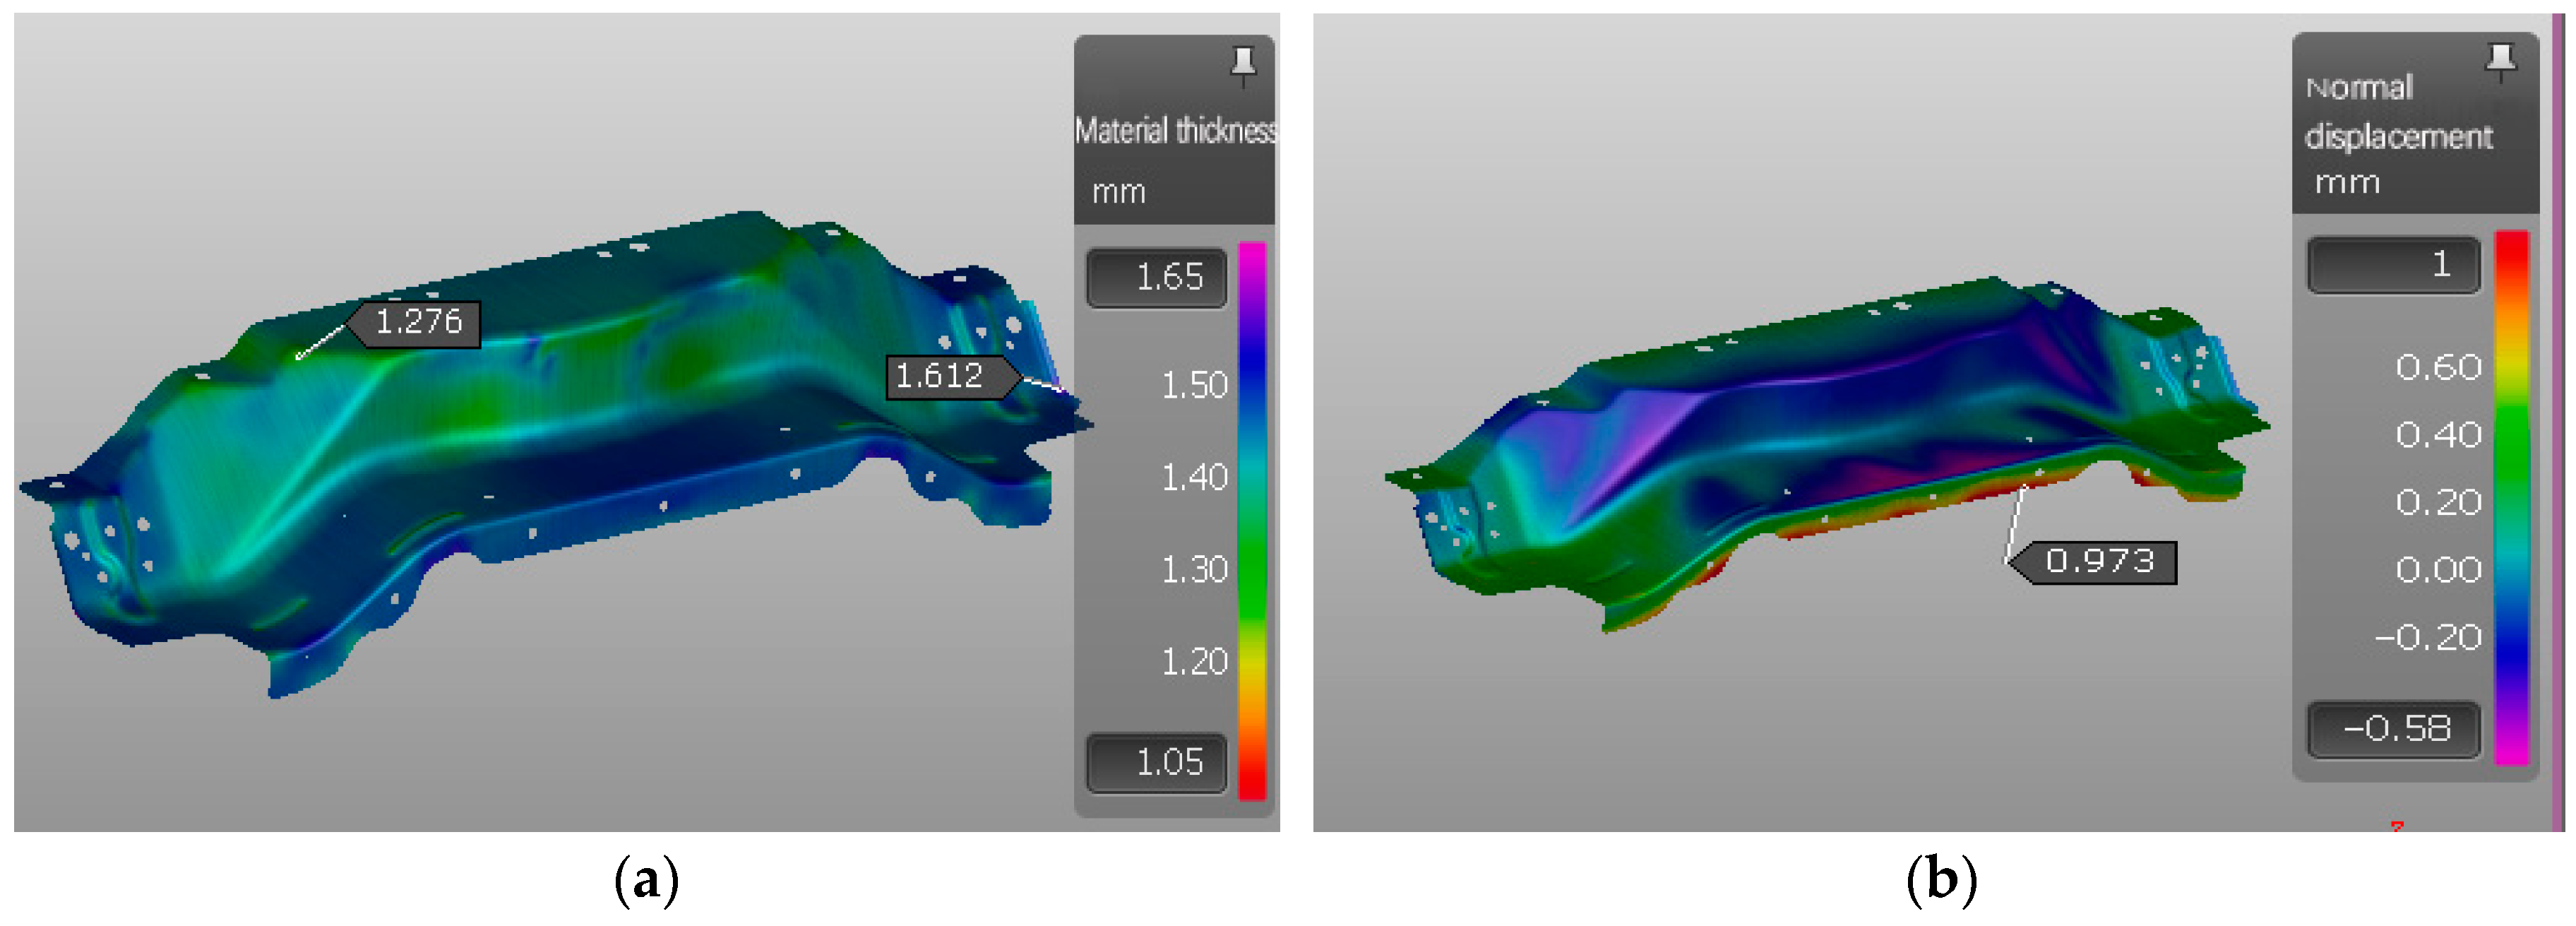
Table 12. The sheet thickness cloud diagram and springback simulation results of the reinforcement plate are shown in Figure 16. It can be seen from Figure 16a that compared with the single-objective optimization parameter combination A3B3C4 for the maximum springback amount and the single-objective optimization parameter combination A3B2C3 for the maximum thickening rate, under the multi-objective optimization parameter combination A4B4C2, the maximum thickness of the reinforcement plate after the overall forming is 1.611 mm, the minimum thickness is 1.325 mm, the maximum thinning rate is 11.6%, and the maximum thickening rate is 7.4%. As can be seen from Figure 16b, the maximum springback amount of the reinforcement plate after forming is 0.905 mm, and there is no need for springback compensation. No quality defects appear in the key forming areas of the reinforcement plate, the overall plastic deformation is sufficient, and the forming effect is the best.
Subsequently, a simulation of the entire stamping and forming process of the reinforcement plate was conducted under the optimal parameter combination of A4B4C2. The simulated sheet thickness cloud diagram and springback simulation results are presented in Figure 16, respectively, demonstrating satisfactory forming accuracy of the reinforcement plate without the need for springback compensation. No quality defects were observed in the critical forming areas, indicating sufficient plastic deformation and optimal forming effects. Compared to the parameter combinations, A3B3C4 and A3B2C3, which were optimized for the maximum springback and maximum thickening rate as single objectives, the multi-objective optimized parameter combination A4B4C2 exhibited superior forming quality. Specifically, its maximum thinning rate was 11.6%, converting it into a thickness of 1.326 mm; the maximum thickening rate was 7.4%, and the maximum springback was 0.905 mm, all of which met the production requirements.

4. Conclusions

AutoForm software was employed to establish the stamping forming model of the reinforcement plate, and the stamping forming process plan was formulated for the reinforcement plate according to its shape characteristics, so as to control quality problems such as springback, tensile cracking, and wrinkling that are prone to occur due to excessive local deformation of the reinforcement plate.
Under the condition that the drawbeads are reasonably set and other factors remain unchanged, the blank holder force, friction coefficient, and drawbead resistance coefficient are selected as independent variables, and an orthogonal experiment with three factors and four levels is designed. Single-objective optimization is carried out through the range analysis method. For the maximum springback amount, the preferred parameter combination is A3B3C4. At this time, the maximum springback amount of the sheet metal forming is 1.106 mm, which has not been further optimized, but the maximum thinning rate is 13.5%, showing a significant improvement compared with the orthogonal table. For the maximum thickening rate, the preferred parameter combination is A3B2C3. At this time, the maximum thickening rate of the sheet metal forming is 8.5%, which is smaller than that of any group of experiments, and the maximum springback amount is 0.973 mm, indicating a relatively high assembly accuracy. Meanwhile, the analysis of the variance method is combined to study the influence degree of each parameter on different optimization indicators.
Finally, taking the maximum springback amount and the maximum thickening rate as the comprehensive optimization indicators, the grey relational theory is used to conduct multi-objective optimization for the stamping forming of the workpiece. Through the range analysis of the average relational degree, it can be known that the preferred parameter combination is A4B4C2. That is, the blank holder force is 500 kN, the friction coefficient is 0.18, and the drawbead resistance coefficient is 0.25. At this time, the maximum thinning rate of the sheet metal forming is 11.6%, the maximum thickening rate is 7.4%, and the maximum springback amount is 0.905 mm. The forming result takes into account different optimization objectives and ensures the forming quality of the reinforcement plate to the greatest extent.

Author Contributions

Conceptualization, H.Z. and W.W.; methodology, H.Z. and S.L.; software, M.Z. and C.L.; validation, H.Z., S.L. and M.Z.; formal analysis, W.W.; investigation, S.L.; resources, H.Z. and W.W.; data curation, H.Z., S.L. and C.L.; writing—original draft preparation, H.Z. and W.W.; writing—review and editing, H.Z., M.Z. and W.W.; visualization, H.Z.; supervision, W.W.; project administration, W.W.; funding acquisition, H.Z. All authors have read and agreed to the published version of the manuscript.

Funding

This research was funded by The Natural Science Foundation of Xiamen, China, grant number 3502Z202374094, as well as The Foundation of State Key Laboratory for Manufacturing Systems Engineering, grant number sklms2024012.

Institutional Review Board Statement

Not applicable.

Informed Consent Statement

Not applicable.

Data Availability Statement

All data included in this study are available on request from the corresponding author.

Conflicts of Interest

Author Manyi Zhou was employed by the company Xiamen Swire Engine Service Co., Ltd. The remaining authors declare that the research was conducted in the absence of any commercial or financial relationships that could be construed as a potential conflict of interest.

References

  1. Sari, E.; Ma’aram, A.; Shaharoun, A.M.; Chofreh, A.G.; Goni, F.A.; Klemeš, J.J.; Marie, I.A.; Saraswati, D. Measuring sustainable cleaner maintenance hierarchical contributions of the car manufacturing industry. J. Clean. Prod. 2021, 312, 127717. [Google Scholar] [CrossRef]
  2. Isasi-Sanchez, L.; Morcillo-Bellido, J.; Ortiz-Gonzalez, J.I.; Duran-Heras, A. Synergic Sustainability Implications of Additive Manufacturing in Automotive Spare Parts: A Case Analysis. Sustainability 2020, 12, 8461. [Google Scholar] [CrossRef]
  3. Vaz, C.R.; Rauen, T.R.S.; Lezana, Á.G.R. Sustainability and Innovation in the Automotive Sector: A Structured Content Analysis. Sustainability 2017, 9, 880. [Google Scholar] [CrossRef]
  4. Kim, J.; Son, B.; Kang, B.; Hwang, S.; Park, H. Comparison stamping and hydro-mechanical forming process for an automobile fuel tank using finite element method. J. Mater. Process. Technol. 2004, 153–154, 550–557. [Google Scholar] [CrossRef]
  5. Nievas, N.; Pagès-Bernaus, A.; Abio, A.; Lange, D.; Garcia-Llamas, E.; Grané, M.; Pujante, J.; Echeverria, L.; Bonada, F. A scalable Deep Q-Learning approach for hot stamping process under dynamic control environment. Int. J. Prod. Res. 2024, 1–22. [Google Scholar] [CrossRef]
  6. Liu, X.; Cai, Z.; Ming, M.; Hou, Q.; Luan, X.; Liu, H.; Zhang, L.; Politis, D.J.; Du, Q.; Wang, L. Fast light alloy stamping technology (FAST) for manufacturing lightweight pressings from dissimilar aluminium alloy-tailor welded blanks. J. Manuf. Process. 2024, 120, 1141–1156. [Google Scholar] [CrossRef]
  7. Kolotyrin, K.P.; Bogatyrev, S.A.; Kostyukhin, Y.Y.; Savon, D.Y.; Shinkevich, A.I. Justification of the Application of Resource-Saving Technology for the Restoration of Metal-Intensive Rear Semi-Axles of Trucks Using Hot Plastic Deformation. Sustainability 2022, 14, 16. [Google Scholar] [CrossRef]
  8. Xie, Y.; Feng, K.; Du, M.; Wang, Y.; Li, L. Robust optimization of stamping process based on Bayesian estimation. J. Manuf. Process. 2023, 101, 245–258. [Google Scholar] [CrossRef]
  9. Zhao, P.; Wu, Q.; Yang, Y.-L.; Chen, Z. Process Optimization of the Hot Stamping of AZ31 Magnesium Alloy Sheets Based on Response Surface Methodology. Materials 2023, 16, 1867. [Google Scholar] [CrossRef]
  10. Yu, G.; Zhao, J.; Wang, C.; Zhai, R.; Ma, R. Development of a cold stamping process for forming single-welded elbows. Int. J. Adv. Manuf. Technol. 2017, 88, 1911–1921. [Google Scholar] [CrossRef]
  11. Hu, W. Essential algorithms to minimize dynamic effects in using explicit codes for stamping process simulations. Int. J. Numer. Methods Eng. 2003, 56, 1661–1672. [Google Scholar] [CrossRef]
  12. Ran, A.; Gong, X.; Wang, D.; Jiang, L.; Xie, Y.; Chen, J. Robustness process optimization and springback compensation for hood inner panel based on Autoform. Forg. Stamp. Technol. 2023, 48, 61–68. [Google Scholar] [CrossRef]
  13. Zheng, P.; Liu, D.; Guo, J.; Zhi, Z. A New Method for Optimizing Process Parameters of Active Measurement Grinding Based on Grey Target Decision Making. Proc. Inst. Mech. Eng. Part C J. Mech. Eng. Sci. 2020, 234, 4645–4658. [Google Scholar] [CrossRef]
  14. Shao, N.; Xu, J.; Xu, X. Experimental study of a two-degree-of-freedom piezoelectric cantilever with a stopper for broadband vibration energy harvesting. Sens. Actuators A: Phys. 2022, 34, 113742. [Google Scholar] [CrossRef]
  15. Zhang, H. The precision forming process analysis and optimal design of the die of the clutch shell. Manuf. Technol. Mach. Tool 2020, 1, 188–192. [Google Scholar] [CrossRef]
  16. Mulidrán, P.; Šiser, M.; Slota, J.; Spišák, E.; Sleziak, T. Numerical Prediction of Forming Car Body Parts with Emphasis on Springback. Metals 2018, 8, 435. [Google Scholar] [CrossRef]
  17. Gu, Z.; Li, S.; Zhao, L.; Zhu, L.; Yu, G. Finite element simulation and experimental investigations of cold stamping forming defect of A588-A thick weathering steel bogie lower cover. Int. J. Adv. Manuf. Technol. 2019, 104, 1275–1283. [Google Scholar] [CrossRef]
  18. Du, H.; Han, M.; Wang, H. Impact model and computational analysis of structural isolation layer deformation limitation with limiters. Structures 2022, 40, 176–186. [Google Scholar] [CrossRef]
  19. Yang, G.; Wu, Y. Progressive stamping process and die design of high strength steel automobile structural parts. J. Phys. Conf. Ser. 2020, 16, 012063. [Google Scholar] [CrossRef]
  20. Wei, W.; Cheng, C.; Li, W. Effect of die structure parameters on deformation behavior of bent tube in free bending process. J. Iron Steel Res. Int. 2023, 30, 487–503. [Google Scholar] [CrossRef]
  21. Souza, T.; Rolfe, B.F. Characterising material and process variation effects on springback robustness for a semi-cylindrical sheet metal forming process. International J. Mech. Sci. 2010, 52, 1756–1766. [Google Scholar] [CrossRef]
  22. Cui, M.; Wang, Z.; Wang, L.; Huang, Y. Numerical Simulation and Multi-Objective Optimization of Partition Cooling in Hot Stamping of the Automotive B-Pillar. Metals 2020, 10, 1264. [Google Scholar] [CrossRef]
  23. Yang, S.; Li, Y.; Liang, J. Adaptive multi-point flexible-bending technology for improving the quality of profile using discrete dies driven by snake-shaped motion mechanism. J. Mater. Process. Technol. 2024, 325, 118297. [Google Scholar] [CrossRef]
  24. Dou, S.; Wang, X.; Xia, J.; Wilson, L. Analysis of Sheet Metal Forming (Warm Stamping Process): A Study of the Variable Friction Coefficient on 6111 Aluminum Alloy. Metals 2020, 10, 1189. [Google Scholar] [CrossRef]
  25. Han, S.; Li, Z.; Gao, Y.; Zeng, Q. Numerical study on die design parameters of self-pierce riveting process based on orthogonal test. J. Shanghai Jiaotong Univ. 2014, 19, 308–312. [Google Scholar] [CrossRef]
  26. Anthony, M.; José, L.; Nuno, M.; Diana, M. Comprehensive benchmark study of commercial sheet metal forming simulation softwares used in the automotive industry. Int. J. Mater. Form. 2018, 11, 879–899. [Google Scholar] [CrossRef]
  27. Hwang, Y.; Hsu, I. Die Design and Finite Element Analysis of Welding Seams during Aluminum Alloy Tube Extrusion. Metals 2023, 13, 911. [Google Scholar] [CrossRef]
  28. Wu, W. A Revised Grey Relational Analysis Method for Multicriteria Group Decision-Making with Expected Utility Theory for Oil Spill Emergency Management. Math. Probl. Eng. 2021, 2021, 6682332. [Google Scholar] [CrossRef]
  29. Liu, P.; Yang, H. Three-Way Decisions with Single-Valued Neutrosophic Decision Theory Rough Sets Based on Grey Relational Analysis. Math. Probl. Eng. 2019, 2019, 3258018. [Google Scholar] [CrossRef]
Figure 1. The main dimensions of a reinforced plate.
Sustainability 17 00341 g001
Figure 2. Three-dimensional drawing of a reinforcement plate.
Sustainability 17 00341 g002
Figure 3. Process sketch of the OP10.
Sustainability 17 00341 g003
Figure 4. Process sketch of the OP20 and OP21.
Sustainability 17 00341 g004
Figure 5. Process sketch of the OP20 and OP30.
Sustainability 17 00341 g005
Figure 6. Process sketch of the OP40.
Sustainability 17 00341 g006
Figure 7. Reinforced slab meshing diagram.
Sustainability 17 00341 g007
Figure 8. The stamping direction of the reinforcement plate.
Sustainability 17 00341 g008
Figure 9. The model diagram of the presser surface. (The arrows indicate the stamping direction).
Sustainability 17 00341 g009
Figure 10. The drawing bars of the reinforcement plate.
Sustainability 17 00341 g010
Figure 11. The layout of the cutting edge. (The arrows indicate the direction of the blanking force).
Sustainability 17 00341 g011
Figure 12. The flanging punch of the reinforcement plate.
Sustainability 17 00341 g012
Figure 13. The side punching schematic diagram of the reinforcement plate. (The arrows indicate the direction of the bending force).
Sustainability 17 00341 g013
Figure 14. Simulation results for single-objective optimization of maximum springback. (a) The thickness cloud diagram; (b) the springback simulation results.
Sustainability 17 00341 g014
Figure 15. Simulation results under single objective optimization of maximum thickening rate. (a) The thickness cloud diagram; (b) the springback simulation results.
Sustainability 17 00341 g015
Figure 16. Simulation results of reinforcement plate forming under multi-objective optimization of maximum springback and maximum thickening rate. (a) The thickness cloud diagram; (b) the springback simulation results.
Sustainability 17 00341 g016
Table 1. The main material properties of DC04.
Tensile Strength (25 °C MPa)Yield Strength (25 °C MPa)Strain-Hardening ExponentElongation (%)Poisson’s Ratio
307.42080.1838.60.3
Table 2. The process flow of reinforcement plate forming.
Process No.Process NameSpecific Content
OP10DRThe main body of zone A is formed by drawing
OP20TR + CTRTrim the outer outline required for flanging
OP21TR + CTRTrim the outer outline required for flanging (Dividing knife edge)
OP30FL + RSTFlanging and shaping of Region B
OP40PI + CPI + RSTHigh-precision punching after shaping
Table 3. The factor level table of the orthogonal test.
Levels FactorABC
HorizontalLongitudinal
16000.140.300.78
27000.150.350.80
38000.160.400.82
49000.170.450.84
Table 4. The orthogonal test results.
Test NumberABCThe Maximum
Springback Y1 (mm)
The Maximum
Thinning Rate Y2 (%)
The Maximum
Thickening Rate Y3 (%)
HorizontalLongitudinal
16000.140.300.780.9668.413.1
26000.150.350.801.0798.913.3
36000.160.400.821.0519.314.3
46000.170.450.841.01210.322.5
57000.140.350.781.12310.814.6
67000.150.300.781.03510.613.5
77000.160.450.840.8989.214.5
87000.170.400.821.0529.314.0
98000.140.450.820.9569.014.6
108000.150.450.840.9728.515.2
118000.160.300.781.01610.114.5
128000.170.350.801.1399.314.2
139000.140.450.841.0169.813.2
149000.150.400.821.0199.915.2
159000.160.350.801.09210.513.6
169000.170.300.781.20111.215.4
Table 5. Results of range analysis for the maximum springback.
LevelsABC
Mean value k11.0271.015251.0545
Mean value k21.0271.026251.10825
Mean value k31.020751.014251.0195
Mean value k41.0821.1010.9745
Range R0.061250.086750.13375
Table 6. Results of range analysis under the maximum thickening rate.
LevelsABC
Mean value k19.2259.510.075
Mean value k29.9759.4759.875
Mean value k39.2259.7759.375
Mean value k410.3510.0259.45
Range R1.1250.550.7
Table 7. Analysis of variance for maximum springback optimization.
FactorDegree of Freedom fThe Sum of Squared Deviations SFSignificance of Influence
A30.1001.104Not significant
B30.0212.137Generally significant
C30.0384.281Highly significant
Table 8. Analysis of variance for the maximum thickening rate.
FactorDegree of Freedom fThe Sum of Squared Deviations SFSignificance of Influence
A33.7971.684Highly significant
B30.8070.358Generally significant
C31.3570.602Not significant
Table 9. The test results after dimensionless processing.
Test Number12345678910111213141516
Maximum Springback Y10.2240.5970.5050.3760.7430.6520.5420.5080.1910.2440.3890.7950.3890.3990.6401.000
Maximum Thickening Rate Y20.0000.1780.3210.6790.8570.7860.2860.3210.2140.0360.6070.3210.5000.5360.7501.000
Table 10. The correlation coefficients and correlation degrees of the experimental data of 16 groups.
Test NumberCorrelation Coefficient ζ1Correlation Coefficient ζ2The Degree of Correlation r
10.4910.9210.706
20.7350.9340.834
30.6540.9450.800
40.5670.9730.770
50.9120.9880.950
60.6160.9820.799
70.4090.9420.676
80.6580.9450.802
90.4770.9370.707
100.5000.9230.712
110.5750.9670.771
120.9980.9450.972
130.5750.9590.767
140.5810.9620.772
150.7790.9780.879
16111
Table 11. Range analysis of the average correlation degree of each factor to the optimization index.
LevelsA B C
Mean value k10.77750.78250.819
Mean value k20.806750.779250.90875
Mean value k30.79050.78150.77025
Mean value k40.85450.8860.73125
Mean value R0.0770.106750.1775
Table 12. The variance analysis of the average correlation degree of each factor to the optimization index.
FigureDegree of Freedom fThe sum of Squared Deviations SFThe sum of Squared Deviations
A30.0141.051Not significant
B30.0332.555Generally significant
C30.0705.438Highly significant
Disclaimer/Publisher’s Note: The statements, opinions and data contained in all publications are solely those of the individual author(s) and contributor(s) and not of MDPI and/or the editor(s). MDPI and/or the editor(s) disclaim responsibility for any injury to people or property resulting from any ideas, methods, instructions or products referred to in the content.

