1. Introduction
With the rapid increase in global population and the rapid development of industry and agriculture, the emission of pollutants from industrialization and agricultural production has risen, leading to the accumulation of harmful substances in soil and water, which severely threatens the natural environment and human life [
1,
2]. Non-point source pollution (NPSP) from land use activities is one of the key causes of environmental pollution, with its contribution far exceeding that of point source pollution from urban residents and industrial production [
3,
4]. China, with its large population and limited per-capita resources, has been promoting agricultural modernization and intensification. To achieve the necessary output from limited land, farmers and other agricultural stakeholders have relied heavily on chemical inputs such as pesticides and fertilizers, resulting in significant nitrogen (N) and phosphorus (P) losses, as well as pesticide residues. These pollutants exacerbate water eutrophication [
5], damage soil fertility and structure [
6], and increase greenhouse gas emissions [
7], leading to severe ecological problems.
The Dongting Lake Plain is an important grain-producing area in China, with significant ecological regulatory functions for the Yangtze River Basin. Since 2000, the total phosphorus content in Dongting Lake has exceeded safe levels, resulting in increasing eutrophication. Agricultural and ecological safety in the Dongting Lake Plain region has been severely threatened [
8]. Environmental regulation refers to a set of government actions aimed at addressing market failures in environmental externalities and promoting coordinated economic and natural development. It includes administrative regulations, market mechanisms, and public involvement to regulate pollutant emissions, making it an important tool for reducing NPSP from cultivated land [
9] and a key approach to achieving green economic growth.
To address agricultural environmental pollution, China has issued multiple policy documents, including the “Zero Growth of Fertilizer Use Action Plan” and the “Zero Growth of Pesticide Use Action Plan” (referred to as the “Fertilizer Zero Growth Action” and “Pesticide Zero Growth Action”, respectively) in 2015 [
10,
11]. These plans aim to reduce the use of chemical fertilizers and pesticides, creating a resource-efficient, environmentally friendly, and high-efficiency modern agricultural development model. The goal of the Fertilizer Zero Growth Action was to establish a scientific fertilization management and technical system by 2020, significantly improving fertilizer application efficiency. The Pesticide Zero Growth Action aimed to form a sustainable, resource-saving, environmentally friendly pest control technology system by 2020, controlling pesticide use intensity below average levels, with the goal of achieving zero growth in pesticide use.
Research on cultivated land NPSP and environmental regulation has produced substantial results, focusing on several key areas: (1) The causes and influencing factors of cultivated land NPSP, which is mainly due to excessive use of fertilizers, pesticides, and improper disposal of agricultural waste during land use [
12,
13]; factors such as farmer characteristics [
14], production input structures, degree of diversification, urbanization level [
15], economic growth, and agricultural financial support policies have significant effects on NPSP [
16,
17]. (2) Estimation of NPSP, with popular methods such as the model approach [
18], water quality and quantity method [
19], average concentration method [
20], and unit survey method [
21]. Currently, the unit survey method is widely used to estimate TN, TP intensity, and pesticide loss intensity. (3) Types of environmental regulation tools, commonly categorized into command-control type [
22], market-incentive type [
23], and voluntary type [
24]. (4) The impact of environmental regulations on pollution. Existing research has shown that environmental regulations have a significant impact on industry concentration [
25], green total factor productivity [
26], and carbon emissions [
27] in the industrial sector. With the worsening of agricultural pollution, the Chinese government has repeatedly issued environmental protection policies to guide green agricultural development.
While there has been extensive research in the theoretical and empirical fields of cultivated land NPSP and environmental regulations, there are still gaps that require further study: (1) Research on the influencing factors of cultivated land NPSP has mainly focused on economic and individual farmer factors, with limited studies on the impact of policy regulations on NPSP. (2) Most research on the impact of policy regulation on pollution has concentrated on industrial sectors, and there is a lack of research on the relationship between environmental regulations and cultivated land pollution. The study of rural agricultural environmental regulations is still in its early stages, and the actual impact of some existing policies remains to be studied. (3) There is a lack of empirical research on the spatial variation and mechanisms of pollutant emissions influenced by policy regulations.
The Fertilizer and Pesticide Zero Growth Actions are the most effective regulatory policies China has implemented in recent years to control excessive fertilizer and pesticide use, and they have a significant impact on NPSP from cultivated land. To evaluate the actual effects and implementation of the Fertilizer and Pesticide Zero Growth Actions, this study focuses on the Dongting Lake Plain, first calculating the NPSP (total nitrogen, total phosphorus, and pesticide loss intensities) and analyzing its spatial-temporal patterns. Then, using spatial econometric models, the study assesses the impact of these policies on NPSP, aiming to provide practical insights and recommendations for the development of future policy applications in cultivated land NPSP control.
2. Impact Mechanism, Materials, and Methods
2.1. Impact Mechanism
The Chinese Government has long been committed to addressing farmland NPSP, issuing numerous laws, regulations, and policies to ensure strong support for environmental protection and sustainable development. Based on existing documents, the Zero Growth Actions for fertilizers and pesticides primarily follow these technical paths: (1) Replacing conventional fertilizers with organic fertilizers and using efficient, low-toxicity pesticides instead of regular pesticides. (2) Implementing soil testing and formulated fertilization, promoting precision fertilization and pesticide application technologies to improve the utilization rates of fertilizers and pesticides. (3) Adjusting crop structures by reducing the planting area of crops with high fertilizer and pesticide consumption. (4) Supporting demonstration projects for fertilizer and pesticide reduction, encouraging surrounding areas to adopt scientific approaches in the use of fertilizers and pesticides.
According to externality theory, the core issue in managing farmland NPSP is addressing the negative externalities of pollution. “Market failure” necessitates government intervention through various regulatory methods to provide institutional support for agricultural environmental protection. On the one hand, the government can use compulsory measures to directly regulate and control farmland NPSP. For example, to address the overuse of fertilizers and pesticides, strict registration systems for these inputs are implemented, with rigorous supervision of their sources and users, thereby effectively controlling their application at the source. Moreover, stringent government regulation can stimulate the development of technologies aimed at reducing and improving the efficiency of fertilizers and pesticides, positively incentivizing environmentally friendly agricultural production behaviors, and thereby reducing farmland NPSP. On the other hand, under conditions of information asymmetry, the government can appropriately use incentive-based measures to encourage farmers to adopt environmentally sustainable farming practices. This could include the development and promotion of green and efficient fertilizers, precision fertilization based on soil testing, the use of organic fertilizers, water-saving irrigation techniques, and the application of crop residue decomposition technologies. Additionally, the government can increase investment in public outreach through various media platforms, such as radio, television, newspapers, and the internet, to widely promote the scientific use of fertilizers and pesticides. By raising farmers’ awareness of sustainable land resource utilization, the likelihood of farmland NPSP can be naturally reduced.
2.2. Study Area and Data
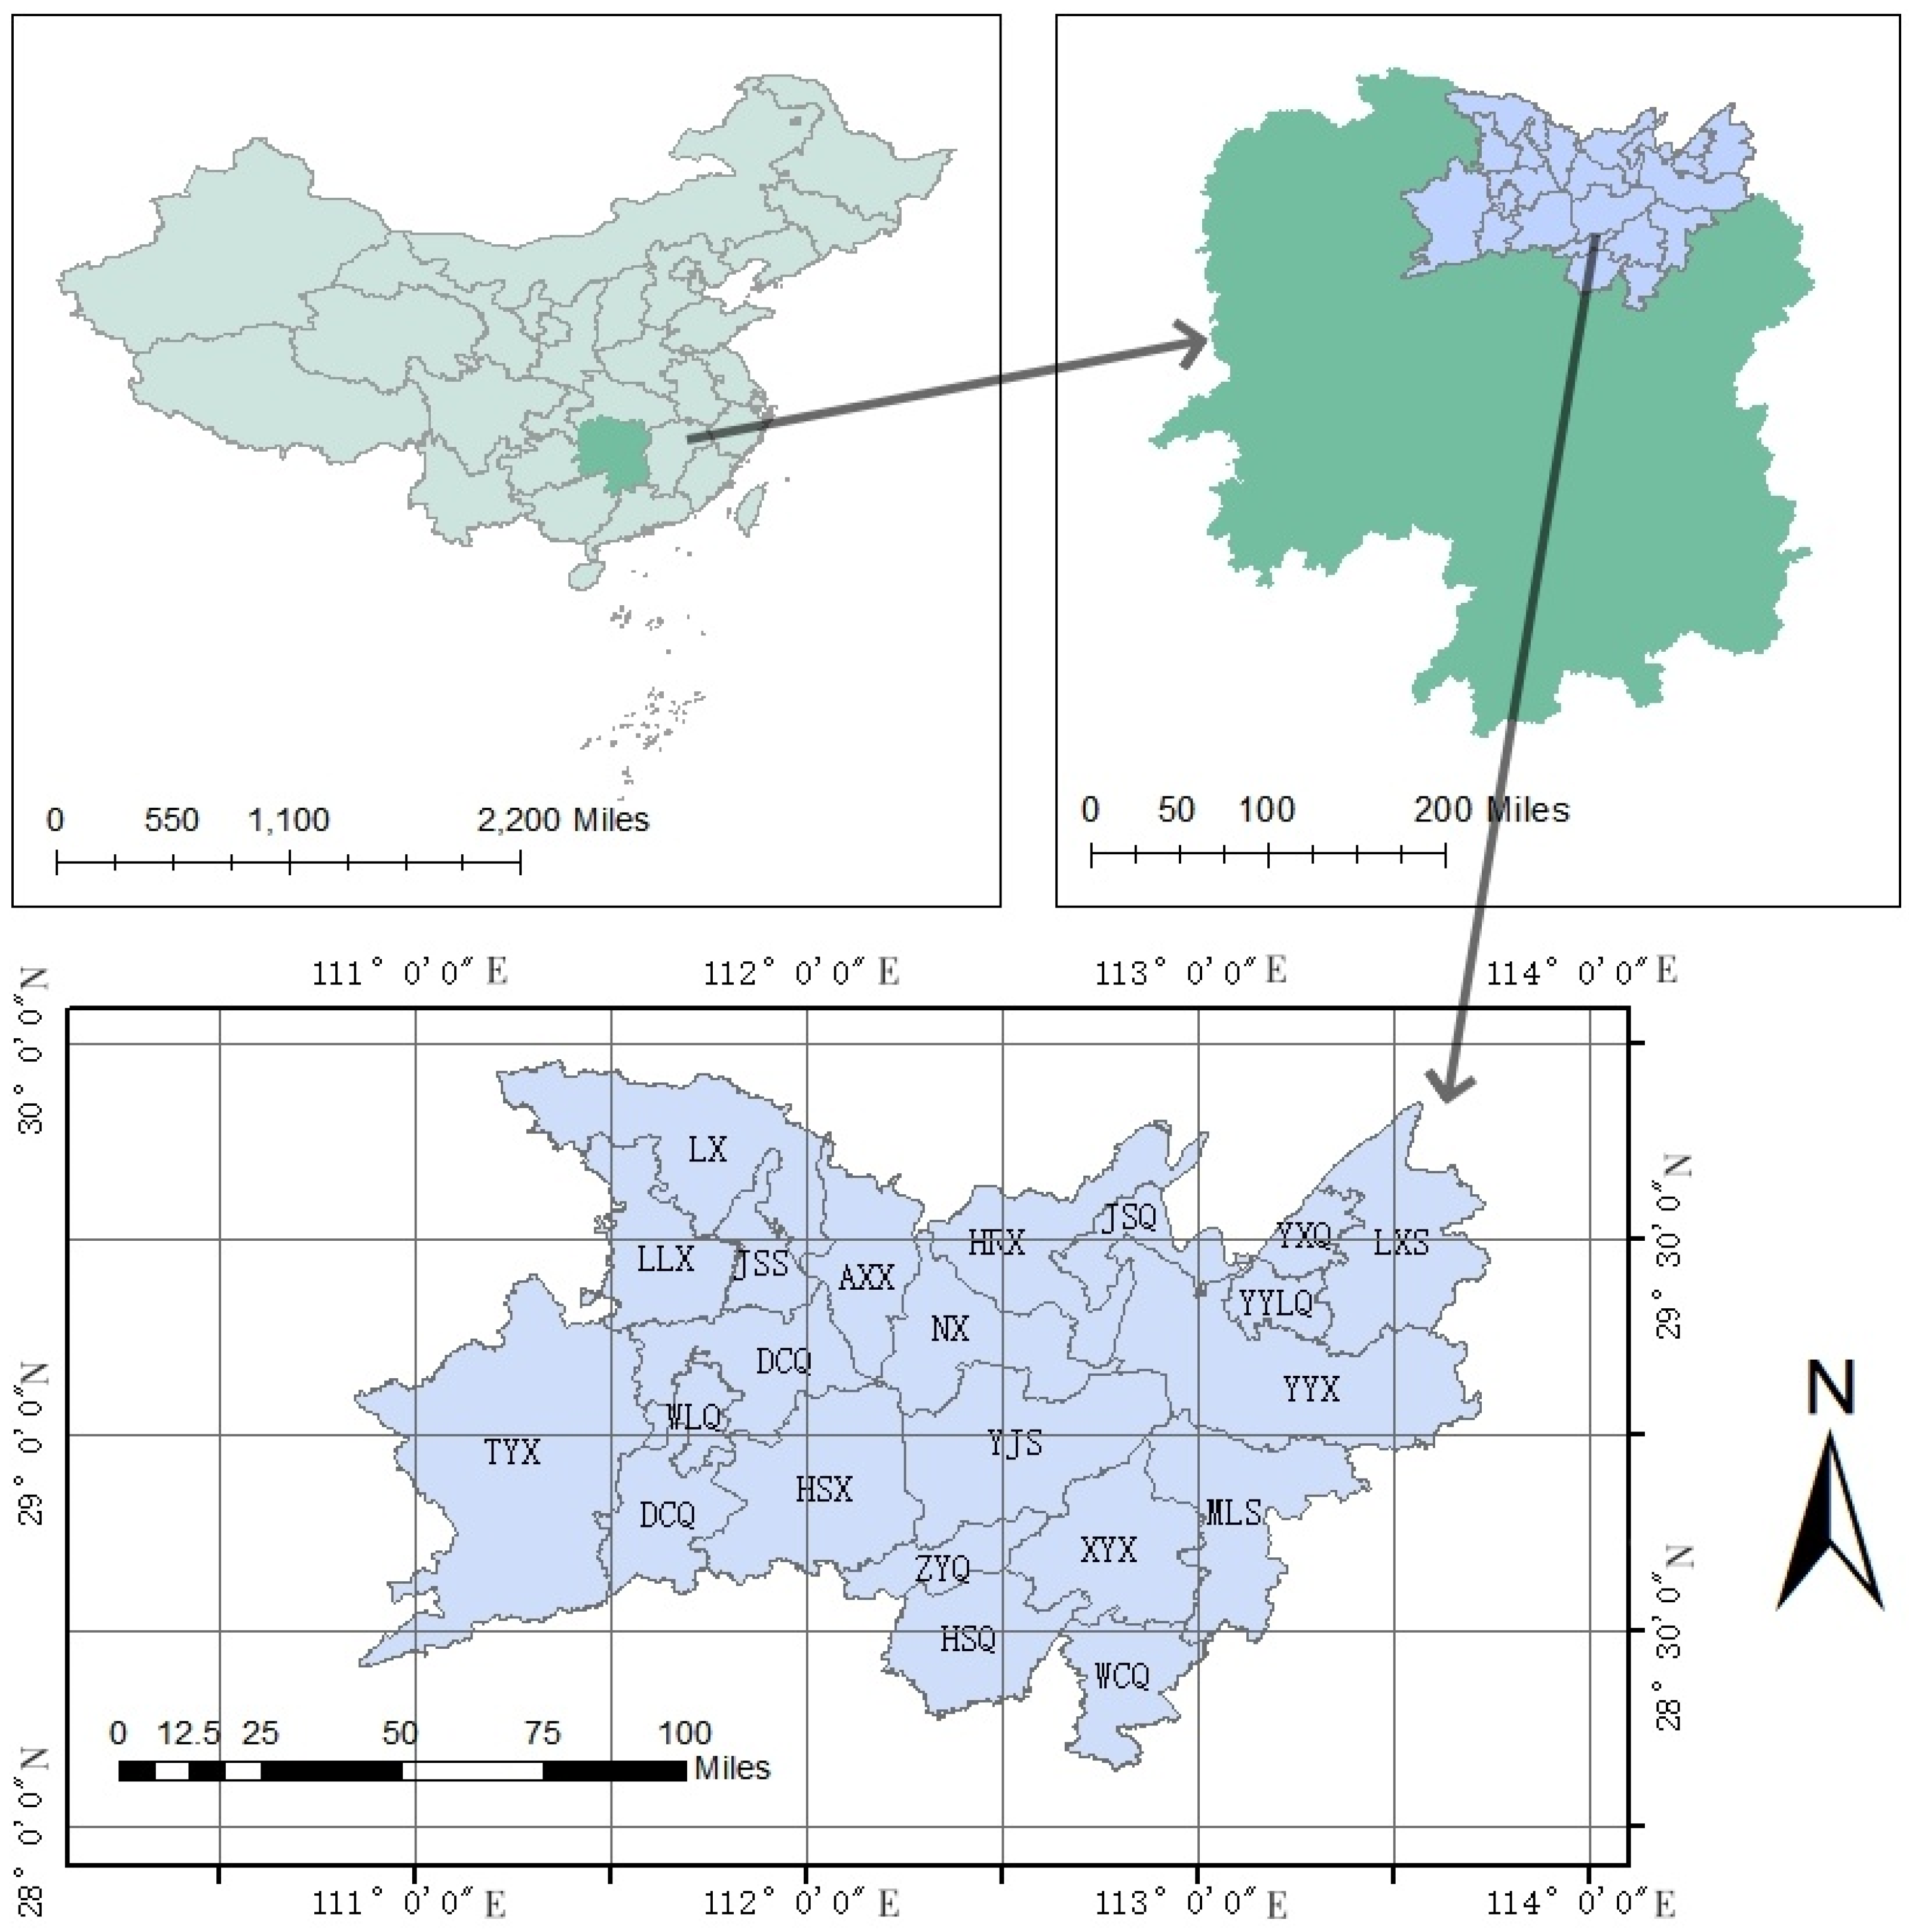
The Dongting Lake Plain is located in the northeastern part of Hunan Province, China, covering 33 counties (cities, districts) in both Hunan and Hubei Provinces, with a total area of 18,000 km
2, of which 15,000 km
2 is within Hunan Province. The Dongting Lake Plain has flat terrain and fertile soil, making it an important grain production base in China. In 2020, the effective irrigated area of the Dongting Lake Plain reached 980,000 hectares, with a grain sown area of 1.255 million hectares, and a total grain output of 7.9 million tons. The agricultural output value reached 86.445 billion yuan. Compared to 2010, the per-unit grain yield and agricultural output value of the Dongting Lake Plain increased by 448.03 kg/hm
2 and 44.769 billion yuan, respectively. The rapid development of agriculture is closely tied to advances in agricultural technology as well as the increased input of yield-enhancing materials such as pesticides and fertilizers. In 2020, the total fertilizer application in the Dongting Lake Plain reached 2,406,676 tons, and pesticide use reached 23,581 tons, accounting for 30.12% and 23.24% of Hunan Province’s total fertilizer and pesticide use, respectively. The ecological security of the Dongting Lake Plain is of great significance. In light of the current situation of agricultural NPSP in the region, the Hunan Provincial Agricultural Committee issued the ’Zero Growth Action Plan for Fertilizer Use in Hunan Province by 2020’ and the ’Zero Growth Action Plan for Pesticide Use in Hunan Province by 2020’, explicitly stating the need to establish scientific management and technical systems to ensure that the Dongting Lake region takes the lead in achieving negative growth in the use of fertilizers and pesticides. Therefore, selecting the Dongting Lake Plain region for research holds significant importance.
Figure 1 shows the specific location of Dongting Lake.
Original data on nitrogen, phosphorus, potassium, and compound fertilizer use, pesticide use, agricultural output value, urbanization population, agricultural technology level, and cultivated area for 21 counties (cities, districts) in the Dongting Lake Plain from 2010 to 2020 are sourced from the “Hunan Rural Statistical Yearbook”, “Hunan Statistical Yearbook”, “Changsha Statistical Yearbook”, “Yueyang Statistical Yearbook”, “Changde Statistical Yearbook”, and “Yiyang Statistical Yearbook”,
Table 1 shows the specific sources of the data used.
2.3. Methods
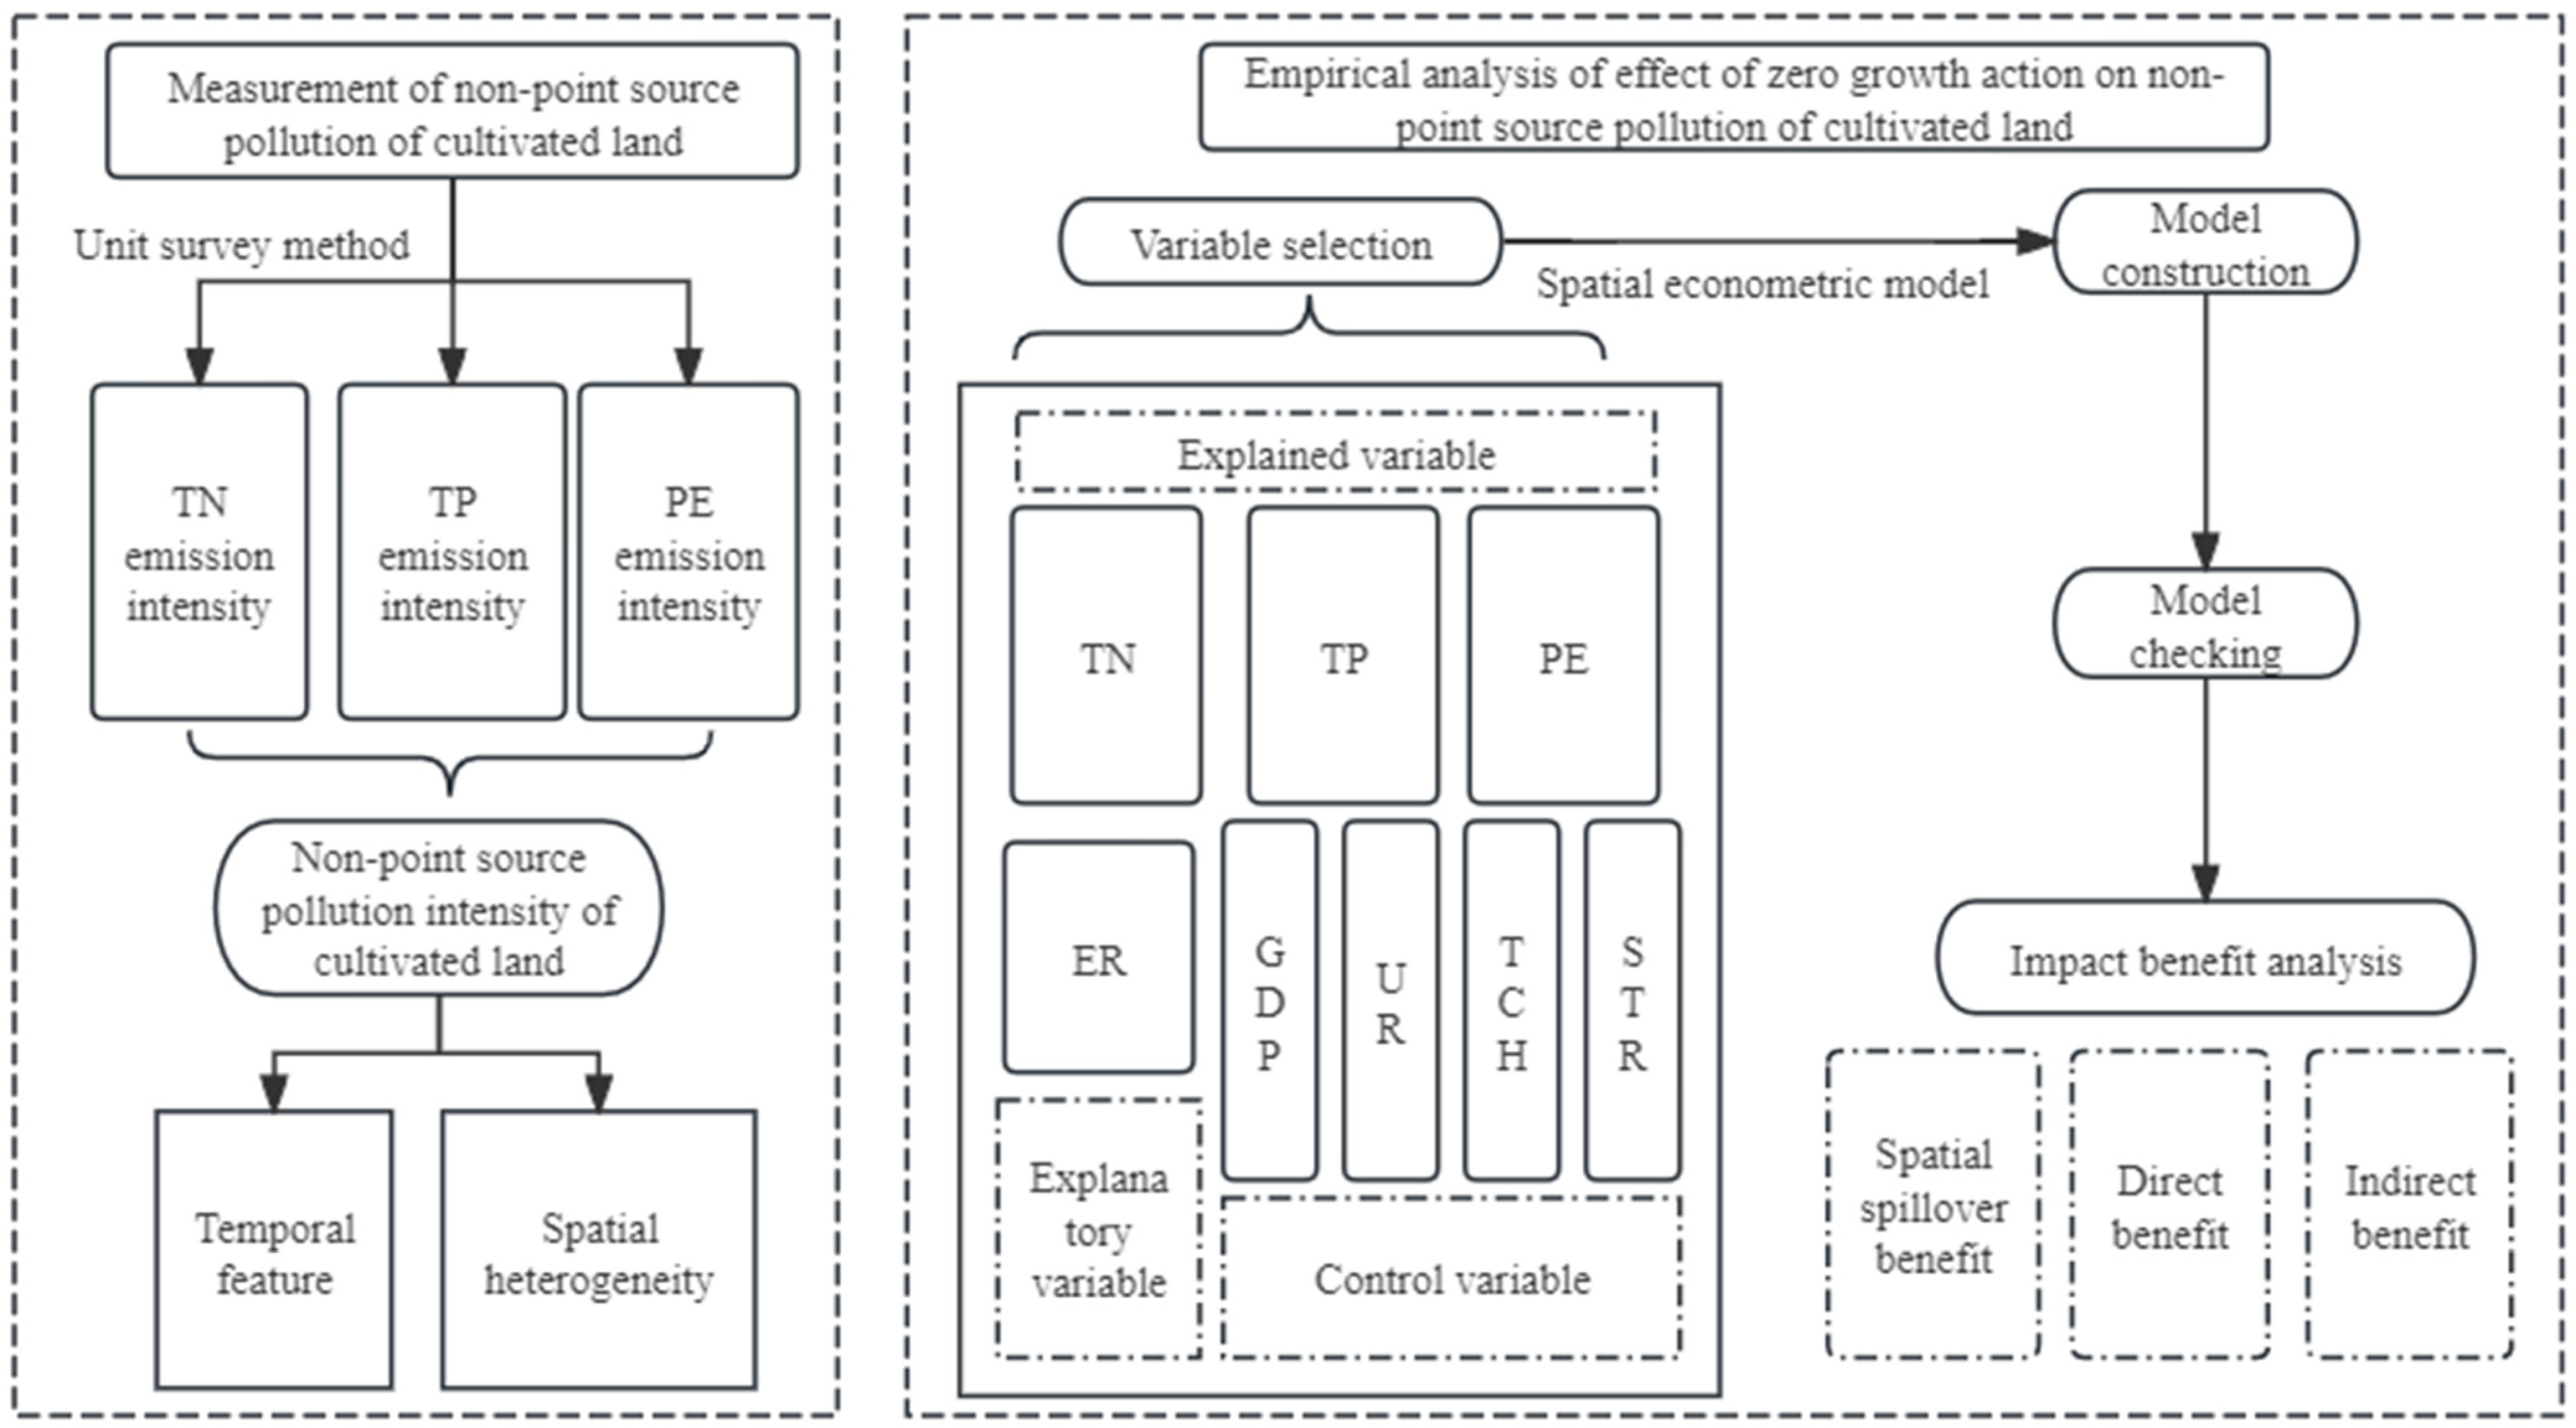
In this study, we first applied the unit survey method to calculate the emission intensities of TN, TP, and PE, illustrating the spatiotemporal characteristics of agricultural NPSP in the Dongting Lake Plain. Subsequently, we used agricultural NPSP as the dependent variable, incorporating the dummy variable for the Zero Growth Action policy on fertilizers and pesticides, along with control variables such as regional economic development levels, urbanization levels, agricultural technological progress, and cropping structure. These factors were included in a spatial econometric model to evaluate the impact of the Zero Growth Action policy on agricultural NPSP and assess the spatial effects of various influencing factors.
Figure 2 shows the methods and processes we used.
2.3.1. Calculation Method for Farmland NPSP
NPSP is characterized by being dispersed, hidden, and random, making long-term monitoring difficult. This paper adopts the widely used unit survey method in academic research to estimate the amount of NPSP from cultivated land in various regions of the Dongting Lake Plain. From the perspective of pollution sources, NPSP units in cultivated land are defined as two units: agricultural fertilizer pollution and pesticide pollution [
21,
33]. Fertilizers primarily include nitrogen, phosphorus, potassium fertilizers, and compound fertilizers. Since the application of potassium fertilizers does not affect the environment, nitrogen fertilizers, phosphorus fertilizers, compound fertilizers, and pesticides are selected as the focus of this study. Total nitrogen (TN), total phosphorus (TP), and pesticide loss are used as the pollution indicators for calculation. As different types of fertilizers have varying absorption and utilization rates, and pesticide loss rates also differ, the emission coefficients for each pollutant are determined based on environmental statistics, existing research results, and the actual conditions of the study area. The emission coefficient is equal to the product coefficient multiplied by the loss rate, with the specific calculation formula as follows:
Si represents the emission intensity of the
i-th pollutant,
Pi represents the amount of the
i-th pollutant used,
αi represents the runoff coefficient of the
i-th pollutant, and
A represents the area of the cultivated land. To calculate the emission intensity of TN and TP from fertilizers, the emission intensity indicators for various pollutants are shown in
Table 2.
2.3.2. Selection of Variables
Dependent Variables: Based on the concept of farmland NPSP and the research objectives, this study uses TN emission intensity (denoted as TN), TP emission intensity (denoted as TP), and pesticide runoff intensity (denoted as PE) as the dependent variables.
Independent Variables: The Zero Growth Action on Fertilizers and Pesticides is an environmental regulatory policy aimed at controlling NPSP. Thus, this study takes the Zero Growth Action on Fertilizers and Pesticides as the independent variable to verify whether this policy has spatial impacts on farmland NPSP in the Dongting Lake Plain and what kind of spatial effects it generates. Based on the “Zero Growth Action Plan for Fertilizer Use by 2020” and the “Zero Growth Action Plan for Pesticide Use by 2020” issued by the former Ministry of Agriculture in February 2015, a policy dummy variable representing environmental regulation (ER) is used to reflect the implementation of the Zero Growth Action. Years before its implementation are assigned a value of 0, and years after its implementation are assigned a value of 1.
Control Variables: Referring to relevant research findings [
36,
37,
38] and considering the availability of county-level data, this study selects four control variables: regional economic development level (GDP), urbanization level (UR), agricultural technological progress (TCH), and cropping structure (STR).
Regional Economic Development Level (GDP): According to the Environmental Kuznets Curve (EKC) hypothesis, when the economy has not developed to a certain level, economic growth is inevitably accompanied by increased environmental pollution. However, after reaching a “critical point,” further economic growth will gradually reduce pollution levels and improve environmental quality. Therefore, per-capita GDP is used to measure the regional economic development level, reflecting the impact of economic growth on farmland NPSP [
39,
40].
Urbanization Level (UR): Research by Zhang Yi found that the level of urbanization affects farmers’ pesticide production behavior, which in turn impacts NPSP [
41].
Agricultural Technological Progress (TCH): Advances in agricultural technology can improve agricultural production efficiency or reduce input use by changing production methods and providing environmentally friendly technologies [
33]. In this study, the agricultural technological progress rate is calculated using the DEA-Malmquist model to measure the level of technological progress.
Cropping Structure (STR): The cropping structure is measured by the ratio of the planting area of cash crops to that of all crops. Different crops require varying types and amounts of fertilizers and pesticides. In general, the input of agricultural materials for cash crops is significantly higher than that for grain crops, and their utilization efficiency is relatively lower. Thus, changes in cropping structure can reflect the varying demands for agricultural inputs.
Table 3 shows the explanations of various indicator variables.
2.3.3. Spatial Econometric Models
Environmental regulation policies exhibit geographic consistency and regional adjacency, meaning that the impact of the Zero Growth Action on farmland NPSP also has spatial correlations ([
42]). To verify whether the Zero Growth Action for fertilizers and pesticides has spatial effects on farmland NPSP in the Dongting Lake Plain and to understand the nature of these spatial effects, this paper, based on the identified spatial autocorrelation, aims to construct a policy dummy variable for the Zero Growth Action as an explanatory variable. A spatial panel econometric model will be employed to estimate the farmland NPSP in the Dongting Lake Plain from 2010 to 2020. The general form of the spatial panel econometric model is expressed as follows:
is the first-order time lag of the dependent variable (in this study, TN emission intensity, TP emission intensity, and pesticide runoff intensity), is the coefficient for the time lag of the dependent variable, is an element in the spatial weight matrix, is the spatial lag coefficient of the dependent variable, represents the -th independent variable, and is the spatial lag coefficient for the -th independent variables. represents the individual effect of region , represents the time effect of region , is the error term of the model, is the spatial autocorrelation coefficient of the error term , and is the intercept of the model.
By incorporating the variables of cultivated land NPSP (
CNP), environmental regulation (
ER), regional economic development level (
GDP), urbanization level (
UR), agricultural technological progress (
TCH), and planting structure (
STR) into the model, the preliminary regression model is as follows:
To examine the impact of zero-growth actions and other variables on cropland surface pollution and the inter-regional spatial effects of cropland surface pollution, a spatial panel econometric model is formed by adding a spatial weight matrix based on the preliminary model set in Equation (2). In the spatial lag model, the spatial lag term of cropland surface pollution (
CNP) is added to the model (2), considering the impact of emissions from cropland surface pollution in neighboring regions on cropland surface pollution in the region, and it is set as follows:
To identify the spatial dependence caused by omitted variables or unobserved factors, model (2) is transformed into a spatial error model as follows:
The Spatial Durbin Model, based on the spatial lag model, takes into account both the spatial correlation of the independent variables and the explanatory variables, and adds the explanatory variables of the neighboring elements as additional predictor variables to the model, as expressed below:
Maximum likelihood estimation will be used to estimate the results of these models based on actual sample data. The results will be tested for significance to select the spatial econometric model that best explains farmland NPSP and the Zero Growth Action’s impact.
3. Results
3.1. Spatiotemporal Characteristics of Farmland NPSP in Dongting Lake Plain
(1) Temporal Variation Characteristics of Farmland NPSP
Figure 3 shows the trends in TN and TP emissions and pesticide losses from 2010 to 2020 in the Dongting Lake Plain. From the figure, it is evident that in 2020, the TN and TP emissions were 3372.23 tons and 384.24 tons, respectively, while pesticide losses amounted to 11,790.70 tons. Compared to 2010, TN emissions decreased by 26.71%; TP emissions showed little change compared to 2010 but decreased by 7.11% compared to 2015; and pesticide losses decreased by 23.22% from 2010. Overall, the emission levels of various pollutants show a downward trend, indicating an improvement in agricultural NPSP.
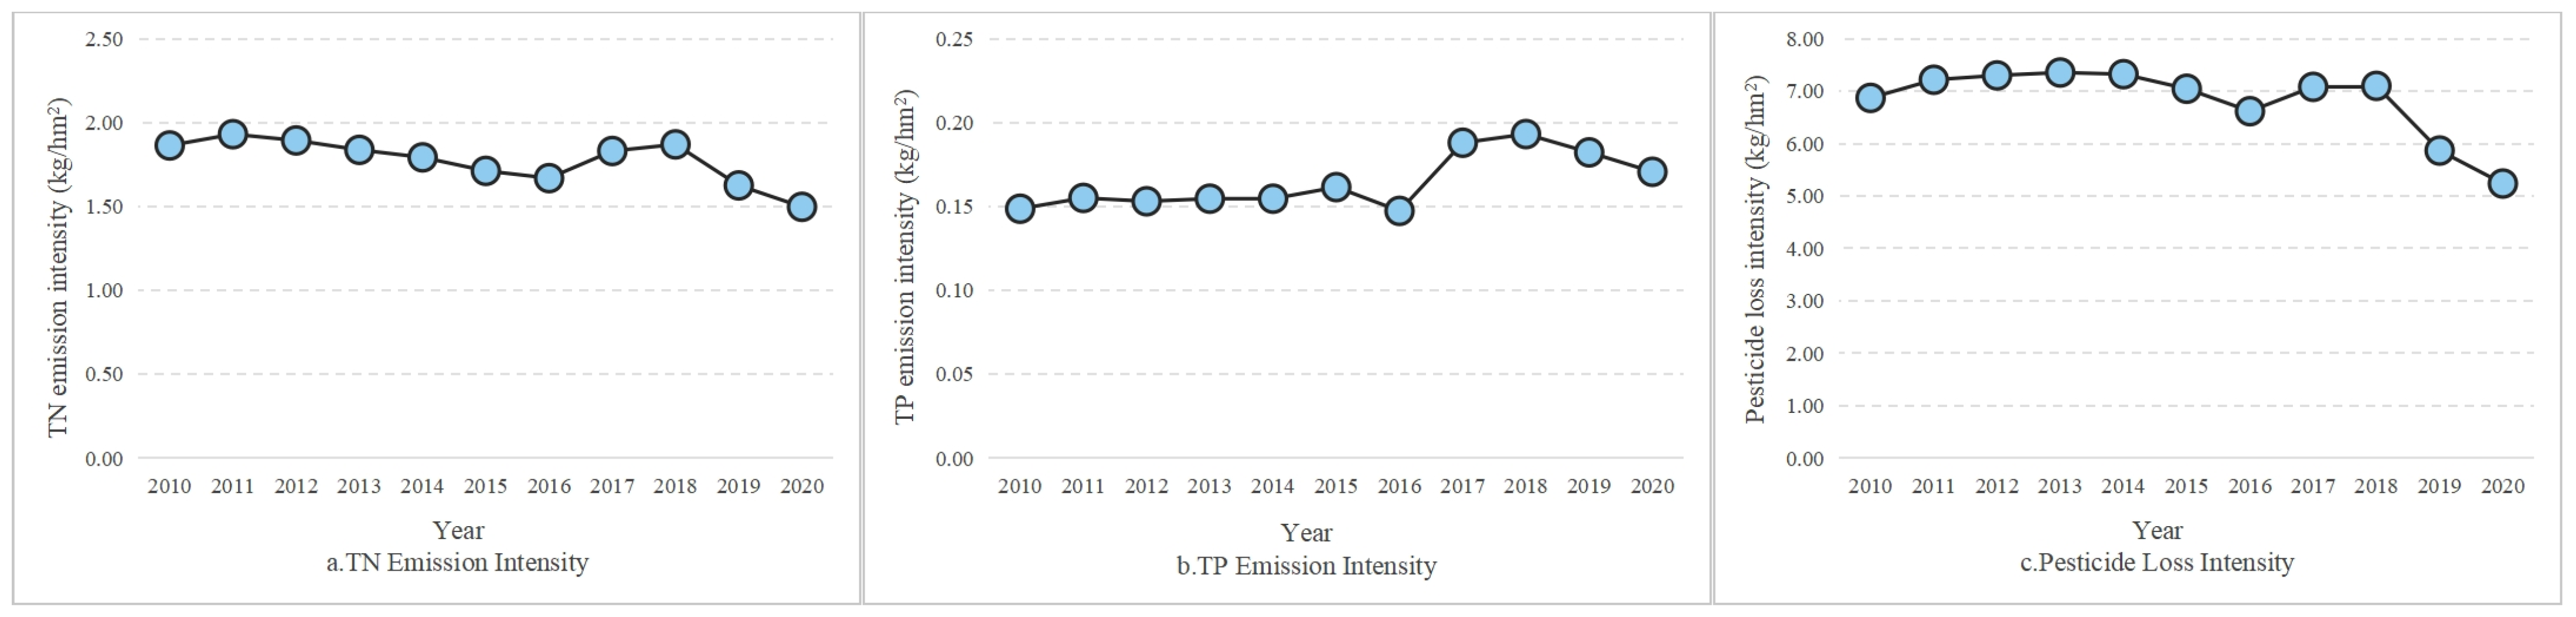
Figure 4 illustrates the trends in TN (Total Nitrogen), TP (Total Phosphorus) emission intensity, and pesticide runoff intensity in the Dongting Lake Plain from 2010 to 2020. Overall, the emission intensities of TN, TP, and pesticide runoff showed a fluctuating but downward trend. TP emission intensity decreased to 1.54 kg/hm
2 in 2020, a reduction of 18.08% compared to 2010. TP emission intensity remained relatively stable around 0.15 kg/hm
2 between 2010 and 2015. By 2020, TP emission intensity had increased by 20.79% compared to 2010 but decreased by 4.42% compared to 2018. Pesticide runoff intensity in 2020 saw a 27.22% reduction compared to 2010. Overall, the decline in emission intensities of various pollutants indicates that the efforts to manage farmland NPSP in the Dongting Lake Plain have achieved certain successes.
(2) Spatial Distribution Characteristics of Farmland NPSP
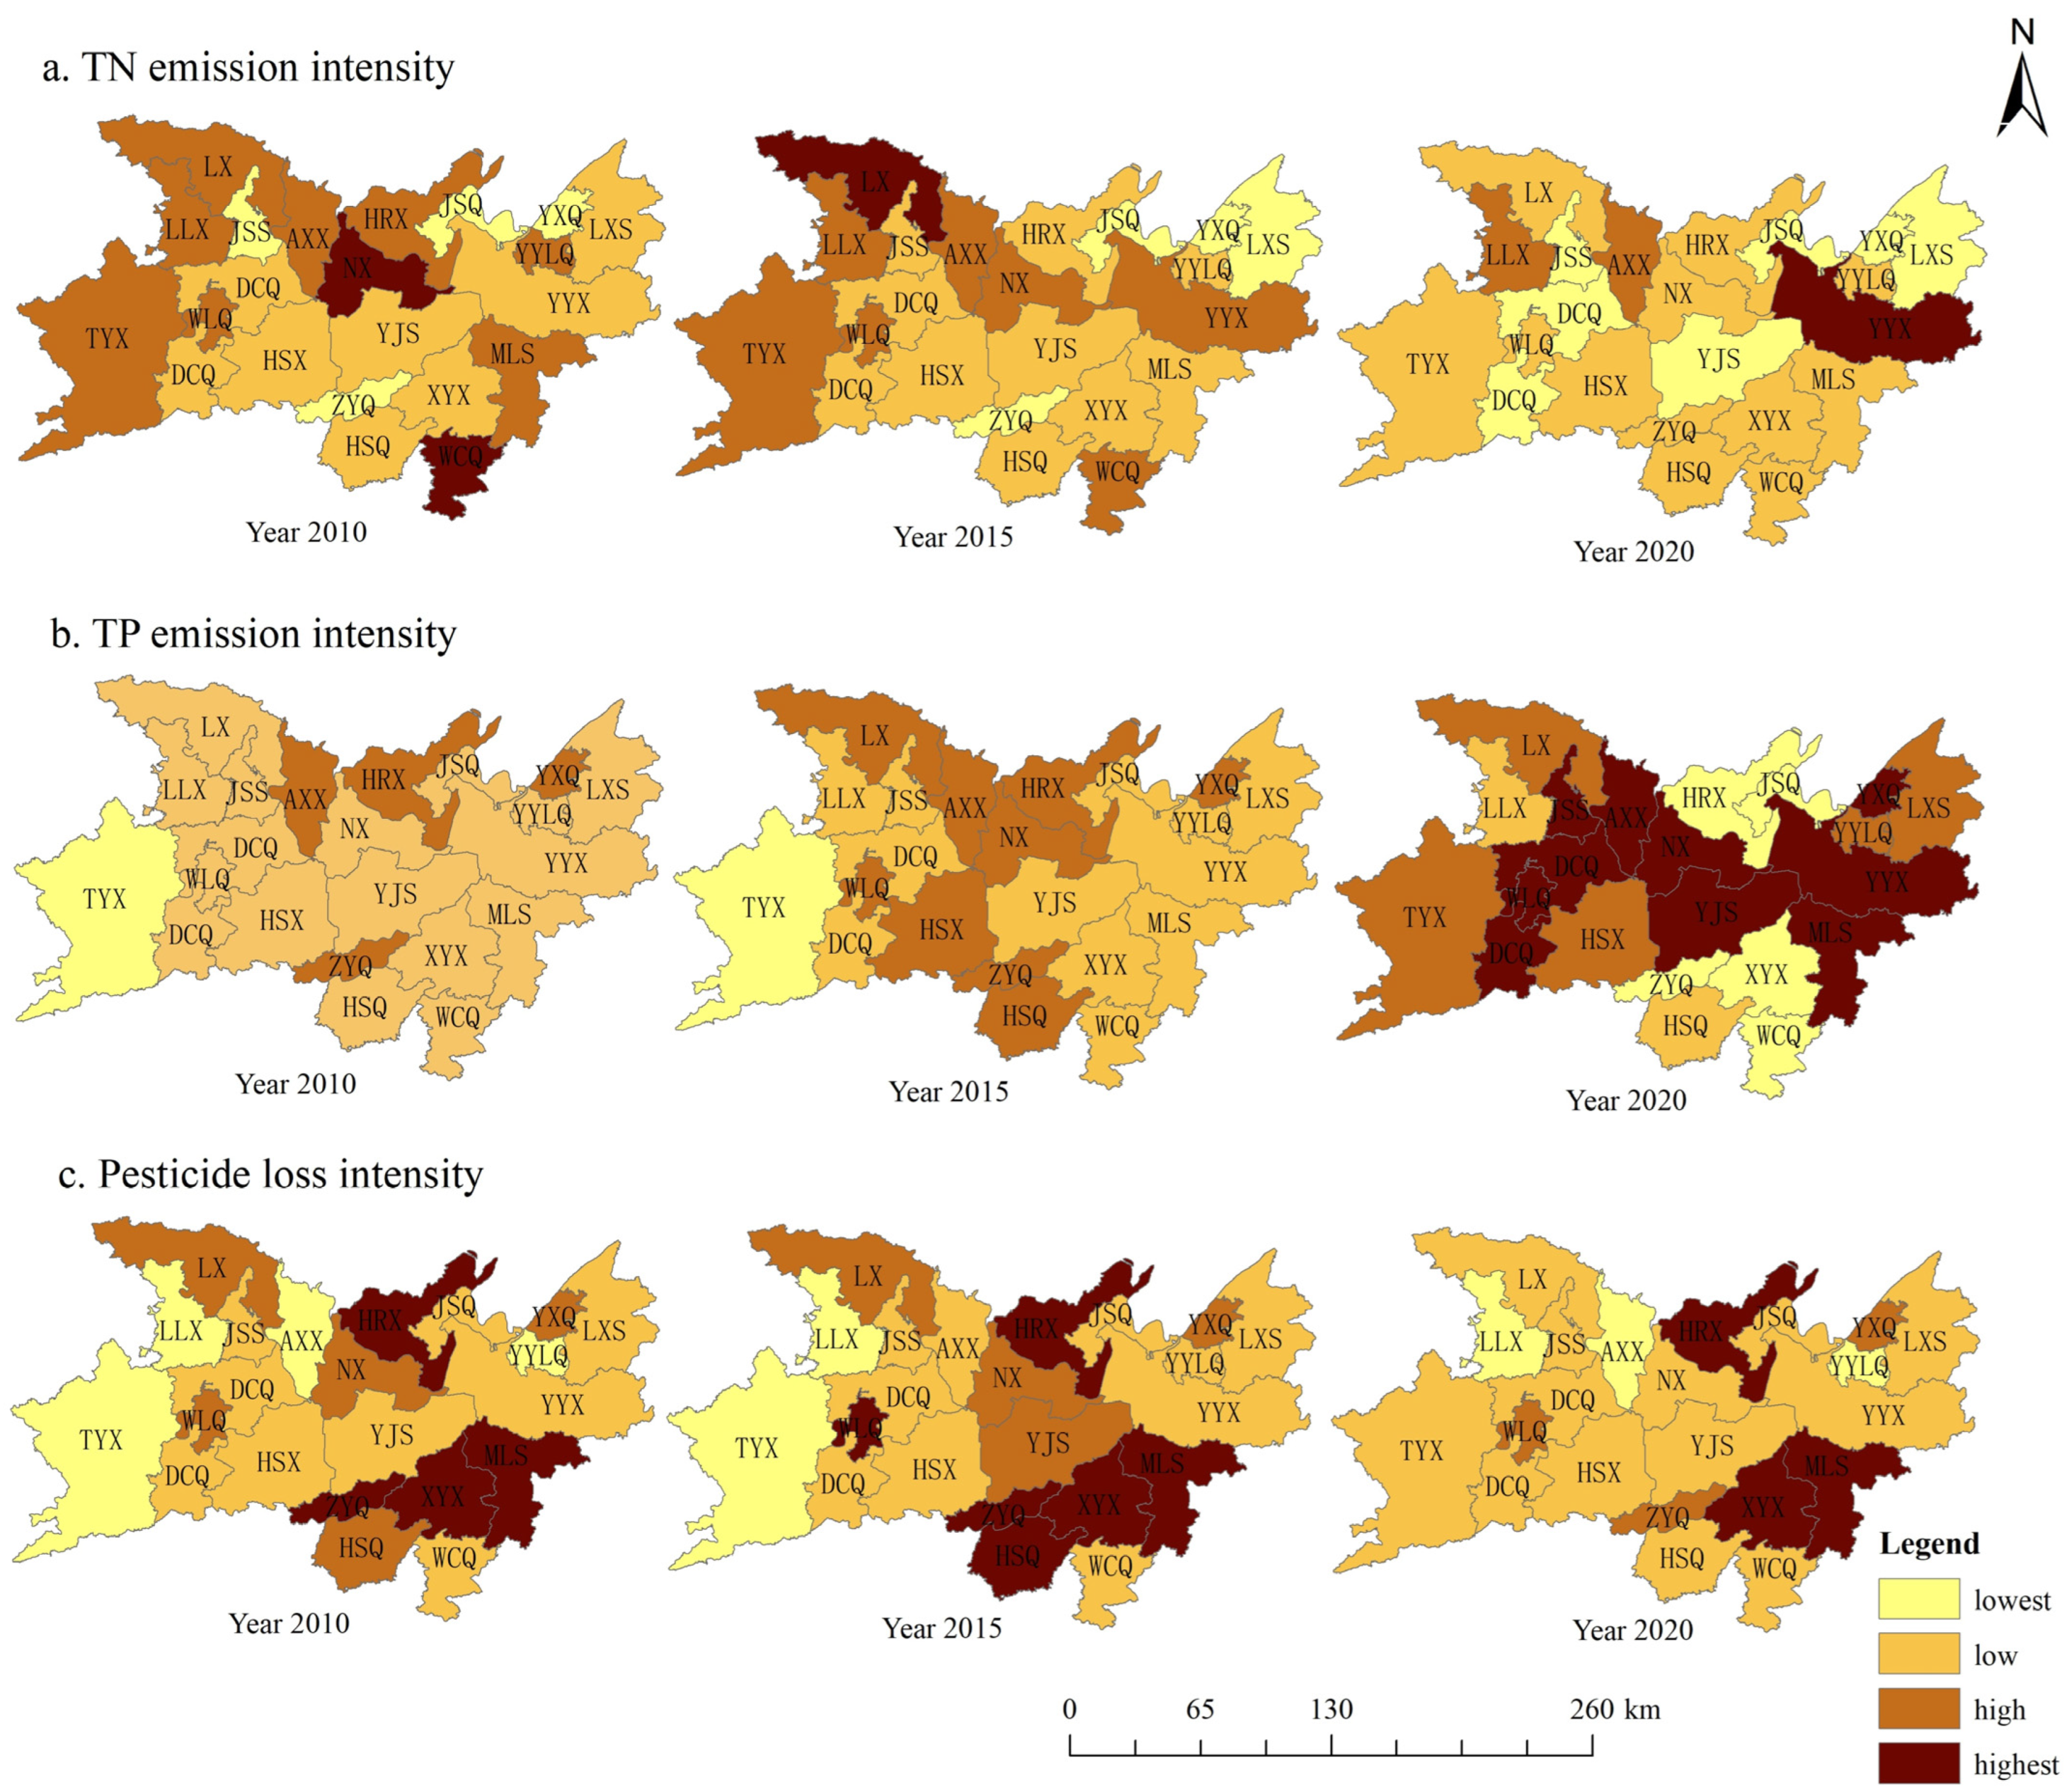
To investigate the impact of the Zero Growth Action on farmland NPSP since 2015,
Figure 4a–c displays the spatial distribution of TN, TP emission intensities, and pesticide loss intensities for the years 2010, 2015, and 2020.
Figure 5a shows the spatial distribution of TN emission intensity in 2010, 2015, and 2020. In 2010, high TN emission intensity regions were concentrated in NX and WCQ, with high-value areas mostly in the western and northern parts of the Dongting Lake Plain. By 2015, only LX remained a high-value area, with high-value regions mainly in the western and northern parts. By 2020, high TN emission intensity areas were reduced to YYX, with most areas having lower TN emission intensities.
Figure 5b shows the spatial distribution of TP emission intensity. Over time, the high TP emission intensity regions shifted towards the central area. In 2010, TP emission intensity was lower across most of the Dongting Lake Plain, with some higher values in the north and south. By 2015, the area with high TP emission intensity expanded, adding five more counties (cities, districts) compared to 2010. In 2020, there were ten high TP emission intensity areas mainly concentrated in the central Dongting Lake Plain, with five additional high-value areas surrounding them.
Figure 5c depicts the spatial distribution of pesticide loss intensity. High pesticide loss intensity areas were primarily in the southeastern part of the Dongting Lake Plain, with a gradual decrease in the number and extent of high-value areas over time. In 2010, there were four high-value areas and five higher-value areas; by 2015, the number of high-value areas increased to six, with four higher-value areas, primarily around XYX. By 2020, the number of high-value areas decreased to three, with three higher-value areas, and most counties (cities, districts) showed lower pesticide loss intensity.
3.2. Exploratory Spatial Data Analysis of Farmland NPSP
Spatial autocorrelation analysis is a spatial statistical method used to reveal the regional structure of spatial variables. It includes both global and local spatial autocorrelation. Global spatial autocorrelation is a statistical method used to measure the degree of spatial data aggregation or spatial dependence across the entire study area. It primarily explores whether there is clustering (high values adjacent to high values, low values adjacent to low values) or dispersion (high values adjacent to low values) of variables within the entire spatial scope. Local spatial autocorrelation focuses on analyzing the spatial autocorrelation relationship between individual spatial units and their neighboring units within the study area, revealing the heterogeneity of spatial data within a local range.
The global Moran’s I index was used to test the spatial autocorrelation and clustering effects of farmland NPSP from 2010 to 2020 in the Dongting Lake Plain, as shown in
Table 4. The global Moran’s I index for TN emission intensity, TP emission intensity, and pesticide loss intensity are generally positive from 2010 to 2020. Specifically, the spatial autocorrelation of TP emission intensity was low, with a significant global Moran’s I index only in 2016. The global Moran’s I index for TN emission intensity was positive in all years except for 2020, with strong significance in 2010 and 2015–2019. The global Moran’s I index for pesticide loss intensity was significant and positive from 2011 to 2018 but not significant in 2010, 2019, and 2020. These results suggest that while some indicators and years showed non-significant global Moran’s I index values, there is generally spatial autocorrelation and clustering in farmland NPSP during the study period.
To further explore the local spatial clustering characteristics of farmland NPSP intensity in the Dongting Lake Plain, the Local Moran’s I index was used to measure spatial clustering of pollution intensity for 2010, 2015, and 2020.
Figure 5 displays the LISA clustering maps of TN, TP emission intensity, and pesticide loss intensity, with all clusters tested for significance at the 10% level.
Figure 6a shows the LISA clustering maps of TN emission intensity. Overall, TN emission intensity shifted from high-high clustering to low-low clustering over the study period, indicating a reduction in TN emission intensity with clustering. In 2010, high-high clustering areas were in HSX and YJS; in 2015, high-high clustering areas were in HSX and AXX; by 2020, no high-high clustering areas were observed, with low-low clustering areas appearing in HSX, WCQ, and XYX in the southern part.
Figure 6b shows the LISA clustering maps of TP emission intensity. TP emission intensity also shifted from high-high to low-low clustering. In 2010, there was one high-high clustering area in HSX; in 2015, high-high clustering areas were in HSX and AXX; by 2020, no high-high clustering areas were observed, and one low-low clustering area appeared in HRX.
Figure 6c shows the LISA clustering maps of pesticide loss intensity. Low-low clustering areas for pesticide loss intensity increased, indicating a reduction in pesticide loss intensity with spatial clustering. In 2010, there was one low-low clustering area in the northwest of the Dongting Lake Plain; in 2015, there were one high-high and two low-low clustering areas, mainly in the central region; by 2020, no high-high clustering areas were present, with three low-low clustering areas.
3.3. Analysis of Spatial Effects of Agricultural NPSP
- (1)
Model Selection and Testing
Table 5 shows that Moran’s I indices for TN (Total Nitrogen), TP (Total Phosphorus), and PE (Pesticide Loss) are significant at the 10% level, indicating that spatial econometric analysis is necessary. At the 10% significance level, both the LM test and the Robust LM test for TN reject the null hypothesis of “no spatial lag” and “no spatial error”; TP and PE pass the LM test and Robust LM test for spatial lag and spatial error terms, but are not sufficient to decide whether to use the Spatial Durbin Model. Therefore, the Likelihood Ratio (LR) test is further introduced.
Table 6 shows that the LR test results for TN, TP, and PE indicate that both the spatial lag and spatial error terms pass the LR test at the 10% significance level. This suggests that the models for TN, TP, and PE should be specified as spatial panel Durbin models.
To determine whether to use fixed effects or random effects models, the Hausman test is typically used. The hypotheses are:
Under the null hypothesis, the Hausman statistic is defined as:
When the null hypothesis
holds,
H follows chi-square distribution, and the Hausman statistic can be defined as:
Here,
is the variance matrix of the limiting distribution of
, and
is the variance-covariance matrix of the estimation of
. If the null hypothesis holds, the random effects model should be used; otherwise, the fixed effects model should be applied. In this study, the corresponding spatial econometric models were used to perform the Hausman test on TN, TP, and PE, and the results are shown in
Table 7. It can be seen that all three explanatory variables passed the test at the 10% significance level, rejecting the null hypothesis of random effects.
- (2)
Results Analysis
Table 8 presents the Ordinary Least Squares (OLS) estimation results. The models for TN, TP, and PE pass the F-test. The results show that the implementation of the zero-growth policy for fertilizers and pesticides significantly reduces TN emission intensity and pesticide loss intensity at the 10% level, but has a positive effect on TP emission intensity. This indicates that while the zero-growth policy is effective in reducing TN and PE emissions, its impact on TP is less pronounced. The spatial econometric models are required due to the spatial dependence of NPSP emissions, which invalidates the use of standard regression models.
Table 9 presents the estimation results of the spatial panel Durbin regression model using the maximum likelihood estimation method. The R
2 values of the three models for TN (Total Nitrogen), TP (Total Phosphorus), and PE (Pesticide Emissions) are all higher than those from ordinary OLS regression, and the spatial autoregressive coefficients for the emission intensities of TN, TP, and PE are all significantly positive. This is consistent with the test results of Moran’s I index, indicating a significant spatial clustering effect of farmland NPSP emission intensity across the counties (cities, districts) in the Dongting Lake Plain. The significant spatial spillover effect means that the farmland NPSP emission levels in each region are influenced by the neighboring regions’ emissions.
From the regression coefficients of environmental regulation (ER), environmental regulation has a clear negative impact on TN emission intensity and pesticide runoff intensity. According to statistical yearbooks, after the implementation of the Zero Growth Action for fertilizers, the use of nitrogen, phosphorus, and potassium fertilizers has decreased to some extent, while the use of compound fertilizers has continued to rise, leading to an increase in TP emission intensity. Among the control variables, the level of regional economic development has a significant negative effect on pesticide runoff intensity, whereas urbanization level has a significant positive effect on pesticide runoff intensity.
Based on the spatial spillover effect estimation results using the maximum likelihood estimation method, it was found that environmental regulation (WER), regional economic development level (WGDP), urbanization level (WUR), and agricultural technological progress (WTCH) all have certain spatial spillover effects on cultivated land NPSP. In other words, changes in factors within a given region not only affect the NPSP in that region but also influence the pollution in neighboring areas. Compared to the coefficients for local pollution emission intensity, the effect of environmental regulation on local cultivated land NPSP emission intensity is negative, while the effect on neighboring regions is positive. These effects are in opposite directions, indicating that the zero-growth action can reduce cultivated land NPSP emissions in the local area but exacerbate pollution emissions in adjacent areas. However, by comparing the coefficients, it is evident that the absolute value of the negative effect coefficient is much greater than the positive one, meaning that overall, the zero-growth action of fertilizers and pesticides still effectively reduces the emission intensity of cultivated land NPSP.
Table 10 shows the direct and indirect effects of the Spatial Durbin Model using partial derivative analysis. The direct effect estimates are consistent with those from maximum likelihood estimation. The indirect effects show that regional economic development has a significant negative indirect effect on TN and PE emission intensities at the 10% significance level, indicating that economic development not only reduces NPSP within the region but also promotes pollution control in neighboring areas. Agricultural technological progress has a significant negative spillover effect on TP emission intensity, suggesting that advancements in agricultural technology reduce NPSP intensity in adjacent areas.
- (3)
Robustness Check
Table 10 and
Table 11 show the results of the robustness checks. By analyzing the spatial panel Durbin models with TN and TP combined, and TN, TP, and PE combined as the dependent variables, the results confirm that environmental regulation effects are consistently negative in the spatial context. This is consistent with previous conclusions and confirms that the zero-growth policy on fertilizers and pesticides is effective in reducing agricultural NPSP emission intensities. Specifically, while there were discrepancies in the Spatial Durbin Model estimation results for TN emission intensity, this is attributed to adjustments in the fertilizer application structure.
4. Discussion
4.1. Environmental Regulation and Farmland NPSP
Cropland NPSP significantly affects the agricultural ecosystem, and resolving the conflict between agricultural development and ecological conservation has become urgent. This study measures the NPSP in the Dongting Lake Plain and evaluates the impact of the “Zero Growth Action” policy, implemented since 2015, using a spatial econometric model. This provides empirical evidence of the effects of regulatory policies on the ecological environment.
The results indicate that cropland NPSP in the Dongting Lake Plain exhibits positive global spatial autocorrelation and local spatial autocorrelation. Furthermore, increased pollutant emissions in one region exacerbate emissions in adjacent areas, indicating significant spatial spillover effects. Similarly, studies by Huang and Xu confirmed the spatial spillover effects of agricultural NPSP [
43,
44]. Our findings demonstrate that the zero-growth action in China has a significant negative impact on TN and PE emission intensities in the Dongting Lake Plain. It effectively reduces the intensity of cropland NPSP within the region while exerting spatial spillover effects on adjacent areas. Other researchers have also found that environmental regulations significantly suppress pollutant emissions in agriculture, industry, and other sectors. For instance, Xie et al. analyzed the regional differences and influencing factors of China’s agricultural technical efficiency under environmental regulations and found significant inhibitory effects on NPSP [
45]. Neves et al. analyzed data from 17 EU countries from 1995 to 2017, confirming that environmental regulation effectively reduces CO
2 emissions in the long term. They emphasized the critical role of environmental regulation in reducing agricultural NPSP and promoting green development [
46]. Similarly, Shapiro and Walker observed that changes in environmental regulations between 1990 and 2008 led to a 60% reduction in air pollutant emissions from U.S. manufacturing, even amid substantial industrial growth over the long term [
47]. In addition, NPSP is influenced by other factors. Regional economic development and urbanization levels have significant negative and positive effects, respectively, on PE intensity. Agricultural technological progress has a spatially negative indirect effect on TP emission intensity. Moreover, regional economic development significantly reduces TN and PE emission intensities through spatial spillover effects.
4.2. Countermeasures and Suggestions
To improve NPSP conditions in the Dongting Lake Plain, the following measures should be considered: Optimize fertilizer structure and reduce the intensity of chemical fertilizer and pesticide use. This involves further reducing nitrogen fertilizer use while controlling the growth of phosphorus fertilizer application, and adjusting the use of compound fertilizers appropriately. Additionally, the application of organic fertilizers should be increased, and a balanced use of various fertilizers should be encouraged. We also recommend promoting soil testing and fertilizer prescription methods for farmers to minimize unnecessary over-fertilization. Build a comprehensive environmental regulation system: Leverage government regulation to enforce principal responsibilities. Introduce economic incentives to control NPSP through market mechanisms, such as subsidies for farmers and manufacturers willing to promote and adopt organic fertilizers, low-toxicity pesticides, and new production technologies. These incentives can encourage the adoption of environmentally friendly practices, thereby reducing NPSP from agricultural land. Enhance coordination in pollution management: Different regions should adopt a coordinated approach, aligning their goals and addressing agricultural NPSP from the perspective of regional coordinated development. Geographical conditions in neighboring regions are often similar, and the farming practices and crop structures tend to resemble one another. Advanced agricultural technologies and effective pollution control experiences can spread and be replicated across regions. By leveraging spatial effects, regions can effectively improve fertilizer and pesticide efficiency, increase crop yields, and reduce the use of fertilizers and pesticides, contributing to the overall reduction of agricultural NPSP. Advance agricultural science and technology: Progress in agricultural science and technology can reduce the use and increase the efficiency of agricultural inputs, enhance land productivity, and simultaneously reduce pollution emissions, thereby benefiting farmers economically.
4.3. Limitations and Future Work
Due to research limitations, future studies could address the following improvements: In terms of measuring environmental regulation, this study innovatively uses the year of implementation of the Zero Growth Action as a policy dummy variable. Although this reflects the policy’s impact on NPSP, it is difficult to assess the influence of varying policy implementation intensities across regions. Further research could explore regional differences in policy execution and their effects on NPSP.
5. Conclusions
Based on county-level data from 21 counties (cities, districts) in the Dongting Lake Plain, this study assessed NPSP from cultivated land in the region and used spatial econometric models to empirically analyze the spatial impact effects of environmental regulation policies. The key conclusions are as follows:
Spatial autocorrelation of pollution: NPSP from cultivated land in the Dongting Lake Plain exhibits spatial autocorrelation. There is a positive global spatial autocorrelation for NPSP in the region. In terms of local spatial autocorrelation, high-high clustering predominated in 2010 and 2015, while in 2020, the clustering types of NPSP emissions were mainly low-low.
Impact of Zero Growth Action: The Zero Growth Action has demonstrated a significant inhibitory effect on cropland NPSP. Overall, the implementation of the Zero Growth Action has negatively affected the pollution emission intensity in the region. By 2020, the TN emission intensity and PE loss had decreased by 18.08% and 27.22%, respectively, compared to 2010, while the TP emission intensity showed a reduction of 4.42% compared to the pre-policy period. From the perspective of pollution discharge structure, the Zero Growth Action has significantly reduced TN emission intensity and PE loss but exerted a positive effect on TP emission intensity, with the coefficients being far smaller for the latter. Regarding control variables, regional economic development (WGDP) and urbanization levels (WUR) exhibited significant negative and positive impacts on TN emission intensity and PE loss, respectively. Additionally, WGDP had negative spatial spillover effects on TN emission intensity and PE loss. Agricultural technological progress (WTCH) also displayed a significant negative spatial spillover effect on TP emission intensity. Since the implementation of the Zero Growth Action, the condition of cropland NPSP in the Dongting Lake Plain has significantly improved. To further consolidate these achievements, the Chinese Government has decided to continue advancing efforts to manage NPSP. The Ministry of Agriculture and Rural Affairs has introduced the “Action Plan for Fertilizer Reduction by 2025” and the “Action Plan for Chemical Pesticide Reduction by 2025”, aiming to promote fertilizer and pesticide reduction, enhance efficiency, and achieve sustainable agricultural development.


