Article

How Does Financial Support Affect Firms’ Innovation and Total Factor Productivity: A Quasi-Natural Experiment in China

1
School of Business, University of Aberdeen, Aberdeen AB24 3FX, UK
2
Zhou Enlai School of Government Management, Nankai University, Tianjin 300071, China
3
School of Business, Yangzhou University, Yangzhou 225127, China
*
Author to whom correspondence should be addressed.
Sustainability 2025, 17(1), 244; https://doi.org/10.3390/su17010244
Submission received: 5 December 2024 / Revised: 24 December 2024 / Accepted: 27 December 2024 / Published: 1 January 2025

Abstract

:
Innovation and productivity improvements are essential drivers of economic growth, social stability, and sustainable development. As a high-risk, long-term activity, innovation requires external support, especially from the financial sector. In response, governments have introduced various financial support policies, yet their effectiveness remains debatable. Using panel data from Chinese listed firms between 2006 and 2022, we examined the impact of an innovation-oriented financial support initiative in China—the Technology and Finance Integration (TFI) pilot—on firm innovation and total factor productivity (TFP). This quasi-natural experiment effectively alleviated endogeneity and helped us establish the causality. Our results show that TFI significantly enhances both the quantity and quality of firms’ innovation, as well as TFP. Furthermore, we found that the policy effects are more pronounced in firms with higher perceived uncertainty, in private firms, and in those located in regions with advanced financial development. Improved liquidity conditions, increased R&D investment, and better asset allocation constitute plausible mechanisms for interpreting our results. Theoretically, this paper complements the research on the nexus between financial support and innovation activity, shedding light on the underlying mechanisms. Practically, our findings provide valuable insights for the formulation of financial policies to promote innovation, particularly in developing countries that lack sufficient R&D incentives and effective market mechanisms to drive technical upgrading and productivity growth.

1. Introduction

According to neoclassical economics, technology upgrading is crucial for economic growth, social stability, and sustainable development [1,2]. In this process, innovation serves as a primary driving force, and growth in total factor productivity (TFP) represents its main manifestation [3]. As such, exploring how to enhance innovation and TFP growth has become a popular topic in development economics [4,5,6]. A potential key determinant is liquidity conditions. Firms under financial pressure tend to exhibit weaker innovation capabilities and lower TFP throughout their life cycle [7,8]. In practice, many firms encounter significant constraints or financial frictions that hinder their allocation of resources to research and development (R&D), especially in developing economies [9,10]. In response to this situation, governments typically use fiscal subsidies, tax incentives, or financial support to improve firms’ liquidity conditions. However, the effectiveness of such financial support policies in stimulating innovation and TFP growth remains debatable, and the existing theoretical and empirical evidence, which is limited, is predominantly available in developed countries [11,12]. To bridge this gap, this paper attempted a new step to examine the impact of financial support policies on firms’ innovation and TFP within the context of China, the world’s largest developing economy.
The essence of innovation is creative destruction, a process in which new technologies update or replace old ones [1,2,6]. As the core driver of long-term growth, innovation contributes to firms’ competitiveness, operational performance, and sustainable development. The primary outcome of innovation activities—TFP—was proposed by Solow [3] and measures the contribution of technology (intangible factors) to economic growth. TFP growth comprehensively reflects the technology upgrading of firms.1 While innovation and TFP growth are vital, there exists a dilemma. Since innovation is a high-cost, high-risk, long-cycle activity that needs large R&D investment, firms with limited financial resources often struggle to engage in it. One potential solution is to improve firms’ liquidity conditions through financial support policies, enabling them to allocate more resources to R&D investments.
In theory, financial support policies can foster innovation and TFP growth through several channels. Firstly, these initiatives alleviate credit constraints and reduce credit costs, which directly lowers the cost of innovation activities [8,12]. Meanwhile, they mitigate financial risks and boost entrepreneurs’ willingness to engage in risky decisions like innovation [13,14]. Secondly, more favorable liquidity conditions increase the likelihood of firms’ technology upgrading and TFP improvement [15]. By employing financial support policies, firms will allocate a larger share of their resources to R&D, thus boosting their quantity and quality in innovation [9,11]. Thirdly, a financial support policy may reshape the firm’s asset mix, thereby promoting innovation and TFP growth. On the one hand, such policies make firms more forward-looking and encourage them to allocate assets to the long term, which contributes to their success in innovation—a high-risk and long-cycle activity [16,17]. On the other hand, these policies lead to less reliance on tangible assets as loan collateral. In practice, firms often rely on tangible assets to secure external financing, leading to over-investment in tangible assets. By employing financial support policies, they can reduce their tangible assets and allocate more resources to innovation activities [15]. Moreover, financial support policies prompt firms to invest more in intangible assets that are crucial for technology upgrading [2,18]. Overall, financial support policies can potentially improve liquidity conditions, promote R&D investment, and optimize asset allocation, thereby stimulating firm innovation and TFP growth.
Recognizing the crucial role that financial support plays, recent research has increasingly focused on it. Some scholars and practitioners point to financial support as a potential way to promote technology upgrading, and they argue that financial institutions can stimulate TFP by allocating resources to innovative sectors. In line with this perspective, the literature has intensively documented the positive impact of financial support on innovation, including increased innovation output, improved product quality, and increased R&D on new products [7,17,19,20,21]. However, some evidence challenges this view, suggesting that financial support may not always effectively promote innovation and TFP [22,23,24,25]. On the contrary, they argue that innovation depends more on firms’ strategies and is less related to liquidity conditions: this phenomenon is known as the liquidity paradox [22]. Accordingly, the relationship between financial support and firms’ innovation remains inconclusive and is ultimately an empirical question.
One reason behind this discrepancy is that most studies focus on the impact of variations in external financing on firms’ technology upgrading, by regression innovation (or TFP) on an indicator proxied for financial support (see [23] for a review). However, this approach suffers from significant challenges of endogeneity issues [26], which arise from (i) reverse causality—firms with strong innovation capabilities are more likely to attract support from financial institutions (banks)—and (ii) omitted variables—there may be unobservable factors simultaneously affecting both financial support and the firm’s innovation, such as regional financial development levels. Ordinary least squares (OLSs) or fixed effects (FEs) models often fail to address these issues, resulting in biased estimates. To resolve this challenge, we utilized the “Technology and Finance Integration” pilot (henceforth, TFI) in China, a financial support policy dedicated to enhancing firms’ liquidity conditions for innovation.
TFI is one of the first large-scale, innovation-oriented financial support pilots in China, covering 49 prefecture-level cities and over 40% of technology firms (see Section 2 for a brief outline of TFI). To date, the Ministry of Science and Technology (MST) has launched two waves of TFI, in 2011 and 2016. In line with the Medium- and Long-Term Plan for the Development of Science and Technology in China (of which, TFI is a part; source: https://www.gov.cn/gongbao/content/2006/content_240244.htm, accessed on 17 October 2024), the main objectives of this place-based policy are to reduce information friction between the financial sector and firms, lower the financing costs of R&D activities, and improve firms’ liquidity conditions. To achieve these goals, TFI mandates local government to act as an intermediary between financial institutions and firms’ R&D departments, thereby establishing a new system of financial resource management, in which the government, financial institutions, and firms collaborate. This quasi-natural experiment has yielded an unexpected shock, providing an exogenous variation that enables us to isolate the impact of financial support on firms’ innovation and TFP growth.
Using TFI as a quasi-natural experiment, and based on a panel of Chinese listed firms from 2006 to 2022, this paper explored the causal effects of financial support policies on firms’ innovation and TFP in the context of China. Firstly, we examined whether TFI can enhance firms’ innovation and TFP. Secondly, given that the policy effects may vary by firm or regional characteristics, we investigated heterogeneity across firms’ uncertainty perceptions, ownership structure, and regional financial development levels. Thirdly, to interpret our main findings, it was necessary to explore the underlying mechanisms by which financial support policies affect firms’ innovation and TFP. To that end, we constructed a general equilibrium model to generalize the logic chain, and we then explored the mediating roles of liquidity conditions, R&D investment, and asset allocation. By undertaking these works, this paper sought to answer the following three questions:
(i)
Is the financial support policy (TFI) beneficial to firms’ innovation and TFP in a transitioning economy? This was our primary question.
(ii)
If so, which types of firms experience greater innovation and TFP under financial support policies? Answering this question will help guide the expansion of pilots and inform the development of related policies.
(iii)
What are the potential mechanisms by which financial support policies affect firms’ innovation and TFP? Answering this question will not only help explain our main findings but will also shed light on intermediary pathways to strengthen the policy effects.
Our work is valuable both theoretically and practically. Theoretically, we have established a causal link between financial support and innovation, as well as financial support and TFP, offering a plausible explanation for the underlying mechanisms, thus complementing the scarce empirical evidence on this topic. Moreover, our theoretical explanation with a general equilibrium model generalizes this issue, and it can be extended to other financial support-related concerns. Practically, we focused on a transitioning economy that urgently needed technology upgrading to achieve sustainable and high-quality development. In China, despite the central role of innovation, R&D investment remains woefully insufficient. According to the OECD Science and Technology Indicators database, China’s R&D investment intensity lags far behind that of developed countries, falling to less than one third of theirs (source: https://www.oecd.org/en/data/datasets/main-science-and-technology-indicators.html accessed on 4 October 2024). Therefore, it is both urgent and critical to explore effective strategies, such as financial support policies, for fostering innovation and TFP growth. Against this backdrop, our findings have practical implications and provide valuable insights for the refinement of financial support policies in developing countries.
The remainder of this study is structured as follows: Section 2 introduces the evolution, objectives, and initiatives of TFI. Section 3 presents a theoretical model for generalizing intuition and guiding our empirical work. Section 4 outlines our empirical strategy, data, and econometric models. Section 5 shows our results, supplemented by a set of robustness checks. Section 6 explores the underlying mechanisms by which we give an interpretation of our main findings. Section 7 is a brief discussion, and Section 8 concludes and summarizes our policy implications.

2. Technologyand Finance Integration Pilot

In this section, we provide a brief overview of the evolution, objectives, and initiatives of the TFI pilot, and we discuss how these initiatives could potentially link to firms’ innovation and TFP growth.
Inherent challenges, such as high risk, substantial investment requirements, information asymmetry, and inadequate collateral, have placed technology firms in a predicament of high financing costs and limited access to financial resources. Especially since 2005, the Chinese government’s series of tight monetary policies has increased the difficulty of financing and has exacerbated the challenges faced when undergoing innovation activities. To tackle these challenges, the Medium- and Long-Term Plan for the Development of Science and Technology of China was proposed in 2006, emphasizing the need to enhance the security system for R&D investments and establish venture capital guiding funds. In 2008, the State Council of China further reinforced the importance of strengthening fiscal and financial support for innovation activities, mobilizing financial resources to facilitate technology upgrading. Against this backdrop, the Chinese government launched a series of financial support programs to promote R&D investments.
TFI, one of the first large-scale, innovation-oriented financial support pilots, is precisely such a pioneer. Similar to other pilot policies, TFI follows a “pilot–promotion” way. The pilot cities are selected through a bottom-up, self-reporting process initiated by local governments. In this process, local governments first submit their applications to the MST, which are then reviewed and evaluated by experts, based on factors such as prior initiatives, resource endowments, and economic development characteristics. To date, the MST has progressively launched two waves of TFI pilots, covering 49 prefecture-level cities and over 40% of technology firms in China.2 In November 2011, 16 regions with relatively concentrated technology and financial resources, including Shanghai, Beijing, and Tianjin, were selected as the first wave of pilots. In June 2016, the second wave of TFI was expanded to nine additional cities, such as Zhengzhou, Ningbo, and Qingdao. TFI primarily focuses on innovating investment methods in technology, increasing financial support for technology firms, and guiding various types of venture capital to engage in firms’ innovation activities.
To promote the pilot cities in achieving their objectives, the MST has established several requirements. Firstly, it mandates local financial institutions to provide targeted support for firms’ R&D activities. Information asymmetry is a significant obstacle to firms obtaining R&D funding through bank loans. In the policy design, the pilot government can act as an intermediary to reduce the negative effects of information asymmetry. Specifically, it can organize experts to review technology loan projects, establish credit systems, and offer professional advice to banks, thus reducing information asymmetry between banks and firms. Secondly, it requires pilot cities to increase fiscal subsidies for R&D. Fiscal subsidies are an important tool in fiscal policy, typically taking the form of non-repayable financial transfers. They serve as a signaling mechanism, conveying support for technology firms, thereby boosting their confidence and enthusiasm in R&D activities. Thirdly, it requires pilot areas to guide social capital participation in innovation. Some pilot city governments have proposed preferential income tax deductions for qualified equity investment funds, to attract financial resources to flow into innovation activities. Throughout all these processes, local governments also play a supervisory role, aimed to alleviate the credit friction between the financial institutions technology firms.

3. Model

To generalize the intuition and guide our empirical work, we constructed a simple general equilibrium model, with heterogeneous firms exposed to financial support, in the spirit of Dixit and Stiglitz [27], Helpman and Krugman [28], and Melitz [29].3 In this model, we depict the impact of financial support policies from two aspects: (i) lowering credit costs, and (ii) alleviating credit constraints. These features align with the design of the TFI pilot, as we discussed in Section 2. For analytical simplicity, we assumed that the firms’ capital input was entirely financed through collateralized loans and that the financing rates varied across the liquidity conditions. In the analysis, we assumed that the financial support expanded the firms’ credit boundaries and that the expansion was inversely related to the capital price. Empirically oriented readers can skip to the model predictions in Section 3.2 and see how the theory connects to our empirics in Section 3.3.

3.1. Model Setting

3.1.1. Demand

The representative consumer consumes a variety of goods (N), with a utility function in the constant elasticity of substitution (CES) form:4
U = 0 N q i σ 1 σ d i ,
where  σ > 1  denotes the substitution elasticity between varieties, and  q i  represents the demand for goods, i. Let P denote the market price index,  P = 0 N p i 1 σ d i 1 1 σ , where  p i  is the price of goods, i. Given the consumer’s budget constraint R, the market demand faced by a firm’s i is
p i = P 1 σ R q i 1 σ .

3.1.2. Production

Firms’ production activities encompass both intermediate goods and final products. The production of intermediate goods requires labor l and capital k, in a constant return to scale (CRS) Cobb–Douglas function,
x i = l i α k i 1 α ,
where  x i  is the output of the intermediate goods, and where  α  is the output elasticity of the labor (homogeneous across firms). As discussed above, the labor wage is standardized to 1, and the capital interest rate is  r i . Following the cost minimization principle, the unit cost of producing intermediate goods for the firm is (see Appendix B for derivations)
c i = α α ( 1 α ) ( 1 α ) r i 1 α .
Clearly,  c i  increases with  r i c i / r i > 0 .
Firms use intermediate goods to produce final goods. Given the firm TFP  A i , the production function for final goods  x i = A i f ( q i ) . Without loss of generality, we assume  f ( q i ) = q i 2 . Then, the variable cost for a firm producing  q i  units of final goods is  c i x i = c i A i q i 2 . Additionally, each firm incurs a fixed sunk cost.For simplicity, we assume that fixed costs are completely sunk once the firm decides to produce. Considering partially recoverable fixed costs does not affect our main findings. Following Guadalupe [30], the firm’s fixed cost is  M η r β f , where  β  measures the fixed cost expenditure elasticity with respect to financing costs, M is the mass of firms in the market, and   η > 0  measures the extent of the external congestion faced by firms.

3.1.3. Innovation Activities

Next, we introduce an endogenous technology upgrading process. We assume that firms must pay an entry cost  f e  before entering the market to capture a random TFP. Following Melitz [29], we assume that the productivity follows a Pareto distribution  G ( φ ) = φ θ  and  θ > σ 1 , where a smaller value of  φ  corresponds to a higher TFP for the firm. Firms can choose their innovation investments  γ i  to allow their TFP to increase to  A i = γ i / φ . The unit innovation cost for the firm is directly related to its initial productivity level. Here,  φ  represents the unit innovation cost, indicating that a higher initial productivity (or a smaller  φ ) results in a lower innovation cost.

3.1.4. Equilibrium

To engage in production and innovation, firms need to secure external financing. The credit constraints they face can be categorized into two aspects: credit demand and financing channels. Credit demand reflects a firm’s need for external credit, while financing channels represent the maximum access of a firm’s limit borrowing. Financial support helps alleviate credit constraints, and we use  1 / r i  to denote the degree of a firm’s credit constraint. The smaller the  1 / r , the more stringent the firm’s credit constraints. We assume that firms need to finance a proportion  d i ( 0 , 1 )  of their innovation investment through credit, where  d i  represents the firm’s external financing requirement. It is assumed that this external financing requirement is exogenously given. Firms are required to repay their loans at the end of each period, meaning that financial support directly influences the firm’s innovation investment decisions.
The profit maximization problem faced by firms with financing constraints is as follows:
max P 1 σ R q i 1 σ q i c i φ q i 2 γ i φ γ i M η r i β f
s . t . 1 r i P 1 σ R q i 1 σ q i c i φ q i 2 γ i 1 d i φ γ i M η r i β f φ d i γ i
We consider only cases where the budget constraint is binding. Given the initial productivity and credit demand, this implies that the capital price (credit constraint) faced by the firm must exceed a critical threshold  r r ¯ = 1 + 2 d i ( σ 1 ) 1 φ / φ * ( σ 1 ) , and  φ *  denotes the cut-off TFP. By combining the zero-profit condition, the free entry condition, and the market clearing condition, we can derive the firm’s optimal innovation investment, profit margin, and relative market share in equilibrium (see Appendix B for derivations).
Optimal Innovation Investment:
γ i * = σ 1 2 σ σ R P 1 σ 1 1 + Δ σ + 1 1 c i σ 1 1 φ σ
Firm Profit Rate:
P R i * = 1 2 + Δ 1 + Δ σ 1 2 σ π i M η r i β f π i
Firm Market Share:
π i * π j * = A i A j 1 σ for   any   i , j
where  π i  denotes revenues (sales) of a firm’s i Δ = d i λ r i 1 / ( 1 + λ ) , and  λ  denotes the Lagrange multiplier. Since  d i ( 0 , 1 ) λ > 0  and  r i > r ¯ , we have  Δ / r i > 0 .

3.2. Model Predictions

We characterize financial support as (i) a reduction in financing costs, and (ii) a relaxation of financing constraints. Both of these lead to a relationship in our model,  r i / s < 0 . On this basis, we observe the effect of financial support on firms’ innovation decisions by differentiating Equation (1) with respect to  r i :
γ i * r i = σ 1 2 σ σ R P 1 σ 1 φ σ F 1 c i r i F 2 Δ r i ,
where  F 1 = 1 σ 2 1 c i σ + 1 1 1 + Δ σ + 1 < 0  and  F 2 = 1 + σ 2 1 c i σ 1 1 1 + Δ σ + 3 > 0 . Since  c i / r i > 0  and  Δ / r i > 0 , we have  γ i * r i < 0  and the firms’ innovation investments decrease with financial constraints.
Clearly, liquidity conditions influence firms’ innovation investment through at least two channels: (i) the cost effect, as represented by the first term, where the increased variable production costs decreases innovation investment; and (ii) the credit constraint effect, as reflected in the second term, where the reduced available credit crowds out the funds available for R&D. Since financial support lowers financing costs and eases credit constraints, it enhances R&D investment, ultimately driving greater innovation and TFP growth. This leads to our main proposition, as below:
Proposition 1.
Financial support boosts a firm’s innovation and TFP improvement, primarily through the dual channels of cost reduction and credit constraint relaxation. That is,
γ i * s = σ 1 2 σ σ R P 1 σ 1 φ σ F 1 r i s c i r i cost reduction > 0 F 2 r i s Δ r i credit relaxation > 0 > 0
An additional prediction is that financial support will improve a firm’s operating performance. As shown in Equations (2) and (3), a firm’s profitability decreases monotonically with r, and its relative market share is in direct proportion to its productivity. Since financial support reduces r and boosts a firm’s TFP, it leads to higher profitability, greater sales, and an expanded market share. This yields Proposition 2.
Proposition 2.
Financial support enhances a firm’s operating performance, reflecting in scale effects and market share effects. That is,
P R i * s > 0 , π i s > 0 , and π i / π j i s > 0

3.3. Extended Discussion: From Theory to Empirics

The model predictions in Propositions 1 and 2 are informative. Here, we provide a few remarks on how the generalized model predictions relate to our stylized empirical evidence.
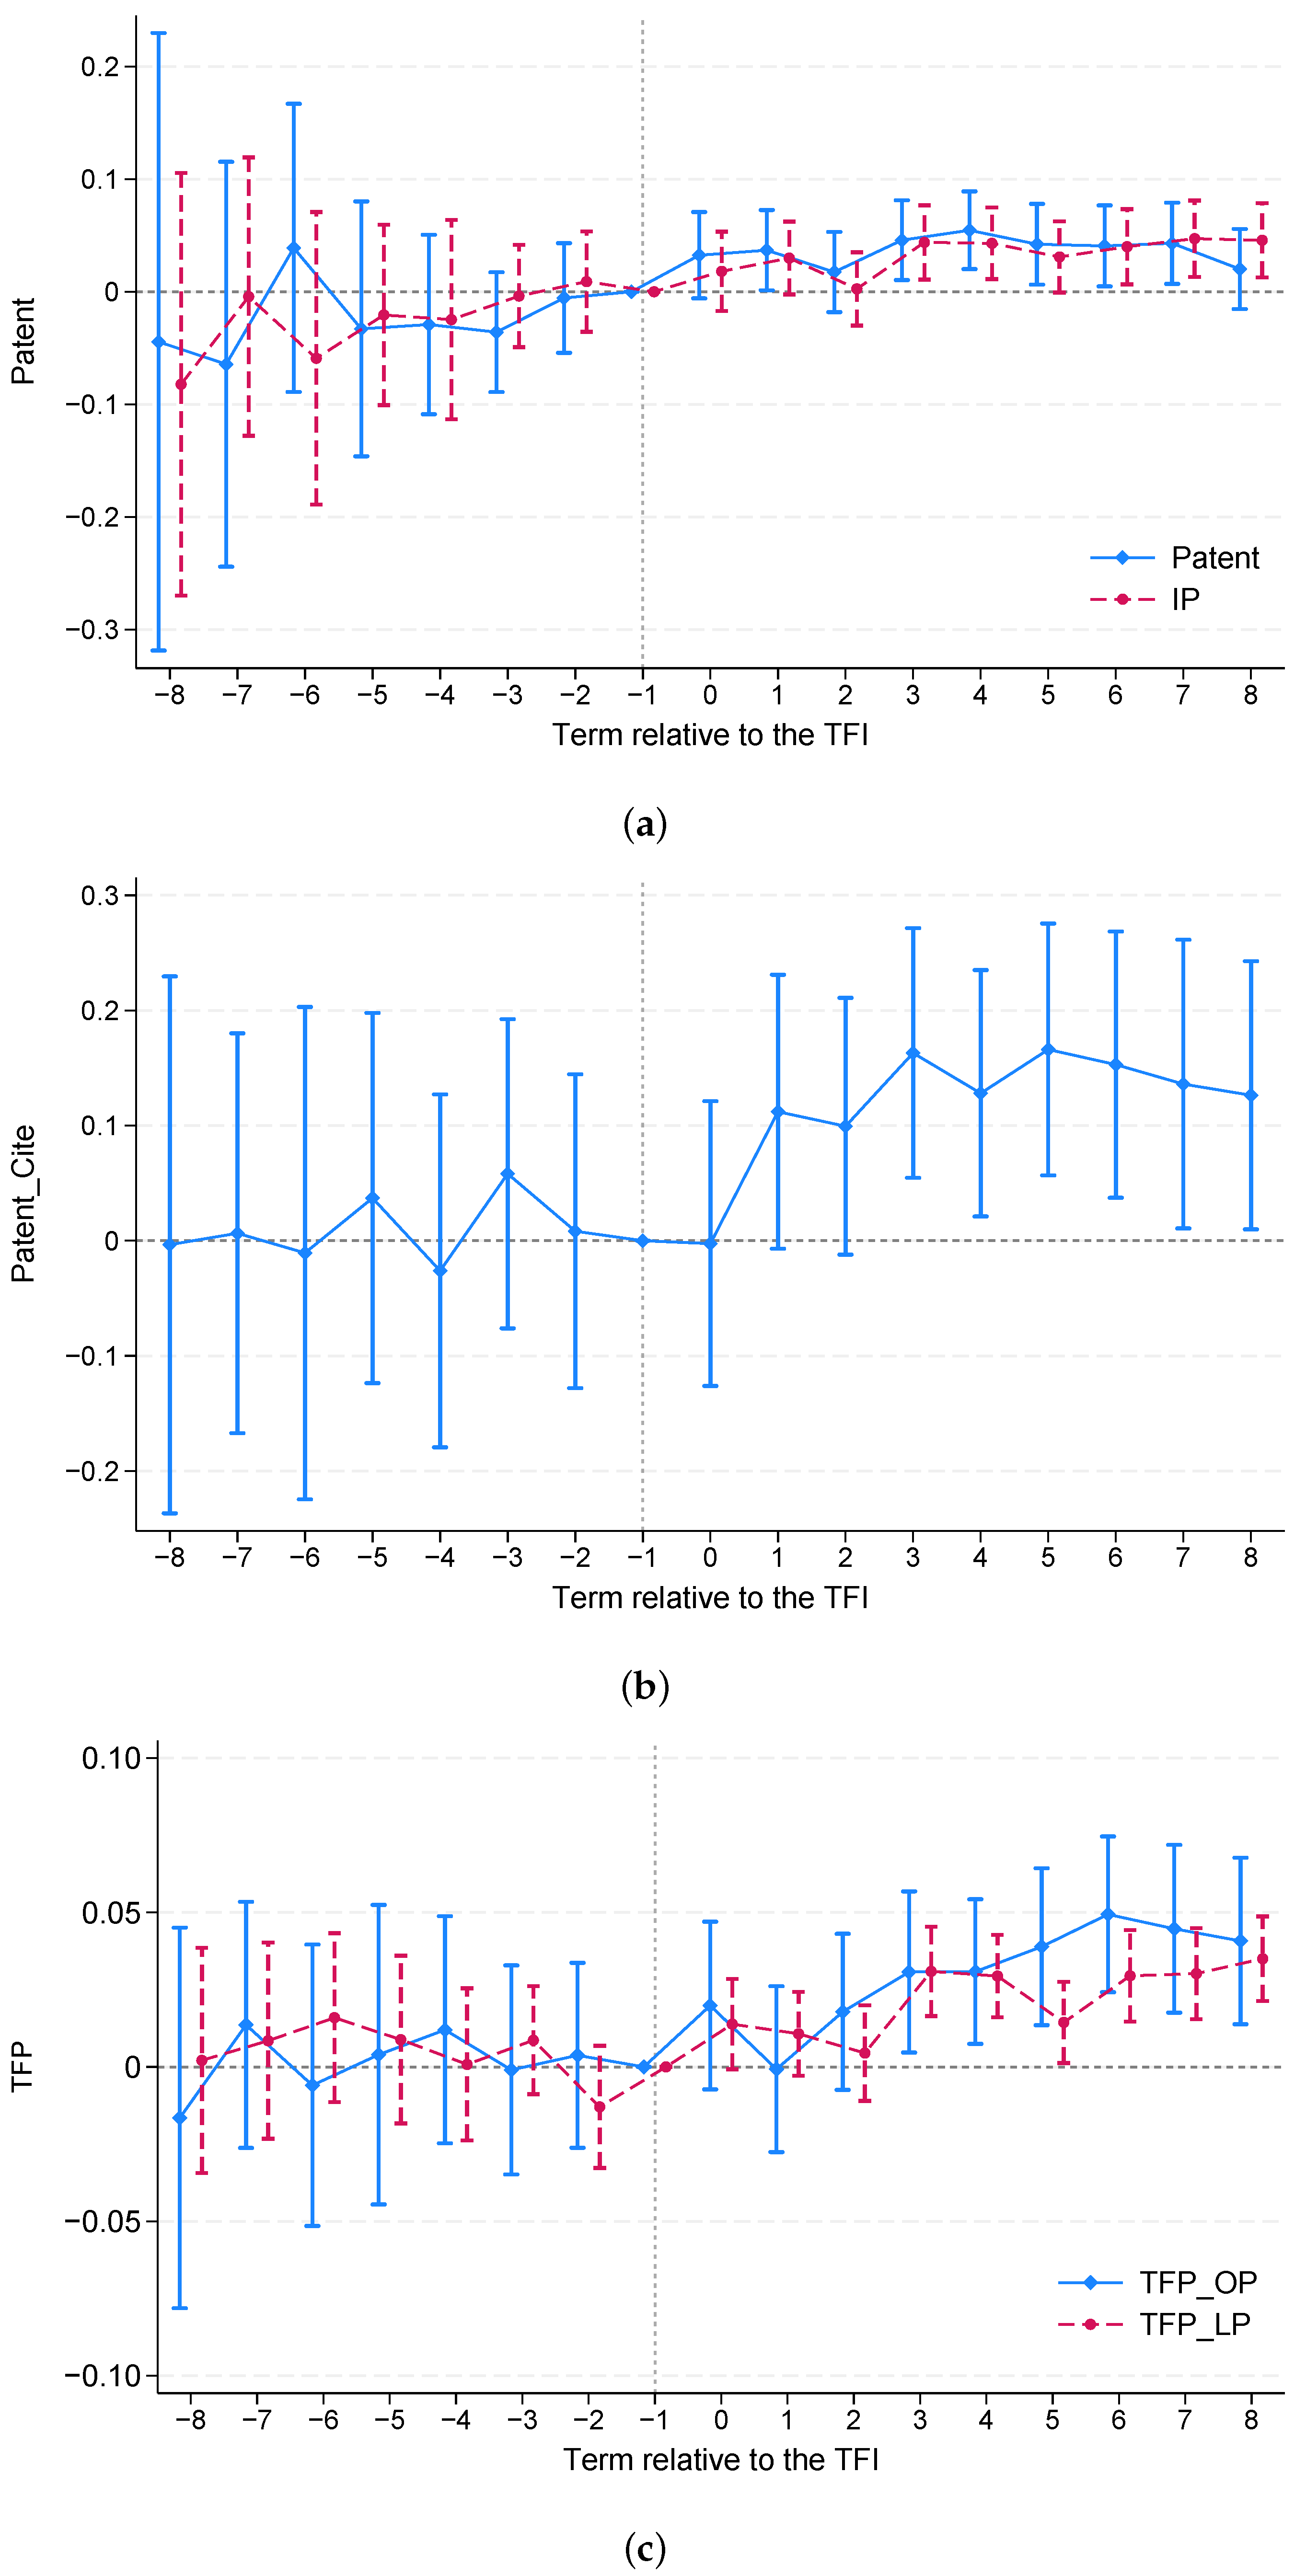
First, Proposition 1 implies that a firm’s optimal innovation investment is negatively correlated with financing costs. Since both innovation and TFP increase monotonically with innovation investment, this also indicates that financial support fosters a firm’s innovation and TFP growth. Thus, it is to be expected that growth in a firm’s innovation and TFP will be observed upon the introduction of TFI. To verify this testable proposition, we conducted an empirical analysis using panel data from Chinese listed firms over the period 2006–2022. Our identification relied on the difference-in-differences (DID) model, a widely used policy-evaluation approach that leverages spatial variation in TFI rollout and compares changes in innovation and TFP between treated and control firms before and after the TFI implementation. Compared to standard OLS or FE models, DID effectively mitigates endogeneity concerns, allowing for a more accurate isolation of the impact of financial support on a firm’s innovation and TFP.
Secondly, better liquidity conditions and increased innovation constitute the potential mechanisms through which TFI operates its effect. From Proposition 1, the impact of financial support on innovation and TFP can be decomposed into cost-reduction and credit-relaxing effects, both of which improve a firm’s liquidity conditions and, in turn, positively influence innovation investment. This outlines a logical chain with which we could interpret our baseline results: increased financial support (TFI)—improved liquidity conditions and higher R&D investments—innovation and TFP growth. Following the main analysis, we tested these two plausible mechanisms, utilizing the rich financial information of Chinese listed firms. Note that our model abstracts from time, and that we were not able to capture the firms’ dynamic decisions. According to Chen et al. [15] and Anderson [18], as liquidity conditions improve, firms may optimize their asset allocation, which boosts innovation and TFP growth. This also presents a potential channel to test.
Thirdly, in addition to its innovation performance, TFI may also improve a firm’s operational performance. According to Proposition 2, financial support is positively correlated with profitability, sales, and market share. To demonstrate the validity of our model settings and strengthen the logical chain, we will also provide supporting evidence regarding the impact of TFI on the firms’ operational performance.

4. Research Design

4.1. Econometric Specification

Leveraging the spatial variations in TFI rollout, we employ a time-varying DID specification to isolate the effect of financial support on a firm’s innovation and TFP, as follows:
Y i t = β TFI c t + γ X i t + θ i + η j t + μ p t + ε i j c p t ,
where i, j, c, p, and t denote the firm, the industry, the city, the province, and the year, respectively.  Y i t  is the outcome variable. In this study, we considered two types of outcomes: (i) Innovation, including innovation quantity and quality. Innovation quantity is measured by the natural logarithm of the count of patent (invention patent, utility model patent, design patent) applications plus 1. Innovation quality is measured by the number of citations of a firm’s patents. (ii) TFP, as calculated by the techniques of Olley and Pakes [31] and Levinsohn and Petrin [32].  TFI c t  denotes the policy dummy, which takes the value of 1 after the city c implements the TFI, and 0 otherwise.  β  is our coefficients of interest, which represent the average treatment effects of TFI on a firm’s innovation and TFP.
To capture unobservable confounders and sharpen our identification strategy, we include a range of controls:  θ i  represents a firm’s fixed effects, which absorb the firm-level time-invariant features;  η j t  and  μ p t  represent industry-by-year and province-by-year fixed effects, capturing industry- and province-specific differences across years, especially concurrent confounding policies among industries and provinces;  X  is a set of time-varying covariates, including a firm’s size, age, leverage, return on equity (ROE), turnover of total assets (TOA), cashflow, board, independent director proportion (IDP), dual, Tobin’s Q, and the shareholding ratio of the top-10 shareholders;  ε i j c p t  is the error term. To account for spatial and serial correlation in error terms, we cluster the standard errors at the city level, allowing for arbitrary spatial correlation within a city across years.

4.2. Variable Description

4.2.1. Dependent Variables

(i)
With regard to a firm’s innovation, including both the quantity and quality of the innovation. patents serve as a useful indicator of a firm’s innovative capacity and are widely employed in the established literature. Considering the lag in patent approval, we follow Xin et al. [25] and use the number of patent applications (Patent) as a proxy for innovation quantity. We distinguish between invention patents (IPs), utility model patents (UMPs), and design patents (DPs). It is worth noting that the distribution of patent counts is highly right-skewed, with a considerable proportion of zero values. To address this asymmetry, we take the natural logarithm of the patent count plus 1. Additionally, we assess the quality of innovation by the total citations of a firm’s patents [33,34], also in natural logarithmic form. In robustness tests, we also use the average citations per patent.
(ii)
With regard to total factor productivity (TFP), we compute the firm’s TFP using the OP [31] and LP [32] methods and modify them with the technique outlined by Ackerberg et al. [35], labeled as TFP_OP and TFP_LP, respectively. A brief calculation process can be found in Appendix B. Regarding input–output indicators, labor is measured by the number of employees at the end of the year, investment is calculated based on the change in the net value of fixed assets (after deflation), fixed capital is valued using the perpetual inventory method, and output is proxied by the main business sales. We apply the production approach to compute intermediate inputs, which includes direct material inputs, manufacturing costs, management costs, sale costs, and financial costs. We aggregate operating costs, manufacturing expenses, management expenses, sales expenses, and financial expenses, and we then subtract depreciation on fixed assets and labor compensation to derive the firm’s intermediate inputs. All nominal variables are converted to 2005 constant prices.

4.2.2. Policy Indicator

We collected lists of TFI pilot cities from the MST of China. In the 2011 wave, the cities included Beijing, Tianjin, Shanghai, Nanjing, Wuxi, Xuzhou, Changzhou, Suzhou, Nantong, Lianyungang, Huaian, Yangzhou, Zhenjiang, Taizhou, Suqian, Hangzhou, Wenzhou, Huzhou, Hefei, Bengbu, Wuhu, Wuhan, Changsha, Foshan, Dongguan, Chongqing, Chengdu, Mianyang, Xi’an, Baoji, Tianshui, Weinan, Tongchuan, Shangluo, Qingyang, Pingliang, Longnan, Dalian, Qingdao, and Shenzhen. In the 2016 wave, the cities were Zhengzhou, Xiamen, Ningbo, Jinan, Nanchang, Guiyang, Yinchuan, Baotou, and Shenyang. The indicator TFI is assigned a value of 1 for firms in these cities after the policy implementation, and 0 otherwise. In our sample, approximately 46.8% of the firms had ever been treated.

4.2.3. Control Variables

Following the established literature [12,17,22,23,33], we include a set of covariates: (i) the firm’s size (Size), measured by the natural logarithm of total assets, to capture the potential impact of production scale, market dominance, and market penetration on a firm’s innovation capabilities; (ii) the firm’s age (Age), to control for differences in innovation capabilities across the firm’s life cycle; (iii) Leverage, measured by the debt-to-asset ratio, as debt pressure is a significant factor limiting a firm’s innovation capacity and TFP growth; (iv) return on equity (ROE), reflecting the firm’s operational performance; (v) total asset turnover (TOA) and cash flow ratio (Cashflow), representing the firm’s liquidity capacity; (vi) board size (Board) and proportion of independent directors (Indep), indicating the firm’s ability to share risk; (vii) duality (Dual), a binary variable taking the value of 1 if the firm’s chairman and CEO are the same person; (viii) top-10 shareholding ratio (Top-10), reflecting the complexity of the firm’s risk decision making; and (ix) Tobin’s Q, as a measure of the firm’s investment value.

4.3. Data Sources, Processing, and Descriptive Statistics

We used Chinese A-share listed firms spanning 2006 to 2022 as our research sample. The initial financial data were sourced from the Wind Database and the China Stock Market and Accounting Research Database (CSMAR). Patent information and citation data came from the China Patent Database, which we manually matched with the listed firm data and categorized according to IPC codes and application/grant records. To refine our identification, we cleaned the dataset before formal analysis, through the following processes. Firstly, we removed observations from financial firms, as their accounting standards and business strategies differ significantly from those of other firms. Secondly, we excluded ST and ST* firms, due to their poor operational conditions, which might have distorted our identification. Thirdly, we dropped insolvent firms. Fourthly, we trimmed all continuous variables at the 1st and 99th percentiles, to eliminate outliers. Lastly, we obtained a sample with 32,338 firm-year observations from 3079 firms. Table 1 presents the descriptive statistics for our main variables:

5. Results

This section presents our main results. We followed specification (4), to examine the impact of TFI on the firms’ innovation and TFP, supplemented by a set of robustness checks. On this basis, we explored the heterogeneous treatment effects of TFI by uncertainty perception, ownership structure, and regional financial development. Additionally, we observed changes in the firms’ operating performances.

5.1. Baseline Results

Table 2 presents the estimated effects of TFI on the firms’ innovation. Across the board, we controlled for each firm’s covariates, as well as for the firm, the industry-by-year, and the province-by-year fixed effects. In column (1), the total number of patent applications was used as the dependent variable. As is shown, the estimated coefficient of TFI was positive and statistically significant at the 1% level, indicating a positive correlation between financial support and innovation quantity. On average, a firm’s number of patent applications increased by 4% after the TFI implementation. In columns (2) to (4), we classified the patents and took the number of invention patents, utility model patents, and design patents as dependent variables, respectively. Surprisingly, the increase in innovation was primarily driven by the invention patents, rather than by the utility model or design patents, which implied an improvement in the innovation quality. With financial support, the firms were able to allocate more resources to significant innovation, which, in turn, stimulated growth in the firms’ TFP and operational performance [14,16,30]. Column (5) shows a similar pattern. Following the introduction of TFI, the total citations for firms’ patents increased by approximately 9.3%, and this effect was statistically significant. Altogether, TFI boosted the firms’ innovation, both in quantity and quality.
Next, we turn to the changes in TFP associated with TFI, and the estimated results are presented in Table 3. In columns (1) and (2), we used TFP calculated by the OP method as the outcome variable, including and excluding firm-level covariates, respectively. The results indicate that the estimated coefficient of TFI was significantly positive at the 1% level, which suggests that TFI improved the firms’ TFP. On average, the firms’ TFP increased by about 2.4% following TFI. Consistent findings were observed when TFP calculated by the LP method was used as the dependent variable, as reported in columns (3) and (4). Combining the results from Table 2 and Table 3, we conclude that financial support enhanced the firms’ innovation capabilities and boosted TFP growth. Thus, Proposition 1 was confirmed.

5.2. Robustness Checks

5.2.1. Parallel Trend Assumption

The validity of the DID specification hinges on its inherent parallel trend assumption, which posits that, in the absence of shock, the treatment and control groups will exhibit a parallel trend. Following Beck et al. [36], we employed an event study analysis to flexibly test this assumption, as follows:
Y i t = τ β τ TFI c , τ 1 + γ X i t + θ i + η j t + μ p t + ε i j c p t ,
where  τ  denoted the period relative to TFI implementation.  TFI c τ  was a series of year-since-treatment policy dummies that took a value of 1 if the year was  τ  years before/after city c implemented TFI, and 0 otherwise. We omitted period  τ = 1 , the last year before TFI, to take that year as a reference. If the parallel trend assumption held, all pre-treatment estimated coefficients  β τ , τ = 11 , 10 , , 2 , should have been statistically indistinguishable from 0. Other variables were specified as in Equation (4). For simplicity, we only tested the parallel trend assumption for significant variables in Table 2 and Table 3—that is, patents, invention patents, patent citations, TFP_OP, and TFP_LP. In estimating, we clustered the standard errors at the city level.
Figure 1 plots the event study coefficients, accompanied by 95% confidence intervals. In panel (a), where the patent and invention patent applications were used as dependent variables, the estimated coefficients for the policy dummy prior to TFI are statistically insignificant, suggesting an absence of pre-existing trend. Three years after TFI, the coefficients become positive and statistically significant, supporting our main finding that financial support leads to an increase in innovation, particularly substantial innovation. A similar pattern is observable for the patent citations, as shown in panel (b). The estimated coefficients are nearly flat before TFI, but turn significantly positive afterward. In panel (c), we observe TFP growth that closely tracked the firms’ innovation, with no significant estimates before the policy intervention. Taken together, the results in Figure 1 support the parallel trend assumption in our setting. Notably, the policy effect exhibits a certain lag, which is consistent with the existing literature [12,14,16,21]. On the one hand, there was somewhat friction to establish continuity between financial institutions and firms. On the other hand, it took time for firms’ asset allocation and innovation inputs to translate into results.

5.2.2. Alternative DID Estimators

In recent theoretical econometrics literature, the traditional DID specification has been criticized as biased in staggered designs (see a review [37]). This bias arises because some of the later-treatment groups take earlier-treatment groups as controls, resulting in negative weights, so that the average estimated coefficients are confounded by heterogeneous treatment effects. In this study, the TFI we focused on was rolled out in two waves and might have been subject to this issue. To address this concern, we employed two newly developed robust DID estimators proposed by Sun and Abraham [38] and Wooldridge [39] to re-estimate the specifications (4). As shown in Table A1, the estimated results with these two estimators were similar to our baseline ones for all the five dependent variables. Therefore, our finding, that financial support fosters firms’ innovation and TFP growth, was not vulnerable to heterogeneous treatment effects.

5.2.3. Alternative Variable Measurements

We then tested the sensitivity to variable measurement. Specifically, we used the number of patent and invention patent grants to replace applications, we applied average citations per patent instead of total citations, and we employed the TFP unadjusted by the technique of Ackerberg et al. [35] as dependent variables. As shown in Table A2, TFI led to an increase in both the quantity and quality of the firms’ innovation, as well as an improvement in TFP. Therefore, our main findings were robust against different variable measurements.

5.2.4. Concurrent Policies

We note that our baseline specification controlled for industry-by-year and province-by-year fixed effects, which effectively accounted for any industry- and province-specific confounders. However, there may still have been omitted factors affecting firms’ innovation and TFP that could have interfered with our identification. In particular, concurrently with TFI, the Chinese government implemented other innovation-promoting policies. If the results estimated in Table 2 and Table 3 were driven by these competing policies, our findings may have been biased. To mitigate this concern, it was necessary to additionally account for the effects of these policies.
We considered two major city-level innovation-related policies: the Innovation City and Smart City pilots. As another important component of the Medium- and Long-Term Plan for the Development of Science and Technology of China, the MST has gradually launched Innovation City pilots in multiple developed regions since 2008, aiming to leverage innovation to drive urban growth, promote employment, and achieve sustainable development. By now, 78 prefecture-level cities have been selected as Innovation City pilots, and their innovation performance has been assessed annually by the MST. Given the partial overlap in timeline and spatial distribution between the TFI and Innovation City pilots, and considering that the Innovation City pilots had proven effective in enhancing firms’ innovation and TFP [40,41], it was necessary to exclude the interference of this policy. Another competing policy that potentially promotes firms’ innovation and TFP is the Smart City pilot, which was rolled out by the Ministry of Industry and Information Technology (MIIT) in three phases. The smart city concept originated from IBM’s “Smarter Planet” initiative, proposed in 2008, which sought to leverage information and smart technologies to drive new growth points. By improving digital infrastructure, Smart City pilots can significantly reduce the spatial and temporal gaps between firms, facilitating greater communication and collaboration among them, and ultimately accelerating innovation and TFP growth [42].
Undoubtedly, TFI, Innovation Cities, and Smart Cities are all key elements of China’s innovation development strategy, and there is notable overlap and synergy between them. To accurately isolate the policy effect of TFI, it was essential to further control for these two competing policies. Specifically, we introduced policy dummies for the two pilot programs, and we re-estimated our baseline specification (4). As shown in Table A3, after accounting for these concurrent policies, the estimated coefficients showed little change. Thus, the observed improvements in firms’ innovation and TFP appear plausibly to be attributable to the TFI.

5.2.5. Matching DID

Another concern with the DID specification is the absence of effective comparisons. If there are significant differences in characteristics between the treatment and control groups, potential selection bias may confound the validity of the identification. A common solution to this issue is matching, which involves using a set of observable characteristics to establish valid comparison groups and eliminate other confounding factors. In this study, we applied two matching methods: propensity score matching (PSM) and entropy balancing matching (EBM). Specifically, we obtained a matched sample based on all the firms’ covariates prior to the TFI rollout.5 We then re-estimated specification (4), using the weights obtained from the matching procedure, with the results reported in Table A4. As is shown, for both matching estimators, the estimated coefficients for all five dependent variables were consistent with our baseline ones, albeit with minor changes in magnitude. Overall, selection bias had minimal effect on our main findings.

5.2.6. DDD Specification

In the theoretical model, our derivation is based on the premise that financial support improves firms’ liquidity conditions. If the observed improvements in innovation and productivity are indeed attributed to TFI, we expect firms with higher credit costs before the shock to respond more strongly. To strengthen this argument, we followed Chen et al. [15] and conducted a difference-in-difference-in-differences (DDD) specification, as follows:
Y i t = α TFI c t × H i g h c o s t i t + β TFI c t + γ X i t + θ i + η j t + μ p t + ε i j c p t ,
where  H i g h c o s t i t  is a binary indicator for whether a firm faces relatively high credit costs. We used the ratio of interest expenses to total debt to measure a firm’s credit costs. If a firm’s average credit cost exceeded the sample median before the TFP,  H i g h c o s t i t  was assigned a value of 1, and 0 otherwise. Our key coefficient of interest was  α , which captured the additional response magnitude of firms with higher credit costs compared to those with lower ones. If  α  was significantly positive, it suggested that our main findings appeared to be driven by financial support (TFI).
Table A5 reports the results. For the five dependent variables, the interaction term coefficients were all positive and statistically significant. This indicates that the firms with higher credit costs before TFI were more responsive to financial support, in terms of larger increases in innovation and TFP, compared to other firms sharing the same shock. Specifically, these firms experienced 2% more growth in patent applications, 5.4% greater growth in patent citations, and 1.0–1.4% higher growth in TFP. Therefore, the DDD estimates provided credible supporting evidence for our theoretical explanation and main findings.

5.2.7. Placebo Tests

Furthermore, to ensure that our results were not driven by time-varying unobservable factors or random chance, we conducted a placebo test. Following Xin et al. [25] and Long et al. [34], we randomly assigned fictitious treatment to our sample. Given the staggered rollout of TFI, we simultaneously assigned both fictitious treatment status and treatment timing to the sample, and we then re-estimated specification (4), using the simulated sample. To enhance the efficiency of the placebo test, we repeated this process 1000 times for all five dependent variables. Figure A1 plots the distribution of the estimated coefficients from the placebo test, with the red solid line on the right representing our baseline estimates. For the five dependent variables, the estimated coefficients were all concentrated around zero and approximately followed a normal distribution. The coefficient estimates in Table 2 and Table 3 fell at the extreme right of these simulated distributions, exceeding all the fake estimates in magnitude. Collectively, the results in Figure A1 ruled out interference from other unobservable factors, and they suggest that our main findings were not driven by random chance.

5.3. Heterogeneity

5.3.1. Uncertainty Perception

The classic literature suggests that when firms have a clearer perception of uncertainty, they are more likely to allocate resources to new product development and productivity improvements [4,8,22]. When facing financial support, these clearer-perception firms are also more inclined to convert enhanced liquidity conditions into R&D investments, leading to greater growth in innovation and TFP. Out of this idea, we explored heterogeneity by firms’ uncertainty perception. Following the spirit of Baker et al. [43], we used text-analysis tools to extract words and phrases related to uncertainty from the annual reports of listed firms. We quantified uncertainty perception by the proportion of such words and phrases in the annual report text. We created a binary dummy, HighUncertain, which equaled 1 if a firm’s uncertainty perception was above the sample median, and 0 otherwise. We included this dummy variable and its interaction with TFI into our baseline specification and re-estimated (4), with the results reported in Table 4. As is shown, for the five dependent variables, the coefficients of the interaction terms were all positive and statistically significant. These results validate our conjecture that uncertainty perception amplifies firms’ responses to financial support, in terms of innovation and TFP growth.

5.3.2. Ownership Structure

In China, state-owned enterprises (SOEs) enjoy a privileged position, and they are the primary contributors to the local economy, employment, and tax revenue [12,14]. Financial institutions, particularly state-owned banks, also tend to provide credit support to SOEs, as they are endorsed by the government and, thus, have a lower default risk [15,34]. In contrast, private enterprises often face challenges in securing external financing. With financial support, the liquidity conditions of private enterprises would improve more significantly, whereas the improvement for SOEs would be relatively slight. Therefore, we expect the impact of TFI to be more pronounced for private enterprises compared to SOEs. To test this hypothesis, we interacted firms’ ownership structure (SOE = 1) with TFI and re-estimated specification (4). As the results show in Table 5, for all five dependent variables the interaction terms were negative and statistically significant at least at the 5% level. These findings confirm our hypothesis that private enterprises exhibit a stronger response to financial support, in terms of innovation and TFP growth. On average, TFI increases patent applications by 5.9%, invention patent applications by 4.4%, patent citations by 11.4%, and TFP by 2.9–3.4% for private enterprises, while these effects are mostly imprecisely estimated for SOEs.

5.3.3. Regional Financial Development

The effectiveness of financial support depends not only on a firm’s characteristics but also on the local financial development level. In regions with lead financial systems, the information friction between financial institutions and firms is low, facilitating connection building and enabling more efficient allocation of funds to innovative sectors. Following Keh et al. [44], we measured city-level financial development, using the entropy method, weighting indicators including financial scale (loans and deposits/GDP), financial efficiency (loans/deposits), and financial structure (bank loans/total regional credit). According to the median, we categorized the sample into financially leading cities and financially lagging cities. We then included the interaction term between the Finlead dummy and TFI, and we replicated specification (4). Table 6 reports the results. For all five dependent variables, the coefficient estimates of the interaction term were positive and statistically significant, indicating that regional financial development enhances the effectiveness of financial support policies.

5.4. Extended Analysis: Financial Support and Firms’ Operating Performance

So far, we have found compelling evidence that financial support fosters firms’ innovation and TFP. Next, we investigate the indirect effect of TFI on firms’ operating performance, i.e., Proposition 2. We first looked at changes in firms’ profitability, measured by return on assets (ROA) and return on equity (ROE). As shown in columns (1) and (2) of Table 7, the estimated coefficients of TFI were significantly positive, implying that financial support contributes to firms’ profitability. The estimated effects were economically substantial. Specifically, TFI led to: (i) a 0.7% increase in firms’ ROA, or 5.1% of the sample’s standard deviation; and (ii) a 0.5% increase in firms’ ROE, or 5.6% of the sample’s standard deviation. From column (3), we observe that firms’ sales increased by approximately 1.3%, following the shock. In terms of market size, we found that the share of a firm’s sales in its respective industry rose by 0.069% after TFI, as reported in column (4). In summary, financial support improved firms’ operating performance (profitability, sales, and market share), validating Proposition 2.

6. Mechanism Analysis

To interpret our main findings, that TFI boosts firms’ innovation and TFP, we needed to uncover the underlying mechanisms. As outlined in our theoretical model, TFI influences firms’ innovation and TFP through the following mechanism: financial support enhances firms’ liquidity conditions (reducing financing costs and relaxing credit constraints) and stimulates R&D investments, thereby driving technology upgrading and TFP growth. In this section, we examine the mediating role of liquidity conditions and R&D investments. Additionally, we explore changes in firms’ asset mix allocation, which was possibly related to their innovation activities.

6.1. Liquidity Conditions

First, we examine the impact of TFI on firms’ liquidity conditions, considering four aspects: liquidity constraints, financing costs, financing risks, and external subsidies. Liquidity constraints are a crucial determinant of firms’ production and innovation activities and are a direct consequence of financial support. Following Ganau [11], we applied the FC index [45] and the WW index [46] to measure the firms’ credit constraints and to estimate the impact of TFI on them. The higher the values of these indices, the tighter the firm’s credit constraints. The brief procedures for calculating the FC and WW index can be found in Appendix B. Columns (1) and (2) of Table 8 report the estimation results. The coefficient estimates of TFI were both negative and significant at the 1% level, indicating that financial support alleviates firms’ credit constraints. Another key effect of financial support is the reduction in financing costs, which is achieved by lowering friction between financial institutions and firms. Drawing on Chen et al. [15], we employed the ratio of interest to liabilities and the ratio of financial expenses to sales to measure the firm’s financing costs. Columns (3) and (4) display the estimated effects of TFI on these two indicators. As is shown, the coefficient estimates were both negative and statistically significant, indicating that TFI leads to decreased financing costs.
Beyond direct effects, we also observed changes in financial risk and external subsidies. Financing risk serves as an indirect indicator of liquidity conditions, and it determines a firm’s preference for engaging in risky activities, such as innovation. With financial support, firms’ financial risk is expected to decrease, enabling them to invest more actively in R&D. Following Merton [47] and Bhattacharya et al. [48], we measured the firm’s financial risk, using the distance to default (DD)—specifically, the DD-Merton and DD-Bhsh indices—and we tested this hypothesis. “Distance to Default” was proposed by Merton [47], who calculated the volatility of assets and debt levels to measure financial risk. Bhattacharya et al. [48] modified this concept and proposed the DD-Bhsh index. The computing techniques of DD-Merton and DD-Bhsh indices can be found in their papers. A larger distance to default indicates lower financing risk. Columns (5) and (6) of Table 8 present the impact of TFI on financing risk. On average, the firms’ distance to default increased by about 2% after TFI, suggesting that TFI significantly reduces financing risk. External subsidies represent another channel for improving firms’ liquidity constraints. According to the design of TFI, government subsidies play an important role in the policy implementation. As shown in columns (7) and (8), government subsidies (ratio to firm’s assets or sales) significantly increased post-TFI. Overall, the results in Table 8 indicate that financial support significantly improves firms’ liquidity conditions, thereby fostering innovation and TFP growth.

6.2. R&D Investment

Secondly, we examined whether firms translate financial support into R&D investment, which is the direct source of innovation and TFP growth. We considered both the absolute value of R&D investments and the ratio of R&D expenditure to sales, and the estimated results are presented in columns (1) and (2) of Table 9. As is shown, the coefficient estimates of TFI were positive and significant at the 1% level for both measures, indicating a positive correlation between financial support and firms’ R&D investments. Furthermore, we examined the growth of firms’ R&D investment through (i) a binary indicator of whether firms increased their R&D investments, and (ii) the growth rate of firms’ R&D investments. As displayed in columns (3) and (4), TFI increased the probability of R&D investment growth by about 2.1% and raised the growth rate of R&D investment by 3.9%. Taken together, the results in Table 9 suggest that financial support effectively stimulates firms’ R&D investments, thereby fostering innovation and TFP growth.

6.3. Asset Allocation

Thirdly, we examined variations in firms’ asset allocation, which may have been influenced by financial support, and we determined their innovation activities. We approach this analysis from two angles: intertemporal loan allocation and asset mix change. On the one hand, as liquidity conditions improve, firms may allocate more debt to the long term and may reduce short-term liabilities, allowing the firm more foresight [12,14,34]. Increased foresight, in turn, makes firms more inclined to engage in high-risk innovation activities and, thus, gain innovation and TFP growth. We tested this idea by exploring the impact of TFI on changes in firms’ loan composition, and the estimated results are presented in Panel A of Table 10. In columns (1) and (2), the dependent variables were the natural logarithms of the firms’ long-term and short-term loans. We found that financial support significantly increased long-term borrowing while negatively affecting short-term debt. A similar pattern emerged when using the share of long-term and short-term loans as dependent variables, as shown in columns (3) and (4). Therefore, financial support alters firms’ intertemporal loan allocation, making them more forward-looking.
On the other hand, as liquidity conditions improve, firms may change their asset mix. Since collateralized financing is a primary means for firms to obtain liquidity, they tend to increase fixed asset investments, to secure credit [15,17]. However, such fixed asset investments contribute minimally to firms’ innovation capacities. Moreover, they occupy investments in intangible assets that may drive innovation, such as information technology, smart devices, and intellectual property maintenance [18,26]. With financial support, we expect firms to change their asset mix and increase the intangibility of their assets, which benefits innovation and TFP growth. We tested this hypothesis by examining the impact of TFI on firms’ asset mix, and the estimated results are presented in Panel B of Table 10. In columns (1) and (2), the dependent variables were the natural logarithms of fixed assets per capita and intangible assets per capita. We found that financial support significantly reduced the firms’ fixed assets while positively affecting their intangible assets. Additionally, we analyzed the share of fixed and intangible assets. As shown in columns (3) and (4), TFI led to increased asset intangibility, with no significant impact on the share of fixed assets. Collectively, the results in Table 10 suggest that financial support reshapes firms’ asset allocation, thereby fostering innovation and TFP growth.

7. Discussion

Overall, our empirical results effectively replicated the theoretical predictions. In this section, we provide a brief discussion to highlight the key findings.
Firstly, we found compelling evidence that financial support is conducive to firms’ innovation and TFP growth. Financial support policies alleviate liquidity constraints, enabling firms to allocate more resources to high-risk, long-term-yet-high-return innovation activities, which, in turn, leads to technology upgrading and improved innovation performance [2,4]. Our extended analysis further supports this argument, revealing a positive correlation between TFI and firms’ operating performance. The impact of innovation activities on operational performance appears to be immediate, boosting profitability, sales, and market share. There are several studies available for comparison. For instance, Ganau [11] demonstrated that financial support policies ease credit constraints and stimulate TFP, which accelerates the localization of short-term economic growth. Qiu et al. [12] argued that innovation subsidies reduce internal resource competition within firms, improving the allocation of innovation investments and enhancing firms’ competitiveness. Our work also documents the positive impact of financial support policies on innovation performance, but, unlike these studies on developed countries, we focused on a developing, transitioning economy. We also fit into the previous literature examining the effects of tax reductions, fiscal subsidies, and other general financial support [14,16,17,18,19]. They mostly measured financial support using a single or composite indicator, either of which are inevitably subject to endogeneity issues. In contrast, by employing a quasi-natural experiment, our identification largely mitigated endogeneity, yielding more robust and credible results.
Secondly, we uncovered the heterogeneous effects of financial support policies, in terms of firms’ uncertainty perception, ownership structure, and regional financial development. Uncertainty perception is a key determinant in a firm’s engagement in risky decisions, such as innovation activities [4,8]. Firms are more likely to develop new products or business models when they perceive uncertainty or increased market competition. However, these firms may suffer from liquidity constraints, limiting their ability to allocate sufficient resources to R&D investment. Accordingly, with the introduction of financial support policies, they respond more strongly, resulting in greater innovation and TFP growth [22,43]. This also offers an important insight, which is that financial support policies should prioritize firms with high uncertainty perception, to achieve more effective policy outcomes. Within China’s organizational structure, private firms should be the primary beneficiaries of financial support policies, as they are more likely to face liquidity constraints [15]. In response, the Chinese government has continuously emphasized support for private firms, particularly small firms and micro-firms, and it has introduced a range of relief measures [14,17]. Additionally, compared to large state-owned firms, private firms are more active and play a significant role in innovation in developing economies. Given this, financial support should be more geared toward private firms. The regional financial development level is a crucial factor influencing the effectiveness of financial support policies. An efficient financial system is essential for fostering connections between financial institutions and firms and is key to enhancing the impact of financial support policies [23,30,34]. To further maximize the role of financial support, it is necessary to improve the overall level of regional financial development, thereby reducing financial frictions and information asymmetries.
Thirdly, we established a clear and solid logical chain to interpret our main findings: financial support policies—liquidity conditions improve, R&D investments increase, asset allocations optimize—firms’ innovation and TFP grows. By incorporating financing costs and credit constraints into a general equilibrium model with heterogeneous firms, we have provided a generalized depiction of the role of financial support, and we have theoretically established the link between financial support and firms’ innovation investment. The model shows that financial support improves firms’ liquidity conditions and stimulates R&D investment, thereby fostering firms’ innovation and TFP. On the one hand, financial support directly reduces firms’ financing costs and alleviates the external credit constraints needed for innovation [11,30]. Using extensive information from Chinese listed firms, we found that financial support policies yield a comprehensive effect on improving firms’ liquidity conditions. With the introduction of TFI, firms experience a decrease in liquidity constraints, financing costs, and financial risks, while external subsidies significantly increase. This lays the foundation for firms to engage in high-risk, long-term innovation activities, constituting a reasonable mechanism. On the other hand, the improvement in liquidity conditions stimulates firms’ R&D investment, both in terms of scale and growth rate. Financial support policies enable firms to allocate more resources to R&D activities, which directly leads to innovation and TFP growth [5,14,16]. Moreover, we found that the optimization of asset structure also acts as a potential mechanism through which financial support can be exerted. Financial support enables firms to have more foresight and direct debt financing toward the long term, which aligns with the features of innovation activities [15,18]. Meanwhile, with eased credit constraints, firms reduce their holdings of fixed assets and shift their investments toward intangible assets, which is beneficial for innovation and TFP growth [33,34,41].

8. Conclusions and Policy Implications

Technology upgrading is crucial for economic growth, social stability, and sustainable development, and financial support plays a potential role in promoting it. From the micro perspective, this study explored the impact of financial support on firms’ innovation and TFP. To facilitate empirical analysis, we began by constructing a heterogeneous model of a firm with endogenous technology progress, to theoretically explain how financial support would impact firms’ innovation activities and productivity from the micro perspective. Then, using data from Chinese listed firms during 2006–2022, we employed a time-varying DID approach to examine how a financial support initiative—the Technology and Finance Integration (TFI) policy—affected firms’ innovation (both quantity and quality) and TFP.
Our results indicate that TFI led to an approximately 4% increase in patent applications, primarily driven by a 3.1% rise in invention patents. In addition, the quality of firms’ innovation improved significantly. After TFI, the total number of patent citations across the firms increases by 9.3%, on average. Consequently, we observed a corresponding improvement in TFP, ranging from 2.2 to 2.4%. These findings were robust across a range of tests, such as various DID estimators, alternative variable measurements, matched DID, DDD estimation, exclusion of concurrent policies, and placebo tests. Our event study revealed no pre-existing trends in the treatment effects for all the above outcome variables. Moreover, we found that the policy effect was more pronounced in firms with higher perceived uncertainty, private firms, and those located in regions with more advanced financial development. An extended analysis showed that TFI also boosted firms’ operating performance, including profitability, sales, and market share.
On this basis, we explored the potential mechanisms through which TFI exerts it effects, in three aspects: liquidity conditions, R&D investments, and asset mix allocation. Our findings were as follows: Firstly, financial support significantly improved firms’ liquidity conditions. Specifically, with the introduction of TFI, firms experienced a relaxation of credit constraints, a mitigation of financial risks, a reduction in financing costs, and an increase in external subsidies. Secondly, TFI boosted firms’ R&D investments, both in absolute terms and growth rate. Thirdly, financial support reshaped the asset allocation strategies of firms. Following TFI, firms allocated more loans to the long term. We observed that long-term loans significantly increased, while short-term debt significantly decreased. The same pattern applied to their ratio in loans. Additionally, firms reduced investments in fixed assets and increased investments in intangible assets. The intangibilization of their asset mix contributed to technology upgrading and TFP growth.
Overall, this study provides compelling theoretical and empirical evidence for the role of financial support in promoting firms’ innovation and TFP, offering valuable insights for the development of financial and innovation policies. We suppose the contributions of this paper are threefold. First, by constructing a heterogeneous model of firm with endogenous technology progress, we have theoretically explained the impact of financial support on firms’ innovation behavior and productivity. The heterogeneous model of a firm builds on trade and endogenous innovation literature, yet it has seen limited application in the field of finance support. Secondly, utilizing a quasi-natural experiment, we have provided micro-level causal evidence on the relationship between financial support, innovation, and TFP. This work effectively mitigates potential endogeneity, and the findings were supported by a series of robustness tests. Thirdly, from the perspectives of liquidity conditions, R&D investments, and asset mix allocation, we have uncovered the mechanisms by which financial support influences firms’ innovation activities and TFP, thereby deepening our understanding of the role of financial support.
Based on our findings, we derived the following policy implications. Firstly, our results suggest that the TFI significantly enhances firms’ liquidity conditions and boosts their R&D investments. As a result, firms’ innovation and TFP improve substantially. Therefore, the scope of pilot cities for the TFI initiative should be expanded, and financial support should be strengthened to fully leverage its potential in promoting innovation. Secondly, credit relaxation and asset allocation are important channels through which the policy achieves its effects. As such, pilot governments should take a leading role in facilitating and promoting these efforts. Specifically, to maximize the impact of credit support, pilot governments should establish a comprehensive database of technology experts and create an online consultation platform. They should also organize experts to assess loan projects for tech firms, provide professional advice to banks, and offer loan guarantees to technology firms. These initiatives can help reduce information asymmetry between financial institutions and firms, thereby mobilizing more social capital for innovation. Thirdly, heterogeneity analysis shows that the policy’s innovation effects are weaker in regions with lagging financial development. Therefore, local governments should focus on fostering financial development in these areas, to enhance the effectiveness of financial support.
It is worth noting that the theoretical model and empirical research design in this paper have certain limitations, which are open to further research. In terms of the theoretical model, our static design abstracts time, and future research could consider dynamic decision-making processes by firms. As for the empirical research design, although a series of robustness checks were conducted, it remains challenging to fully account for unobservable factors, such as concurrent policies. A more precise evaluation of the effects of financial support will require more granular data and improvements in identification strategies. In particular, the policy effects that we identified are more akin to local average treatment effects (LATEs). Broader comparative analyses in the context of other economies would enhance the external validity of our conclusions. Furthermore, the outcome scope could be expanded to other potential social and environmental impacts of financial policies, as well as their long-term sustainability, which will constitute our next step. Specifically, examining the impact on particular sectors, such as green technology or creative industries, may provide more targeted and effective assessments of policy outcomes.

Author Contributions

Conceptualization, G.L. and X.B., methodology, G.L., software, G.L., formal analysis, G.L., investigation, G.L., resources, G.L., data curation, G.L., writing—original draft preparation, G.L., writing—review and editing, G.L. and X.Z., supervision, G.L., funding acquisition, X.Z. All authors have read and agreed to the published version of the manuscript.

Funding

This work was funded by the General Project of Philosophy and Social Science Research in Colleges and Universities in Jiangsu Province (2024SJYB1514), and by Jiangsu Provincial Decision-making Consultation Research Base Project (24SSL045).

Data Availability Statement

Data are available upon request.

Acknowledgments

We thank two anonymous referees for their helpful suggestions. All errors are our own.

Conflicts of Interest

The authors declare no conflicts of interest.

Abbreviations

The following abbreviations are used in this manuscript:
TFITechnology and Finance Integration
TFPtotal factor productivity
MSTMinistry of Science and Technology
R&Dresearch and development
DIDdifference-in-differences
DDDdifference-in-difference-in-differences

Appendix A

Table A1. Robustness check: alternative DID estimators comparison.
 (1)(2)(3)(4)(5)
Dependent VariableTFP_OPTFP_LPLn(1+Patent)Ln(1+IP)Ln(Patent_Cite)
Panel A: Sun and Abraham [38] Estimator
TFI0.030 ***0.021 ***0.038 **0.034 **0.115 **
(0.009)(0.004)(0.015)(0.014)(0.053)
N32,33832,33832,33832,33832,338
Adj. R20.8670.8100.7610.7480.869
Panel B: Wooldridge [39] Estimator
TFI0.030 ***0.024 ***0.045 ***0.037 ***0.094 **
(0.007)(0.004)(0.011)(0.010)(0.037)
N23,81723,81723,81723,81723,817
Adj. R20.8590.7820.7520.7460.876
ControlsYYYYY
Firm FEYYYYY
Industry × Year FEYYYYY
Province × Year FEYYYYY
Notes: This table shows the estimated effects of TFI on firms’ productivity and innovation activities with the alternative DID estimators outlined by Sun and Abraham [38] in Panel A and Wooldridge [39] in Panel B. Across the board, we controlled for firms’ controls, firms’ fixed effects, industry-by-year fixed effects, and province-by-year fixed effects. Standard errors clustered at the prefecture level are reported in parentheses. ** p < 0.05 and *** p < 0.01.
Table A2. Robustness check: alternative measures for outcomes.
 (1)(2)(3)(4)(5)
Dependent VariableTFP_OPTFP_LPLn(1+Patent)Ln(1+IP)Ln(Patent_Cite)
TFI0.032 ***0.019 ***0.098 **0.149 ***0.036 ***
(0.005)(0.004)(0.038)(0.031)(0.010)
ControlsYYYYY
Firm FEYYYYY
Industry×Year FEYYYYY
Province×Year FEYYYYY
N32,33832,33832,33832,33832,338
Adj. R20.9190.8120.7670.6950.648
Notes: This table shows the estimated effects of TFI on firms’ productivity and innovation activities with alternative outcome measurements. Across the board, we controlled for firms’ controls, firms’ fixed effects, industry-by-year fixed effects, and province-by-year fixed effects. Standard errors clustered at the prefecture level are reported in parentheses. ** p < 0.05 and *** p < 0.01.
Table A3. Robustness check: ruling out concurrent policies.
 (1)(2)(3)(4)(5)
Dependent VariableTFP_OPTFP_LPLn(1+Patent)Ln(1+IP)Ln(Patent_Cite)
TFI0.025 ***0.023 ***0.038 ***0.029 ***0.092 **
(0.007)(0.004)(0.011)(0.010)(0.036)
      
Innovate CityYYYYY
Smart CityYYYYY
ControlsYYYYY
Firm FEYYYYY
Industry × Year FEYYYYY
Province × Year FEYYYYY
N32,33832,33832,33832,33832,338
Adj. R20.8670.8100.7610.7480.869
Notes: This table shows the estimated effects of TFI on firms’ productivity and innovation activities, controlling for concurrent confounding policies. Across the board, we controlled for firms’ controls, firms’ fixed effects, industry-by-year fixed effects, and province-by-year fixed effects. Standard errors clustered at the prefecture level are reported in parentheses. ** p < 0.05 and *** p < 0.01.
Table A4. Robustness check: matching DID.
 (1)(2)(3)(4)(5)
Dependent VariableTFP_OPTFP_LPLn(1+Patent)Ln(1+IP)Ln(Patent_Cite)
Panel A: PSM-DID
TFI0.016 **0.022 ***0.037 ***0.029 **0.085 **
(0.008)(0.004)(0.012)(0.012)(0.041)
N25,73425,73425,73425,73425,734
Adj. R20.8610.8010.7580.7430.866
Panel B: EBM-DID
TFI0.025 ***0.024 ***0.040 ***0.032 ***0.085 **
(0.007)(0.004)(0.011)(0.010)(0.036)
N32,33832,33832,33832,33832,338
Adj. R20.8700.8060.7610.7490.868
ControlsYYYYY
Firm FEYYYYY
Industry × Year FEYYYYY
Province × Year FEYYYYY
Notes: This table shows the estimated effects of TFI on firms’ productivity and innovation activities with alternative matching DID estimators. Panel A adopts 1:1 nearest propensity score matching (PSM), while Panel B applies entropy balance matching (EBM). Across the board, we controlled for firms’ controls, firms’ fixed effects, industry-by-year fixed effects, and province-by-year fixed effects. Standard errors clustered at the prefecture level are reported in parentheses. ** p < 0.05 and *** p < 0.01.
Table A5. Robustness check: DDD estimates.
 (1)(2)(3)(4)(5)
Dependent VariableTFP_OPTFP_LPLn(1+Patent)Ln(1+IP)Ln(Patent_Cite)
TFI × HighCost0.014 ***0.010 **0.020 **0.019 **0.054 **
(0.005)(0.004)(0.008)(0.007)(0.026)
TFI0.018 **0.017 ***0.030 ***0.023 **0.071 **
(0.007)(0.004)(0.011)(0.010)(0.036)
ControlsYYYYY
Firm FEYYYYY
Industry × Year FEYYYYY
Province × Year FEYYYYY
N32,33832,33832,33832,33832,338
Adj. R20.8680.8030.7620.7490.869
Notes: This table shows the estimated effects of TFI on firms’ productivity and innovation activities with DDD estimators. HighCost was a dummy if the firm’s financing cost was above the median in its respective industry before TFI. Across the board, we controlled for firms’ controls, firms’ fixed effects, industry-by-year fixed effects, and province-by-year fixed effects. In regression, we interacted HighCost with the TFI indicator, as well as with all firms’ time-varying controls, to flexibly account for the common support assumption. Standard errors clustered at the prefecture level are reported in parentheses. ** p < 0.05 and *** p < 0.01.
Figure A1. Placebo tests. Dependent variables were, in order: (a) Patent applications. (b) Invention patent applications. (c) Patent citations. (d) TFP_OP. (e) TFP_LP.
Sustainability 17 00244 g0a1

Appendix B

Appendix B.1. Derivation for Unit Cost

We assume that the cost function is written as
c i = l i + r i k i ,
where we standardize the labor price to 1, and where  r i  denotes the capital price. To minimize the cost required to produce a specific output  x i = l i α k i 1 α , we can construct the Lagrange function:
L = l i + r i k i + μ ( x i l i α k i 1 α ) ,
Then, taking partial derivatives to the Lagrange function, we can obtain the first-order conditions (FOCs), as follows:
L l = 1 μ α l α 1 k 1 α = 0
L k = r μ ( 1 α ) l α k α = 0
L μ = x l α k 1 α = 0
Clearly, we have  k i = ( 1 α ) l i / ( α r i ) . Substituting this condition into the production function, we can derive the  l i  and  k i  demand for producing  x i :
l i = x i ( α r i ) ( 1 α ) ( 1 α ) ( α 1 )
k i = x i ( α r i ) α ( 1 α ) α
Ultimately, we obtain the unit cost (when  x i = 1 ) as
c i = α α ( 1 α ) ( 1 α ) r i 1 α .

Appendix B.2. Derivation for Equilibrium Solution

To obtain the equilibrium solution, we first describe several conditions. In the monopolistic competition market, a firm sets a price to a constant markup over marginal cost, which yields the firm’s profit function:
P R i = π i / σ f .
which means that the firm’s profit is a markup of the firm’s revenue; then, we subtract the fixed costs. A firm would cease production if its profit was lower than zero, which we call the zero-profit condition:
π i = σ f .
Since profits (revenues) increase monotonically with productivity, this would yield a cut-off in productivity,  φ * , below which the firm would exit the market.
To ensure the market is free-entry, the expected profits must equal the entry costs. Following Melitz [29], we assume an endogenous exit probability  χ ; the free-entry condition requires that
φ * θ P R i ¯ χ = f e
where  φ * θ  captures the probability for firms to produce (in Pateto distribution), and
P R i ¯ = π i ¯ / σ f = φ * π i d G φ f .
Meanwhile, we will obtain the equilibrium market size condition:
φ * θ M e = χ M ,
where  M e  denotes the mass of entry firms, and M denotes the mass of firms in the market.
The factor supplied in the market is finite, labeled as F, which is used to pay off the entry, fixed, and production costs:
F = M e f e + M f + M φ * q i d G φ
where  q i = γ i x i / φ . We call this equation the market-clearing condition.
Constructing a Lagrange function for the constrained-maximum-profit problem in Section 3.1.4 and substituting the above conditions, we can obtain the equilibrium solution, as follows (the derivation process is similar to that in Appendix B.1, and, for simplicity, the details are omitted here):
Optimal Innovation Investment:
γ i * = σ 1 2 σ σ R P 1 σ 1 1 + Δ σ + 1 1 c i σ 1 1 φ σ
Firm’s Profit Rate:
P R i * = 1 2 + Δ 1 + Δ σ 1 2 σ π i M η r i β f π i
Firm’s Market Share:
π i * π j * = A i A j 1 σ for   any   i , j

Appendix B.3. Calculation of Firm’s TFP

In the main text, we calculated the firms’ TFP with the techniques outlined by Olley and Pakes [31] and Levinsohn and Petrin [32]. Here, we briefly describe the calculation process.
Consider a (logged) C–D form production function, as follows:
y i t = φ i t + β l l i t + β k k i t + β m m i t + ε i t
where  y i t l i t k i t , and  m i t  denote output, labor, capital, and intermediate inputs, respectively;  φ i t  is the firm’s TFP, and  ε i t  captures the measurement error. Given the presence of endogeneity arising from unobserved productivity shock, the OLS estimates for the production elasticity vector  ( β l , β k , β m )  suffer from selection biases. To overcome this challenge, a useful practice is to construct a control function that proxies the unobserved productivity. The control-function approach was initiated by Olley and Pakes [31] and developed by Levinsohn and Petrin [32], who used the investment (material demand) function as a proxy for unobserved productivity, as follows:
m i t = m t ( φ i t , l i t , k i t )
Re-arranging the above control function, we obtain the TFP expression:
φ i t = h t ( l i t , k i t , m i t )
To estimate this equation, in the first stage, we purge the error term by regressing the output conditional on the inputs:
y i t = z t ( l i t , k i t , m i t ) + ε i t
which yields a predicted output  y i t ^ . Then, in the second stage, we use the predicted output to calculate the expression of firm TFP:
φ i t = y i t ^ β l l i t β k k i t β m m i t

Appendix B.4. Calculation of FC and WW Indices

To measure firms’ credit constraints, we adopt the FC index [45] and the WW index [46]. Here, we present a brief calculation process.
  • FC index. The calculation of the FC index involves two steps. Firstly, the variables for a firm’s size, age, and cash dividend payout ratio are standardized on an annual basis, and the sample is grouped, based on the mean values of the standardized variables. Firms with average values above the one-third quantile are considered to have relatively light financing constraints, and the corresponding  Q U F C  is set to 0. Firms with average values below the one-third quantile are considered to have relatively heavy financing constraints, and the corresponding  Q U F C  is set to 1. Secondly, a Logit model is used to estimate the probability of a firm experiencing financing constraints ( Q U F C = 1 ) in a given year, and the fitted value from this model becomes the FC index. The larger the FC index, the tighter the firm’s financing constraints. The two steps are visually represented by the following estimation:
    P ( Q U F C = 1 | Z i t ) = e Z i t 1 + e Z i t
    where  Z i t  is a set of financial control variables, including the firm’s size, leverage, ROA, cashflow rate, and default risks.
  • WW index. Following Whited and Wu [46], the WW index is calculated by the following expression:
    W W i t = 0.091 × C a s h i t 0.062 × D I V i t + 0.021 × L e v e r a g e i t 0.044 × S i z e i t + 0.035 × S a l e G r o w t h i t + 0.102 × I n d G r o w t h j t
    where  C a s h i t  denotes the firm’s cashflow-to-asset ratio,  D I V i t  denotes an indicator for whether the firm pays cash dividends,  L e v e r a g e i t  denotes the firm’s leverage,  S i z e i t  denotes the firm’s size,  S a l e G r o w t h i t  denotes the firm’s sale growth rate, and  I n d G r o w t h j t  denotes the sale growth rate of the industry to which the firm belongs.

Notes

1
TFP is also known as the “Solow Residual”, which calculates the contribution of intangible factors to economic growth, beyond the accumulation of tangible factors (e.g., labor, capital, and materials); compared to simple productivity measures, such as labor productivity (the output-to-labor ratio), it provides a comprehensive reflection of the contributions made by all tangible and intangible factors to economic growth, offering a more accurate measure of technology upgrading [3]. From the perspective of sustainable development, given inputs, TFP growth is the sole driver of economic development. In other words, TFP growth is the key determinant that balances development with intensive production.
2
The pilot cities include Beijing, Tianjin, Shanghai, Nanjing, Wuxi, Xuzhou, Changzhou, Suzhou, Nantong, Lianyungang, Huaian, Yangzhou, Zhenjiang, Taizhou, Suqian, Hangzhou, Wenzhou, Huzhou, Hefei, Bengbu, Wuhu, Wuhan, Changsha, Foshan, Dongguan, Chongqing, Chengdu, Mianyang, Xi’an, Baoji, Tianshui, Weinan, Tongchuan, Shangluo, Qingyang, Pingliang, Longnan, Dalian, Qingdao, Shenzhen in the 2011 wave, and Zhengzhou, Xiamen, Ningbo, Jinan, Nanchang, Guiyang, Yinchuan, Baotou, Shenyang in the 2016 wave. By our manual calculation, these cities included about 46.8% (43.9%) of the listed (technology) firms in China during our sample period.
3
Our theory complements the classic heterogeneous model of a firm by incorporating financial costs and endogenous technology progress, while retaining the standard settings in Dixit and Stiglitz [27], Helpman and Krugman [28], and Melitz [29]. Our contribution, theoretically, is to abstract the outcomes of financial support policies and interpret the potential mechanisms linking them to firms’ innovation and TFP. To save space, we deferred some technical details to Appendix B. Readers familiar with mathematical derivations are encourage to read the work of Dixit and Stiglitz [27] and of Melitz [29], whose pioneering exercises in regard to the heterogeneous model of a firm formed important foundations in the domains of industrial organization and international trade.
4
For analytical brevity, we employ a CES demand structure, which is a well-accepted utility assumption and is supported by a plethora of empirical findings and structural estimations [12,18,29]; see Guadalupe et al. [30] for a discussion. Indeed, any monotonic, non-decreasing utility function across varieties of goods will lead to similar conclusions. The CES setting aligns with the excellent exercises by Dixit and Stiglitz [27] and Helpman and Krugman [28], which captures the fact that the preferences of representatives consumer are well-behaved, as in classical consumer theory.
5
A series of balance tests supported the effectiveness of our matching procedure, showing that there were no significant differences between the treatment and control groups across all the firms’ covariates after matching. To save space, we have not reported the balance test results, but these are available upon request).

References

  1. Schumpeter, J. The Theory of Economic Development; Harvard University Press: Cambridge, MA, USA, 1932. [Google Scholar]
  2. Aghion, P.; Howitt, P. A Model of Growth through Creative Destruction. Econometrica 1992, 60, 325–351. [Google Scholar] [CrossRef]
  3. Solow, R. A Contribution to the Theory of Economic Growth. Q. J. Econ. 1956, 70, 65–94. [Google Scholar] [CrossRef]
  4. Holmstrom, B. Agency costs and innovation. J. Econ. Behav. Organ. 1989, 12, 305–327. [Google Scholar] [CrossRef]
  5. Xue, J.; Yip, K.; Zheng, J. Innovation capability, credit constraint and the cyclicality of R&D investment. Econ. Lett. 2021, 199, 109705. [Google Scholar]
  6. Impullitti, G. Credit constraints, selection and productivity growth. Econ. Model. 2021, 111, 105797. [Google Scholar] [CrossRef]
  7. Nickll, S.; Nicolitsas, D. How Does Financial Pressure Affect Firms. Eur. Econ. Rev. 1999, 43, 1435–1456. [Google Scholar] [CrossRef]
  8. Hottenrott, H.; Peters, B. Innovative capability and financing constraints for innovation: More money, more innovation? Rev. Econ. Stat. 2012, 94, 1126–1142. [Google Scholar] [CrossRef]
  9. Pellegrino, G.; Savona, M. No money, no honey? Financial versus knowledge and demand constraints on innovation. Res. Policy 2017, 46, 510–521. [Google Scholar] [CrossRef]
  10. Nguyen, L.; Su, J.; Sharma, P. SME Credit Constraints in Asia’s Rising Economic Star: Fresh Empirical Evidence from Vietnam. Appl. Econ. 2019, 51, 3170–3183. [Google Scholar] [CrossRef]
  11. Ganau, R. Productivity, Credit Constraints and the Role of Short-Run Localization Economies: Micro-Evidence from Italy. Reg. Stud. 2019, 50, 1834–1848. [Google Scholar] [CrossRef]
  12. Qiu, L.; Wei, X.; Zhou, M.; Zhou, Y. Resource, competition, and the equilibrium effects of innovation subsidies. J. Econ. Behav. Organ. 2024, 224, 297–322. [Google Scholar] [CrossRef]
  13. Wen, J.; Zhao, X.; Fu, Q.; Chang, C. The impact of financial risk on green innovation: Global evidence. Pac.-Basin Financ. J. 2023, 177, 101896. [Google Scholar] [CrossRef]
  14. Du, Z.; Wang, Q. The power of financial support in accelerating digital transformation and corporate innovation in China: Evidence from banking and capital markets. Financ. Innov. 2024, 10, 1–34. [Google Scholar] [CrossRef]
  15. Chen, S.; Tao, C.; Lou, P.; Song, H.; Wu, C. Bank deregulation and corporate environmental performance. World Dev. 2023, 161, 106106. [Google Scholar] [CrossRef]
  16. Fan, Q.; Wang, L.; Jia, W. Does financial support improve the economic effect of agricultural enterprises? Appl. Econ. 2023, 56, 1–14. [Google Scholar] [CrossRef]
  17. Zhang, M.; Jin, X.; Li, Y.; Tang, X. Influence of Financial Support on Regional Innovation Across Different Phases of the COVID-19 Pandemic. Emerg. Mark. Financ. Trade 2023, 60, 1–16. [Google Scholar] [CrossRef]
  18. Andersen, D. Do credit constraints favor dirty production? Theory and plant-level evidence. J. Environ. Econ. Manag. 2017, 84, 189–208. [Google Scholar] [CrossRef]
  19. Wei, R.; Wang, X.; Chang, Y. The effects of platform governance mechanisms on customer participation in supplier new product development. J. Bus. Res. 2021, 137, 475–487. [Google Scholar] [CrossRef]
  20. Shin, D.; Zeevi, A. Product Quality and Information Sharing in the Presence of Reviews. Manag. Sci. 2023, 30, 1428–1447. [Google Scholar]
  21. Niu, W.; Chao, X.; Liu, L.; Zhang, L.; Luo, M. Financial support to a supplier for quality improvement in a dual-channel supply chain. Comput. Ind. Eng. 2024, 189, 109975. [Google Scholar] [CrossRef]
  22. Hewitt-Dundas, D. Resource and Capability Constraints to Innovation in Small and Large Plants. Small Bus. Econ. 2006, 26, 257–277. [Google Scholar] [CrossRef]
  23. Gu, Y.; Mao, C.; Tian, X. Banks’ Interventions and Firms’ Innovation: Evidence from Debt Covenant Violations. J. Law Econ. 2017, 60, 637–671. [Google Scholar] [CrossRef]
  24. Kim, W.; Hoi, T.; Tuan, L.; Trung, N. R&D, Training and Accessibility to Finance for Innovation: A Case of Vietnam, the Country in Transition. Asian J. Technol. Innov. 2019, 27, 172–193. [Google Scholar]
  25. Xin, K.; Sun, Y.; Zhang, R.; Liu, X. Debt Financing and Technological Innovation: Evidence from China. J. Bus. Econ. Manag. 2019, 20, 841–859. [Google Scholar] [CrossRef]
  26. Archer, L.; Sharma, P.; Su, J. Do credit constraints always impede innovation? Empirical evidence from Vietnamese SMEs. Appl. Econ. 2020, 52, 4864–4880. [Google Scholar] [CrossRef]
  27. Dixit, A.; Stiglitz, J. Monopolistic Competition and Optimum Product Diversity. Am. Econ. Rev. 1977, 76, 297–308. [Google Scholar]
  28. Helpman, E.; Krugman, P. Market Structure and Foreign Trade: Increasing Returns, Imperfect Competition, and the International Economy; MIT Press: Cambridge, MA, USA, 1985. [Google Scholar]
  29. Melitz, M. The Impact of Trade on Intra-Industry Reallocations and Aggregate Industry Productivity. Econometrica 2003, 71, 1695–1725. [Google Scholar] [CrossRef]
  30. Guadalupe, M.; Kuzmina, O.; Thomas, C. Innovation and Foreign Ownership. Am. Econ. 2012, 102, 3594–3627. [Google Scholar] [CrossRef]
  31. Olley, G.; Pakes, A. The Dynamics of Productivity in the Telecommunications Equipment Industry. Econometrica 1996, 64, 1263–1297. [Google Scholar] [CrossRef]
  32. Levinsohn, J.; Petrin, A. Estimating Production Functions Using Inputs to Control for Unobservables. Rev. Econ. Stud. 2003, 72, 317–341. [Google Scholar] [CrossRef]
  33. Liang, Y.; Shi, K.; Tao, H.; Xu, J. Learning by exporting: Evidence from patent citations in China. J. Int. Econ. 2024, 150, 103933. [Google Scholar] [CrossRef]
  34. Long, C.; Yi, W. Information effects of high-speed rail: Evidence from patent citations in China. China Econ. Rev. 2024, 84, 102115. [Google Scholar] [CrossRef]
  35. Ackerberg, D.; Caves, K.; Frazer, G. Identification properties of recent production function estimators. Econometrica 2015, 83, 2411–2451. [Google Scholar] [CrossRef]
  36. Beck, T.; Levine, R.; Levkov, A. Big Bad Banks? The Winners and Losers from Bank Deregulation in the United States. J. Financ. 2010, 65, 1637–1667. [Google Scholar] [CrossRef]
  37. Roth, J.; Sant’Anna, P.; Bilinski, A.; Poe, J. What’s trending in difference-in-differences? A synthesis of the recent econometrics literature. J. Econom. 2023, 135, 2218–2244. [Google Scholar] [CrossRef]
  38. Sun, L.; Abraham, S. Estimating dynamic treatment effects in event studies with heterogeneous treatment effects. J. Econom. 2021, 225, 175–199. [Google Scholar] [CrossRef]
  39. Wooldridge, J. Two-Way Fixed Effects, the Two-Way Mundlak Regression, and Differences-in-Differences Estimators. SSRN3906345. 2021, pp. 1–89. Available online: https://economics.princeton.edu/wp-content/uploads/2021/08/two_way_mundlak-Wooldridge.pdf (accessed on 4 October 2024).
  40. Yu, Y.; Chen, X.; Zhang, N. Innovation and energy productivity: An empirical study of the innovative city pilot policy in China. Technol. Forecast. Soc. Chang. 2022, 176, 121430. [Google Scholar] [CrossRef]
  41. Liu, B.; Li, Y.; Liu, J.; Hou, Y. Does urban innovation policy accelerate the digital transformation of enterprises? Evidence based on the innovative City pilot policy. China Econ. Rev. 2024, 85, 102167. [Google Scholar] [CrossRef]
  42. Wang, J.; Deng, K. Impact and mechanism analysis of smart city policy on urban innovation: Evidence from China. Econ. Anal. Policy 2022, 73, 574–587. [Google Scholar] [CrossRef]
  43. Baker, S.; Bloom, N.; Davis, S. Measuring Economic Policy Uncertainty. Q. J. Econ. 2016, 131, 1593–1636. [Google Scholar] [CrossRef]
  44. Keh, G.; Gan, P.; Gamal, A.; Ramli, N. Financial development-economic growth nexus: A bibliometric analysis. Environ. Dev. Sustain. 2024, in press. [Google Scholar] [CrossRef]
  45. Fazzari, S.M.; Hubbard, R.G.; Petersen, B.C. Financing Constraints and Corporate Investment. Brook. Pap. Econ. Act. 1988, 19, 141–195. [Google Scholar] [CrossRef]
  46. Whited, T.M.; Wu, G. Financial constraints risk. Rev. Financ. Stud. 2006, 19, 531–559. [Google Scholar] [CrossRef]
  47. Merton, R.C. On the Pricing of Corporate Debt: The Risk Structure of Interest Rates. J. Financ. 1974, 29, 449–470. [Google Scholar]
  48. Bhattacharya, S.; Chatterjee, S.; Nanda, V. The Role of Managerial Risk-Taking in the Capital Structure of the Firm: A Theoretical and Empirical Analysis. J. Financ. Econ. 1997, 45, 29–68. [Google Scholar]
Figure 1. Event study plots. The dependent variables were, in order: (a) Patent and invention patent applications. (b) Patent citations. (c) TFP by OP and LP methods.
Sustainability 17 00244 g001
Table 1. Descriptive Statistics.
VariableNMeanMedianS.D.MinMax
TFP_OP32,3382.4522.4110.3861.5333.725
TFP_LP32,3381.0641.0340.2220.4502.083
Patent32,33849.3761896.49001587
IP32,33819.772644.3520483
UMP32,33823.620748.3040707
AP32,3384.789016.9770397
Patent_Cite32,3382.6712.7081.721010.556
TFI32,3380.46800.49901
Size32,33822.12021.9881.23019.57126.210
Age32,33818.722185.715734
Leverage32,3380.4380.4340.1960.0580.973
ROE32,3380.0630.0700.120−0.8150.397
TOA32,3380.6500.5640.3980.0702.681
Cashflow32,3380.0490.0470.064−0.1650.253
Board32,3388.75091.545615
Indep32,3380.3720.3330.5060.3000.571
Dual32,3380.25800.43701
Top1032,3380.5700.5750.1450.2250.903
Tobin’s Q32,3381.9771.6181.1290.8548.971
Notes: This table shows the descriptive statistics of our key variables, with a detailed definition for each variable presented in Section 4.
Table 2. Effects of TFI on firms’ innovation.
 (1)(2)(3)(4)(5)
Dependent VariableLn(1+Patent)Ln(1+IP)Ln(1+UMP)Ln(1+DP)Ln(Patent_Cite)
TFI0.040 ***0.031 ***0.0090.0100.093 ***
 (0.011)(0.010)(0.010)(0.009)(0.035)
ControlsYYYYY
Firm FEYYYYY
Industry × Year FEYYYYY
Province × Year FEYYYYY
N32,33832,33832,33832,33832,338
Adj. R20.7610.7480.7450.6490.869
Notes: This table shows the estimated effects of TFI on the firms’ innovation activities. Across the board, we controlled for firm controls, firm fixed effects, industry-by-year fixed effects, and province-by-year fixed effects. Standard errors clustered at the prefecture level are reported in parentheses. *** p < 0.01.
Table 3. Effects d of TFI on firms’ TFP.
 (1)(2)(3)(4)
Dependent VariableTFP_OPTFP_OPTFP_LPTFP_LP
TFI0.022 ***0.024 ***0.022 ***0.023 ***
(0.008)(0.007)(0.004)(0.004)
ControlsNYNY
Firm FEYYYY
Industry × Year FEYYYY
Province × Year FEYYYY
N32,33832,33832,33832,338
Adj. R20.7860.8670.7450.811
Notes: This table shows the estimated effects of TFI on the firms’ TFP. Across the board, we controlled for the firms’ fixed effects, the industry-by-year fixed effects, and the province-by-year fixed effects. Columns (1) and (3) do not include the firms’ time-varying controls, while columns (2) and (4) do. For brevity, estimates for the firms’ controls are not reported, but are available on request. Standard errors clustered at the prefecture level are reported in parentheses. *** p < 0.01.
Table 4. Heterogeneity analysis: perceived uncertainty.
 (1)(2)(3)(4)(5)
Dependent VariableTFP_OPTFP_LPLn(1+Patent)Ln(1+IP)Ln(Patent_Cite)
TFI×HighUncertain0.008 **0.006 **0.013 **0.014 **0.040 *
(0.004)(0.003)(0.006)(0.006)(0.023)
TFI0.019 ***0.020 ***0.037 ***0.030 ***0.079 **
(0.007)(0.004)(0.011)(0.010)(0.036)
ControlsYYYYY
Firm FEYYYYY
Industry × Year FEYYYYY
Province × Year FEYYYYY
N31,09031,09031,09031,09031,090
Adj. R20.8710.8120.7630.7500.870
Notes: This table shows the estimated heterogeneous effects of TFI on firm productivity and innovation activities by perceived uncertainty. HighUncertain was a dummy if the firm’s perceived uncertainty was above the median in its respective industry before TFI. Across the board, we controlled for firms’ controls, firms’ fixed effects, industry-by-year fixed effects, and province-by-year fixed effects. In regression, we interacted HighUncertain with the TFI indicator, as well as with all firms’ time-varying controls, to flexibly account for the common support assumption. Standard errors clustered at the prefecture level are reported in parentheses. * p < 0.10, ** p < 0.05, and *** p < 0.01.
Table 5. Heterogeneity analysis: ownership structure.
 (1)(2)(3)(4)(5)
Dependent VariableTFP_OPTFP_LPLn(1+Patent)Ln(1+IP)Ln(Patent_Cite)
TFI×SOE−0.019 **−0.012 **−0.042 ***−0.031 **−0.054 **
(0.009)(0.005)(0.015)(0.014)(0.026)
TFI0.034 ***0.029 ***0.059 ***0.044 ***0.114 ***
(0.008)(0.004)(0.013)(0.012)(0.043)
ControlsYYYYY
Firm FEYYYYY
Industry × Year FEYYYYY
Province × Year FEYYYYY
N32,33832,33832,33832,33832,338
Adj. R20.8670.8110.7610.7480.869
Notes: This table shows the estimated heterogeneous effects of TFI on firms’ productivity and innovation activities by ownership structure. SOE was a dummy if the firm was state-owned. Across the board, we controlled for firms’ controls, firms’ fixed effects, industry-by-year fixed effects, and province-by-year fixed effects. In regression, we interacted SOE with the TFI indicator, as well as with all firms’ time-varying controls, to flexibly account for the common support assumption. Standard errors clustered at the prefecture level are reported in parentheses. ** p < 0.05 and *** p < 0.01.
Table 6. Heterogeneity analysis: financial development.
 (1)(2)(3)(4)(5)
Dependent VariableTFP_OPTFP_LPLn(1+Patent)Ln(1+IP)Ln(Patent_Cite)
TFI×FinLead0.010 **0.008 ***0.019 ***0.018 ***0.052 **
(0.004)(0.003)(0.006)(0.006)(0.023)
TFI0.017 **0.018 ***0.034 ***0.028 ***0.065 **
(0.007)(0.004)(0.011)(0.010)(0.036)
ControlsYYYYY
Firm FEYYYYY
Industry × Year FEYYYYY
Province × Year FEYYYYY
N32,33832,33832,33832,33832,338
Adj. R20.8690.8120.7570.7500.871
Notes: This table shows the estimated heterogeneous effects of TFI on firms’ productivity and innovation activities by financial development. FinLead was a dummy if the firm was in a city with a financial development level above the median. Across the board, we controlled for firms’ controls, firms’ fixed effects, industry-by-year fixed effects, and province-by-year fixed effects. In regression, we interacted FinLead with the TFI indicator, as well as with all firms’ time-varying controls, to flexibly account for the common support assumption. Standard errors clustered at the prefecture level are reported in parentheses. ** p < 0.05 and *** p < 0.01.
Table 7. Effects of TFI on firms’ operating performance.
 (1)(2)(3)(4)
Dependent VariableROAROELn(Sales)Share
TFI0.0072 **0.0052 ***0.0134 **0.0687 ***
(0.0034)(0.0014)(0.0068)(0.0255)
ControlsYYYY
Firm FEYYYY
Industry × Year FEYYYY
Province × Year FEYYYY
N32,33832,33832,33832,338
Adj. R20.2840.4140.8790.833
Notes: This table shows the estimated effects of TFI on firms’ operating performance. We considered four indicators, including ROA, ROE, Sales (logged), and the firm’s sale share in its respective industry (%). Across the board, we controlled for firms’ controls, firms’ fixed effects, industry-by-year fixed effects, and province-by-year fixed effects. Standard errors clustered at the prefecture level are reported in parentheses. ** p < 0.05 and *** p < 0.01.
Table 8. Mechanism: liquidity conditions.
 (1)(2)(3)(4)
 Credit ConstraintsFinancial Costs
Dependent VariableFC IndexWW IndexInterest/LiabilitiesExpenses/Sales
TFI−0.014 ***−0.003 ***−0.091 **−0.014 ***
(0.004)(0.001)(0.044)(0.005)
N31,94128,23625,91029,362
Adj. R20.8660.8710.6380.684
 (5)(6)(7)(8)
 Financial RisksExternal Subsidies
Dependent VariableDD-MertonDD-BhshGov./AssetsGov./Sales
TFI0.022 **0.020 **0.034 **0.0016 ***
(0.010)(0.010)(0.015)(0.0004)
N31,99031,92629,69429,724
Adj. R20.6010.5500.4590.495
ControlsYYYY
Firm FEYYYY
Industry × Year FEYYYY
Province × Year FEYYYY
Notes: This table shows the estimated effects of TFI on firms’ liquidity conditions. We considered four indicators, including credit constraints, financial costs, financial risks, and external subsidies, with each indicator taking two types of measure. Across the board, we controlled for firms’ controls, firms’ fixed effects, industry-by-year fixed effects, and province-by-year fixed effects. Standard errors clustered at the prefecture level are reported in parentheses. ** p < 0.05 and *** p < 0.01.
Table 9. Mechanism: R&D investments.
 (1)(2)(3)(4)
Dependent VariableLn(R&D)R&D/Sales1(R&D Growth)Growth Rate
TFI0.117 ***0.0031 ***0.021 **0.039 ***
(0.037)(0.0007)(0.009)(0.004)
ControlsYYYY
Firm FEYYYY
Industry × Year FEYYYY
Province × Year FEYYYY
N29,32429,32429,32429,324
Adj. R20.8650.8440.2580.189
Notes: This table shows the estimated effects of TFI on firms’ R&D investments. We considered four indicators, including the absolute value of R&D investments (logged), the R&D investments-to-sales ratio, an indicator for whether the R&D investments grew, and the growth rate of the R&D investments. Across the board, we controlled for firms’ controls, firms’ fixed effects, industry-by-year fixed effects, and province-by-year fixed effects. Standard errors clustered at the prefecture level are reported in parentheses. ** p < 0.05 and *** p < 0.01.
Table 10. Mechanism: assets mix allocation.
 (1)(2)(3)(4)
Panel A: Intertemporal Loan Allocation
Dependent VariableLn (Long-Run Loan)Ln (Short-Run Loan)Long Loan RateShort Loan Rate
TFI0.120 **−0.154 ***0.060 ***−0.037 ***
(0.056)(0.033)(0.023)(0.013)
N23,93123,93123,93123,931
Adj. R20.7730.8000.4510.277
Panel B: Asset Mix Change
Dependent VariableLn(Fixed Assets/Emp.)Ln(Intangible Assets/Emp.)Fixed Asset RatioIntangible Asset Ratio
TFI−0.048 **0.070 **0.00450.0071 **
(0.025)(0.033)(0.0080)(0.0029)
N32,33829,36532,33829,365
Adj. R20.7870.7790.7880.579
ControlsYYYY
Firm FEYYYY
Industry × Year FEYYYY
Province × Year FEYYYY
Notes: This table shows the estimated effects of TFI on firms’ assets mix allocations. Panel A explores TFI-induced loan cross-period allocation, while Panel B explores asset structure allocation. Across the board, we controlled for firms’ controls, firms’ fixed effects, industry-by-year fixed effects, and province-by-year fixed effects. Standard errors clustered at the prefecture level are reported in parentheses. ** p < 0.05 and *** p < 0.01.
Disclaimer/Publisher’s Note: The statements, opinions and data contained in all publications are solely those of the individual author(s) and contributor(s) and not of MDPI and/or the editor(s). MDPI and/or the editor(s) disclaim responsibility for any injury to people or property resulting from any ideas, methods, instructions or products referred to in the content.

