Article

A Study on Carbon-Reduction Strategies for Rural Residential Buildings Based on Economic Benefits in the Gannan Tibetan Area, China

Architecture and Urban Planning College, Lanzhou Jiaotong University, Lanzhou 730070, China
*
Author to whom correspondence should be addressed.
Sustainability 2025, 17(1), 131; https://doi.org/10.3390/su17010131
Submission received: 13 November 2024 / Revised: 4 December 2024 / Accepted: 24 December 2024 / Published: 27 December 2024

Abstract

:
The building sector contributes approximately half of all carbon emissions. The heating stage accounts for the largest proportion of building carbon emissions. The focus on carbon-reduction strategies in rural areas could not be copied from urban buildings due to different heating modes limited by economic factors. The Gannan region in Gansu province was selected to carry out an on-site survey on heating conditions, including the heating modes, the energy used for heating, heating fees, residents’ satisfaction with heating, and the thermal environment of the typical building. The results showed that local rural residents burnt scattered coal for heating using primitive heating stoves with low efficiency, causing low air temperatures and high heating fees. The carbon emissions generated by heating reached 5743.28 kgCO2e·m−2. Several strategies for reducing carbon emissions were proposed, considering the economic benefits limited by rural economic development. A parameter of reduced carbon emissions per investment input was proposed to evaluate the carbon-reduction strategies. The results showed that biomass was the most economical way to reduce carbon emissions. Reduced carbon emissions per investment input reached 44.19 kgCO2e·CNY−1 with energy efficiency of 50%, followed by thermal insulation design of 32.31 kgCO2e·CNY−1, natural gas furnaces of 26.08 kgCO2e·CNY−1, and air-source heat pumps of 20.27 kgCO2e·CNY−1. In addition, carbon emissions generated by biomass were 12.4% and 24% of those caused by coal and natural gas supplying the same energy. Moreover, building insulation should be increased according to economic benefits. The optimum energy efficiency was 55% in Gannan. The results provided a reference for building low-carbon heating in rural areas, which could help achieve the low-carbon goal with low investments.

1. Introduction

In this century, energy and environmental issues have become increasingly prominent, global carbon emissions have been increasing, and more and more countries have proposed carbon-neutral targets [1]. In 2020, the Chinese government promised to strive to achieve the goal of the “double control” of the emission intensity and total amount of carbon emissions, aiming for peak carbon emissions by 2030 and carbon neutrality by 2060 [2]. As one of the three “major energy consumers” (industry, transport, and buildings), the building sector contributes approximately half of the total carbon emissions [3]. Rural buildings were built on the basis of experiences, lacking scientific architectural design guidance, resulting in poor thermal performances and higher energy consumption than urban buildings, especially in northern rural regions [4]. Spatial heating in rural areas heavily relied on fossil fuels, causing heavy air pollution and carbon emissions [2]. Reference [5] concluded that rural areas in northern China consumed 200 million tons of standard coal, mostly from scattered coal. However, due to the different lifestyles of residents and heating modes in rural and urban areas, the focus on carbon-reduction strategies in rural areas could not be copied from urban buildings. Studying the carbon emissions of rural buildings was an important way to explore low-carbon development to achieve carbon neutrality in our country [6].
It was urgent to conduct on-site surveys and optimize building carbon emissions in rural areas. From a provincial perspective, household carbon emissions in Gansu province were relatively high [7]. Therefore, A village in Zhuoni County of the Gannan Tibetan Autonomous Prefecture of Gansu Province was selected to conduct a survey on heating situations. The annual average temperature in Zhnoni County was 3.6 °C, and the lowest temperature was −19.2 °C. Meanwhile, the heating periods lasted up to 5 months, resulting in high heating consumption and carbon emissions. In addition, one hundred and ten thousand people resided in Zhuoni County, with 63.11% population living in agriculture. The per capita regional GDP of Zhuoni County was only half of that of Lanzhou, the provincial capital of Gansu province. So, economic factors must be considered when reducing building carbon emissions (BCEs) in rural areas.
Therefore, this paper focused on improving heating effects and reducing carbon emissions while considering the economic benefits. A parameter of reduced carbon emissions per investment input was put forward to evaluate the carbon-reduction effects to propose appropriate carbon-reduction strategies (CRSs). The research framework is shown in Figure 1. The study optimized the heating energies to reduce carbon emissions and protect our environment in many ways by preventing global warming and maintaining the balance of the ecological environment, which will be conducive to the sustainable development of society.

2. Literature Review

Although the average carbon emissions of urban households were higher than those of rural households [7,8], reducing the carbon emissions of rural buildings and clarifying the influencing factors were important [6]. Scholars have sought various carbon-reduction strategies. According to the literature [9], the life-cycle assessment was divided into three stages: building material production and transportation, building construction and demolition, and the operational stage, including HVAC, domestic hot water, lighting and elevators, and renewable energy. Xu [10] found that carbon emissions generated by building production, transportation, and building operational stages accounted for 99.5% of those caused during the building life cycle. The material production stage accounted for about 98% of the building materialization stage and carbon emissions by building heating occupied 80–90% of those caused by the use stage. Therefore, this paper will review carbon emissions generated by material production and building heating.
First, local ecological building materials, such as bamboo [11] and straw bale [10], have been employed in rural residential buildings to reduce carbon emissions. Both these materials reduced carbon emissions due to their carbon sequestration properties. Li [12] concluded that low-carbon straw bale buildings with wood and light-steel structures reduced net carbon emissions by 96.75% and 76.92% compared with reference buildings.
Second, carbon emissions were mainly influenced by heating [7]. The state proposed coal-to-electricity and coal-to-gas projects in 2017, first applied in the Beijing-Tianjin-Hebei region [2]. It was concluded that villagers highly recognized the convenience and safety of electric heating [13]. As the most popular electric heating equipment, air-source heat pumps (ASHPs) were popular in northern China due to their low installation requirements, simple operation, and reliability [2], which were suitable for rural areas [14]. Moreover, they could be applied in severely cold areas with frost-free technologies for outdoor air–heat exchangers [15]. Wu [16] verified that ASHPs could provide enough heating protection in Xinjiang. Meanwhile, some scholars [17,18,19] found that the costs of current electric heating technologies were relatively high due to poor economic benefits and insufficient government investment. A “coal-to-gas” heating scheme was considered more suitable for severely cold northeast China [20]; however, in the literature [21], it was concluded that the initial investment of natural gas was about CNY 30,000 for each house without government investment, which was unaffordable for most residents. About CNY 10,000 was paid for each house with government funding. So, for natural gas, government subsidies were crucial. Solid biofuels were the most common heating sources, especially in rural areas, for their low cost, high efficiency, and low emissions [22]. Household biomass heating stoves were commonly used for heating in remote rural areas because of their excellent fuel flexibility and high combustion efficiency [23], priced at CNY 2000–5000 to heat a 60–120 m2 space [2]. For biomass, subject to geographical restrictions, it was only available in biomass-rich areas. Most people residing in Zhuoni County lived on agriculture with large areas available for crops. Wheat and highland barley were the main food crops. Both could be used as biomass sources.
In addition, renewable energy, such as solar energy, could effectively reduce carbon emissions from building heating. It was commonly used in building heating designs. The combined use of active and passive utilization of a solar air collector and an attached sunspace provided more environmental benefits [24], and solar photovoltaics combined with heat pumps could reduce carbon emissions by up to 50% [25].
To summarize, carbon-reduction strategies such as ecological materials, ASHPs, biomass heating stoves, and solar heating could effectively reduce BCEs. Moreover, the economic aspects of CRSs need to be further studied. Gao [4] chose the optimum CRSs of envelope parameters and PV systems considering carbon emissions and cost-effectiveness. Tahsildoost [26] in Iran proposed optimal constructional parameters and the application of renewable energy technologies with a low cost to reduce BCEs in rural areas. He [21] concluded that the installation and operational costs of ASHPs were moderate and suitable for use in rural areas. In this paper, CRSs for envelope structures and heating optimization were evaluated while considering the economic benefits.

3. Research Method

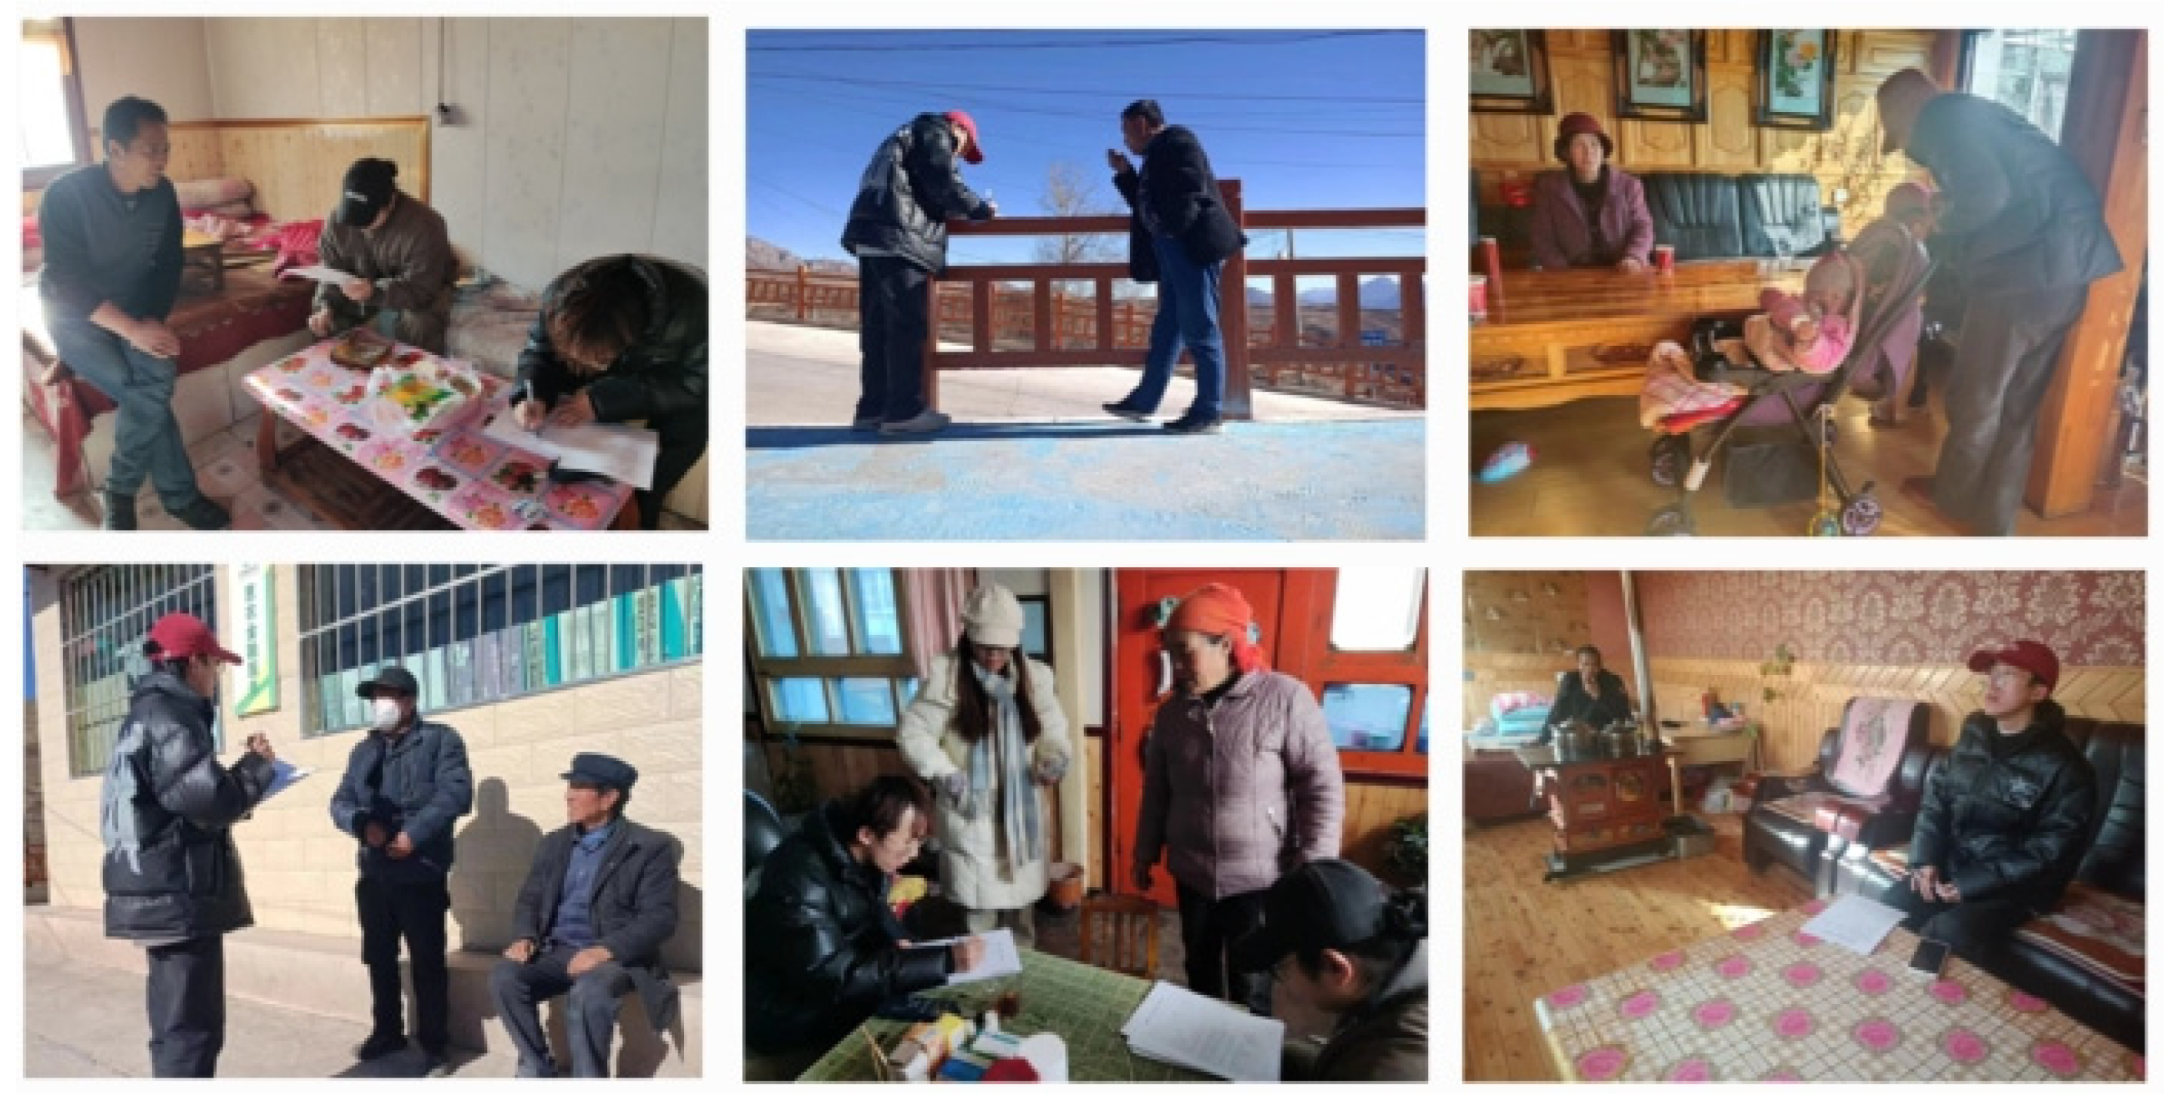
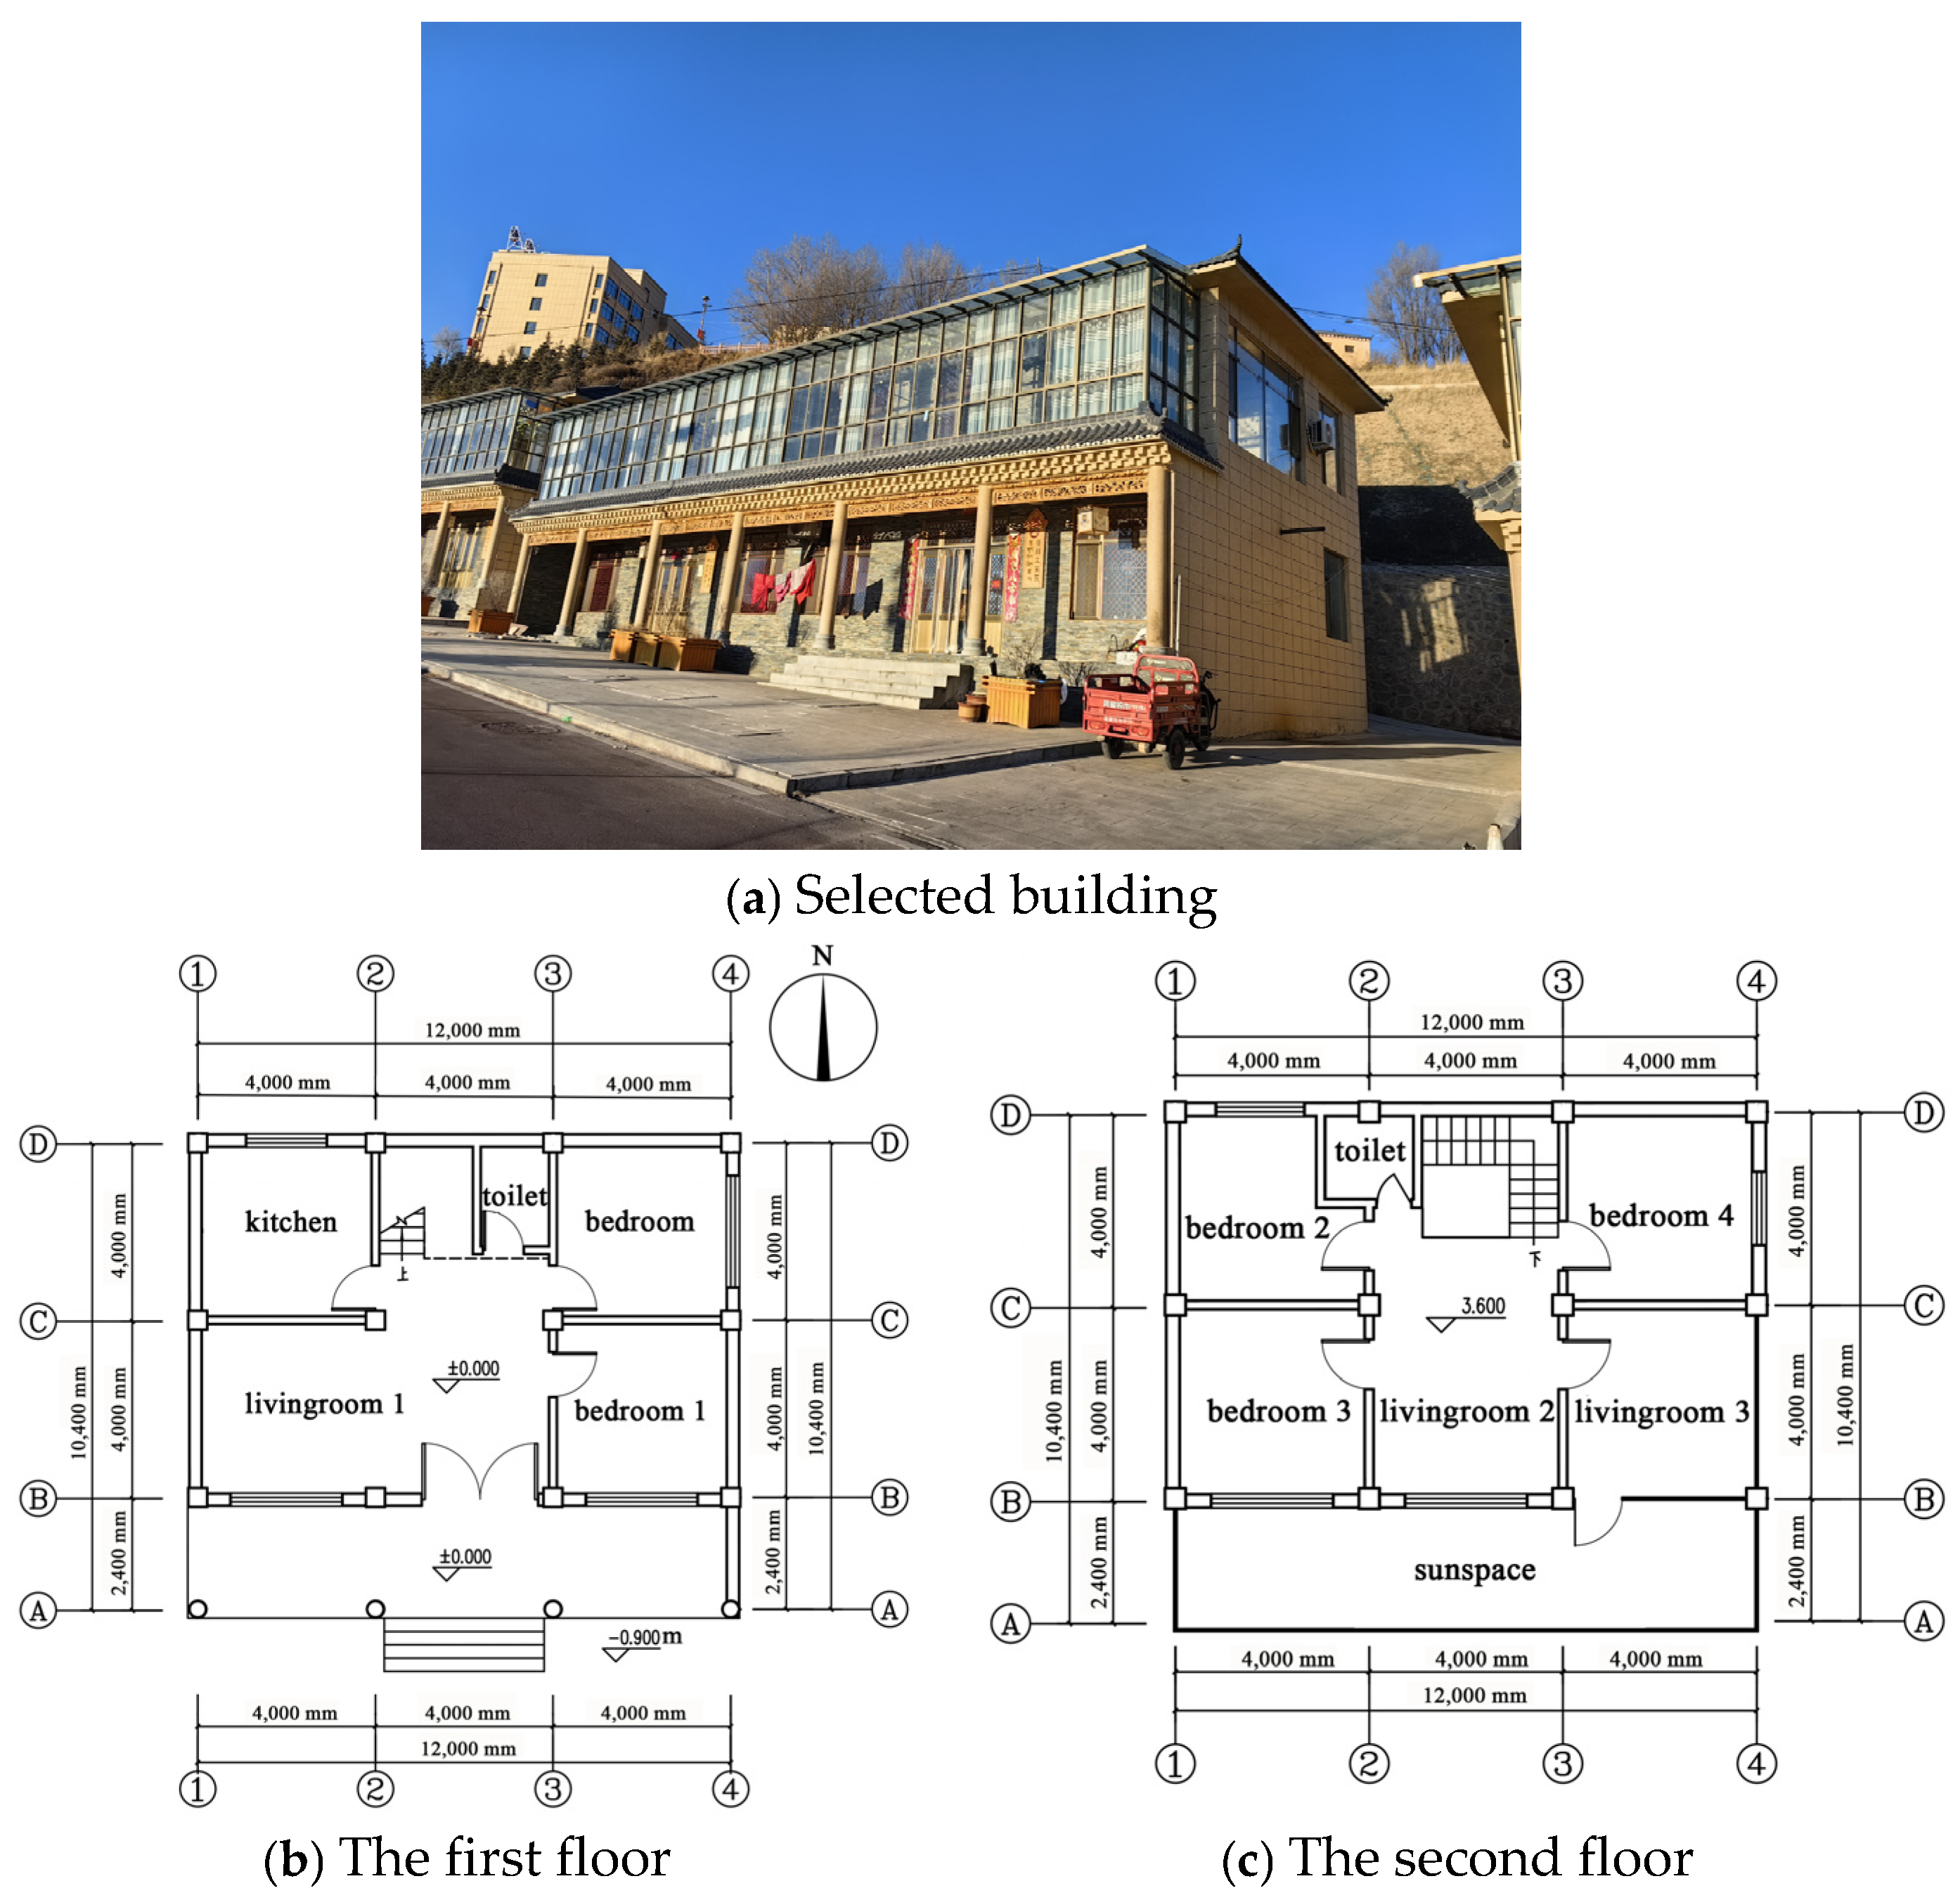
3.1. Field Investigation

A village in Zhuoni County was selected for field research. The annual average temperature in Zhuoni was 3.6 °C, with a high altitude ranging from 2000 to 4900 m above sea level, resulting in a severely cold winter with an average temperature of −8.2 °C in January and a severely cold area of building thermal design zone. Hourly temperature in Zhuoni County is shown in Figure 2 [27]. An on-site survey was conducted to investigate heating modes, the energy used for heating, heating fees, residents’ satisfaction with heating, and the factors considered in heating optimization. Photographs taken during the on-site survey are shown in Figure 3.

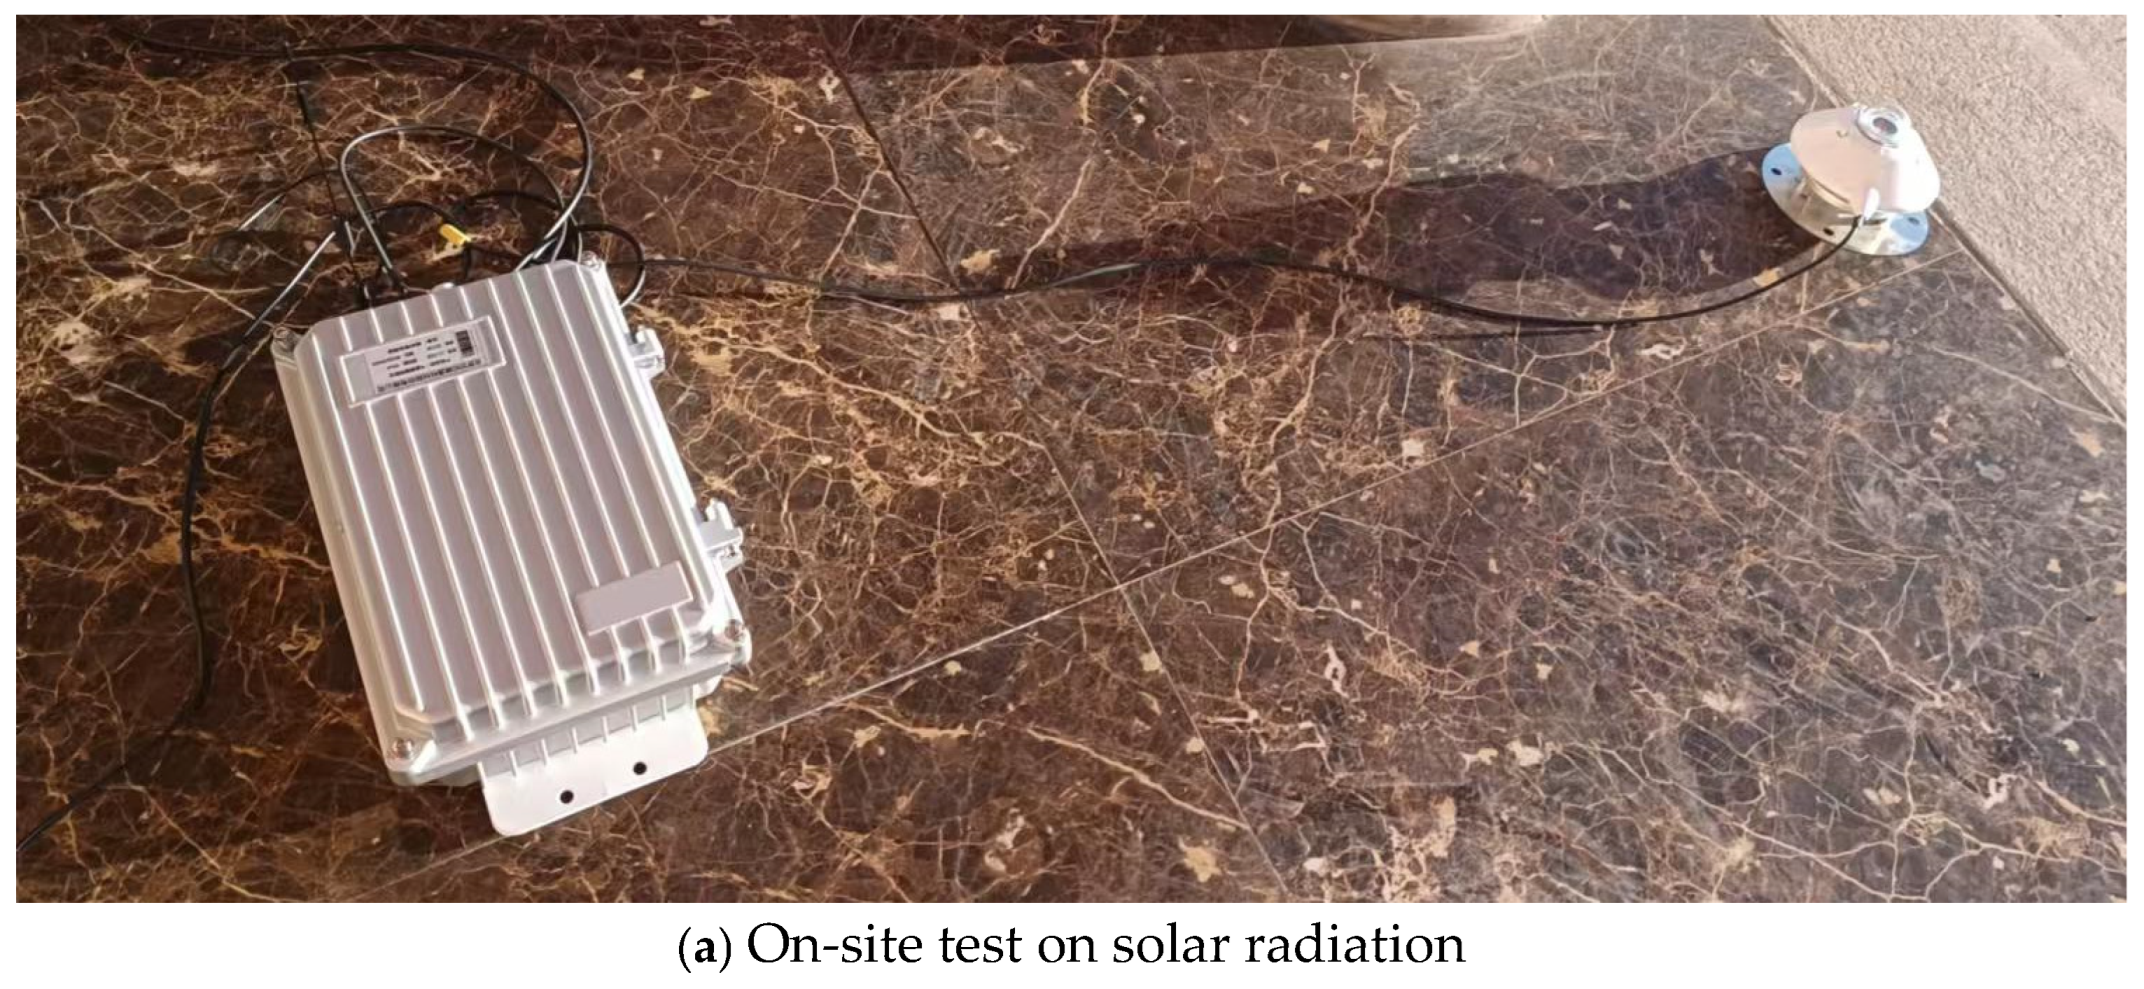
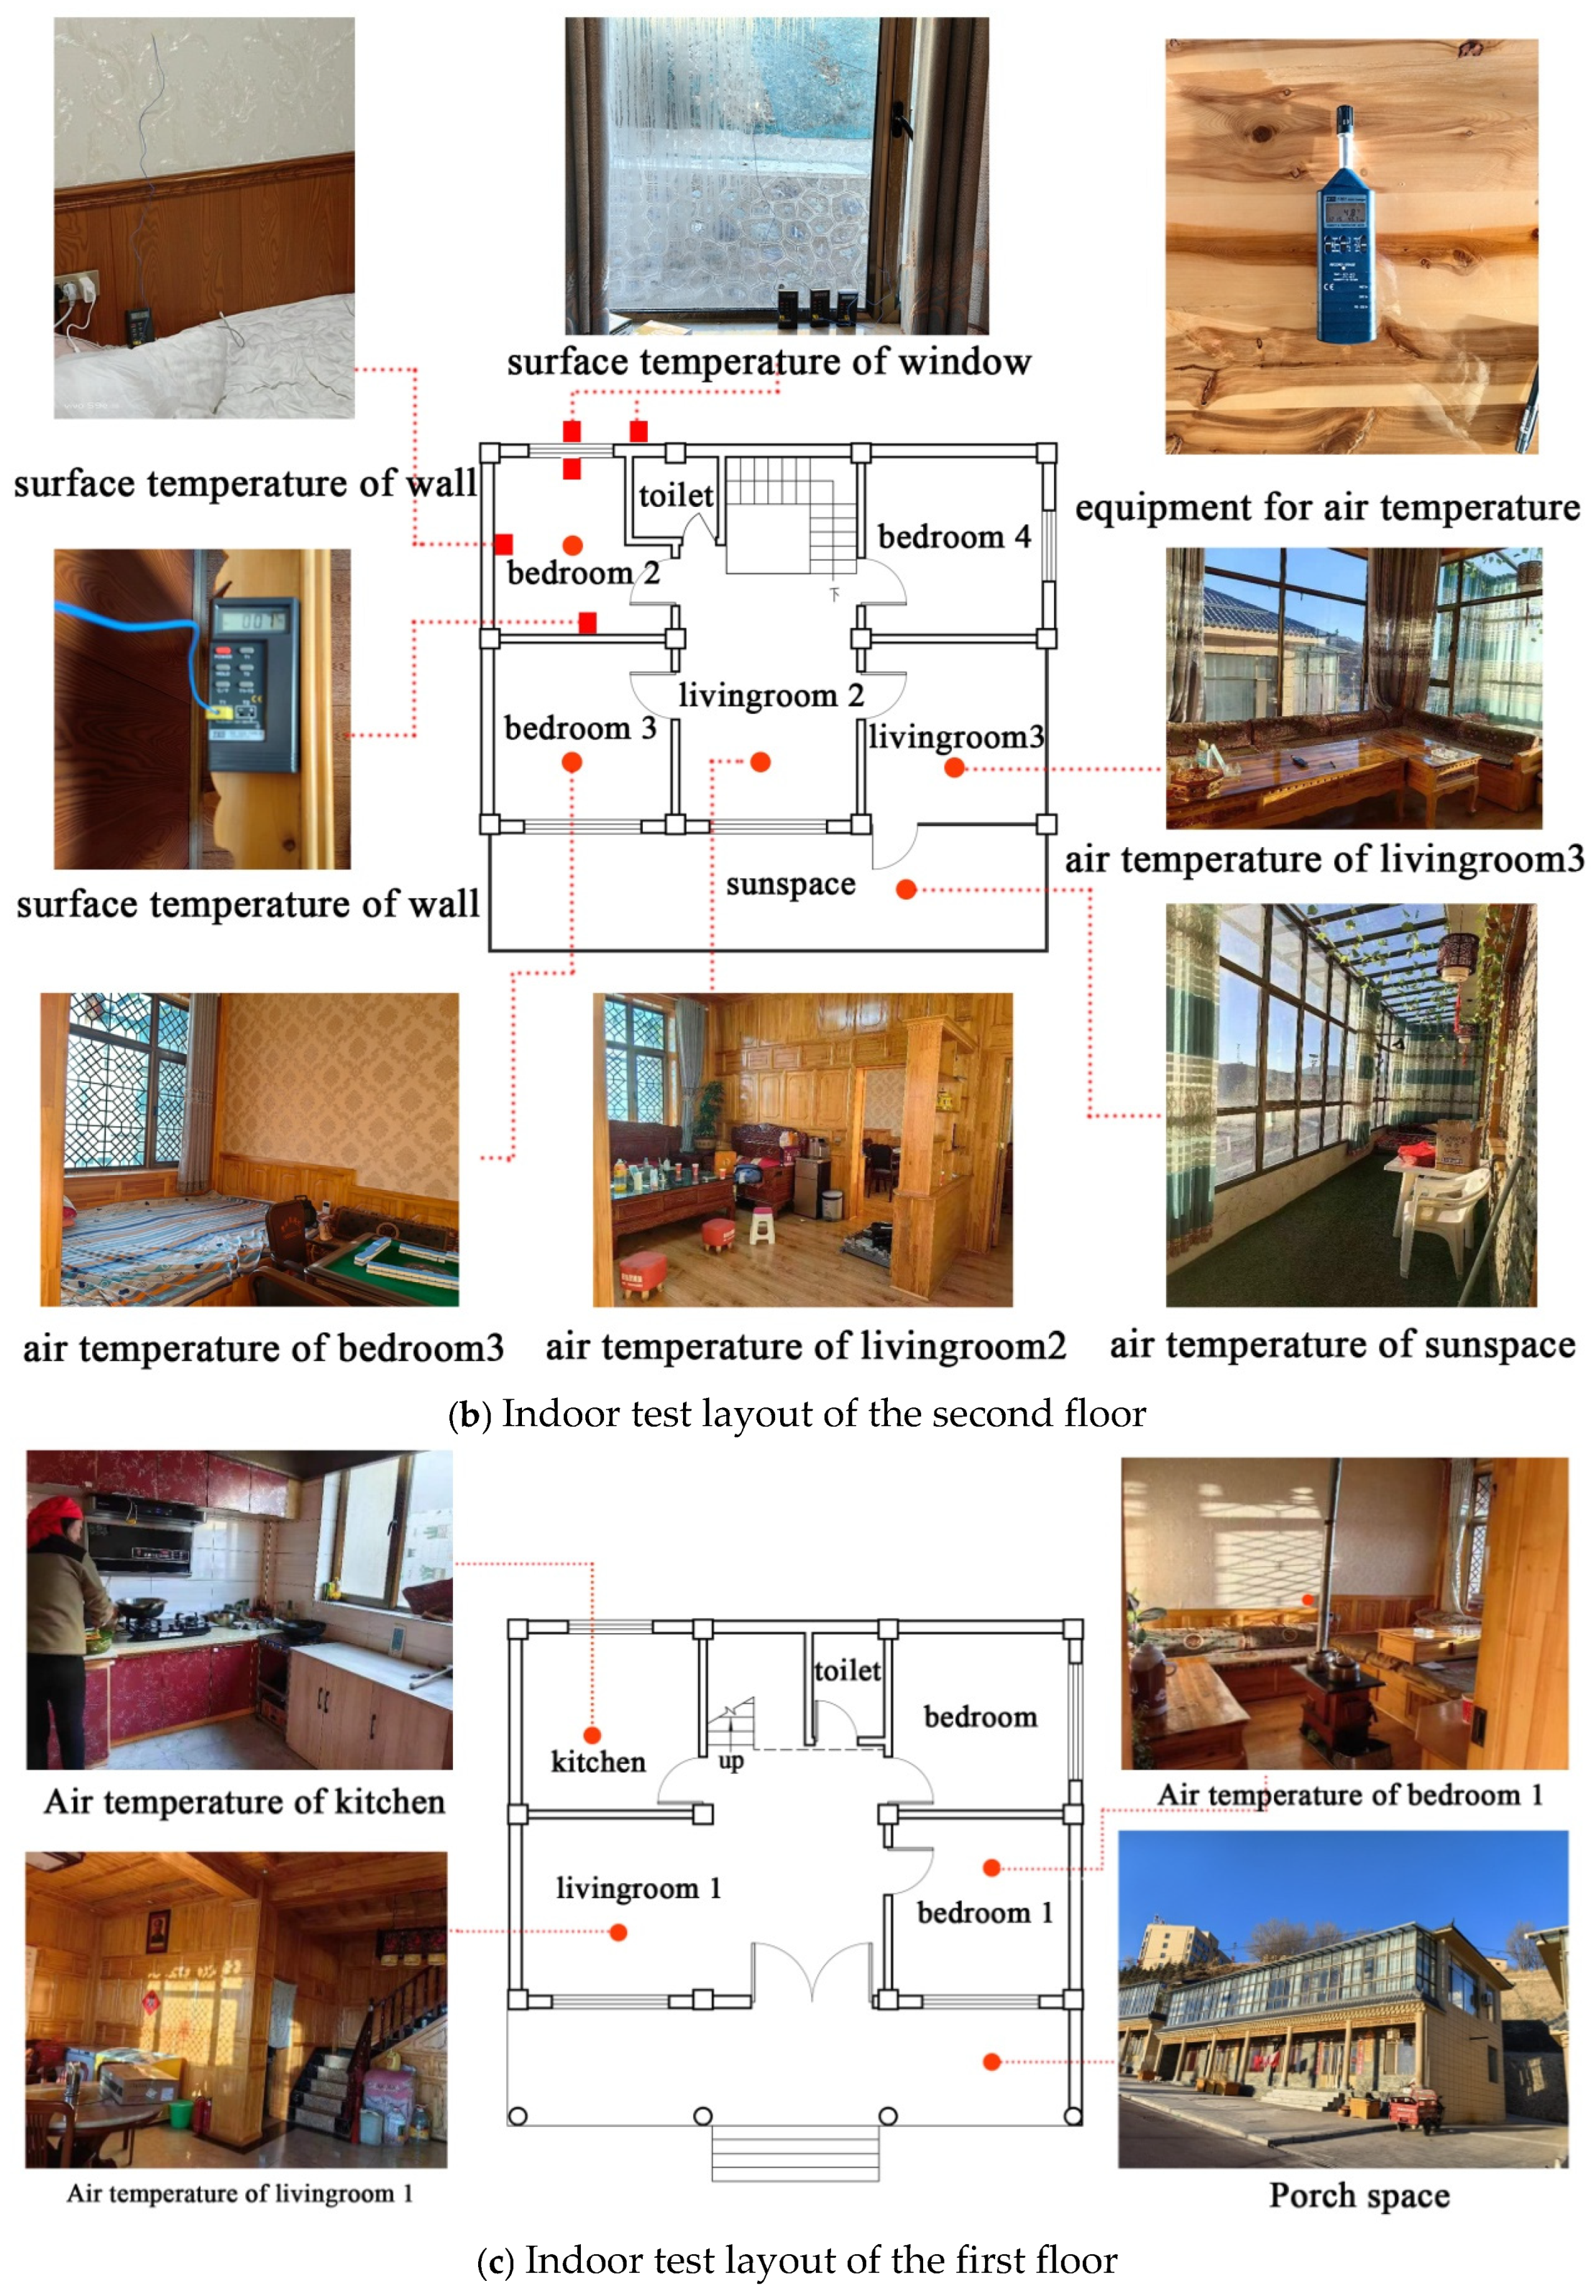
3.2. Thermal Environment Test

A typical building was selected for field testing on the thermal environment on the 6–8 of January to verify the building heating effects, including the indoor and outdoor air temperature and outdoor solar radiation. The selected typical building is shown in Figure 4. During the survey it was found that there existed three types of houses. One was an earth building constructed with raw earth before the 1960s, where only a small proportion of people lived. Another was the brick building built based on the old earth house. The building was composed of two envelope structures, and the internal space was relatively complex. The third was the new building constructed after 2000. The building was a reinforced concrete frame structure filled with brick walls, whose structure was the most typical one without insulation. The building’s internal spaces were relatively complete, and the building was the development trend of rural architecture. So, the third building was selected to conduct further study. The total covered area of the building with two stories was 192 m2. Figure 4 depicts the design drawings with a frame structure fabricated with block components. Structure details, including the thermal conductivity of various materials and K-values of building envelopes, are shown in Table 1. K-values were calculated as follows [28].
K = 1 R i + d i λ i + R ag + R e
where K represents heat transfer coefficients of envelopes, W·m−2·K−1; Ri denotes thermal resistances of inner surfaces of envelopes, m2·K·W −1; Re denotes thermal resistances of outer surfaces of envelopes, m2·K·W−1; di represent thicknesses of envelop components, m; λi denote thermal conductivities of envelop components, W·m−1·K−1; Rag denote thermal resistances of air layer, m2·K·W−1.
The thermal environment test sensors are shown in Figure 5. Solar radiation, indoor and outdoor air temperature, and surface temperatures were recorded. The specifications and accuracies of used sensors are shown in Table 2.

3.3. Numerical Calculation of Building Carbon Emissions

According to the literature [9], the life-cycle assessment was divided into three stages: building material production and transportation, building construction and demolition, and the operational stage, including HVAC, domestic hot water, lighting and elevators, and renewable energy. The carbon emission calculation processes of three stages were calculated as follows [9].

3.3.1. Building Material Production and Transportation

(1)
Building material production
The carbon emissions from building material production, CEmaterial, were calculated as follows:
C E material = ( 1 + α i ) × m i × E F i
where mi is the material amount i used in the building (unit); EFi represents the carbon emission factor of material i (kgCO2e·unit−1). The carbon emission factors of the various materials were obtained from [9,10,29]. αi denotes the building material loss rate during construction.
(2)
Building material transportation
The carbon emissions during the transportation process CEtrans were calculated as follows:
C E trans = i = 1 n L i , j × m i × E F trans , j
where Li,j represents the transportation distance of material i transported via vehicle j (km); EFtrans,j denotes the carbon emission factor of vehicle j (kgCO2e·t−1·km−1); and mi is the quality of the materials transported (t). All building materials were assumed to be transported via road, and the carbon emission factor of trucks was valued at 0.115 kgCO2e·t−1·km−1 [9].

3.3.2. Construction and Demolition

(1)
Building construction
The carbon emissions during construction, CEconstruction, were calculated as follows:
C E construction = E F i × E construction , i
where EFi represents the carbon emission factor of energy i (kgCO2e·MJ−1); Econstruction,i denotes the energy consumption of energy i during construction (MJ). Since few mechanical equipment details were recorded in rural areas, the carbon emissions during construction calculated were multiplied by the carbon emissions per unit area [10] and the building areas.
(2)
Building demolition
The carbon emissions during demolition included those generated during demolition and waste transportation. The carbon emissions during the demolition stage, CEdemolition, could be estimated as follows:
C E demolition = C E construction × 90 %
The carbon emissions generated during waste transportation refer to those generated during the transportation process. The calculation method and results were the same as those in the transportation stage of the building materials.

3.3.3. Building Operation Stage

The building operation stage included the following parts: building heating and cooling, domestic hot water, building lighting and elevators, and renewable energy utilization. In Gannan, there was no demand for cooling in summer, and in addition, the rural residential buildings had no elevators. Therefore, the carbon emissions during the operational stage required calculating the building heating, domestic hot water, and building lighting.
(1)
Heating
The carbon emissions generated by heating could be calculated as follows:
C E heating = Q × E F i × 50
where CEheating represents the carbon emissions of building heating (kgCO2e); Q represents the energy consumed for heating (J); EFi denotes the carbon emission factor of heating energy i (kgCO2e·J−1); and 50 represents the building life service limit of 50 years.
Two methods—steady-state calculation and dynamic simulation—are used to calculate the energy consumption for heating. In this paper, the steady-state calculation method was adopted. On the one hand, the steady-state method was easy for architects to understand; on the other hand, the research [30] showed that the difference between the steady-state calculation and dynamic simulation is within rationality in Gansu province. The energy consumed for heating Q was calculated as follows:
Q = 24 × 3600 × Z × q H × A 0 / η
Here, Q represents the energy consumed for heating (J); qH denotes the building heat consumption index (W·m−2), calculated according to the literature [31]; Z is the heating period of 192 days [31]; η represents the heating equipment efficiency, recommended as 0.75 in the literature [10]; and A0 represents the building area of 192 m2.
q H = q HT + q INF q IH
where qH presents building heat consumption index, W·m−2; qHT represents heat loss through envelopes per unit, W·m−2; qINF presents heat loss of cold air permeation, W·m−2; qIH presents indoor heat gain, it was recommended 3.8 m−2 in the literature [31]. qHT and qINF should be calculated according to [31].
(2)
Domestic hot water
The carbon emissions generated by domestic hot water were calculated as follows:
C E hotwater = Q r η r × η w × E F × 50
Q r = 4.187 m q r t r t l ρ r 1000 × T
where CEhotwater represents the carbon emissions generated by hot water (kgCO2e); Qr represents the annual consumption of hot water (kWh·a−1); ηr represents the domestic hot water transmission and distribution efficiency (%); ηw represents the average annual heat source efficiency of a domestic hot water system (%); EF represents the carbon emission factor of the energy used to produce hot water (kgCO2e·kWh−1); m represents the number of residents (five persons living in the studied building); qr represents the hot water quota (20 L·person−1·d−1, according to the national standard GB50555 [32]); tr represents the design hot water temperature of 55 °C; tl represents the design cold water temperature of 5 °C; ρr represents the hot water density (kg·L−1); T represents the annual usage hours (h); and 50 represents the building life service limit of 50 years.
(3)
Building lighting
The carbon emissions generated by lighting were calculated as follows:
C E light = j = 1 365 i P i , j A i t ij 1000 × E i × E F i × 50
where CElight represents the annual energy consumption of a lighting system (kWh·a−1); Pi,j denotes the lighting density of room i on day j (W·m−2) recommended in the literature [9], as shown in Table 3; Ai is the lighting area of room i (m2); ti,j represents the lighting time of room i on day j (h); EFi denotes the carbon emission factor of the lighting energy (kgCO2e); and 50 represents the building life service limit of 50 years.

4. Results

4.1. On-Site Surveys

4.1.1. Heating Conditions

An investigation on the heating situations of 45 households was conducted on the 6–8 of January. The results are shown in Figure 6 and Figure 7.
(1)
Heating mode
The results showed that 84.4% of households adopted heating stoves and Chinese kang for heating, and 11.11% of residents used heating stoves and electric blankets. In total, 82.22% of the energy used for heating was scattered coal, and the rest was coal and straw.
(2)
Heating fees
The average heating cost was CNY 2934, and 42.22% of residents spent CNY 2500–3000 on heating. The other 17.78% spent CNY 1500–2000. A key barrier to rural heating optimization was the high cost, which was unaffordable for most households. Therefore, investment input must be considered when reducing carbon emissions in rural areas.
(3)
Heating temperature and factors influencing heating optimization
The indoor temperature of 53.3% of the surveyed rooms was below 10 °C, which was lower than the minimum comfortable temperature of 14 °C recommended in the standard [33,34]. In total, 84.4% of households considered that the temperature was too low in winter, and all considered heating costs were too high. Therefore, 82.2% of residents were willing to change their heating mode, and 98% of people would consider economic benefits when changing their heating mode.

4.1.2. Thermal Environment

A typical building shown in Figure 4 was selected to test the outdoor solar radiation, air temperature, and indoor temperature to determine the outdoor climatic conditions and indoor temperature changes in 48 h. The results were depicted as follows.
(1)
Solar radiation
As is shown in Figure 6, the on-site test on solar radiation lasted from 8:00 to 16:00. It reached a maximum of 580 W·m−2 at 13:00, and the solar radiation time exceeding 120 W·m−2 reached 7 h. There were abundant solar energy resources.
(2)
Outdoor air temperature
The average and the lowest outdoor air temperatures were −3.6 °C and −12.5 °C, respectively, coupling with the high heating demand. The maximum temperature was 9 °C at 14:30.
(3)
Indoor air temperature
The master bedroom on the first floor was equipped with a stove for heating and cooking. Residents’ schedules, cooking times, and heating needs influenced the indoor air temperature. As can be seen in Figure 7, the average and the lowest temperatures for the sunspace were only 3 °C and −4 °C, respectively, due to the poor insulation performance of single glazing. The maximum temperature reached 16 °C at 13:30. The temperature was maintained above 12 °C when there was direct solar radiation from 11:00 to 14:30, which was higher than in other rooms without any heating measures. However, the temperature sharply decreased without sunshine because of the poor insulation performance of single glazing, which needed better insulation strategies.
To summarize, heating in rural areas heavily relied on fossil fuels, which caused heavy air pollution and high carbon emissions. The indoor temperature was low and distributed unevenly. The heating fees were high with traditional and inefficient heating equipment, and human thermal comfort could not be satisfied. Residents considered heating costs first when optimizing the heating mode constrained by conditions. Therefore, economic low-cost carbon-reduction strategies were required to improve the occupants’ living conditions.

4.2. Carbon-Reduction Strategies

4.2.1. Analysis of Carbon Emissions of Reference Building

(1)
Building energy consumption
The total heat loss calculated through building envelopes was 11,933.61 W, shown in Table 4. With a building area of 192 m2 and an internal heat source of 3.8 W·m−2, the building heat consumption index qH of the reference building calculated based on Equation (7) was 58.35 W·m−2, which was much higher than the specified value in the standard [33]. The heat losses of the walls and roof accounted for 46.93% and 22.79% of the entire heat losses due to the lack of thermal insulation, on which architectural thermal insulation design should focus.
(2)
Carbon emissions of the reference building
The BCEs were calculated according to Formula (2)–(11). The results are shown in Table 5. It showed that carbon emissions during the building operation stage held the largest proportion of 79.93%. The carbon emissions from heating accounted for 89.34% of the building operation stage, reaching 5743.28 kgCO2e·m−2. The carbon emissions generated by hot water ranked second to heating, reaching 552.75 kgCO2e·m−2, followed by the material production phase. The transportation, construction, and disposal phases had relatively minor impacts on the carbon emissions. Therefore, reducing the carbon emissions during the heating stage should be further optimized.

4.2.2. Carbon-Reduction Effects of Different Optimization Strategies

The heating effects were mainly affected by the building envelopes and heating conditions, including the heating energy and heating efficiency.
(1)
Building envelopes
① Investment input of thermal insulation materials
EPS was selected as the insulation material for the walls, roof, and ground, with a thermal conductivity of 0.039 W·m−1·K−1. The price was 400 CNY·m−3. Double-glazed glasses and multi-cavity plastic window frames were selected for the windows to provide a better thermal insulation performance, the price of which was affected by the windows’ heat transfer coefficient and shading coefficient [35], as was shown below:
Y = 2946.87 2208.56 U + 608.1 U 2 56.83 U 3 + 14.53 / ( 0.87 × S C )
where Y represents the costs of the windows per area (CNY·m−2); U represents the heat transfer coefficient of the windows (W·m−2·K−1); and SC represents the shading coefficient of the windows.
Energy efficiencies of 50%, 55%, 60%, 65%, and 70% with the different structures and heat transfer coefficients of the building envelopes are shown in Table 6. Energy efficiency refers to the ratio of energy consumption reduced by an energy-efficient building relative to the reference building to that of the reference building. The reference building is shown in Figure 4. The energy-efficient building was achieved by increasing the thermal insulation of envelopes.
② Result analysis
Cost analysis was a critical factor when deciding the CRSs. A parameter of reduced carbon emission per investment was proposed and calculated with Formula (13). The simple payback period helped select the appropriate retrofitting strategy; this referred to the period required to recoup the funds expended in an investment or to reach the break-even point.
R C E = ( C E r C E o ) / I o
Here, RCE represents the reduced carbon emissions per investment input (kgCO2e·CNY−1); CEr represents the carbon emissions of the reference building (kgCO2e); CE0 represents the carbon emissions of the optimized building (kgCO2e); and Io represents the initial investment of various carbon-reduction strategies relative to the reference building.
P = I o / ( F r F o )
Here, P denotes the payback period (y); Io represents the initial investment of various carbon-reduction strategies relative to the reference building; Fr represents the heating fees of the reference building; and Fo represents the heating fees of the optimized building.
Reduced carbon emissions per investment input and payback period with various energy efficiencies were obtained. The results are shown in Figure 8. It showed that the reduced carbon emissions per investment input reached a maximum value of 32.25 kgCO2e·CNY−1 with an energy efficiency of 55%. The cost input significantly increased when the energy efficiency exceeded 55%. The carbon emissions did not linearly reduce; the reduced carbon emissions per investment input gradually decreased, and the investment payback period gradually increased. Therefore, it was not economical to blindly increase the building insulation to reduce the BCEs.
(2)
Heating modes and heating efficiency optimization
① Heating optimization
Electric heating devices were already commonly available. Growing attention was being paid to heat pumps to decarbonize buildings via electrification. China has established standards for installing ASHPs at different minimum ambient temperatures [36].
As a renewable energy source, biomass could significantly reduce carbon emissions. Household biomass heating stoves were commonly used for heating in remote rural areas because of their low cost, high efficiency, and low emissions, which were priced in the range of CNY 2000–5000 and could heat spaces of up to 60–120 m2.
Natural gas-fired heating was considered a low-carbon method. The literature showed that annual carbon emissions could be reduced by 78.3% and 35.6% compared with coal-fired and ASHP heating, respectively.
Therefore, in this paper, household biomass heating stoves, ASHPs, and natural gas combustion furnaces were selected to reduce heating carbon emissions. Their costs and carbon emission factors are shown in Table 7. The prices of 1 kWh of heat generated by coal, natural gas, biomass and ASHP are shown in Figure 9.
② Result analysis
The carbon emissions and economic effects of the three optimized heating modes were analyzed. Based on an on-site investigation of the building in Zhuoni County as a reference building, an energy efficiency of 50–70% was achieved by increasing the thermal insulation of envelopes. Reference building consumption was 11,933.61 W shown in Figure 4, and building consumption was 5966.81 W with of 50%. Then, carbon emissions, annual heating fees, RCEs with different heating energies, and different energy efficiencies were calculated. The results are shown in Figure 10, Figure 11 and Figure 12, based on which the following results could be concluded.
(a)
The carbon emissions generated by biomass energy were the lowest, followed by natural gas, ASHPs, and traditional coal.
(b)
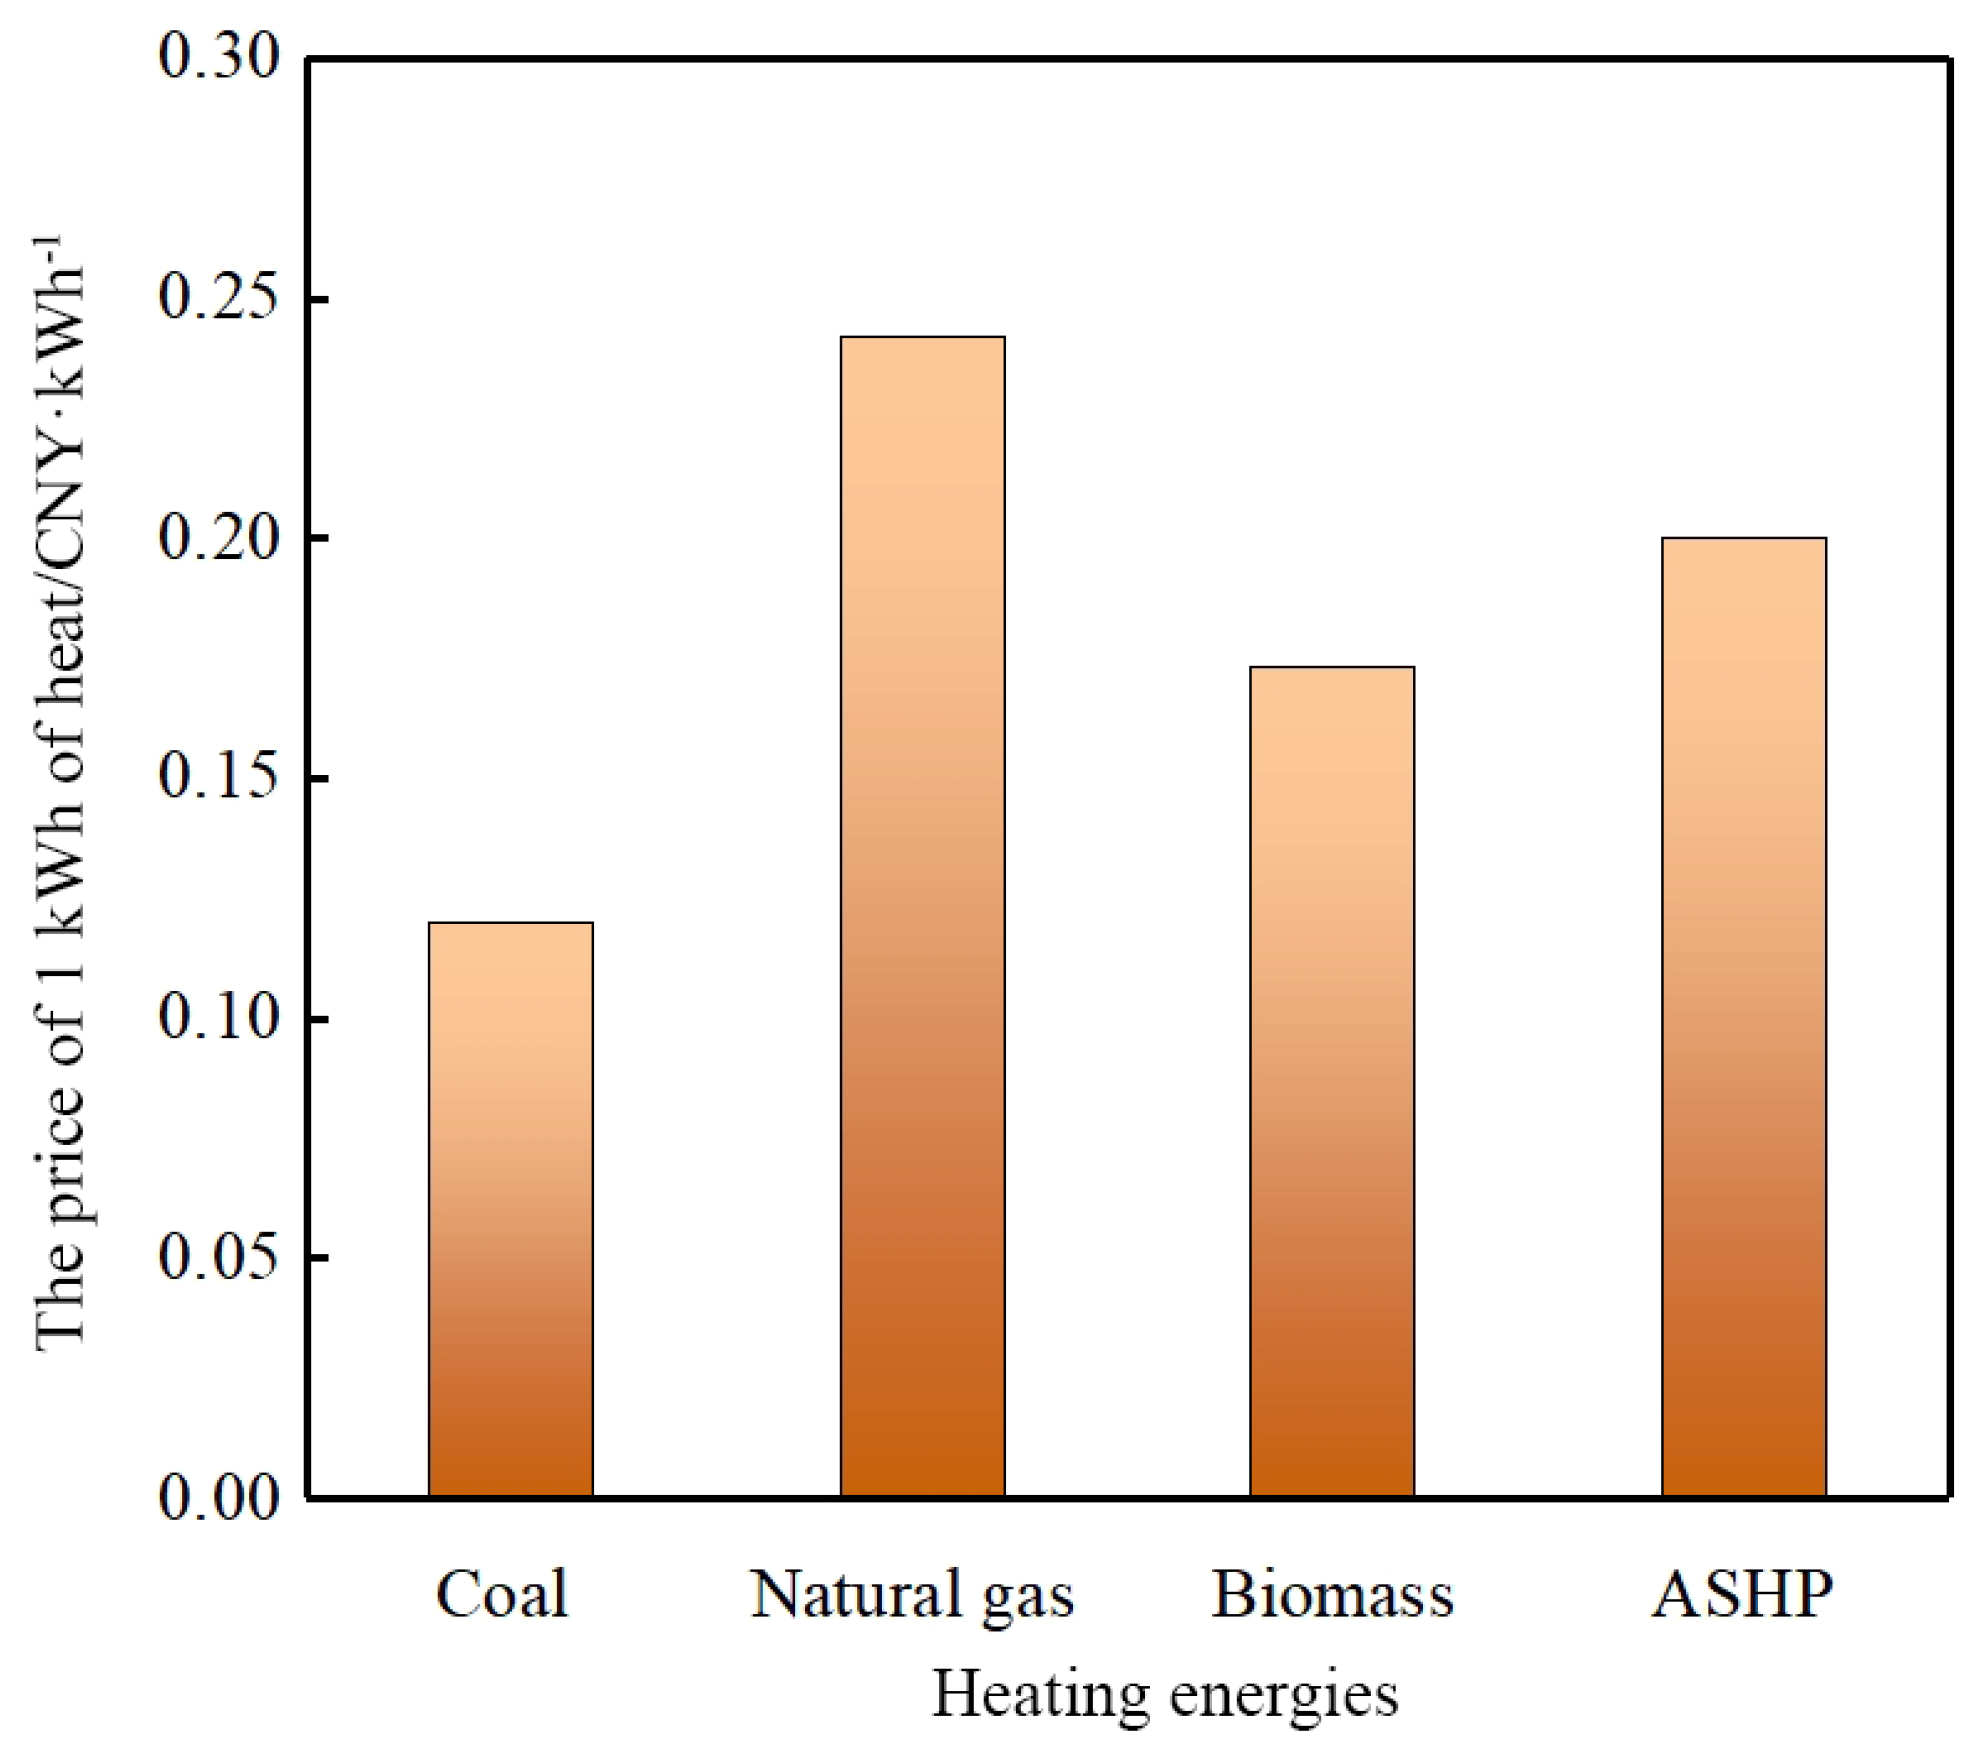
The annual heating fees of natural gas were the highest, followed by ASHPs, biomass, and coal when supplying the same heat for buildings.
(c)
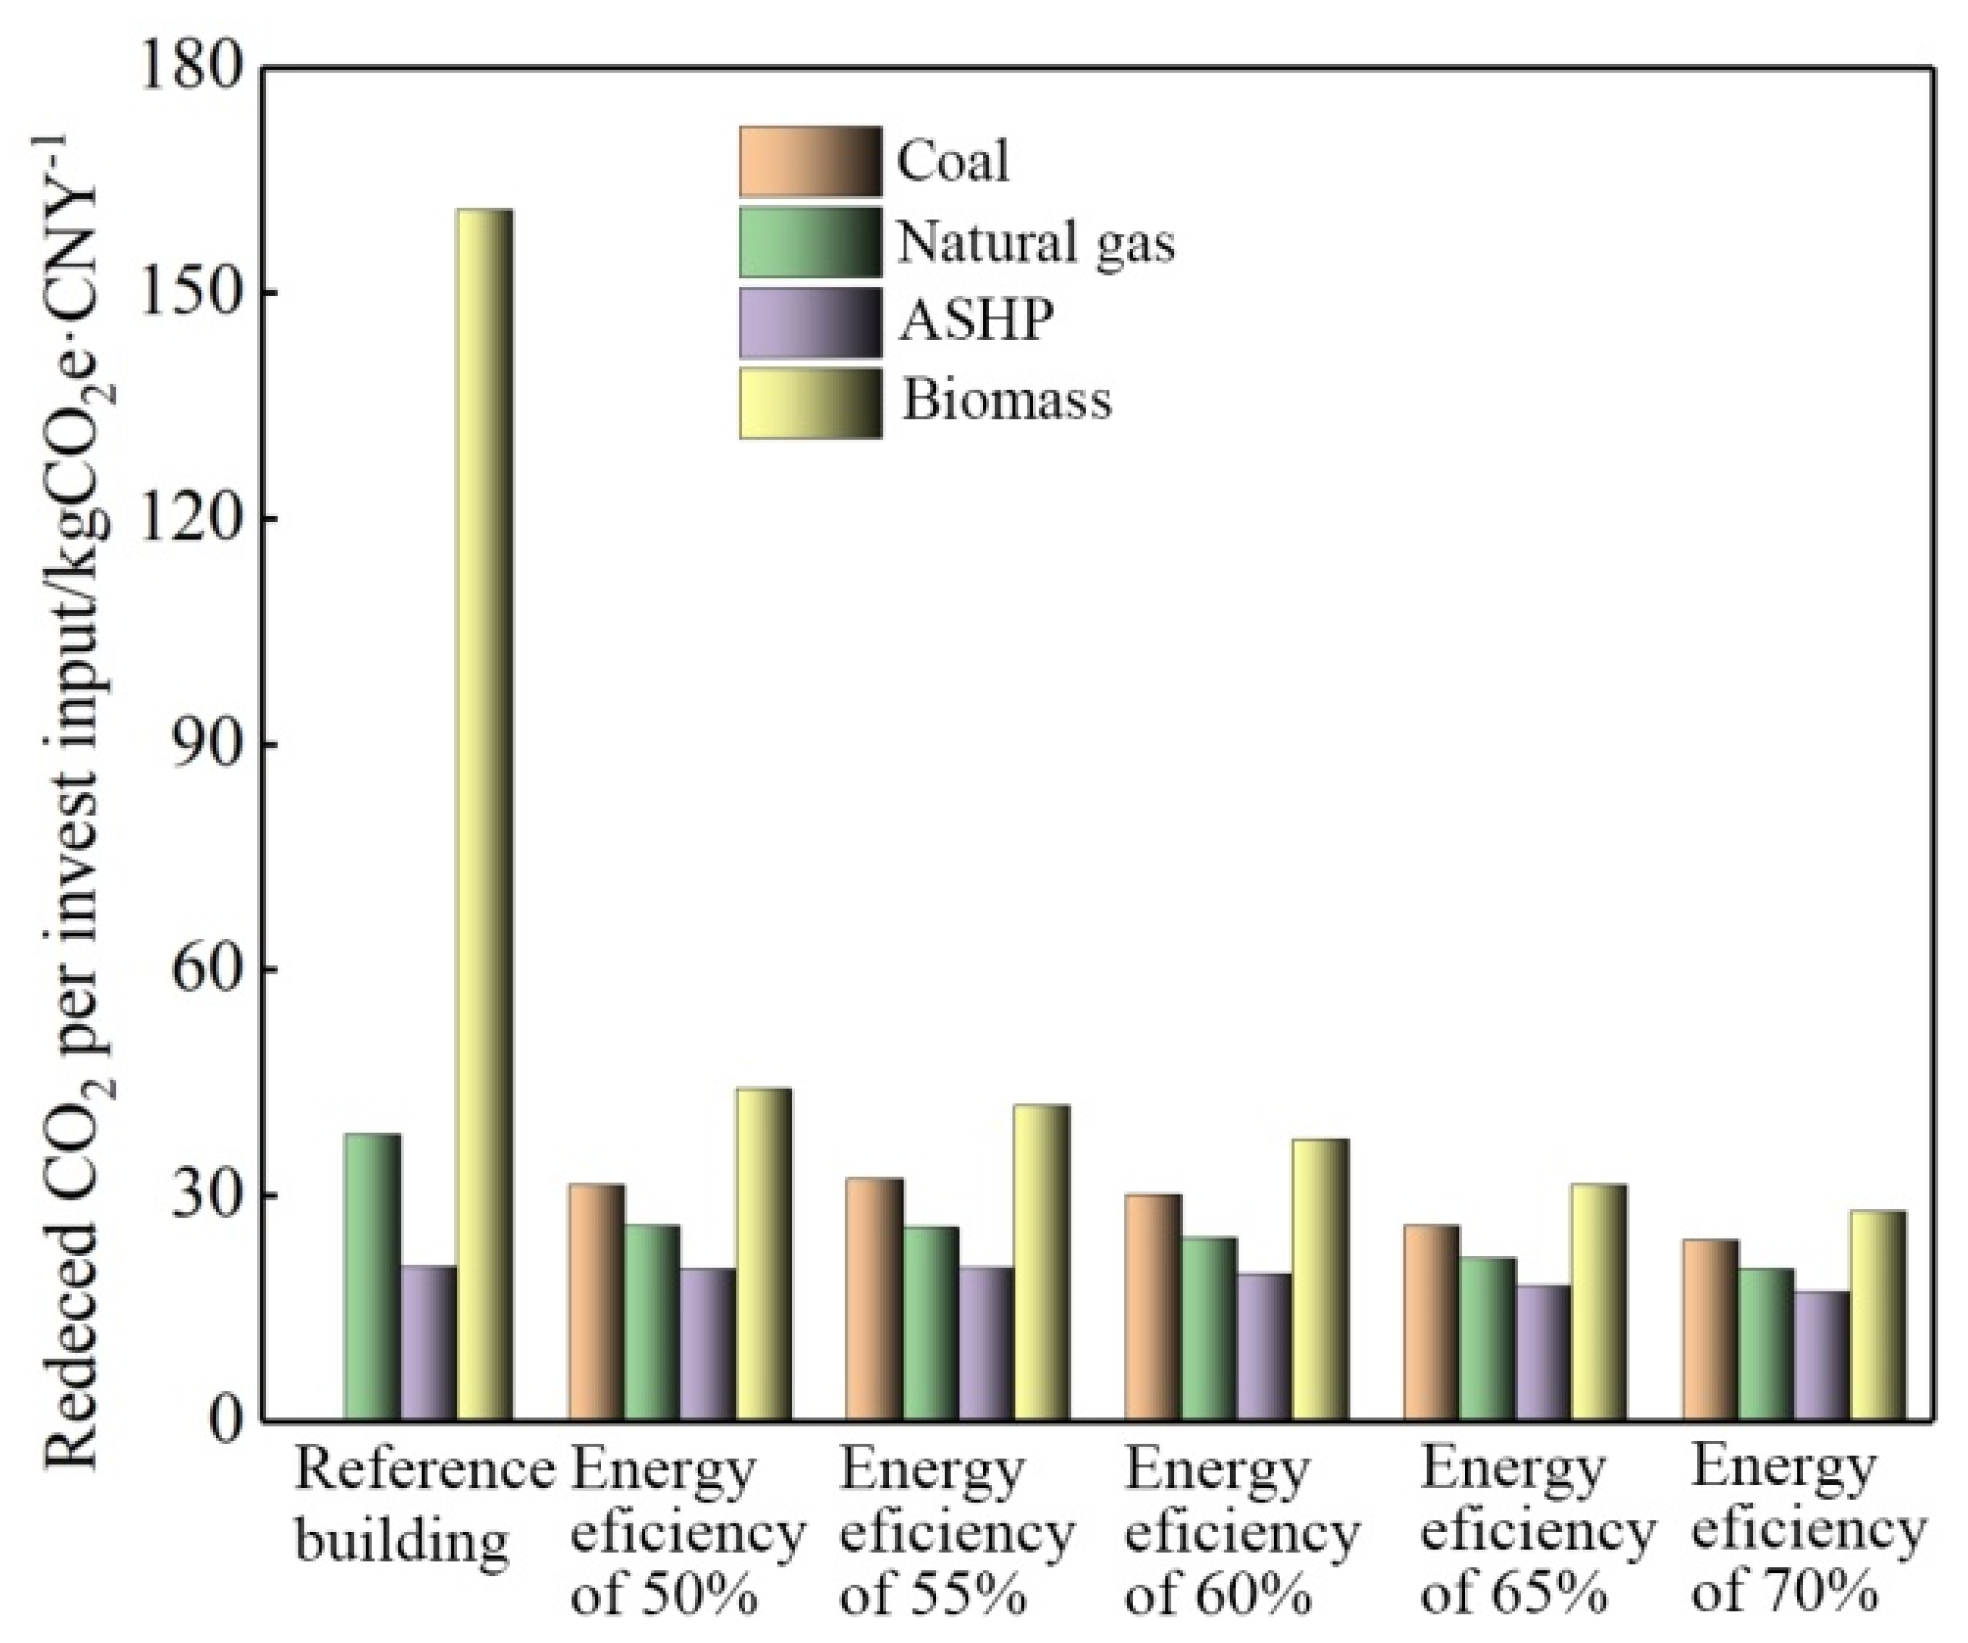
Biomass was the most economical way to reduce carbon emissions due to the low initial cost input and low carbon emission of biomass, followed by thermal insulation design, natural gas for heating, and ASHPs used for heating. The initial investment in natural gas was large with pipeline layouts.

5. Conclusions and Discussions

This study presented a life-cycle assessment of a rural residential building from the perspective of carbon–economic efficiency. According to the BCE calculations, the carbon emissions generated by heating accounted for approximately 90% of BCEs. Therefore, in this study, a heating-optimization design was conducted to study the optimum carbon-reduction strategies considering economic benefits. The following conclusions were made based on on-site surveys and the analysis of optimized heating modes:
(1)
Increasing building thermal insulation could effectively reduce carbon emissions. The optimum energy efficiency was 55% in Gannan, with 30 mm thermal insulation of walls and 50 mm thermal insulation of the roof. It was not economical to blindly increase building insulation to reduce BCEs. In addition, it was an economic way to reduce carbon emissions. RCEs of thermal insulation reached 32.31 kgCO2e·CNY−1 with an energy efficiency of 55%.
(2)
Traditional coal produced the maximum carbon emissions by supplying the same amount of energy, but it was the most commonly used heating source due to its availability and low heating costs. It takes some time to eliminate the use of coal in rural areas; therefore, optimizing coal’s burning efficiency needs further study.
(3)
Biomass was the most economical way to reduce carbon emissions due to the low initial investments. RCEs of biomass reached 44.19 kgCO2e·CNY−1 with energy efficiency of 50%. Carbon emissions generated by biomass were 12.4% and 24% of those caused by coal and natural gas when supplying the same energy.
(4)
The maximum RCEs of natural gas reached 26.08 kgCO2e·CNY−1 with relatively high pipeline layout and maintenance costs. The government investment was an important factor in popularizing natural gas in rural areas.
(5)
Carbon emissions and heating fees of AHSP were relatively high. Reducing the carbon emissions and costs of the electricity generation process further improved the economic benefits of electric heating.
Based on the above conclusions, biomass heating was first recommended as the optimum carbon-reduction strategy in rural areas, followed by the thermal insulation optimization of envelopes, natural gas furnaces, and ASHPs.

Author Contributions

J.Y.: data curation, writing—original draft, review, and editing; X.Z.: methodology, writing—review and editing, and supervision. All authors have read and agreed to the published version of the manuscript.

Funding

This research was funded by the Innovation Foundation of the Gansu Provincial Department of Education (no: 2024B-064) and the Young Science Project of Lanzhou Jiaotong University (no: 1200061319).

Institutional Review Board Statement

Not applicable.

Informed Consent Statement

Not applicable.

Data Availability Statement

The data are contained within this article.

Acknowledgments

This research was supported by Xibao Wang, Fanhong Lin, Junbo Yang, and Shanguo Shi. We appreciate their help in conducting the on-site survey, and we would like to thank the respondents and anonymous reviewers for their valuable feedback and comments on heating optimization.

Conflicts of Interest

The authors declare no conflict of interest.

References

  1. Ke, Y.; Zhou, L.; Zhu, M. Scenario Prediction of Carbon Emission Peak of Urban Residential Buildings in China’s Coastal Region: A Case of Fujian Province. Sustainability 2023, 15, 2456. [Google Scholar] [CrossRef]
  2. Nie, Y.; Deng, M.; Shan, M.; Yang, X. Clean and low-carbon heating in the building sector of China: 10-Year development review and policy implications. Energy Policy 2013, 179, 113659. [Google Scholar] [CrossRef]
  3. Li, Y.; Wang, J.; Deng, B. Emission reduction analysis of China’s building operations from provincial perspective: Factor decomposition and peak prediction. Energy Build. 2023, 296, 113366. [Google Scholar] [CrossRef]
  4. Gao, Y.; Luo, S.; Jiang, J. Environmental-thermal-economic performance trade-off for rural residence retrofiting in the Beijing–Tianjin–Hebei region, Northern China: A multi-objective optimization framework under different scenarios. Energy Build. 2023, 286, 112910. [Google Scholar] [CrossRef]
  5. Wu, S.; Zheng, X.; You, C. Household energy consumption in rural China: Historical development, present pattern and policy implication. J. Clean. Prod. 2019, 211, 981–991. [Google Scholar] [CrossRef]
  6. Wang, J.; Xue, D.; Wang, M. Influencing Factors and Mechanism of Rural Carbon Emissions in Ecologically Fragile Energy Areas—Taking Ejin Horo Banner in Inner Mongolia as an Example. Sustainability 2022, 14, 7126. [Google Scholar] [CrossRef]
  7. Fan, J.; Ran, A.; Li, X. A Study on the factors affecting China’s direct household carbon emission and comparison of regional differences. Sustainability 2019, 11, 4919. [Google Scholar] [CrossRef]
  8. Guan, X.; Guo, S.; Xiong, J. Energy-related CO2 emissions of urban and rural residential buildings in China: A provincial analysis based on end-use activities. J. Build. Eng. 2023, 64, 105686. [Google Scholar] [CrossRef]
  9. GB/T 51366; Standard for Building Carbon Emission Calculation. Ministry of Housing and Urban-Urban Development of the People’s Republic of China, China Building Industry Press: Beijing, China, 2019. (In Chinese)
  10. Xu, X. Study on Life Cycle Carbon Emission of Straw Bale Buildings Based on Hybrid-LCA Model. Master’s Thesis, Xi’an University of Architecture and Technology, Xi’an, China, 2019. (In Chinese). [Google Scholar]
  11. Liu, Y.; Zhang, J.; Xu, J. Carbon emission-based life cycle assessment of rural residential buildings constructed with engineering bamboo: A case study in China. J. Build. Eng. 2023, 76, 107182. [Google Scholar] [CrossRef]
  12. Li, H.; Luo, Z.; Xu, X. Assessing the embodied carbon reduction potential of straw bale rural houses by hybrid life cycle assessment: A four-case study. J. Clean. Prod. 2021, 303, 127002. [Google Scholar] [CrossRef]
  13. Chen, P. Assessment on Electric Heating in Rural Area of Beijing. Master’s Thesis, North China Electric Power University, Beijing, China, 2020. (In Chinese). [Google Scholar]
  14. Deng, M.; Ma, R.; Lu, F. Techno-economic performances of clean heating solutions to replace raw coal for heating in Northern rural China. Energy Build. 2021, 240, 110881. [Google Scholar] [CrossRef]
  15. Zhang, Y.; Zhang, G.; Zhou, D. Experimental study and performance evaluation of an air source heat pump (ASHP) system with a frost-free evaporator. J. Clean. Prod. 2024, 448, 141469. [Google Scholar] [CrossRef]
  16. Wu, X.; Li, J. Experimental study on optical operation about solar energy assisted air source heat pump heating system in severe cold area. J. Eng. Thermophys. 2019, 40, 900–906. (In Chinese) [Google Scholar]
  17. Zeng, H. Research on Technical Economic Analysis and Policy of Electric Energy Replacement on Rural Areas of Beijing–Tianjin–Hebei. Master’s Thesis, North China Electric Power University, Beijing, China, 2017. (In Chinese). [Google Scholar]
  18. Zhou, Q.; He, Q.; He, D. Assessment model of electrical energy replacement based on cost utility analysis. Electr. Energy 2018, 39, 538–543+555. (In Chinese) [Google Scholar]
  19. Chen, J. Research on Cost Management of Rural “Coal to Electricity” Project in Certain Area in Beijing. Master’s Thesis, North China Electric Power University, Beijing, China, 2017. (In Chinese). [Google Scholar]
  20. Zhang, R. Research and Analysis of Rural Heating Mode Under the Background of “No Coalification” Transformation in Tianjin and Hebei. Master’s Thesis, North China Electric Power University, Beijing, China, 2018. (In Chinese). [Google Scholar]
  21. He, L. Comparative Study on Energy Supply of Rural Construction in Beijing. Ph.D. Thesis, Beijing University of Civil Engineering and Architecture, Beijing, China, 2018. (In Chinese). [Google Scholar]
  22. Nie, Y.; Deng, M.; Shan, M.; Yang, X. Is there interaction between forestry residue and crop residue in co-pyrolysis? Evidence from wood sawdust and peanut shell. J. Therm. Anal. Calorim. 2023, 148, 2467–2481. [Google Scholar] [CrossRef]
  23. Xu, Y.; Liu, X.; Qi, J. Characterization of fine particulate matter generated in a large woody biomass-firing circulating fluid bed boiler. J. Energy Inst. 2021, 96, 11–18. (In Chinese) [Google Scholar] [CrossRef]
  24. Tian, H.; Ma, L.; Li, Q. Energy saving retrofit of rural house based on the joint utilization of solar collector and attached sunspace. Energy Build. 2023, 299, 113591. [Google Scholar] [CrossRef]
  25. Padovani, F.; Sommerfeldt, N.; Longobardi, F. Decarbonizing rural residential buildings in cold climates: A techno-economic analysis of heating electrification. Energy Build. 2021, 250, 111284. [Google Scholar] [CrossRef]
  26. Tahsildoost, M.; Zomorodian, Z. Energy, carbon, and cost analysis of rural housing retrofit in different climates. J. Build. Eng. 2020, 30, 101277. [Google Scholar] [CrossRef]
  27. Meteorological Information Center of China Meteorological Administration. Special Meteorological Data for Building Thermal Environment Analysis in China; China Building Industry Press: Beijing, China, 2005. (In Chinese) [Google Scholar]
  28. GB 50176; Code for Thermal Design of Civil Buildings. Ministry of Housing and Urban-Rural Development of the People’s Republic of China, China Building Industry Press: Beijing, China, 2016. (In Chinese)
  29. Ministry of Housing and Urban-Rural Development of Jiangsu Province. Guidelines for Carbon Emission Calculation of Civil Buildings in Jiangsu Province; Ministry of Housing and Urban-Rural Development of Jiangsu Province: Nanjing, China, 2023. (In Chinese) [Google Scholar]
  30. Zhang, S.; Liu, Y.; Hou, L. Comparative study on energy efficiency calculation methods of residential buildings in central heating areas of Northern China. J. Harbin Inst. Technol. 2019, 51, 178–185. (In Chinese) [Google Scholar]
  31. JGJ 26; Design Standards for Energy Efficiency of Residential Buildings in Severe Cold and COLD Areas. Ministry of Housing and Urban-Rural Development of the People’s Republic of China, China Building Industry Press: Beijing, China, 2019. (In Chinese)
  32. GB50555; Standard for Water Saving Design in Civil Building. Ministry of Housing and Urban-Rural Development of the People’s Republic of China, China Building Industry Press: Beijing, China, 2010. (In Chinese)
  33. GB/T 50824; Design Standard for Energy Efficiency of Rural Residential Buildings. Ministry of Housing and Urban-Rural Development of the People’s Republic of China, China Building Industry Press: Beijing, China, 2013. (In Chinese)
  34. DB62/T 3151; Design Standards for Energy Efficiency of Residential Buildings in Severe Cold and Cold Areas (75%). Ministry of Housing and Urban-Rural Development of Gansu Province, China Building Industry Press: Beijing, China, 2018. (In Chinese)
  35. Song, B.; Yang, L. Analysis of influence factors and economic efficiency of energy consumption of rural dwellings in cold regions. Build. Sci. 2020, 36, 33–38. (In Chinese) [Google Scholar]
  36. Zhang, M.; Yang, Z.; Ma, J. Standard rating conditions based on two-side multi-grade method: Summary and analysis on the Chinese standards for air source heat pumps. Int. J. Refrig. 2021, 131, 394–406. [Google Scholar] [CrossRef]
Figure 1. Research framework.
Sustainability 17 00131 g001
Figure 2. Outdoor air temperature in Gannan.
Sustainability 17 00131 g002
Figure 3. On-site survey on heating.
Sustainability 17 00131 g003
Figure 4. Building plan.
Sustainability 17 00131 g004
Figure 5. Thermal environment test layouts.
Sustainability 17 00131 g005aSustainability 17 00131 g005b
Figure 6. Solar radiation.
Sustainability 17 00131 g006
Figure 7. Heating modes, heating fees, and indoor air temperature.
Sustainability 17 00131 g007
Figure 8. Payback period of optimized thermal insulation.
Sustainability 17 00131 g008
Figure 9. The prices of 1 kWh of heat.
Sustainability 17 00131 g009
Figure 10. Annual heating carbon emissions.
Sustainability 17 00131 g010
Figure 11. Annual heating fees.
Sustainability 17 00131 g011
Figure 12. Reduced carbon emissions per investment.
Sustainability 17 00131 g012
Table 1. Structures of building envelopes.
Building
Envelopes
StructuresK-Values/W·m−2·K−1
ThicknessMaterialsThermal Conductivity λ
/W·m−1·K−1
Wall20 mmcement plaster0.931.68
300 mmfly ash block0.74
20 mmcement plaster0.93
5 mmlimestone1.16
Roof10 mmcement tile0.741.70
/waterproof/
120 mmreinforced concrete floor1.74
100 mmair0.28
10 mmwooden ceiling0.17
Ground/Compacted plain soil/0.13 (non-surrounding ground)
0.34 (surrounding ground)
120 mmcrushed stone concrete1.51
10 mmwooden floor0.17
Window 16 mmglass/2.70
/wood/
6 mmglass/
/wooden frame/
Window 26 mmglass/4.70
/aluminum alloy frame/
Table 2. Specifications and accuracies of sensors.
Instrument DevicesParametersSpecificationsAccuracies
Temperature recorderAir temperature−20–60 °C±0.1 °C
Thermocouple temperature recorderSurface temperature−20–85 °C±0.1 °C
Solar radiation recorderSolar radiation0–2000 W/m2≤±2%
Table 3. Lighting density of main rooms.
SpacesLighting Density/W·m−2Monthly Lighting Time/h
Living room6165
Bedroom6135
Dining room675
Kitchen696
Table 4. The net heat losses of envelopes.
Building EnvelopeNet Heat Loss/WPercentage
Walls5599.9746.93%
Roof2719.1722.79%
Ground436.403.66%
Windows1794.9315.04%
Infiltration582.044.88%
Door490.684.11%
Balcony310.422.59%
Sum11,933.61100.00%
Table 5. Carbon emissions at all stages.
Various StagesCarbon Emissions/kgCO2e⋅m−2Percentage
Material production + transportationProduction486.9496.86%502.727.36%
Transportation15.783.14%
Construction
+ demolition
Construction3.5952.63%6.820.11%
Demolition3.2347.36%
OperationHot water552.758.75%6318.1192.53%
Heating5743.2890.90%
Lighting22.070.35%
Sum6827.64100.00%
Table 6. The structures and heat transfer coefficients of the building envelopes.
Energy EfficiencyEnvelopeThermal Insulation ThicknessK-Value/W·m−2·K−1
50%Wall30 mm0.73
Roof50 mm0.54
Window/3.00
55%Wall40 mm0.61
Roof60 mm0.47
Window/3.00
60%Wall50 mm0.53
Roof60 mm0.47
Window/2.70
65%Wall60 mm0.47
Roof80 mm0.38
Window/2.40
70%Wall100 mm0.32
Roof100 mm0.32
Window/2.40
Table 7. Cost analysis of various heating energy.
Heating EnergyHeating EfficiencyCalorific ValueOperating CostCarbon Emission Factor/kgCO2e·Unit−1
Coal0.7529,307 J·g−1700 CNY·t−189 tCO2e·TJ−1
Natural gas0.9138,931 k J·m−32.4 CNY·m−355.54 tCO2e·TJ−1
Biomass0.7516,368 J·g−1590 CNY·t−1180 kgCO2e·t−1
Air-source heat pump2.53600 kJ·kwh−10.5 CNY·kWh−10.66 kgCO2e·kWh−1
Disclaimer/Publisher’s Note: The statements, opinions and data contained in all publications are solely those of the individual author(s) and contributor(s) and not of MDPI and/or the editor(s). MDPI and/or the editor(s) disclaim responsibility for any injury to people or property resulting from any ideas, methods, instructions or products referred to in the content.

