Article

Theoretical Framework for Virtual Logistics Centers Creation

by
Vytautas Paulauskas
1,
Ludmiła Filina-Dawidowicz
2,*,
Viktoras Senčila
1,
Donatas Paulauskas
1 and
Birutė Plačienė
1
1
Marine Engineering Department, Klaipeda University, H. Manto Str. 84, LT-92294 Klaipeda, Lithuania
2
Faculty of Maritime Technology and Transport, West Pomeranian University of Technology, Szczecin, Ave. Piastów 41, 71-065 Szczecin, Poland
*
Author to whom correspondence should be addressed.
Sustainability 2024, 16(9), 3680; https://doi.org/10.3390/su16093680
Submission received: 23 March 2024 / Revised: 21 April 2024 / Accepted: 23 April 2024 / Published: 28 April 2024

Abstract

:
Intermodal terminals and warehouses operate in different countries and deliver specific services to their customers. For many clients, it is important to receive a full set of the logistics services delivered by a single operator. However, individual intermodal terminals and warehouses may face challenges with providing these services, e.g., just-in-time goods delivery, goods distribution, cargo handling in non-standard situations, and others. In such cases, the cooperation between logistics companies may be required to organize the comprehensive service of cargo within supply chains. One of the possible solutions is to integrate transport and logistics services providers, establishing their cooperation within one virtual logistics center. The aim of this article is to justify theoretically the possibility of creating such a center by combining services performed by the intermodal terminals and warehouses already in operation under a single entity, in order to minimize the cost of logistics services and the time of goods delivery, as well as to create a comprehensive range of logistics services needed by customers. The relevance of the article and the novelty of the idea are associated with justification of the possibility of combining the activities of intermodal terminals and warehouses located separately in the region in order to improve the logistical service of customers. The theoretical basis for creating a virtual logistics center is based on graph theory methods. The article presents a theoretical model, based on a system of edges and vertices of the graph tree, which corresponds to the activities performed by separately located intermodal terminals and individual warehouses. The discussion is focused on the current problems of creating virtual logistics centers. The research results may be interesting for the managers of intermodal terminals, warehouses, and logistics centers, as well as other decision-makers involved in supply chains implementation and development.

1. Introduction

The development of national and international trade impacts supply chains operation. The services organized within the supply chains should meet growing customers’ requirements [1]. Therefore, logistics operators should carefully analyze the conditions and place of their performance within these chains, as well as appropriately organize the service processes, considering the possibility of disruptions occurrence [2].
Logistics centers play an important role in supply chains [3]. There are places where the wide range of specific services is performed for various customers, including those involved in the supply, production, and distribution of goods [4]. The services could be provided by one enterprise or by numerous companies on a commercial basis, but the whole process is managed by one operator. Such centers use specific infrastructure needed to carry out a wide range of services, including intermodal terminals, warehouses, parking places for vehicles, repair centers, offices, hotels, etc. Moreover, these facilities should possess equipment needed for the specific services provision.
Nowadays, a lot of intermodal terminals and warehouses operate in different countries and offer logistics services for the customers. Among these services, the following ones could be mentioned [5,6]: transport process organization, documents preparation, carrying out cargo transportation and storage according to set requirements (e.g., set temperature, humidity, etc.), management of goods flow (e.g., quantity and quality), stock levels maintenance, execution of cargo handling services, optimization of transport means utilization and storage area usage, goods management in emergency situations, marketing and promotion, reaction to market changes, performing value added services, etc.
In some countries, there are limitations to build public logistics centers, but those countries possess many intermodal terminals and warehouses located in different places, and it is difficult or even impossible to integrate them physically. The relevance and novelty of the article is an attempt to theoretically substantiate and practically verify the possibility of combining the logistics functions of intermodal terminals and individual warehouses located in different places by creating a virtual logistics center, in which representatives of intermodal terminals and individual warehouses “scattered” in specific regions would participate in the joint activities in order to minimize logistics costs and provide better services to clients.
The concept of the virtual logistics center deals with establishing cooperation between the managers of intermodal terminals, individual warehouses, and other providers of logistics services for joint decision-making, combining the representatives of the aforementioned companies (physically and online) by creating a separate entity with the right to make optimal decisions for logistics tasks and search for sustainable solutions.
Considering growing customers’ requirements, particular intermodal terminals and warehouses may face challenges with delivering all needed services to their customers. In this situation, the establishing of cooperation with other enterprises may be beneficial; however, within a standard cooperation framework, it could be difficult or even impossible to organize. One of the possibilities to solve this problem is initiation of cooperation within the concept of a virtual logistics center. A virtual logistics center refers to a concept introduced in logistics and supply chain management that uses digital technologies and interconnected systems to optimize and manage various services required for supply chain operation without a centralized location of involved facilities [7]. On the one hand, a virtual logistics center concept involves the integration of advanced software, communication networks, data analytics, and automation to streamline and enhance logistics operations; on the other hand, it allows to combine efforts of different enterprises (sometimes located in different places) and optimally distribute tasks to make the end customer satisfied.
It should be noted that large companies have more opportunities related to organization of cargo transport, including the optimization of transport processes, but they also often receive relatively small batches of goods, and combining those batches of goods with batches of other recipients allows for optimization of logistics and transportation processes. At the same time, the development of virtual logistics centers, in which representatives of several regional intermodal terminals and individual warehouses participate, creates an opportunity to search for optimal solutions while minimizing transportation costs, to deliver both large and small batches of goods to recipients on time.
The available literature studies describe the concept of virtual logistics and virtual logistics centers [8,9]. Digital technologies used to develop these centers were discussed [10]; as well, potential benefits and risks of virtual centers operation have been shown [11]. Nevertheless, the practical possibilities to create these centers still need to be investigated and justified.
The possible model of entities cooperation within the virtual logistics center corresponds to the well-known “one-stop shop” principle; however, in the article, a reasonable suggestion about the possibility of combining representatives (operators) of intermodal terminals and separate warehouses in one place through the virtual logistics center is presented, in order to promptly solve problems and search for optimal options for delivering goods to recipients, that is focused on managing logistics processes without creating new physical logistics centers.
The aim of the article is to justify theoretically the possibilities of creating virtual logistics centers by combining the activities performed by intermodal terminals and warehouses already in operation under a single entity, in order to minimize the cost of logistics services and time of goods delivery, as well as to create a comprehensive range of logistics services needed by customers.
The article includes the available literature review presented in Section 2, showing the state of the art in the analyzed field. The methodology of conducted research is described in Section 3. Section 4 shows the possibility of implementing a developed concept on a selected case study example. In order to sum up, the discussion was carried out and conclusions were drawn, as described in Section 5.

2. Literature Review

The concept of virtual logistics centers was developed at the end of the XX century. The idea appeared together with the development of information technologies and digital solutions, which have started to be widely implemented in logistics. Clarke in 1998 described the concepts for “virtual logistics”, when the physical and information aspects of logistics operations were treated independently [12]. In such a case, the ownership and control of resources is affected through Internet (or intranet) applications rather than direct physical control; therefore, resources can be owned and used remotely.
Expecting that the management of virtual logistics systems would require the application of new concepts in the operations, Clarke described the following logistics elements [12]: virtual stockholding; virtual warehouses; virtual supply chains; virtual stock control; virtual trading; virtual deliveries and the substitution of trading for transport; virtual production; virtual logistics services; virtual markets; virtual growth; and virtual organizations. While recognizing that virtualization is mostly realized through digitization methods, it is important to distinguish that not all logistics processes are equally suitable for virtualization.
In terms of virtual production (or manufacturing), it was assumed that different processes can be arranged in the best logistical way with geographically separated production resources, referring to the wider use of digital technologies and virtualization concepts to design, prototype, simulate, and optimize manufacturing processes [12,13]. Rehman Khan and Yu [14] analyzed the trends in supply chains and stated that these chains become constantly more network-based and virtual, and also noted that the role of supply chain and logistics engineering in maintaining a healthy, green, and environmentally friendly future will become even more important.
It is generally accepted that in conventional logistics systems, the supply chain management supports three types of flows within a business activity [15,16,17]:
  • Flow of products or services;
  • Flow of information regarding the products or services;
  • Financial transactions related to the products or services.
In developing the layered supply chain model, Van Oosterhout [18] assumed that supply chains can be analyzed from the perspective of three different interrelated layers: the physical logistics layer, that covering physical handling and transportation of goods, the transaction layer, that encompassing all commercial relationships between parties, as well as the governance layer, in which all governing bodies like customs and inspections are included. Numerous information exchanges take place in and between the transaction and governance layers, and in many cases, information flows precede physical flows. Financial flows reflect commercial relationships and sometimes do not necessarily correspond exactly to the underlying physical and informational flows. Nowadays, these three layers make it possible to manage using digital tools, which encourages the use of virtual solutions in logistics [9,19].
Modern supply chains are operated with the use of logistics infrastructure that involves warehouses, intermodal terminals located in seaports and inland, logistics centers, factories, transport linear infrastructure, and others [4,20,21]. This infrastructure may be spatially dispersed, which can make it difficult to organize logistical processes. Therefore, specific structures should be created to manage logistics services, considering clients’ needs.
In the global networks, the role of seaports has traditionally been defined as the interface between maritime and inland transport. At the same time, modern ports are spatial, logistical, financial, and informational hubs [16]. Information and communication technologies have radicalized the decoupling of the flow of information from the flow of physical goods. The outsourcing of logistics activities has enhanced the need to coordinate focused activities by different organizations in the supply chain. Therefore, both information sharing and coordination became essential for supply chains integration.
Key fields of interest for virtualization in logistics are formulated by different authors [10,20,22] as follows:
  • Layout planning and concept creation, when 3D visualization tools are needed to improve communication in engineering teams, space needs and production principles verification, logistics solutions evaluation and modelling [23,24];
  • Production simulation, aiming to test and verify plans, check the material flow routing and control principle, verify the buffer size and location, search for bottlenecks [20,25];
  • Training of operators [8,22,26];
  • Operational use, while some models are applied to plan and design the processes, other models are used in the day-to-day operation of manufacturing facilities [22,25].
Moreover, the concept of virtual value chain is explored in the available literature [27]. It approaches the competitiveness of organizations under the principle of integrated maximum utility, while forming strategic alliances with other partners at specific integrated supply chains. Though, for the establishment of the competitive model of value chain, the total utility of the integrated value chain could be acquired from each supplier to each competitive unit at the specific product type, using cost, service, quality, and flexibility utility functions.
Against the background of the dynamic development of modern logistics, the logistics centers are starting to play an increasingly important role in local and global supply chains [28]. In general, these centers are considered as supply and distribution nodes, which provide logistics services for customers [3]. Along with transport and handling processes, such centers carry out activities relate to the complex support of production and products sale [10]. The concept of logistics centers operation deals with the number of benefits. They aim to reduce vehicle traffic, vehicle-related greenhouse gas emissions, and local air pollution, etc. [29]. The idea of their operation is related to providing a wide range of services for the customers. Selected services that may constitute the logistics centers’ service offerings are presented in Table 1.
Specific logistics services may be provided within the facilities of logistics centers or may be outsourced [30]. The development of e-commerce services in logistics centers is in line with current trends, and business users need to receive transparent information, as well as high-quality cheap products [31]. These services may have cross-border character [1] and may refer to different kinds of products (e.g., raw materials, semi-finished goods, finished goods) [21]. In some cases, the specific services may be provided by suppliers located close to places where there is a demand for services [32]. The necessity to ensure the complexity of logistics services provided by one operator is highlighted [6].
The essence of the virtual logistics center arrangement is based on the approach that the scale of offered logistics services may not depend on construction of new logistics capabilities considering investment issues but on effectively managed cooperation of available vital capacities of logistical resources that already exist and can be integrated into a virtual logistics system. Implementation of the virtual center concept has the potential to improve the scalability of operations, limit financial risks, and impact sustainability [33]. Examples of virtual logistics centers were described in few publications [34,35].
According to Tamas et al. [8], the virtual logistics centers operation reveals many unused opportunities for cross-border logistics cooperation. The main tasks of the virtual logistics development are: to allow/refuse the connection of small and medium-sized enterprises, to maintain their data, to operate the web-based system to be created, to formulate development needs, to carry out marketing activities, and to perform the financial and management tasks of the virtual logistics company. It was mentioned that a virtual logistics center can act as a non-profit association which carries out various tasks for the benefit of its members, applying for non-commercial funding for logistics investments such as the building of a transshipment terminal or improving the transport infrastructure [34]. The simplified concept of the logistics center is shown in Figure 1. The essential component of every virtual logistics center is the Internet (digital) platform needed for communication between the clients, separate providers of logistics services, and other cooperating entities.
Cichosz et al. [36] paid attention to the need for collaboration between companies for the sustainable transport development. It was noted that it is reasonable to invest in the collaborative relationships that may be supported by technological tools for sustainable transport management. Rezaei and Behnamian [37] analyzed the existence of partnership and non-partnership synergies at various stages of planning, establishment, and development of supply networks based on downstream alliances. They also presented the design of a multi-agent distribution mechanism considering environmental sustainability requirements and the simultaneous development of cooperation and competition in terms of virtual alliances.
Traditionally, frameworks to evaluate and measure performance in logistic processes included four main types of indicators [16,20]: quality, time, cost, and flexibility. The search for ways to reduce logistics costs and to serve customers better has become a major focus for many distribution companies. The paper [38] established an optimization model of regional express distribution center location based on the road network. The Fuzzy C Means (FCM) clustering algorithm was improved within the created model.
To provide the high-quality services, intermodal terminals and logistics centers are developing their infrastructure and improving the equipment [39]. Performance of services is supported by digital solutions application [40]. According to Demirova [17], the implementation of information technology in logistics aims to ensure the movement and interaction of material and immaterial components between the individual departments of the company, as well as between companies in the process of purchasing and distribution of goods.
Cloud computing and Internet of Things have promoted a new logistics service mode, i.e., the cloud logistics mode [11]. A resource virtualization framework consists of three layers: physical resource, virtual resource, and service encapsulation. In the physical resource layer, distributed logistics resources can be sensed and connected into cloud logistics systems by using IoT technologies, sensors, and GPS. In turn, in the virtual resource layer, resources expression model is built by abstracting physical resources to logical ones based on their logistics features.
The application of the virtual operation mode was considered for agricultural product logistics [41]. It was noted that the main objectives of agricultural product virtual logistics enterprises operation are focused on the creation of an efficient information system and information transmission system, high-level standardization, developed logistics technology, excellent cooperation, and trust mechanism.
The ability of graph theory application for solving logistics tasks was also examined in the available literature [42,43]. Graph theory provides a universal method for understanding and solving problems related to connectivity, relationships, and optimization within logistics systems [25]. A mathematical model of the 3-echelon logistics distribution problem considering time window constraint was established based on the directed graph, and a double-tier intelligent algorithm solution scheme was proposed by Zhang et al. [25], which combines the distance entropy-based Affinity Propagation clustering algorithm and the crossover and selection-based differential evolution algorithm.
Application of graph theory methods for a virtual logistics center operation simulation may be examined, considering various elements of the supply chain as nodes and the relationships between them as edges in a graph.
The literature analysis revealed that articles on e-commerce or virtual logistics systems do not always clearly describe the ways to create the concept of a virtual logistics platform or virtual logistics center. Furthermore, the difference between the functionality levels of virtual logistics entities and the information support generated by logistics system is not analyzed in detail.
It is certain that digital integration through software and digital platforms at least enables connection of multiple stakeholders in the supply chain, including suppliers, manufacturers, distributors, and customers. Broader objectives like identifying optimal locations for hubs, distribution centers and warehouses, route optimization, predictive analytics, risk management and multi-objective optimization to balance multiple tasks such as minimizing costs, maximizing service levels, and minimizing environmental impact can only be accomplished through gradual development of virtual logistics concepts and models that justify the need to conduct the research and develop a framework for the virtual logistics center creation.

3. Materials and Methods

3.1. Steps of Research Methodology

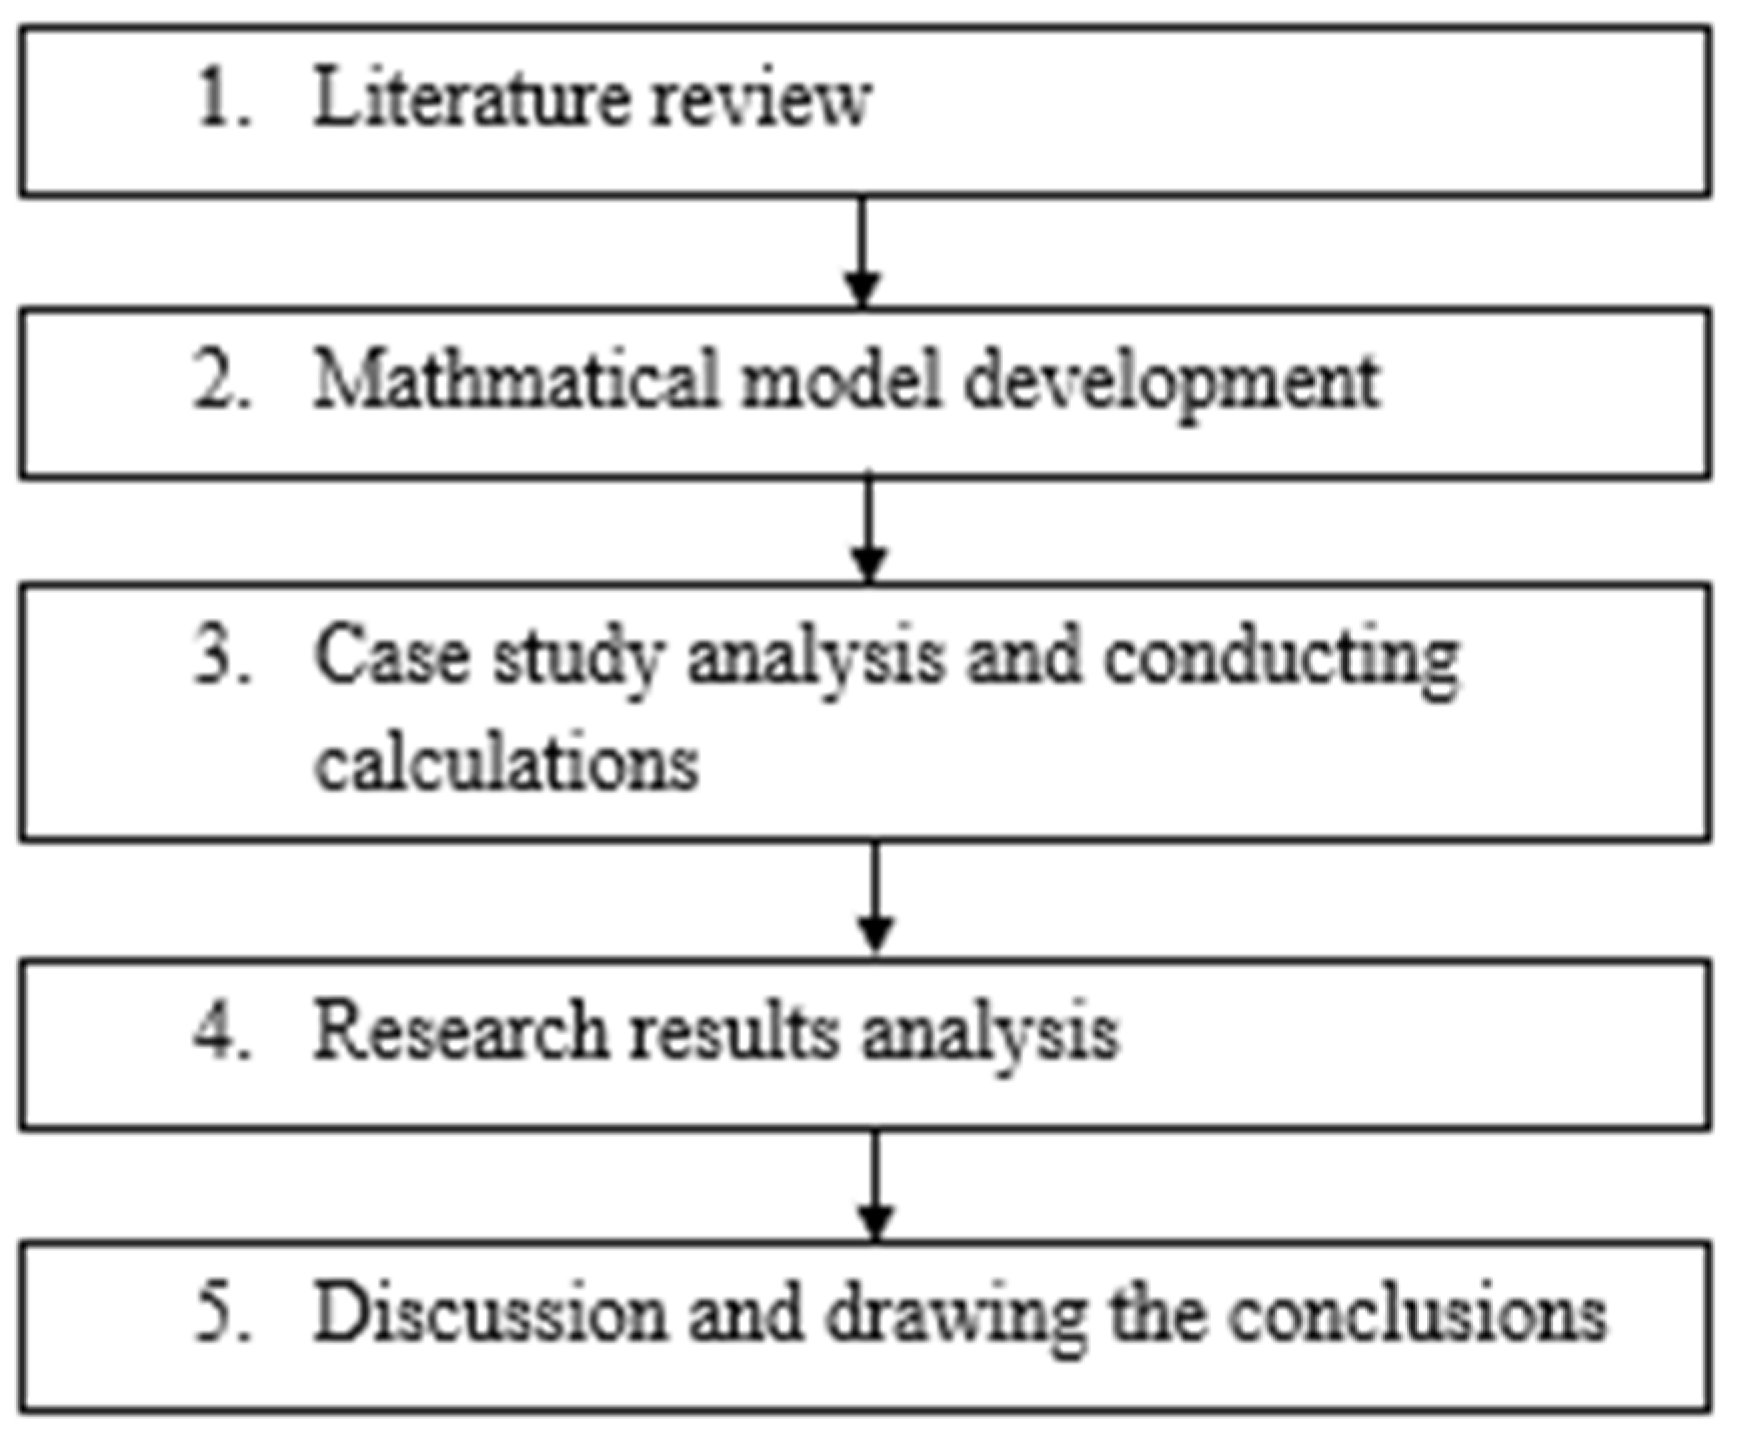
The following steps of research methodology were applied to conduct the research (Figure 2). After carrying out the literature review, the mathematical model was developed.
The theoretical calculations of goods flow performed within a virtual logistics center in special conditions were carried out. For the design of the virtual logistics center, the graph theory and the maximal distribution method were used, utilizing data achieved by conducting experiments. The maximal distribution method could be applied when at least 5 measurements are performed. These measurements were carried out.
To verify theoretical calculations and practical applications of the presented methodology, a case study was considered. Based on the set assumptions, the simulations were conducted. Calculations were carried out using the Excel program. The experiments were performed based on data obtained from intermodal terminals and warehouses operating in selected countries.
Then, the results were analyzed, discussions and conclusions were drawn, and directions for future research were outlined.

3.2. Mathematical Model

The main conditions for the development of the virtual logistics center based on the existing intermodal centers and separate warehouses are dealing with [5,20,25]:
  • Identification of existing intermodal terminals and warehouses’ locations, as well as determining of logistics services that may be performed by a particular entity;
  • Identification of senders’ and recipients’ locations and demand for services;
  • Identification of possible cooperation schemes, assessing the technical possibilities to find the best solutions for the cases analyzed, and estimation of possible alternative logistics services.
  • In order to assess possible cooperation solutions, the following criteria may be used:
  • Time of logistics service;
  • Price of logistics service;
  • Possibility to re-address goods to another service provider while performing the logistics service;
  • Energy demand while performing the service that impacts the environment and logistics costs.
The methodology for assessing optimal logistics services within virtual logistics centers is developed using multi-criteria and comparative analysis. The main idea of the developed methodology is based on establishing theoretical models, which can assist in creating optimal transport modes performed within virtual logistics centers, aiming at, i.e., minimization of energy demand, time, and service costs.
Considering the involvement of at least a few intermodal terminals or warehouses in logistics service execution, it is possible to conduct analysis to find optimal solutions. These solutions could be found by assessing and comparing different transport modes, taking into account transportation time and costs, as well as demand for energy [44,45].
The development of sustainable virtual logistics centers performing services with the use of existing intermodal terminals and warehouses is extremely important; therefore, various options of logistics operations should be identified and analyzed. Considering the optimal development of the logistics operations, it is essential to ensure their sustainability in terms of time, cost, goods distribution, energy optimization, etc. [46].
In this way, the function of logistics operation performed in virtual logistics centers could be expressed by a virtual logistics services comparative index ( K L ) that can be presented as follows (Equation (1)):
K L = f ( P L ,   T L ,   D L ,   C L ) ,
where: P L —logistics services price function; T L —logistics services time function; D L —goods re-addressing and distribution costs function; C L —energy demand function.
The application of the virtual logistics services comparative index allows for a comprehensive assessment of possible basic logistics services (considering price, time, aspects of goods distribution and redirection, energy consumption during the processing and transportation of goods, etc.), which is very important when it is necessary to complete vehicles using different senders and recipients’ goods and deliver them to the final recipients. By using the virtual logistics services comparative index, it is possible to make sure whether the applied services of the virtual logistics center are more useful and to what extent, compared to the direct delivery of goods.
Price function can be expressed using logistics services lump sum prices (prices of different activities within logistics services in different intermodal terminals and warehouses) and number of used intermodal terminals and warehouses facilities, as is presented by Equation (2):
P L = 1 η P [ P T 1 L + P T 1 A + P T 1 R + P T 1 T + N T 1 U + ( P T 2 L + P T 2 A + P T 2 R + P T 2 T + ) N T 2 U + ] ,
where: η P —correlation coefficient, for the similar intermodal terminals and warehouses it could be between 0.95 and 1.0; P T 1 L —price of logistics operations for one cargo unit in the first intermodal terminal or warehouse; P T 1 A —price of additional operations for one cargo unit in the first intermodal terminal or warehouse; P T 1 R —price of re-addressing one cargo unit in the first intermodal terminal or warehouse; P T 1 T —transportation price from the first intermodal terminal or warehouse to the next intermodal terminal or warehouse for one cargo unit; P T 2 L —price of logistics operation for one cargo unit in the second intermodal terminal or warehouse; P T 2 A —price of additional operations for one cargo unit in the second intermodal terminal or warehouse; P T 2 R —price of re-addressing one unit in the second intermodal terminal or warehouse; P T 2 T —transportation price from the second intermodal terminal or warehouse to the next intermodal terminal or warehouse for one cargo unit; N T 1 U —number of units serviced in the first intermodal terminal or warehouse; N T 2 U —number of units serviced in the second intermodal terminal or warehouse; +…—other possible price elements, like payments for emissions trading and so on, as well as prices of services performed using additional intermodal terminals or warehouses.
The logistics services time function ( T L ) for a specific quantity of cargo units can be expressed as follows (Equation (3)):
T L = 1 η T [ T T 1 L + T T 1 A + T T 1 R + T T 1 T + N T 1 U + ( T T 2 L + T T 2 A + T T 2 R + T T 2 T + ) N T 2 U + ] ,
where: η T —correlation coefficient, for the similar intermodal terminals and warehouses it could be between 0.95 and 1.0; T T 1 L —time needed for logistics service for one cargo unit in the first intermodal terminal or warehouse; T T 1 A —additional operations time for one cargo unit service in the first intermodal terminal or warehouse; T T 1 R —time for re-addressing one cargo unit in the first intermodal terminal or warehouse; T T 1 T —transportation time from the first intermodal terminal or warehouse to the next intermodal terminals or warehouses for one cargo unit; T T 2 L —time needed for logistics operations for one cargo unit in the second intermodal terminal or warehouse; T T 2 A —additional operations time for one cargo unit in the second intermodal terminal or warehouse; T T 2 R —time for re-addressing one cargo unit in the second intermodal terminal or warehouse; T T 2 T —transportation time of one cargo unit from the second intermodal terminal or warehouse to the next intermodal terminals or warehouses; N T 1 U —number of cargo units serviced in the first intermodal terminal or warehouse; N T 2 U —number of cargo units serviced in the second intermodal terminal or warehouse; +…—other possible time elements, like waiting times for transport means and so on, as well as time needed to perform logistics service in additional intermodal terminals or warehouses.
The function of logistics services costs’ distribution ( D L ) for a specific quantity of cargo units can be expressed as follows (Equation (4)):
D L = 1 η D [ D T 1 L + D T 1 A + D T 1 R + D T 1 T + N T 1 U + ( D T 2 L + D T 2 A + D T 2 R + D T 2 T + ) N T 2 U + ] ,
where: η D —correlation coefficient, for the similar intermodal terminals and warehouses it could be between 0.95 and 1.0; D T 1 L —distribution operation costs for one unit in the first intermodal terminal or warehouse; D T 1 A —costs for additional distribution operations (repacking, etc.) for one unit in the first intermodal terminal or warehouse; D T 1 R —costs of operations for re-addressing and distribution of one cargo unit in the first intermodal terminal or warehouse; D T 1 T —transportation costs from the first intermodal terminal or warehouse to the next intermodal terminal or warehouse for one unit distributed; D T 2 L —costs of distribution operation for one cargo unit in the second intermodal terminal or warehouse; D T 2 A —additional distribution operation costs for one cargo unit in the second intermodal terminal or warehouse; D T 2 R —additional costs for re-addressing one cargo unit in the second intermodal terminal or warehouse; D T 2 T —transportation costs from the second intermodal terminal or warehouse to the next intermodal terminal or warehouse for additional distributed one cargo unit; N T 1 U —number of units operating in the first intermodal terminal or warehouse; N T 2 U —number of units operating in the second intermodal terminal or warehouse; +…—means other possible costs elements, like small and not typical distributed packages and so on, as well as distribution using additional intermodal terminals or warehouses.
Energy demand function ( C ) for a specific quantity of cargo units can be expressed as follows (Equation (5)):
C L = 1 η E [ C T 1 L + C T 1 A + C T 1 R + C T 1 T + N T 1 U + ( C T 2 L + C T 2 A + C T 2 R + C T 2 T + ) N T 2 U + ] ,
where: η E —correlation coefficient, for the similar intermodal terminals and warehouses could be between 0.95 and 1.0; C T 1 L —energy demand for logistics operations for one cargo unit in the first intermodal terminal or warehouse; C T 1 A —energy demand for logistics operation for one cargo unit in the first intermodal terminal or warehouse; C T 1 R —additional energy demand for logistics operation for one cargo unit in the first intermodal terminal or warehouse; C T 1 T —energy demand for logistics operation for one unit during its transportation from the first intermodal terminal or warehouse to the next intermodal terminals or warehouses; C T 2 L —energy demand of logistics operations for one cargo unit in the second intermodal terminal or warehouse; C T 2 A —energy demand for logistics operation for one unit in the second intermodal terminal or warehouse; C T 2 R —additional energy demand for logistics operations for one cargo unit in the second intermodal terminal or warehouse; C T 2 T —energy demand for logistics operations for one unit during its transportation from the second intermodal terminal or warehouse to the next intermodal terminals or warehouses; N T 1 U —number of units operating in the first intermodal terminal or warehouse; N T 2 U —number of units operating in the second intermodal terminal or warehouse; +…—other possible elements, like energy demand during distribution of small and not typical packages and so on, as well as goods distribution using additional intermodal terminals or warehouses.
In order to find optimal solutions, the evaluation methods that use weight coefficients could be applied. Therefore, comparative index ( K L ) of virtual logistics services performed within a virtual logistics center could be expressed by assessing different factors (Equation (6)):
K L = 1 η L ( k P P L i P 0 + k T T L i T 0 + k D D L i D 0 + k E E L i E 0 + k L i A L i A 0 i ) ,
where: η L —correlation coefficient for the logistics services, in case the similar factors are considered, for example, while analyzing a few intermodal terminals or warehouses, this coefficient could be between 0.97 and 0.99, taking into account that more factors can improve identification of correlation coefficients using matrix systems [8]; P L i , T L i , D L i , E L i —costs, time, distribution, and energy demand for the logistics services performed within the virtual logistics center; P 0 , T 0 , D 0 , E 0 —costs, time, distribution, and energy demand for intermodal terminals or warehouses, which can be determined by expert or applying other methods; k P —weight coefficient of the logistics services costs, it could be taken between 0.30 and 0.35 depending on the cargo type; k T —weight coefficient of the logistics services time, it depends on the type of cargo and could be between 0.20 and 0.25; k D —weight coefficient for distribution services, it depends on the goods distribution requirements and could be between 0.15 and 0.20; k E —weight coefficient of the logistics services energy (fuel) demand, it depends on the number of logistics operations and could be between 0.20 and 0.25; k L i , A L i , A 0 i —other possible factors and weight coeficients, for example, emissions, cargo weights, and other factors important for the logistics services cases; the sum of the weight coefficients must be equal to one.
Comparative index (Equation (6)) calculation is based on multi-criteria methods and can be applied to assess different tasks, for example, related to cargo transportation and distribution optimization including environmental impact evaluation in case several intermodal terminals and warehouses are involved in logistics task execution, as well as the whole logistics chains evaluation. Application of the mentioned equation requires proper selection of weight coefficients, which can be calculated using a matrix in case the appropriate database exists or using expert methods in case of limited access to real data.
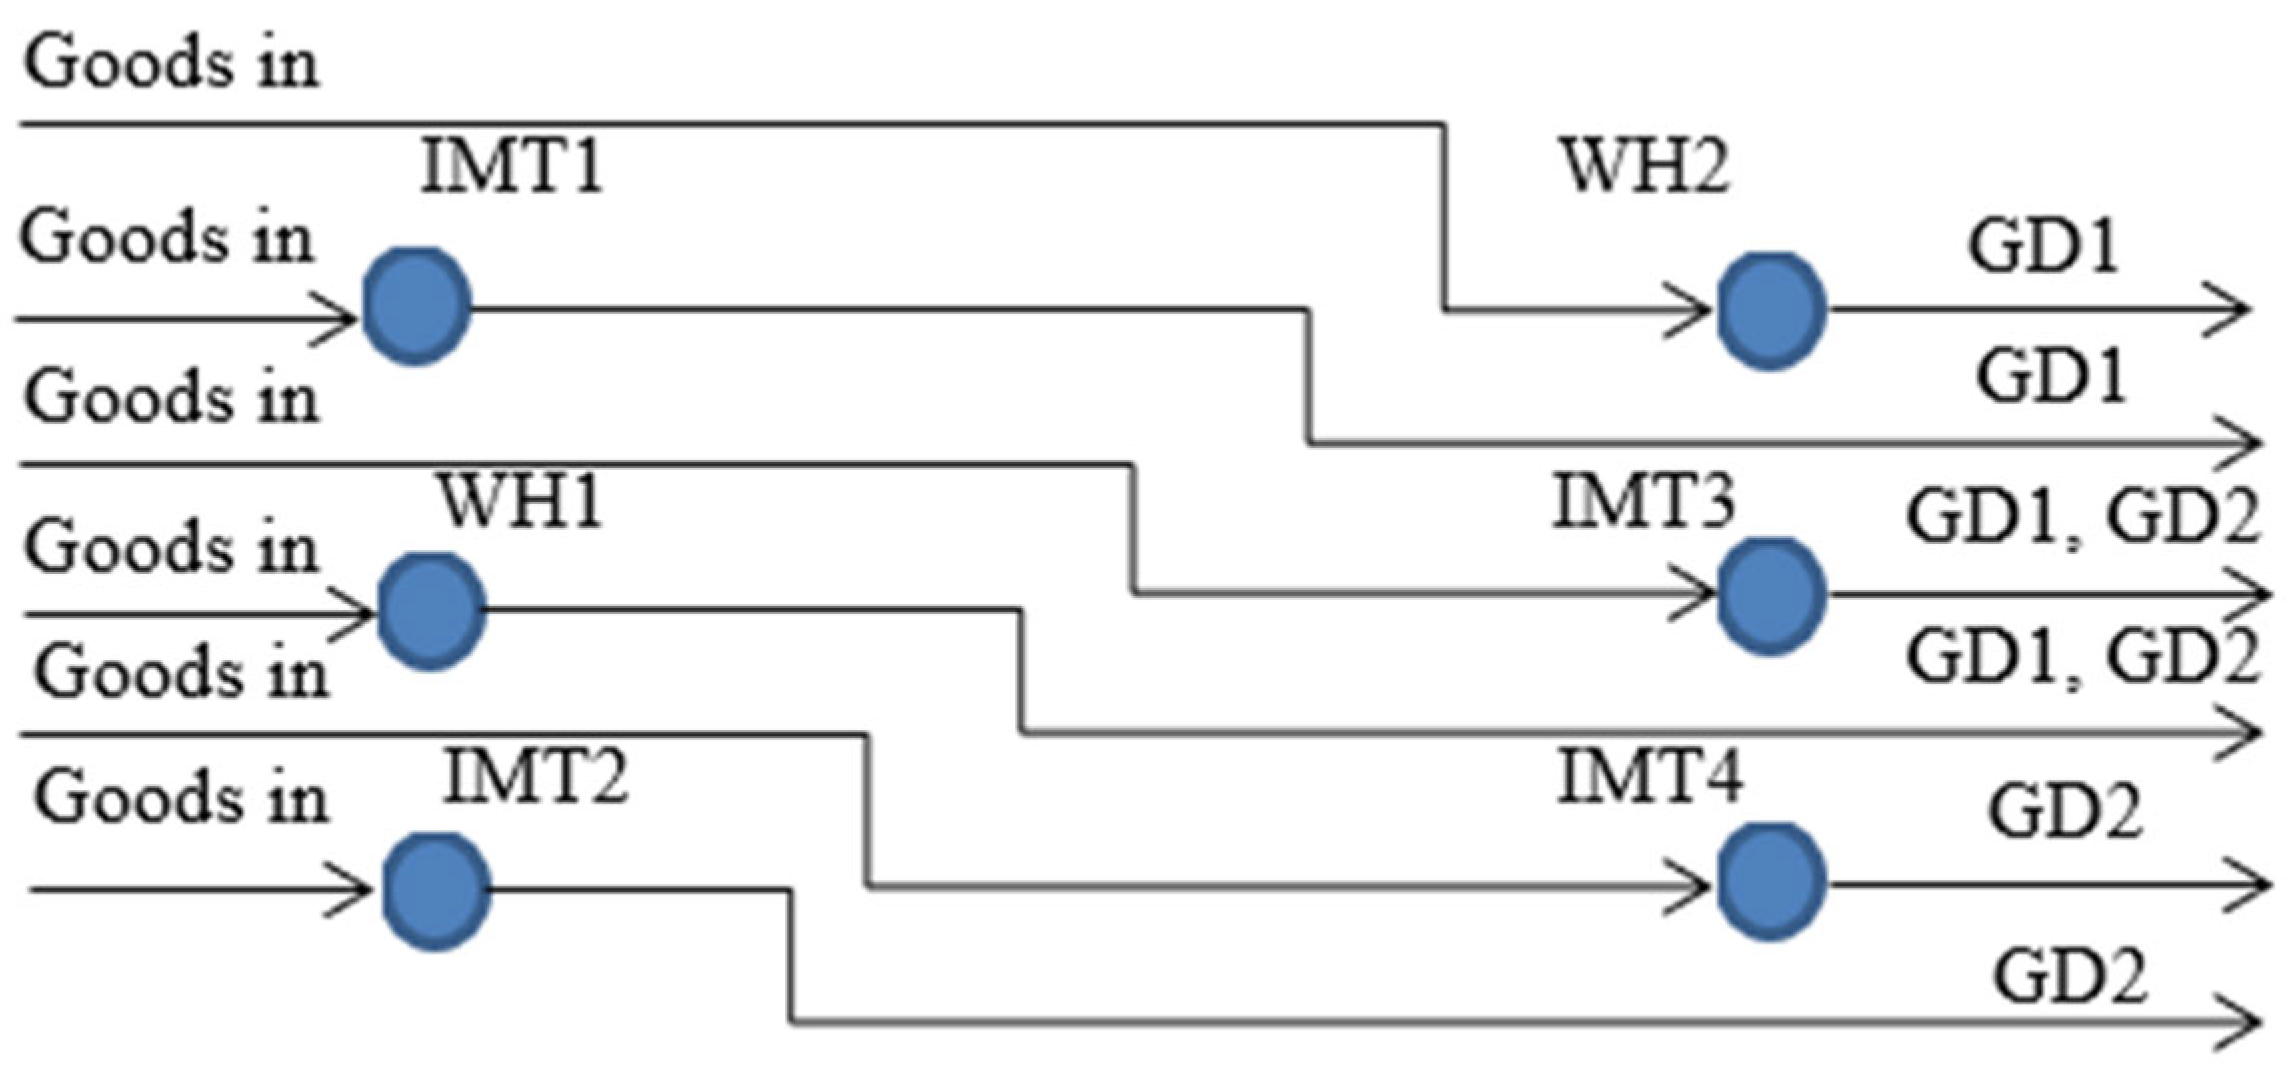
In practice, traditional goods delivery systems are often based on goods transportation through one or two intermodal terminals to ensure their movement to their destination (Figure 3). In the mentioned delivery systems, goods transportation to clients may be complicated; therefore, different solutions could be considered.
In order to find the best solution for logistics services performed using an existing intermodal terminals and warehouses network, the graph theory method was used. The proposed mathematical model incorporates a set of vertices which indicates the possible ways of goods flow between existing intermodal terminals and warehouses, and a set of edges which signifies the intermodal terminals and warehouses as main logistics nodes. The principles of graph theory can be applied for solving various optimization tasks, including optimizing logistics processes [47,48,49,50,51]. On this basis, a graph tree was developed and is expressed as follows (Equation (7)) [47,48]:
G = ( V , E ) ,
where: V —the set of vertices; E —the set of edges.
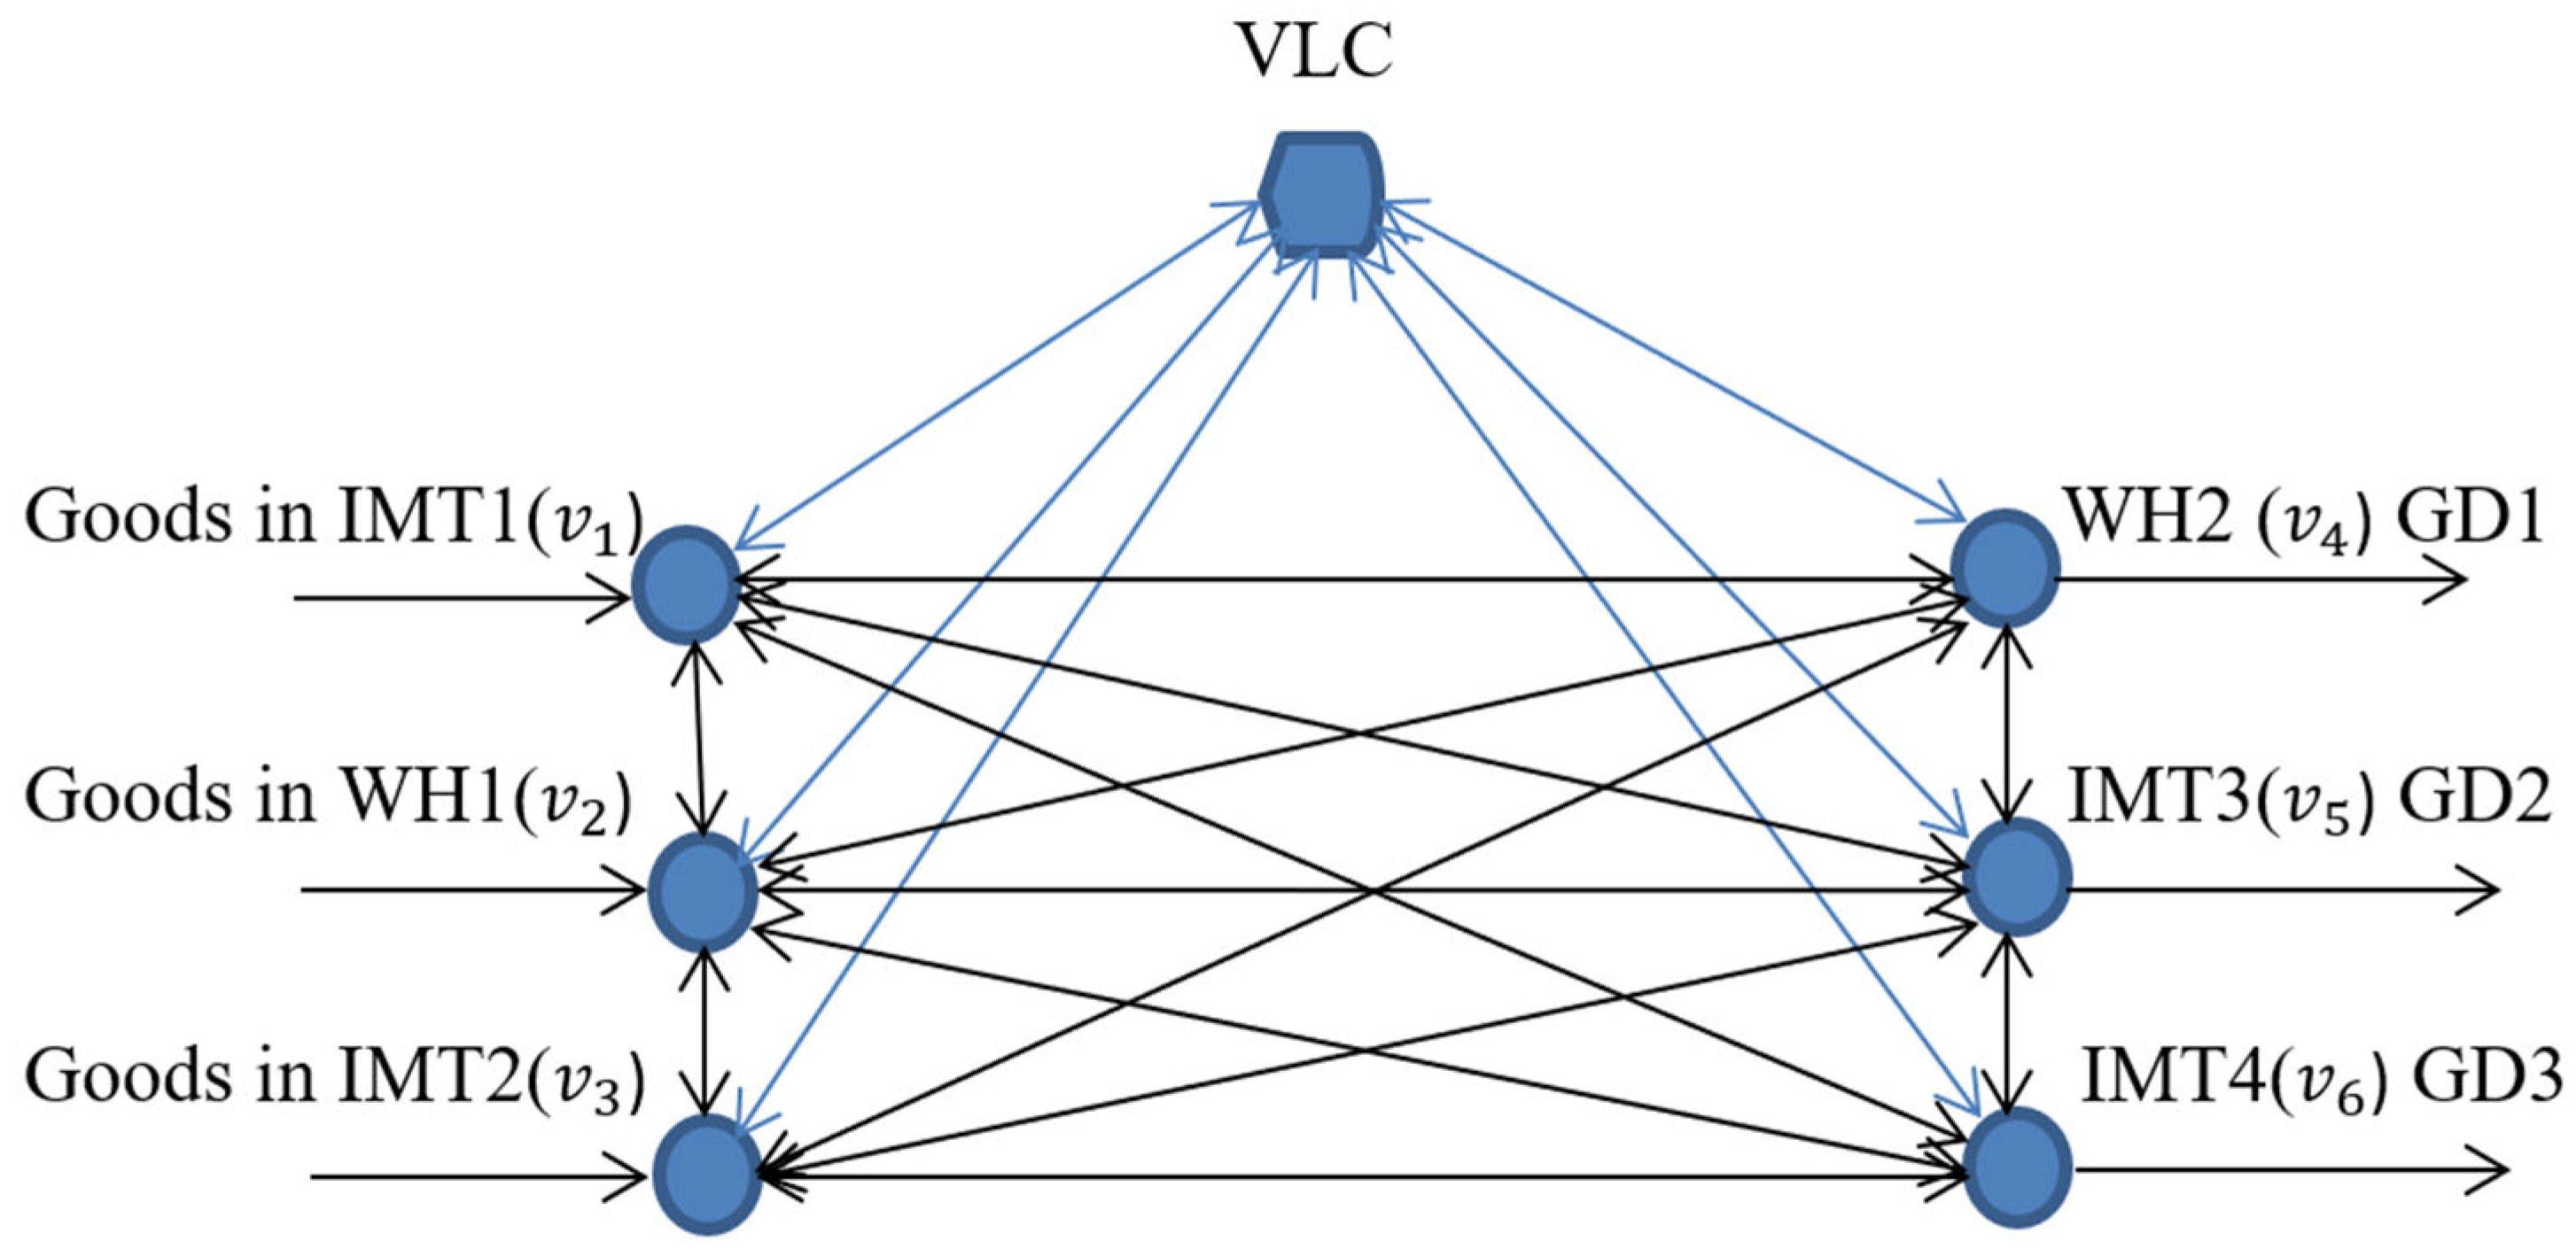
In Figure 4, an example of a graph tree showing the working principal of a virtual logistics center is presented.
In Figure 3, the following abbreviations were used: VLC—virtual logistics center; Goods in—goods arriving at VLC for service operations performed in intermodal terminals and warehouses; IMT1—intermodal terminal one ( v 1 ); WH1—warehouse one ( v 2 ); IMT2—intermodal terminal two ( v 3 ); WH2—warehouse two ( v 4 ); IMT3—intermodal terminal three ( v 5 ); IMT4—intermodal terminal four ( v 6 ); GD1—goods delivery one ( v 7 ); GD2—goods delivery two ( v 8 ); GD3—goods delivery tree ( v 9 ). Blue lines mean VLC services management.
For the graph tree, presented in Figure 4, the sets of vertices and the set of edges can be expressed as follows (Equations (8) and (9)) [47]:
V = { v 1 ,   v 2 ,   v 3 , v 4 ,   v 5 ,   v 6 } ,
V = { ( v 1 ,   v 2 ) v 1 ,   v 4 v 1 ,   v 5 v 1 ,   v 6 v 2 ,   v 1 v 2 ,   v 3 v 2 ,   v 4 v 2 ,   v 5 v 2 ,   v 6 v 3 ,   v 2 v 3 ,   v 4 v 3 ,   v 5 v 3 ,   v 6 v 4 ,   v 5 v 4 ,   v 1 v 4 ,   v 2 v 4 ,   v 3 v 5 ,   v 4 v 5 ,   v 6 v 5 ,   v 1 v 5 ,   v 2 v 5 ,   v 3 v 6 ,   v 5 v 6 ,   v 1 v 6 ,   v 2 v 6 ,   v 3 } .
The incident matrix of all vertices, consisting of direct graph connections provided by the graph tree G , can be presented as it is shown in Equation (10) [4]:
A = a i j ,
where:
a i j = 1 ,   i f   v i   i s   t h e   i n i t i a l   v e r t e x   o f   e j , 1 ,   i f   v i   i s   t h e   t e r m i n a l   v e r t e x   o f   e j 0 ,   i n   o t h e r   c a s e s . ,
For the case study presented in Figure 4, the possible virtual logistics center services network adjacency matrix can be described as follows (Equation (11)) [28]:
A = v 1 v 2 v 3 v 4 v 5 v 6 v 2             v 3             v 4             v 5             v 6                         .
For the graph tree covering the virtual logistics center services network (Figure 4), the matrix mentioned in Equation (10) can be presented as follows (Equation (12)):
A = 0     1     0     1     1     1     1     0     1     1     1     1     0     1     0     1     1     1     1     1     1     0     1     0     1     1     1     1     0     1     1     1     1     0     1     0                                                           .
Matrix (11) could be used for the calculation of time, costs, distribution, and energy demand. Finally, logistics operations optimal price, time, distribution operations, or minimum energy demand in logistics network could be calculated using the following Equation (13) [49,50,51,52,53,54,55,56]:
f : E R + .
In the proposed method, it is also necessary to find a graph tree T = ( V E ) optimal price, minimum time of operations, optimal distribution processes, or minimum energy demand expressed by F ( T ) function that can be calculated applying Equation (14) [57,58,59]:
F ( T ) = x y E f ( x y ) ,
where: f ( x y ) —optimal price, minimum time of operations, optimal distributions processes, or minimum energy demand.
In this regard the edges e = x y E considered as optimal price, minimum time of operations, optimal distribution processes or minimum energy demand could be calculated as follows (Equation (15)) [28]:
f ( e ) = min xy E f ( x y ) .
Based on the proposed graph theory, it is possible to design optimal virtual logistics center operations and plan optimal cargo flow [47,48].
For the analysis and evaluation of the experimental or collected data, it is proposed to use the maximal distribution ( Δ K L ) method [45,51,53,54] to find the possible factors range (band).
Δ K L = Δ I + P k n Δ R ,
where: Δ I —the actual mathematical size of the available factor data; P —probable provision coefficient (if the coefficient is equal to 1—the probability is 68.3%; if the coefficient is equal to 2—the probability is 95.3%, if the coefficient is equal to 3—the probability is 99.7%); k n — the coefficient that depends on the number of measurements; in case the number of measurements is 3, the coefficient is equal to 0.55, when the number of measurements is 4, the coefficient is equal to 0.47, when the number of measurements is 5, the coefficient is equal to 0.43, when the number of measurements is 6, the coefficient is equal to 0.395, when the number of measurements is 7, the coefficient is equal to 0.37, when the number of measurements is 8, the coefficient is equal to 0.351, when the number of measurements is 9, the coefficient is equal to 0.337, when the number of measurements is 10, the coefficient is equal to 0.329, when the number of measurements is 11, the coefficient is equal to 0.325, when the number of measurements is 12, the coefficient is equal to 0.322; Δ R —the distribution of measurement results that means the difference between minimum and maximum values of conducted measurements.
The main scientific contribution of the developed methodology is dealing with application of graph theory, multi-criteria, and comparative methods, while searching for the optimal cargo flow performed using virtual logistics centers. The proposed tool is more accurate compared to other existing methods [15,44,45,46] used for evaluation of optimal logistics services performed using existing intermodal terminals and separate warehouses considering energy demand in particular regions (port and cities regions, in which intermodal terminals and warehouses providing logistics operations are located), as well as clients’ locations.

4. Results

Practical Possibilities to Optimize Logistics Operations Performed Using Virtual Logistics Centers

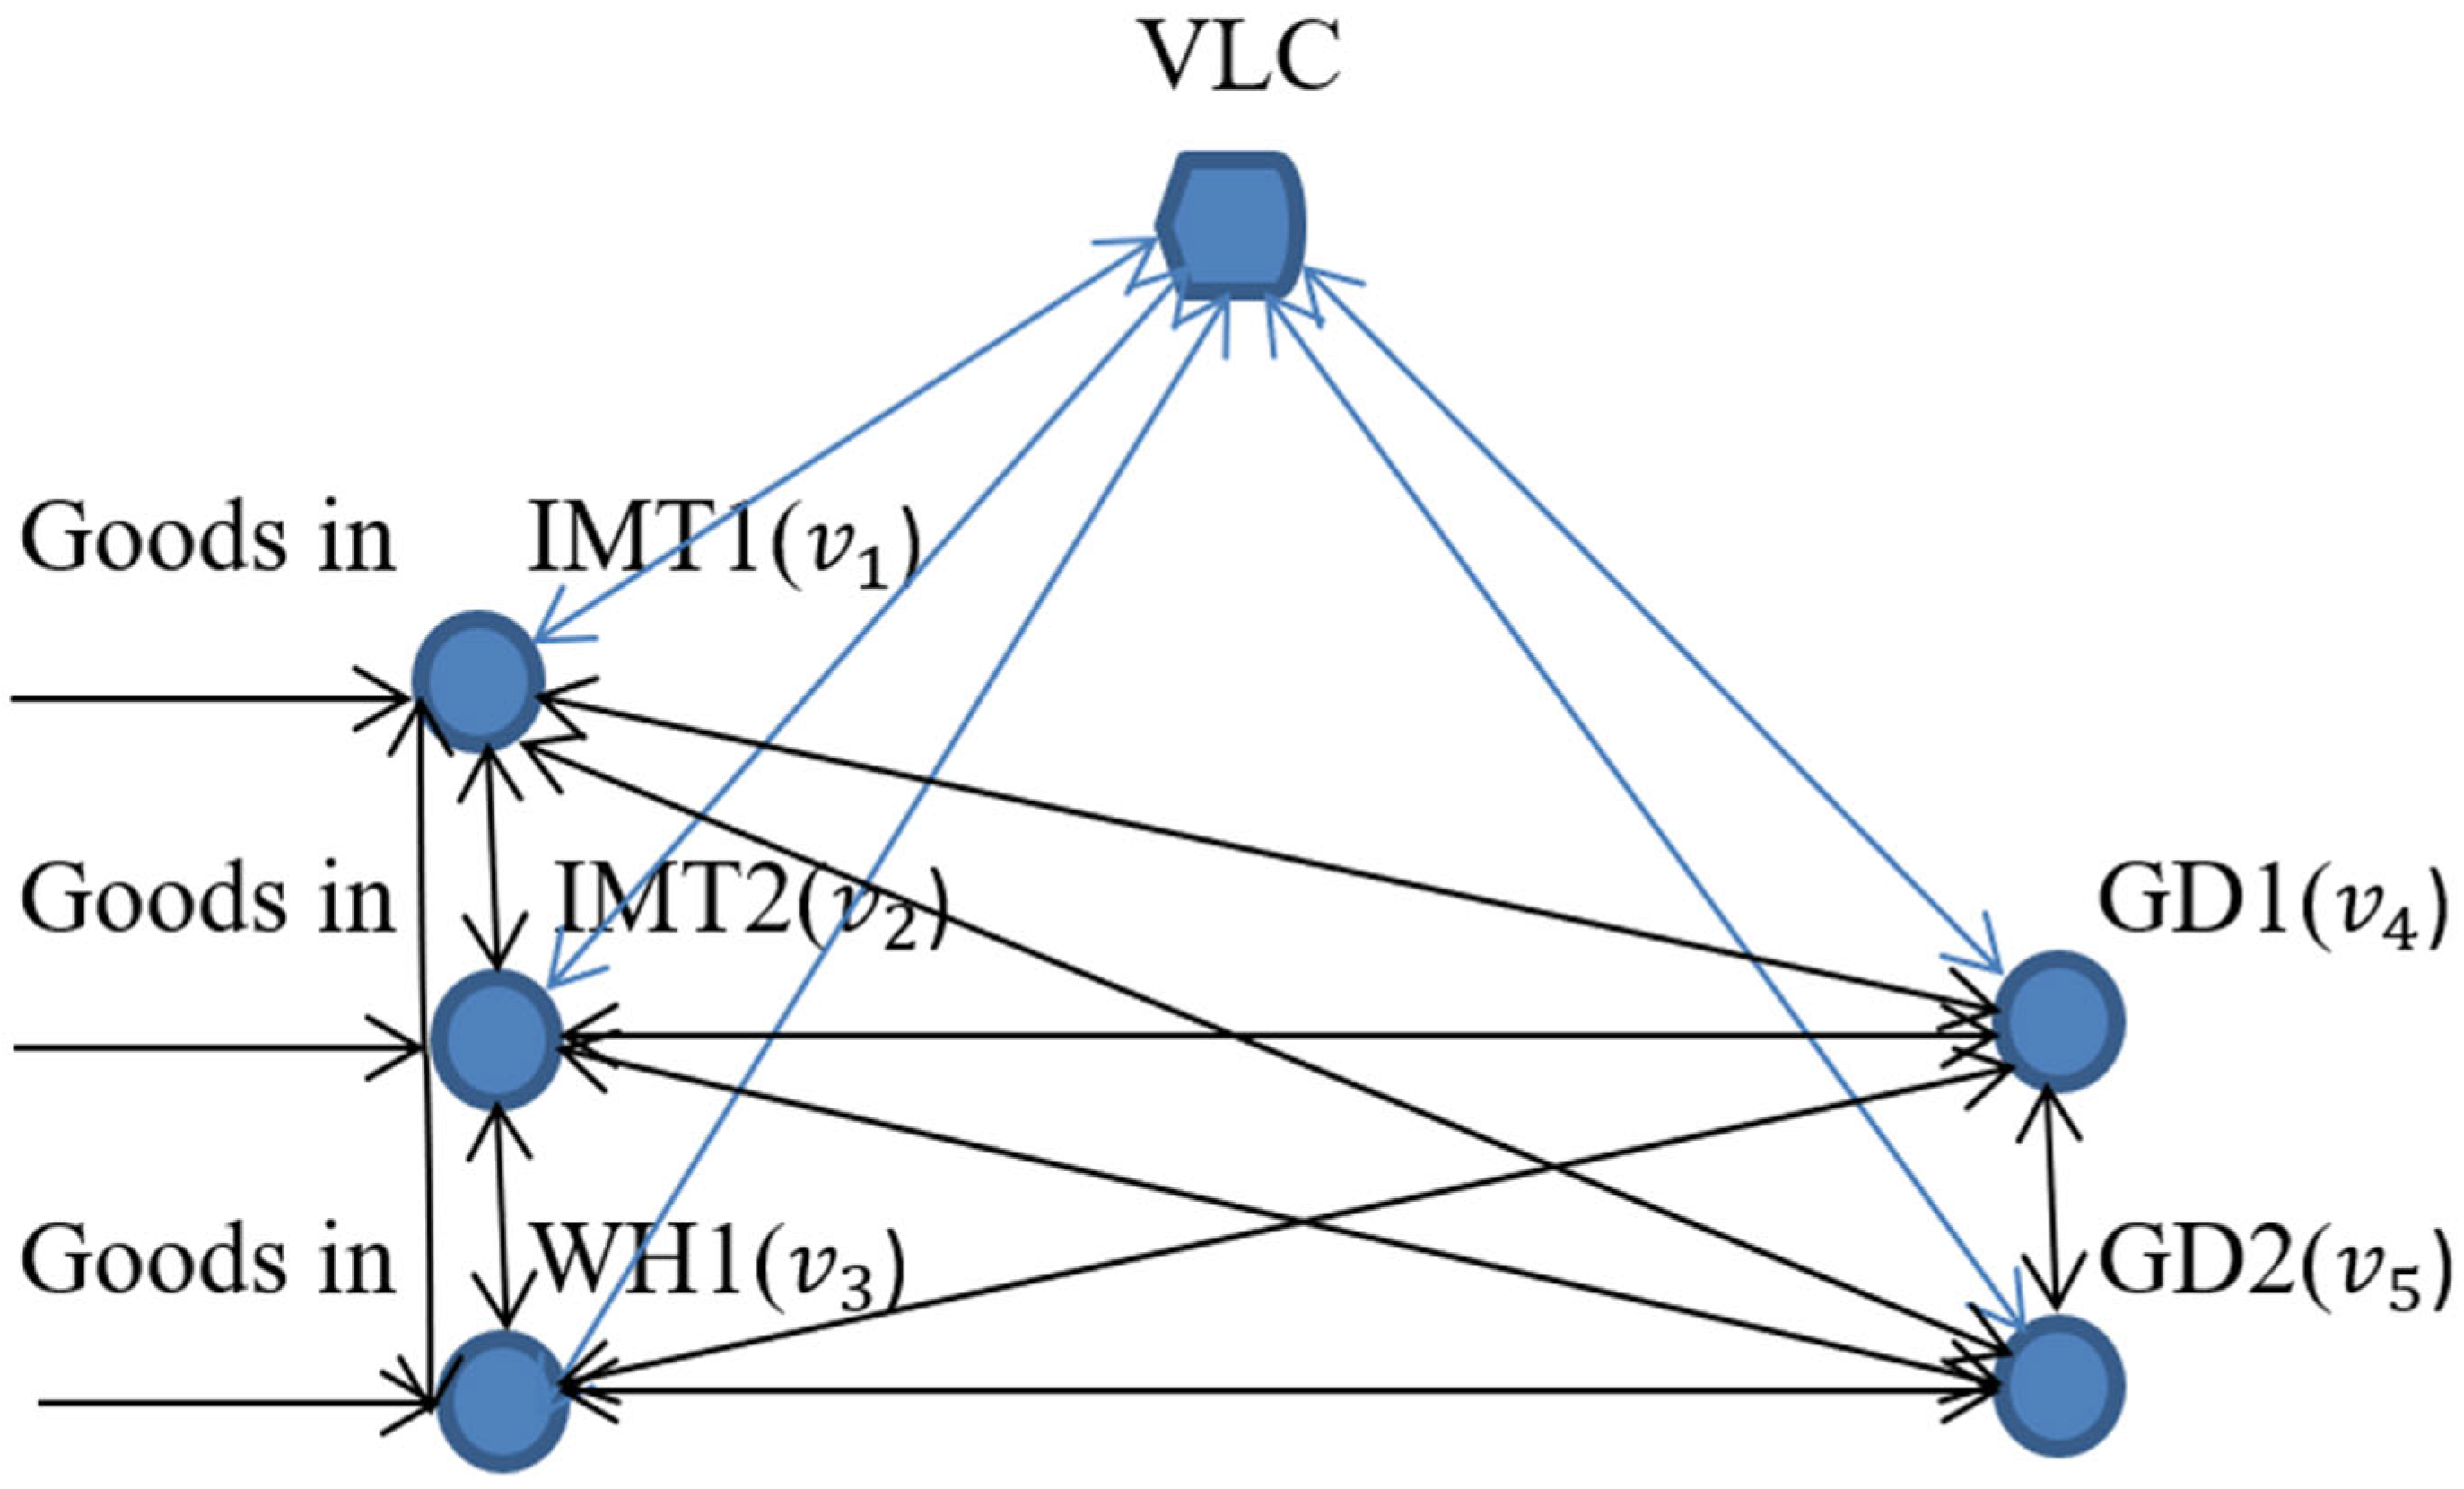
In order to show practical possibilities to implement the developed methodology, the case study was considered (Figure 5). In the Klaipeda region, two intermodal terminals and one warehouse which provide logistics operations were selected. Nowadays, these intermodal terminals and warehouses work separately and do not cooperate regarding logistics services provision, e.g.,: receive and collect goods, prepare consignments, and send them to final recipients. It was assumed that the goods should be delivered to two destinations in the Vilnius region. Additionally, it was set that the part of transported goods should be delivered within the “just in time” principle.
In the Klaipeda region, different volumes of goods are handled in intermodal terminals and warehouses. Therefore, it is necessary to plan these goods delivery enabling both optimum use of transport units (containers, trailers, railway wagons), considering possible goods flow through various intermodal terminals and warehouses, and the ability to perform logistics operations applying all needed logistics functions.
The presented case study (Figure 5) was analyzed in detail to verify the proposed method. It was set that goods flows (“Goods in”) come from a container and Ro-Ro terminals located in the Klaipeda port, then the goods are serviced in intermodal terminals (IMT1, IMT2) and the warehouse (WH1). These goods have to be delivered to two selected destinations in the Vilnius region (GD1, GD2). For this case, the optimization of the delivery may be carried out using the concept of a virtual logistics center, which organizes and manages logistics operations searching for an optimal way of goods movement to final recipients.
The goods flows considered in the analyzed case study are characterized by certain quantities, time, price, and other parameters that can be optimized within a virtual logistics center. This optimization may be performed considering goods movement through intermodal terminals and warehouses, preparing the necessary batches and delivering them to the recipients exactly on time, minimizing the goods transport cost, ensuring sufficient goods safety, and minimizing the energy demand, as well as any negative impact of the transport process on the environment. Depending on the possible delivery schemes, each factor occurrence can be expressed with the help of graph theory presented in Section 3. Individual factors related to the specific case of goods delivery, according to the scheme shown in Figure 5, can be presented using the following matrix (Equation (17)):
A = 0     1     1     1     1   1     0     1     1     1   1     1     0     1     1   1     1     1     0     1   1     1     1     1     0 .
After introducing the data about specific factors occurrence into the matrix, their determinants can be calculated, and the virtual logistics services comparative index can be estimated.
Within the case study, the quantities of delivered goods, which can be transported to the Vilnius region via intermodal terminals and warehouse in the Klaipeda region within 1 year, were estimated. To conduct calculations, it was set that:
  • Through IMT1, 500 tons of goods are transported every week to GD1 (average 9.6 tons per week);
  • Through WH1, 200 tons of goods are moved every week to GD1 (60%, 2.3 tons per week) and GD2 (40%, 1.5 tons per week);
  • Through IMT2, 300 tons of goods are delivered every week to GD1 (30%, 1.7 tons per week) and to GD2 (70%, 4 tons per week).
When applying the system approach to analyze goods delivery to the recipients through individual intermodal terminals and warehouses, it is assumed that at least one vehicle should perform the transport service from each intermodal terminal and warehouse, i.e., about 156 vehicles should travel per year. Considering the transportation distance of about 320 km, about 1920 km (3 vehicles making round trip) are traveled by these vehicles every week and about 99,840 km per year.
Similar assessments can be made for the cost of goods transport, forwarding and distribution of goods, energy demand, and other factors.
Applying a concept of virtual logistics center, it is possible to optimally use transport means and storage areas and, therefore, reduce the amount of vehicles involved in goods delivery (by loading cargo into larger vehicles, ensuring that the vehicle is fully loaded), reduce the goods transport costs, decrease the probability of goods safety loss (shorter distance traveled), reduce the impact on the environment due to the smaller number of vehicles on roads and the shorter distance they travel, as well as improve other parameters.
In order to conduct the experiments, the existing system of goods delivery to recipients was considered. The goods carriages were performed using two intermodal terminals and one warehouse, and vehicles of various sizes (transport capacity from 2 tons to 15 tons) were applied for the delivery of goods in the usual (conventional) scheme using the existing separate work system (SWS) when intermodal terminals and warehouses do not cooperate within the virtual logistics center concept. The experiments were conducted, and the data on 8 goods deliveries were achieved and analyzed in detail.
While solving the tasks of optimal logistics operations planning using the graph theory according to the scheme presented in Figure 5, the two cases of relative service prices were analyzed. It was set that the relative price per unit of goods transported between IMT and WH is 0.2, the relative price of one unit transport between GD1 and GD2 is 0.3, the price of unit transport between IMT1 and GD1 is 1.6, between IMT1 and GD2—1.7, between IMT2 and DG1—1.5, between IMT2 and GD2—1.5, between WH1 and GD1—1.6, and between WH1 and GD2—1.5. The matrix with collected data could be presented as follows (Equation (18)):
A = 0       0.2     0.4     1.6     1.7   0.2     0       0.2     1.6     1.5   0.4     0.2     0       1.6     1.5   1.6     1.5     1.6     0       0.3   1.7     1.6     1.5     0.3       0 = 0.2424 .
Based on the conducted calculations, it was possible to obtain a relative comparative index value of 0.2424 when evaluating opportunities to optimize vehicles’ involvement in transport processes.
In the event that only IMT1 and IMT2 are used, and the same recipients (GD1 and GD2) participate in the goods delivery scheme and there is no possibility to optimize transportation using a virtual logistics center, a relative comparative index value of 0.609 was obtained.
A partially virtual logistics center system was also analyzed (in cooperation with ex-forwarding and transport companies and intermodal terminals, warehouse, and consignees). In this case, vehicles with a carrying capacity of 10 to 15 tons were used, and 5 deliveries of goods were recorded.
The achieved results of the experiments were recalculated for both systems (usual (SWS) scheme) and the virtual logistics center for the servicing of one ton of goods in intermodal terminals and in the warehouse and their delivery to the recipients (Figure 5). The obtained results were handled using the maximum distribution method. After performing detailed calculations, the simulation results for the specified case study were obtained (Table 2, where results calculated for the virtual logistics center are shown in Bold Italic).
The obtained distribution bands of the analyzed factors, assuming a probability ratio of provision equal to 2 (the probability of the scattering bands of the results obtained in this way was 95.3%), using the virtual logistics center system are narrower from 0.5 to 0.98 times (0.98 corresponded to other contingencies, since the virtual logistics center system is new and not well assimilated by the process participants), which means that there is a better reliability of goods delivery to recipients.
The comparative index in the case of an SWS (decomposed goods delivery) and using the capabilities of the virtual logistics center was calculated for the conditions presented in the analyzed case study, applying the following factors’ weight coefficients: costs—0.4, delivery time—0.25, distribution operations—0.1, energy demand (related to emission generation)—0.15, others for unforeseen cases—0.1.
In this way, the comparative index for the SWS was determined as 1.0 (the correlation coefficient was assumed equal to 1), and when using the system of the virtual logistics center, it was 0.80.
It is necessary to note that the weight coefficients of the factors were adopted for a specific situation using an expert method; therefore, they may vary for different regions and must be analyzed separately in each specific case, since the delivery price is very important for some goods. In turn, the delivery time may be significant for other cargo analyzed and so on.

5. Discussion and Conclusions

The conducted research study on virtual logistics centers showed that in various regions of the world, where logistics centers were not developed already, the creation and development of virtual logistics centers may be reasonable, allowing for the optimization of logistics operations. By applying virtual logistics centers, with a minimal investment in the development of logistics infrastructure using existing transport and logistics facilities, it is possible to significantly optimize logistics costs, minimize the time of goods delivery, carry out goods distribution, and significantly reduce energy costs and energy consumption.
It should be noted that the studies presented in the available literature are mostly focused on typical logistics centers operation [28,34]. However, intermodal terminals and individual warehouses developed in individual regions form important infrastructure needed for logistics processes and can cooperate within specific structures, such as virtual logistics centers, aiming to achieve the synergy effect and bring the profits to their clients.
On the basis of the conducted research, the following conclusion can be drawn: the creation of virtual logistics centers in countries and regions where it is difficult to develop typical logistics centers, however, where intermodal terminals and warehouses are already developed, is promising. The possibility of creating a virtual logistics center by combining services performed by the intermodal terminals and warehouses already in operation under a single entity was justified theoretically. The use of virtual logistics centers makes it possible to optimize the costs of logistics and transportation processes, minimize the delivery time of goods, or better organize the delivery of goods applying the “just in time” principle. Moreover, the minimization of number of vehicles in the individual countries’ transport networks influences lower energy demand and the volume of emissions generated by vehicles. Reducing the number of vehicles involved in goods transportation makes it possible to reduce non-standard (emergency) situations on roads and improve the safety of goods delivery.
The presented theoretical framework of the virtual logistics center creation showed the way to optimize logistics operations and receive benefits from cooperation between intermodal terminals and separate warehouses. An appropriate mathematical model was developed based on graph theory. Using the developed approach, the selected case study of intermodal terminals and warehouse cooperation within the virtual logistics center concept in selected regions in Lithuania was analyzed. Based on the achieved results analysis, it could be stated that the developed approach can be applied in practice. Real experiments were conducted to collect the data and calculations for goods flow within separate work systems and a virtual logistics center for the analyzed case study were carried out. Comparing the achieved research results, it was revealed that virtual logistics center implementation may bring benefits, and it is worth applying this concept. However, it is necessary to highlight that application of developed methodology in other countries and regions requires the detailed analysis of a specific region and conditions of services providers cooperation, transport systems development, its flexibility, etc.
Detailed analysis of results obtained for the presented case study showed that the creation of virtual logistics centers, compared to separate work system application, in the analyzed regions is useful and allows to optimize logistics processes. In particular, it is possible to decrease the relative price by about 20%, reduce the relative time by about 30%, reduce the relative costs of distribution by about 50%, reduce the relative costs of energy by about 26%, as well as reduce the costs of the impact of other factors by about 3%.
The obtained calculation results on energy (fuel) demand per ton of goods transported applying the concept of the virtual logistics center show the possibility to significantly reduce energy (fuel) costs and, at the same time, reduce the volume of generated emissions that impact sustainable transport of cargo.
It is necessary to note that the achieved research results are influenced by the values of factor weight coefficients selected for the analyzed case study. These coefficients may differ considering various logistics operations and transportation conditions, pricing, and other factors. In this way, when developing the virtual logistics centers concept, it is necessary to carry out the calculations applying different values of factor weight coefficients to search for optimal logistics solutions for cargo flow between intermodal terminals and warehouses, as well as investigate the use of optimized vehicles in all transport processes.
The research results may be used by forwarders, multimodal transport operators, managers of transport and logistics companies, intermodal terminals, logistics centers, and warehouses, who are willing to cooperate and are searching for optimal logistics solutions that may be applied for the sustainable delivery of goods to recipients. The developed methodology may be used as the decision-making tool supporting the analysis of conditions and benefits for virtual logistics centers creation.
Our future research will focus on further development of the virtual logistics centers concept, as well as investigating the conditions of its application in different countries and regions considering the impact of various external factors.

Author Contributions

Conceptualization, V.P. and D.P.; methodology, V.P. and L.F.-D.; software, V.P.; validation, D.P., L.F.-D. and V.S.; formal analysis, L.F.-D.; investigation, D.P. and B.P.; resources, V.S. and B.P.; data curation, D.P, L.F.-D. and V.S.; writing—original draft preparation, V.P., L.F.-D. and V.S.; writing—review and editing, L.F.-D.; visualization, V.P. and L.F.-D.; supervision, V.P.; project administration, V.P.; funding acquisition, V.P. All authors have read and agreed to the published version of the manuscript.

Funding

This research received no external funding.

Institutional Review Board Statement

Not applicable.

Informed Consent Statement

Not applicable.

Data Availability Statement

Data is contained within the article.

Acknowledgments

The article was developed during the Ludmila Filina-Dawidowicz internship at Klaipeda University (Lithuania) in August 2023.

Conflicts of Interest

The authors declare no conflicts of interest. The funders had no role in the design of the study; in the collection, analyses, or interpretation of data; in the writing of the manuscript; or in the decision to publish the results.

References

  1. Liu, X.; Walsh, J. Development of cross-border e-commerce in the context of China’s foreign trade strategy. City Univ. Res. J. 2019, 9, 776–787. [Google Scholar]
  2. Craighead, C.W.; Ketchen, D.J., Jr.; Darby, J.L. Pandemics and Supply Chain Management Research: Toward a Theoretical Toolbox. Decis. Sci. 2020, 51, 838–866. [Google Scholar] [CrossRef]
  3. Kostrzewski, M.; Filina-Dawidowicz, L.; Walusiak, S. Modern technologies development in logistics centers: The case study of Poland. Transp. Res. Procedia 2021, 55, 268–275. [Google Scholar] [CrossRef]
  4. Çavuşoğlu, D.; Zorba, Y.; Esmer, S. A Set of Criteria for Logistics Center Development: A Fuzzy Analytic Hierarchy Process. J. ETA Marit. Sci. 2022, 10, 47–60. [Google Scholar] [CrossRef]
  5. Baublys, A. Model for distribution of warehouses in the commercial network in optimizing transportation of goods. Transport 2008, 23, 5–9. [Google Scholar] [CrossRef]
  6. Filina-Dawidowicz, L.; Kostrzewski, M. The Complexity of Logistics Services at Transshipment Terminals. Energies 2022, 15, 1435. [Google Scholar] [CrossRef]
  7. Shcherbakov, V.; Silkina, G. Supply Chain Management Open Innovation: Virtual Integration in the Network Logistics System. J. Open Innov. Technol. Mark. Complex. 2021, 7, 54. [Google Scholar] [CrossRef]
  8. Tamas, P.; Illes, B.; Banyai, T.; Toth, A.B.; Akylbek, U.; Skapinyecz, R. Intensifying Cross-border Logistics Collaboration Opportunities Using a Virtual Logistics Center. J. Eng. Res. Rep. 2020, 13, 1–7. [Google Scholar] [CrossRef]
  9. Dutta, P.; Choi, T.-M.; Somani, S.; Butala, R. Blockchain technology in supply chain operations: Applications, challenges and research opportunities. Transp. Res. Part E Logist. Transp. Rev. 2020, 142, 102067. [Google Scholar] [CrossRef]
  10. Modrák, V. Designing and effectiveness of virtual logistics centers. Adv. Logist. Syst. 2008, 2, 75–83. [Google Scholar]
  11. Li, W.; Zhong, Y.; Wang, X.; Cao, Y. Resource virtualization and service selection in cloud logistics. J. Netw. Comput. Appl. 2013, 36, 1696–1704. [Google Scholar] [CrossRef]
  12. Clarke, M.P. Virtual logistics: An introduction and overview of the concepts. Int. J. Phys. Distrib. Logist. Manag. 1998, 28, 486–507. [Google Scholar] [CrossRef]
  13. Foulard, C.; Sandoval, V. Virtual Manufacturing Spaces and Logistics. IFAC Proc. Vol. 2000, 33, 137–140. [Google Scholar] [CrossRef]
  14. Rehman Khan, S.A.; Yu, Z. Future trends in supply chain. In Strategic Supply Chain Management; EAI/Springer Innovations in Communication and Computing; Springer: Cham, Switzerland, 2019; pp. 261–270. [Google Scholar] [CrossRef]
  15. Maggi, E.; Borruso, G. A theoretical framework of the new approach to logistics: Supply chain management. Eur. Transp./Trasp. Eur. 2001, 7, 16–24. [Google Scholar]
  16. Van Baalen, P.J.; Zuidwijk, R.; van Nunen, J. Port Inter-Organizational Information Systems: Capabilities to Service Global Supply Chains. Found. Trends Technol. Inf. Oper. Manag. 2009, 2, 81–241. [Google Scholar] [CrossRef]
  17. Demirova, S. Role of new technologies in logistics processes and expansion of logistics activity with virtual components. In Proceedings of the 13th International Scientific Conference Business and Management 2023, Vilnius, Lithuania, 11–12 May 2023. [Google Scholar]
  18. Van Oosterhout, M. Organizations and flows in the network. In Port Inter-Organizational Information Systems. Capabilities to service Global Supply Chains; Now Publisher: Delft, The Netherlands, 2008; Volume 2, pp. 176–185. [Google Scholar]
  19. Li, S. Structure Optimization of e-Commerce Platform Based on Artificial Intelligence and Blockchain Technology. Wirel. Commun. Mob. Comput. 2020, 2020, 8825825. [Google Scholar] [CrossRef]
  20. Szymonik, A. Logistics and Supply Chain Management; Technical University of Lodz Press: Lodz, Poland, 2012; pp. 308–352. Available online: https://www.researchgate.net/profile/Andrzej-Szymonik (accessed on 25 August 2023).
  21. Lu, L.; Reardon, T. An economic model of the evolution of food retail and supply chains from traditional shops to supermarkets to e-commerce. Am. J. Agric. Econ. 2018, 100, 1320–1335. [Google Scholar] [CrossRef]
  22. Pehlivanis, K.; Papagianni, M.; Styliadis, A. Virtual reality & logistics. In Proceedings of the International Conference on Theory and Applications of Mathematics and Informatics-ICTAMI, Thessaloniki, Greece, 16–18 September 2004; pp. 377–384. Available online: http://www.kurims.kyoto-u.ac.jp/EMIS/journals/AUA/acta8/Pehlivanis-Papagianni-Styliadis.pdf (accessed on 20 August 2023).
  23. Sayed, A.M.; Afia, N. An NPV Optimization Model for Closed-Loop Supply Chain Network Design and Planning. Am. J. Eng. Appl. Sci. 2017, 10, 114–125. [Google Scholar] [CrossRef]
  24. Hong, S.; Mao, B. An interactive logistics centre information integration system using virtual reality. Int. Arch. Photogramm. Remote Sens. Spat. Inf. Sci. 2018, XLII-3, 523–526. [Google Scholar] [CrossRef]
  25. Zhang, H.; Ge, H.; Yang, J.; Su, S.; Tong, Y. Combining affinity propagation with differential evolution for three-echelon logistics distribution optimization. Appl. Soft Comput. 2022, 131, 109787. [Google Scholar] [CrossRef]
  26. Wang, K. Application of Virtual Reality Technology in Higher Vocational Smart Logistics Teaching. J. Phys. Conf. Ser. 2021, 1881, 032041. [Google Scholar] [CrossRef]
  27. Lee, K.L.; Huang, W.C.; Kuo, M.S.; Lin, S.C. Competitiveness model of international DISTRI-PARK using the virtual value chain analysis. J. East. Asia Soc. Transp. Stud. 2001, 4, 313–325. [Google Scholar]
  28. Önden, I.; Acar, A.Z.; Eldemir, F. Evaluation of the logistics center locations using a multi-criteria spatial approach. Transport 2018, 33, 322–334. [Google Scholar] [CrossRef]
  29. Allen, J.; Browne, M.; Woodburn, A.; Leonardi, J. The Role of Urban Consolidation Centres in Sustainable Freight Transport. Transp. Rev. 2012, 32, 473–490. [Google Scholar] [CrossRef]
  30. Bolumole, Y.A.; Frankel, R.; Naslund, D. Developing a Theoretical Framework for Logistics Outsourcing. Transp. J. 2007, 46, 35–54. [Google Scholar] [CrossRef]
  31. Gao, S.; Meng, W. Development of a Personalized Recommendation System for E-Commerce Products for Distributed Storage Systems. Comput. Intell. Neurosci. 2022, 2022, 4752981. [Google Scholar] [CrossRef] [PubMed]
  32. Trojanowski, P.; Filina-Dawidowicz, L. Diagnostic and repair centers locating methodology for vehicles carrying sensitive cargo. Transp. Res. Procedia 2021, 55, 410–417. [Google Scholar] [CrossRef]
  33. Schodl, R.; Eitler, S. Virtual Urban Consolidation Center. Lect. Notes Netw. Syst. 2023, 687, 616–620. [Google Scholar] [CrossRef]
  34. Fechner, I. Logistics Centers in Europe. Polish Logistics Congress “Logistics 2004—Logistics networks on the integrated European market”, Poznań 19–21 May 2004. (In Polish). Available online: https://www.logistyka.net.pl/bank-wiedzy/item/6072-centra-logistyczne-w-europie (accessed on 20 August 2023).
  35. Probierz, J. Logistics centers in Europe. Virtual Logistics Center in Turku. Zesz. Naukowe. Organ. I Zarządzanie/Politech. Śląska 2007, 41, 297–307. (In Polish) [Google Scholar]
  36. Cichosz, M.; Nowicka, K.; Ocicka, B. Collaborative Outsourcing for Sustainable Transport Management. In International Business, Trade and Institutional Sustainability; Leal Filho, W., Borges de Brito, P., Frankenberger, F., Eds.; World Sustainability Series; Springer: Cham, Switzerland, 2020. [Google Scholar] [CrossRef]
  37. Rezaei, S.; Behnamian, J. Benders decomposition-based particle swarm optimization for competitive supply networks with a sustainable multi-agent platform and virtual alliances. Appl. Soft Comput. 2022, 114, 107985. [Google Scholar] [CrossRef]
  38. Ji, Y.; Yang, H.; Zhang, Y.; Zhong, W. Location optimization model of regional express distribution center. Procedia Soc. Behav. Sci. 2013, 96, 1008–1013. [Google Scholar] [CrossRef]
  39. Krstić, M.; Tadić, S.; Elia, V.; Massari, S.; Farooq, M.U. Intermodal Terminal Subsystem Technology Selection Using Integrated Fuzzy MCDM Model. Sustainability 2023, 15, 3427. [Google Scholar] [CrossRef]
  40. Silva e Sousa, R.; Pinho, T.; Simões, D. How Can Customer Experience Improve Retail Operations Sustainability; Springer Proceedings in Business and Economics; Springer: Cham, Switzerland, 2023; pp. 337–346. [Google Scholar] [CrossRef]
  41. Liu, F. Research on the construction of agricultural product virtual logistics enterprise. J. Shanghai Jiaotong Univ. 2016, 21, 63–68. [Google Scholar] [CrossRef]
  42. Agrawal, S.; Singh, R.K.; Murtaza, Q. Disposition decisions in reverse logistics: Graph theory and matrix approach. J. Clean. Prod. 2016, 137, 93–104. [Google Scholar] [CrossRef]
  43. Agrawal, S.; Singh, R.K.; Murtaza, Q. Outsourcing decisions in reverse logistics: Sustainable balanced scorecard and graph theoretic approach. Resour. Conserv. Recycl. 2016, 108, 41–53. [Google Scholar] [CrossRef]
  44. Šakalys, R.; Batarlienė, N. Research on intermodal terminal interaction in international transport corridors. Procedia Eng. 2017, 187, 281–288. [Google Scholar] [CrossRef]
  45. Paulauskas, V.; Henesey, L.; Placiene, B.; Jonkus, M.; Paulauskas, D.; Barzdžiukas, R.; Kaulitzky, A.; Simutis, M. Optimizing Transportation between Sea Ports and Regions by Road Transport and Rail and Inland Waterway Transport Means Including “Last Mile” Solutions. Appl. Sci. 2022, 12, 10652. [Google Scholar] [CrossRef]
  46. Ypsilantis, P.; Zuidwijk, R. Collaborative fleet deployment and routing for sustainable transport. Sustainability 2019, 11, 5666. [Google Scholar] [CrossRef]
  47. Matuliauskas, K. Graph Theory; Vilnius University Publish House: Vilnius, Lithuania, 2010; 21p. (In Lithuanian) [Google Scholar]
  48. Andreae, T. On independent cycles and edges in graphs. Discret. Math. 1996, 149, 291–297. [Google Scholar] [CrossRef]
  49. Bondy, J.A.; Chvatal, V. A method in graph theory. Discret. Math. 1976, 15, 111–135. [Google Scholar] [CrossRef]
  50. Curtis, A.; Izurieta, C.; Joeris, B.; Lundberg, S.; McConnell, R. An implicit representation of chordal comparability graphs in linear time. Discret. Appl. Math. 2010, 158, 869–875. [Google Scholar] [CrossRef]
  51. Fujita, S. Recent results on disjoint cycles in graphs. Electron. Notes Discret. Math. 2005, 22, 409–412. [Google Scholar] [CrossRef]
  52. Eurostat. Freight Transport in the EU-28 Modal Split of Inland Transport Modes. 2017. Available online: https://ec.europa.eu/eurostat/statistics-explained/index.php?title=File:Freight_transport_in_the_EU-28_modal_split_of_inland_transport_modes_(%25_of_total_tonne-kilometres).png&oldid=336869 (accessed on 12 August 2023).
  53. Mouschoutzi, M.; Ponis, S.T. A comprehensive literature review on spare parts logistics management in the maritime industry. Asian J. Shipp. Logist. 2022, 38, 71–83. [Google Scholar] [CrossRef]
  54. Gao, S.; Liu, N. Improving the Resilience of Port–Hinterland Container Logistics Transportation Systems: A Bi-Level Programming Approach. Sustainability 2022, 14, 180. [Google Scholar] [CrossRef]
  55. Martins, V.; Correia, C.; Cunha-Lopes, I.; Faria, T.; Diapouli, E.; Manousakas, M.I.; Eleftheriadis, K.; Almeida, S.M. Chemical characterisation of particulate matter in urban transport modes. J. Environ. Sci. 2021, 100, 51–61. [Google Scholar] [CrossRef] [PubMed]
  56. Heinrich, L.; Koschinsky, A.; Markus, T.; Singh, P. Quantifying the fuel consumption, greenhouse gas emissions and air pollution of a potential commercial manganese nodule mining operation. Mar. Policy 2020, 114, 103678. [Google Scholar] [CrossRef]
  57. Behdani, B.; Fan, Y.; Wiegmans, B.; Zuidwijk, R. Multimodal Schedule Design for Synchromodal Freight Transport Systems. Eur. J. Transp. Infrastruct. Res. 2016, 16, 424–444. [Google Scholar] [CrossRef]
  58. Iheonu, N.O.; Inyama, S.C. On the Optimization of Transportation Problem. Br. J. Math. Comput. Sci. 2016, 13, 1–11. [Google Scholar] [CrossRef]
  59. Castaneda, J.; Ghorbani, E.; Ammouriova, M.; Panadero, J.; Juan, A.A. Optimizing Transport Logistics under Uncertainty with Simheuristics: Concepts, Review and Trends. Logistics 2022, 6, 42. [Google Scholar] [CrossRef]
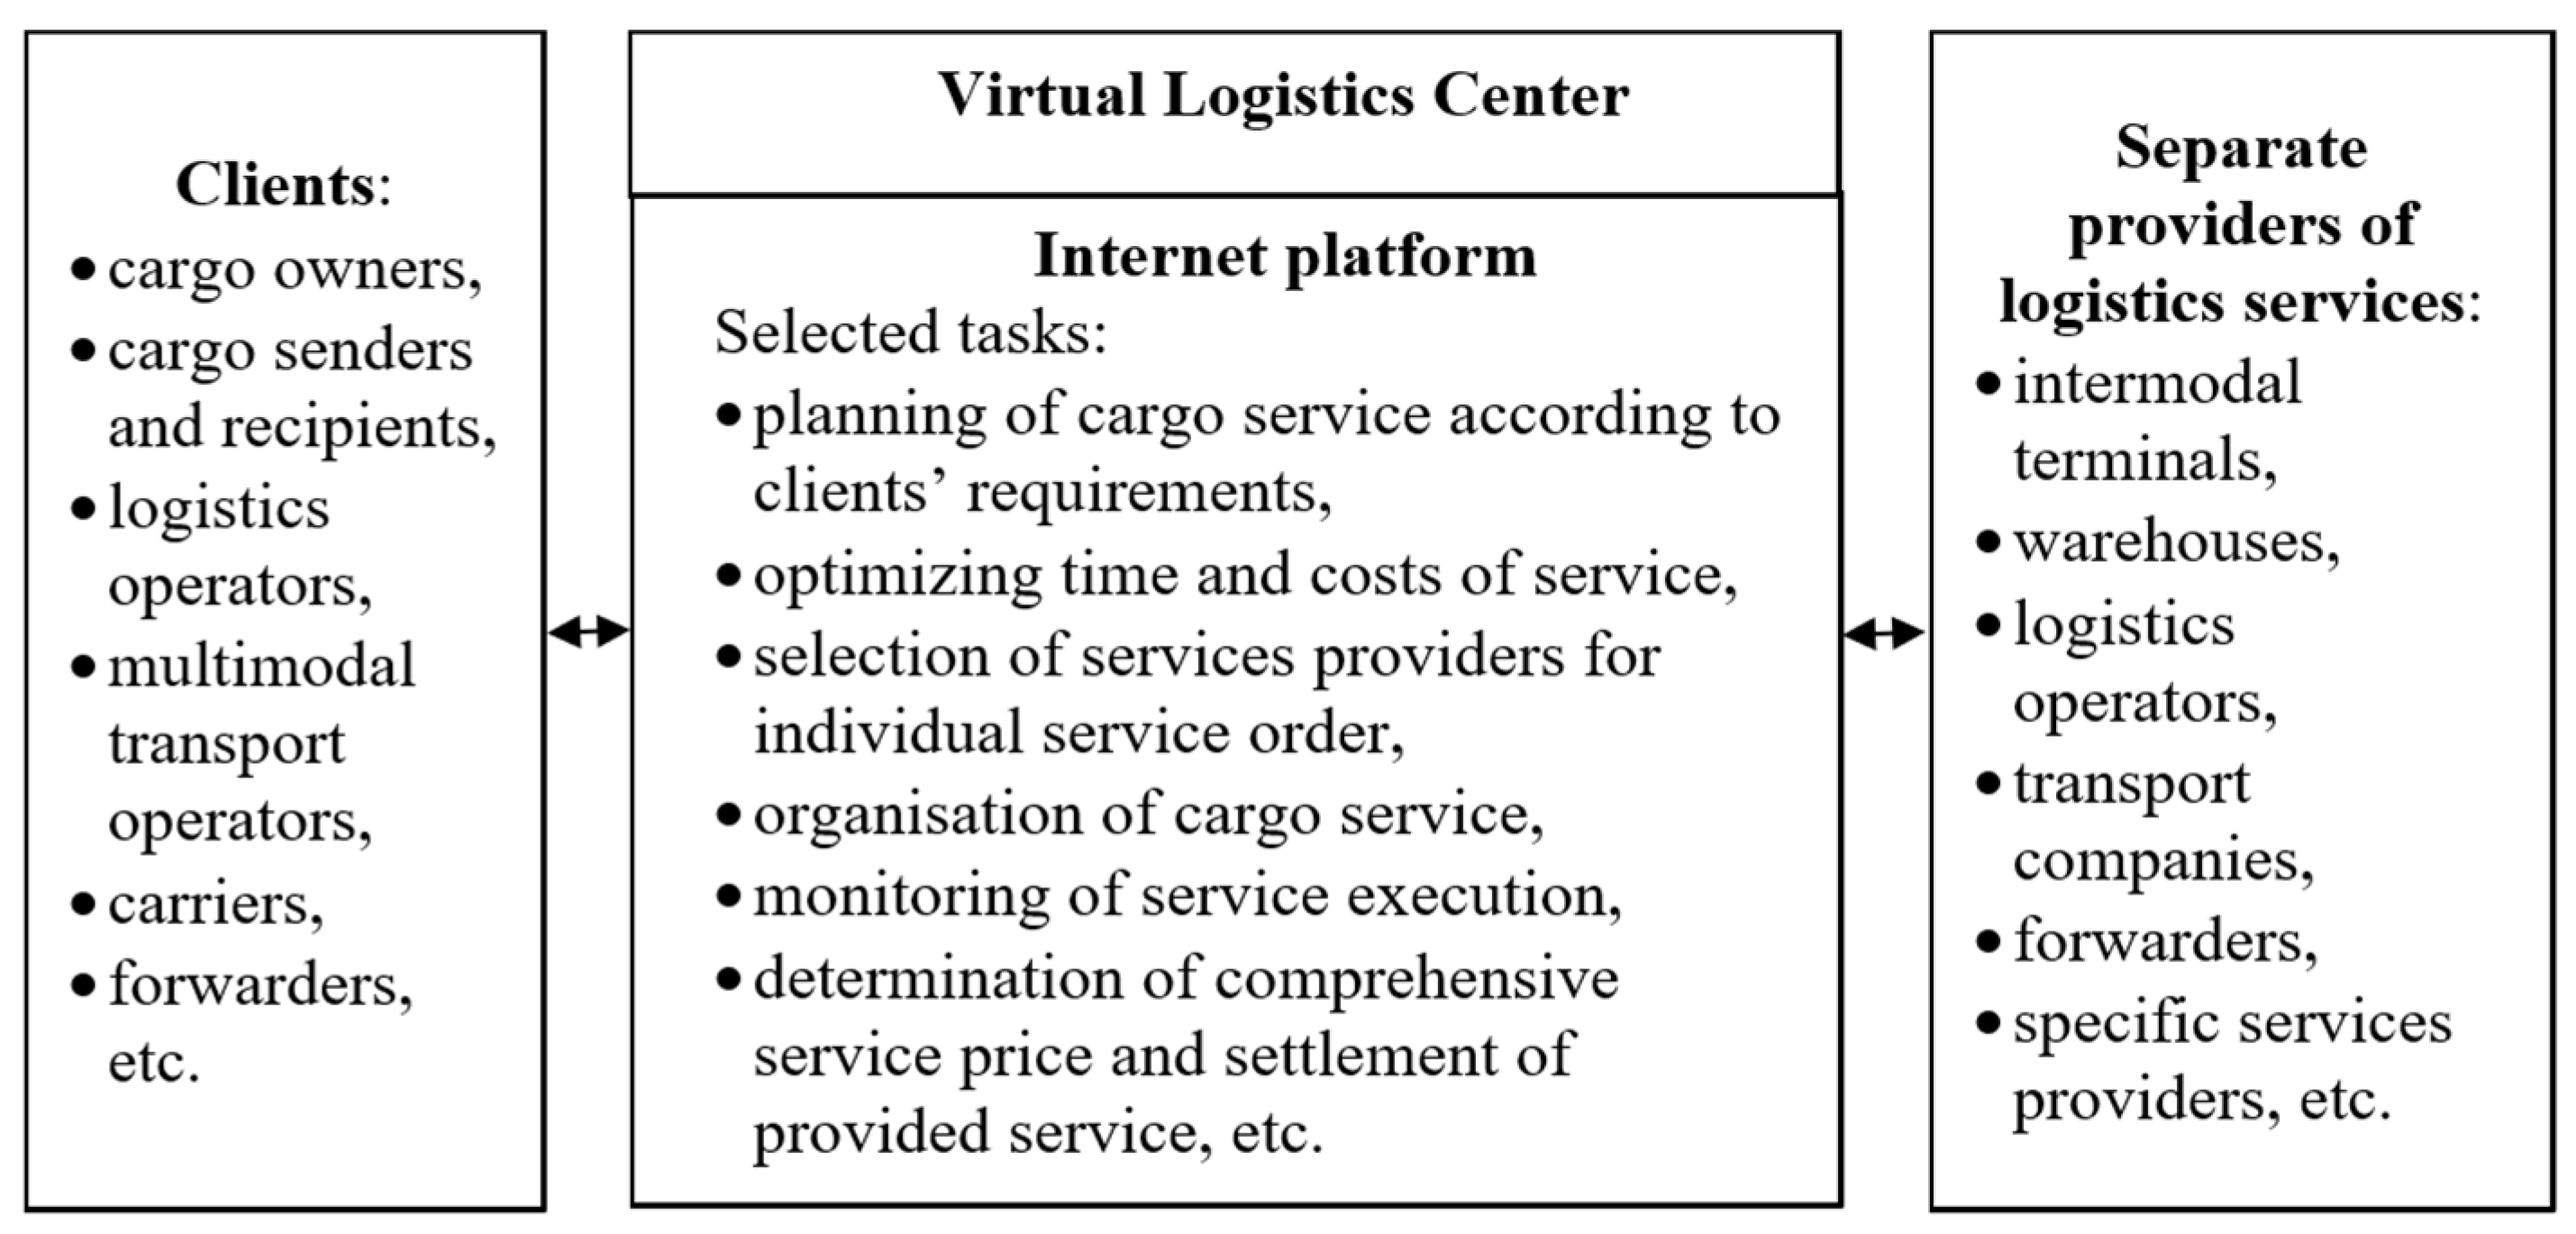
Figure 1. The simplified concept of a virtual logistics center [own elaboration based on [34]].
Sustainability 16 03680 g001
Figure 2. The steps of research methodology [own elaboration].
Sustainability 16 03680 g002
Figure 3. Intermodal terminals and warehouses possible work system [own elaboration], where: IMT1—intermodal terminal one, WH1—warehouse one, IMT2—intermodal terminal two, WH2—warehouse two, IMT3—intermodal terminal tree, IMT4—intermodal terminal four, GD1—goods delivery one, GD2—goods delivery two.
Sustainability 16 03680 g003
Figure 4. The example of a graph tree for a virtual logistics center that performs services using existing intermodal terminals and warehouses [own elaboration].
Sustainability 16 03680 g004
Figure 5. The analyzed case of goods movement using intermodal terminals and warehouses operating within a virtual logistics center [own elaboration].
Sustainability 16 03680 g005
Table 1. Examples of services provided by logistics centers [own elaboration based on [6]].
Service GroupService Example
Basic
-
transport planning and organization,
-
goods storage,
-
cargo handling, including intermodal loading units, etc.
Additional
-
cargo weighing,
-
X-ray (scanning of contents),
-
sorting,
-
packaging,
-
completion/decompletion,
-
cross-docking,
-
cargo state monitoring,
-
additional inspections,
-
customs control,
-
repair and servicing of packaging, etc.
Other services, including value added services
-
assembly of the final product,
-
warranty and post-warranty service,
-
informing the customer about the cargo handling stage,
-
consulting, including calculation of customs duties, port dues rates, determination of optimal sea and rail transport schedules,
-
cargo distribution,
-
e-commerce,
-
post services,
-
certification and expertise,
-
cargo insurance,
-
loan management,
-
consignment structuring,
-
rental of vehicles, semi-trailers, containers,
-
preparation of necessary documentation,
-
organization of exhibitions and workshops,
-
promotion, advertising, marketing, etc.
Table 2. The calculation results on goods delivery to the recipients using the usual schemes and the virtual logistics center.
FactorsSeparate Work SystemVirtual Logistics Center
Separate Work System (SWS) Δ I k n Δ R Δ K L VLC Work System (VLC) Δ I k n Δ R Δ K L
P L , EUR/t6.20.50.350.20.643.70.30.430.20.512
T L , h/t1.80.20.350.10.271.00.10.430.10.186
D L , EUR/t0.50.50.350.10.570.70.20.430.10.286
C L , kg/t7.40.50.350.20.644.10.30.430.20.472
A L , EUR/t0.20.050.350.20.190.40.10.430.10.184
Disclaimer/Publisher’s Note: The statements, opinions and data contained in all publications are solely those of the individual author(s) and contributor(s) and not of MDPI and/or the editor(s). MDPI and/or the editor(s) disclaim responsibility for any injury to people or property resulting from any ideas, methods, instructions or products referred to in the content.