1. Introduction
Amidst the growing awareness of sustainability and its crucial role in fostering a better environment for both present and future generations, an increasing number of industries are aligning themselves with the principles of sustainable production. Sustainability, as defined by the World Commission on Environment and Development, is characterized as “Development that meets the needs of the present without compromising the ability of future generations to meet their own needs” [
1]. Over the past decade, sustainable supply chain management (SSCM) has garnered substantial attention from researchers and practitioners alike, given its emphasis on economic, environmental, and social advancements [
1,
2,
3]. Within SSCM, the process of sustainable supplier selection (SSS) emerges as a critical decision for operations and procurement managers [
1,
2,
4]. The selection of suppliers from a sustainability perspective involves a reevaluation of the traditional supplier selection problem, incorporating economic, social, and environmental criteria alongside the conventional set of criteria [
3,
5]. The selection of sustainable suppliers has garnered increased attention in recent years, underscoring the significance of the current topic [
1,
2,
3,
6,
7,
8,
9,
10,
11,
12]. Specifically, sustainability is gaining importance in the agro-food sector due to the rising demand for food and an increased focus on quality and safety [
4].
The supply chain domain today faces challenges posed by disruptive occurrences, encompassing natural disasters like fires, earthquakes, floods, and other human-made disasters such as transport accidents, labor strikes, and terrorist attacks. These events can threaten supply chain operations [
2,
13]. In response to such circumstances, investments in designing a resilient supply chain have become more necessary than ever [
2,
14,
15]. A resilient supply chain (SC) is defined as the ability of the SC to quickly return to its original state after undergoing disruptions [
13,
15]. Ref. [
16] argues that various resiliency strategies, including flexibility, agility, inventory, and strategic capacity, can be employed to handle disruptions. Given that supplier selection is a strategic decision in the context of the supply chain, it is essential to consider resiliency when choosing the best suppliers to reduce risks during supply disruptions [
2,
13]. Resilient supplier selection has been explored in recent works [
2,
13,
14,
17,
18,
19]. Sustainable supply chains can be affected by disruptive events in today’s dynamic environment. Consequently, the new challenge for managers is designing an efficient supply chain that responds effectively to any disruption and achieves sustainability goals [
20,
21,
22,
23].
Despite the significant intersections between resilience and sustainability concepts, few recent papers, such as those by Refs. [
2,
24,
25], have explored the relationship between these two concepts in supplier selection problems. However, resiliency and sustainability must be considered together to select suitable sustainable suppliers and reduce the consequences of disruptions [
2]. Ref. [
2] introduced a theoretical framework that relies on sustainable and resilient indicators to assist purchasing managers in the selection of optimal suppliers. To achieve this, a fuzzy Inference System combined with Data Envelopment Analysis (DEA) was proposed to identify the best suppliers based on predefined criteria in the literature. In contrast, Ref. [
24] put forth a framework tailored for sustainable global suppliers, accounting for various risks such as currency fluctuations, political instability, and terrorism. Additionally, Ref. [
25] developed a framework for the sustainable and resilient selection of suppliers in the automobile industry, emphasizing the necessity for suppliers to exhibit resilience to natural disasters and human-made disruptions to ensure the company’s competitiveness. All these papers contribute to a general framework for Sustainable and Resilient Supplier Selection (SRSS).
In recent times, agro-food production, specifically milk production, has become a crucial activity in developing countries. However, to the best of our knowledge, there is a notable absence of papers presenting a framework to assist managers in choosing the best farmers based on specific criteria. In this context, the aim of this paper is to identify and evaluate sustainability and resiliency indicators in a case study, focusing on economic, environmental, social, and resiliency criteria.
Supplier selection, in general, poses a complex Multi-Criteria Decision-Making (MCDM) problem, wherein a given number of suppliers are evaluated based on a set of criteria [
23,
26]. Particularly, assessing sustainable and resilient suppliers involves dealing with criteria that often conflict with each other [
23]. The supplier selection process introduces ambiguity and uncertainty, given that precise values for all criteria employed may not be readily available [
26]. In recent years, MCDM techniques have been coupled with various approaches to address conditions of uncertainty. Ref. [
27] suggested that fuzzy numbers based on linguistic variables are one type of technique that can assist decision-makers in determining preferences easily. Consequently, a combination of MCDM approaches and fuzzy set theory (FST) is commonly employed to facilitate decision-making under uncertainty [
26].
The major objective of this study is to develop a new MCDM model for determining appropriate sustainable and resilient suppliers for a milk collection center in Tunisia. The specific objectives include:
Identifying sustainable and resilient criteria for supplier selection in the milk supply chain context.
Identifying the set of alternatives (set of farmers).
Calculating the relative weights of the SRSS evaluation criteria.
Selecting the most sustainable and resilient supplier(s) from a set of farmers in the milk industry.
To achieve these objectives, the developed FAHP-FMABAC hybrid model was applied to select the best farmers for a milk collection center in Tunisia. Initially, the fuzzy Analytic Hierarchy Process (AHP) was developed for weighting criteria. Subsequently, the fuzzy Multi-attribute Border Approximation Area (MABAC) was implemented to select the most suitable dairy farmers. For the dairy farmers’ evaluation, five suppliers were assessed using the hybrid method across twelve criteria, encompassing traditional, sustainability, and resilience criteria along with their sub-criteria. A consistency analysis was conducted to evaluate the consistency of expert opinions, and the methodology’s validation was measured through sensitivity analysis.
The remainder of this paper is structured as follows:
Section 2 provides a summary of the existing literature, covering various evaluation criteria and describing MCDM techniques applied to the supplier selection problem.
Section 3 details the proposed decision methodology. A real application of the methodology and the obtained numerical results are presented in
Section 4. Additionally,
Section 5 illustrates a sensitivity analysis to investigate the validity of the results. Finally, the sixth and last section presents an investigation of the findings and offers suggestions for future research.
2. Literature Review
Supplier selection involves the comprehensive process of identification, screening, evaluation, analysis, and communication with suppliers [
28]. According to Ref. [
29], the best supplier is one who delivers the right product at the right time, in the right place, in the right quantity, and at a competitive price. Originating as a vendor selection problem in 1966 by Dickson, it has been extensively addressed in the past two decades. The supplier selection problem falls under the umbrella of multiple criteria decision-making (MCDM), comprising two key steps: determining appropriate criteria and their relative weights, and ranking suppliers [
1,
10]. A recent systematic literature review on supplier selection by Ref. [
6] highlights five dimensions for formulating the supplier selection problem:
Sourcing Strategy: Categorized based on single or multiple strategies, considering single or multi-period approaches.
Decision Scope: Classified into pure and integrated selection, where integrated selection involves additional decisions like order allocation, inventory management, and transportation.
Decision Environment: Grouped into certain and uncertain environments.
Selection Criteria: Suppliers evaluated based on qualitative and/or quantitative multi-criteria, including green and social criteria for sustainability.
Solution Approach: Framework for classifying methodological approaches, encompassing MCDM methods, optimization, and hybrid combinations with simulation or artificial intelligence methods.
In recent years, the literature has witnessed a surge in attention towards sustainability and resilience in supplier selection. Academics have developed various MCDM techniques to address this issue [
5,
25,
28]. Some authors employ multiple methods, leveraging their outcomes in decision-making processes to gain diverse advantages. This section provides a concise review of recent literature (2016–2023) specific to supplier selection with a focus on sustainability and resilience, highlighting various MCDM methods used to prepare the proposed framework.
Table 1 summarizes the most recent studies conducted on this subject.
The incorporation of sustainability in the supplier selection process has emerged as a significant challenge in recent years. Ref. [
30] defines sustainable supplier selection (SSS) as an extension of the classical supplier selection problem, integrating economic, environmental, and social criteria concurrently to select the best suppliers. Ref. [
3] outlines 13 criteria based on the Triple Bottom Line (TBL) for SSS, proposing Pythagorean fuzzy sets to evaluate criteria under the opinion uncertainty of decision-makers. An integrated Grey Relational Analysis (GRA) Technique through an Order of Preference by Similarity to Ideal Solution (TOPSIS) is then suggested for ranking suppliers. Ref. [
7] develops a fuzzy AHP alongside MABAC, TOPSIS, and Weighted Aggregated Sum Product Assessment (WASPAS) for evaluating and selecting green suppliers based on conventional and environmental criteria. Ref. [
1] combines Interval-Valued Intuitionistic uncertainty linguistic sets with MCDM techniques, using a modified Best Worst Method (BWM) for determining criteria weights and a nonlinear optimization model for assessing sustainable alternatives. For assessing and selecting sustainable suppliers in the meat supply chain, Ref. [
8] employs a two-stage process involving fuzzy TOPSIS for evaluating sustainability performance and a possibilistic multi-objective model for order allocation. Ref. [
30] adopts a compromise solution approach (MACROS) for selecting sustainable suppliers in the medical industry. Ref. [
11] proposes a hybrid approach based on fuzzy Analytic Network Process (FANP) and fuzzy Decision-Making Trial and Evaluation Laboratory (DE-MATEL) for ranking economic, environmental, and social criteria, and fuzzy TOPSIS for prioritizing suppliers in the lamp supply chain. Ref. [
10] introduces a novel hybrid approach, rough-fuzzy DEMATEL TOPSIS, for sustainable supplier selection in a smart supply chain for energy vehicle transmission. Other MCDM methods, including fuzzy-BWM, MULTIMOORA, DEMATEL, CORPAS, and WASPAS, are also applied in the existing sustainable supplier selection literature. These methodologies address various aspects such as objective and subjective criteria weighting, green supplier selection, and the assessment and ranking of sustainable suppliers [
31,
32].
In the contemporary landscape, supply chains are increasingly susceptible to a variety of disruptions, including natural disasters and man-made threats like floods, terrorist attacks, and fires [
2]. Consequently, enhancing the resilience of supply chains has emerged as a novel and critical challenge. Resiliency, in this context, refers to the supply chain’s capability to promptly respond to disruptions, aiming to restore its primary performance or attain a more advantageous state [
17]. Given that suppliers constitute an integral part of the supply chain, their resilience is paramount to minimizing vulnerability and effectively navigating through disruptions. Recently, several studies have suggested a resilient supplier selection problem. Some of these studies include Ref. [
17] which proposed a fuzzy Analytic Hierarchy Process (FANP) to weight criteria in resilient supplier selection problems. Then, a grey VIKOR was used to rank potential suppliers in the Wool and Paper industry. Based on the obtained results findings, several resilience criteria are considered: price uncertainty, time delivery and supplier’s capacity. In addition, Ref. [
33] considered the supply risks and environmental risks for choosing a set of suppliers and allocating orders. A two stage Mixed Integer Programming model was used to minimize costs and to mitigate the negative effects of disruptions for obtaining a flexible sourcing. The most appropriate strategy found by results is the flexibility in supplier’s production capacity. Moreover, Ref. [
34] prioritized resilient suppliers based on four categories of criteria including general, resiliency, manufacturers and cost using integrated QFD (Quality Function Deployment)-AHP. Then, TOPSIS was proposed to select the best resilient suppliers in computer manufacturing companies. Likewise, Ref. [
35] identified resilience strategies such as responsiveness and general strategies like product reliability to evaluate resilient suppliers. In this study, the authors used the fuzzy VIKOR for evaluating suppliers under fuzzy environment. According to Ref. [
36], the uncertainty related to climate change were considered to evaluate food sourcing. In this research, environmental data and weather uncertainties models were used to estimate the suitability and risks associated with each geographical area. Then, this estimated data was developed to calculate the optimal sourcing decisions. Later, Ref. [
18] studied the problem of selecting resilient suppliers in the logistics 4.0 environment by integrating imprecise heterogeneous information. In this paper, the techniques used by authors were fuzzy TOPSIS for evaluating suppliers and multi choice goal programming model to determine optimal order allocation. Furthermore, Ref. [
17] combined Grey DEMATEL-Grey SAW (Simple Additive Weighting) to select resilient suppliers under disruption and vulnerability. By using Grey DEMATEL, the authors evaluated the weight of criteria according to two dimensions of resilience enhancer and reducer respectively. Their findings indicated that the customization was the main key aspect of resilience enhancer and the supplier’s capacity limit is a crucial aspect of resilience reducer. Then, Grey SAW was used to determine the score of each supplier. Finally, the suppliers were clustered into four categories including vulnerable, volatile, resilient, sensitive according to their score.
According to sustainability and resilience as an emerging context of study, Ref. [
2] developed a framework of resilient-sustainable supplier selection problem under disruption state in which criteria were divided into three categories of general, sustainability and resiliency. Firstly, a modular fuzzy inference system was designed to weight sustainability and resilience criteria. Then, a DEA (Data Envelopment Analysis) method was proposed to evaluate suppliers in petroleum industry. In addition, Ref. [
37] identified a set of potential suppliers according to quantitative empirical investigation. Then, a fuzzy VIKOR was proposed to rank suppliers in terms of risks. Finally, a modified DEA was developed to obtain the final ranking of suppliers by proposing the sustainability criteria as inputs and risk measurements as output. Likewise, [
38] proposed a hybrid SWOT-QFD framework for evaluating the most important criteria. Then, different proactive strategies were suggested like contracting with backup suppliers and considering excess capacity for improving resiliency in the supply base. Finally, a new bi-objective two stage mixed possibilistic stochastic programming was developed for selecting suppliers based on mixed sustainability and resiliency objectives. Besides, [
39] evaluated potential suppliers based on three categories of criterion namely basic, resiliency and green by developing a Bayesian Network Model. Resiliency was quantified by absorptive, adaptive and retroactive strategies. Additionally, Ref. [
24] included sustainability criteria and risk concerns to evaluate suppliers by integrating fuzzy AHP with the VIKOR (VIsekriterijumska optimizacija i KOmpromisno Resenje) approach. Furthermore, Ref. [
23] proposed a hybrid fuzzy BWM-GRA-TOPSIS method for sustainable and resilient suppliers in industrial valves context in Iran. The proposed method, firstly, obtained weights by fuzzy Best Worst Method. Then, a TOPSIS approach was combined with grey relational analysis to evaluate the suppliers in a fuzzy environment.
Both single and integrated methods have been proposed for the SRSS problem. A brief literature summary on MCDM models in supplier selection is presented in
Table 1.
Table 1.
A brief recent literature summary of supplier selection.
Table 1.
A brief recent literature summary of supplier selection.
| Authors | Sustainable Criteria | Resilient Criteria | Methodology | Case Study |
|---|
| Economic | Environmental | Social |
|---|
| [27] | | | | | QFD-COPRAS | Dairy industry |
| [17] | | | | | Fuzzy ANP-grey VIKOR | Wood and paper industry |
| [40] | | | | | Fuzzy TOPSIS- AHP | - |
| [41] | | | | | Interval type-2 fuzzy TOPSIS-Haming distance | Battery industry |
| [24] | | | | | Fuzzy AHP-VIKOR | - |
| [42] | | | | | Fuzzy MOORA-FMEA | Electronic company |
| [43] | | | | | Fuzzy BWM-fuzzy TOPSIS | Electronic company |
| [38] | | | | | SWOT-QFD
Bi-objective mathematical model | Automative company |
| [44] | | | | | VIKOR based sorting | electrical equipment manufacturer |
| [2] | | | | | FIS; AR-DEA | Alloy producer |
| [3] | | | | | TOPSIS under interval valued Pythagorean fuzzy sets | - |
| [7] | | | | | Fuzzy AHP
MABAC; TOPSIS; WASPAS | Automative industry |
| [17] | | | | | Grey-DEMATEL
Grey SAW | - |
| [1] | | | | | Fuzzy AHP-fuzzy TOPSIS | Pork meat supply chain |
| [31] | | | | | MARCOS | Health care industry |
| [11] | | | | | Fuzzy ANP-DEMATEL
Fuzzy TOPSIS-Weighted goal programming | Lamp supply chain |
| [18] | | | | | Fuzzy-TOPSIS; Multi-choice goal programming | Numerical illustration |
| [10] | | | | | Rough-Fuzzy DEMATEL-TOPSIS | Energy vehicle transmission |
| [14] | | | | | PCA-DEA | Numerical illustration |
| [12] | | | | | Fuzzy BWM-CoCoSo’B | Home appliance manufacturer |
| [45] | | | | | Fuzzy Best Worst Method | Refinery industry |
| [46] | | | | | Fuzzy AHP-fuzzy DEMATEL | Mining industry |
| [47] | | | | | BWM–fuzzy TOPSIS | Steel industry |
| [48] | | | | | Pythagorean fuzzy AHP-TOPSIS | Agricultural company |
| [49] | | | | | Fuzzy BWM-fuzzy TOPSIS | Electronic manufacturer |
| [1] | | | | | MULTIMOORA with rough numbers | Power bank industry |
| [50] | | | | | Fuzzy DEMATEL-Fuzzy ANP | Palm oil industry |
| [51] | | | | | GST-OPA | Numerical examples |
| [52] | | | | | Fuzzy AHP-TOPSIS | Petrochemical industry |
| [27] | | | | | SWARA-LBWA-MACROS with D-numbers | Wine industry |
| [53] | | | | | Fuzzy AHP-TOPSIS | Shoes manufacturer |
| [26] | | | | | Fuzzy-BWM-CORPAS-WASPAS | Renewable energy supply chain in Iran |
| [23] | | | | | Fuzzy-BWM-GRA-TOPSIS | Industrial valves, fittings and pipes in Iran |
| [31] | | | | | Fuzzy-BWM-MULTIMOORA | Forklift truck manufacturer in China |
| [32] | | | | | Pythagorean fuzzy-DEMATEL | - |
| [25] | | | | | D-number- AHP-DEMATEL | Automobile manufacturing |
| [19] | | | | | Z-number DEA and Artificial Neural Network | Pharmaceutical industry |
| [54] | | | | | Binary Coded
Genetic Algorithm | Supply Chain Management |
The simultaneous incorporation of sustainability and resiliency criteria in the supplier selection (SS) problem within a fuzzy environment has been scarcely explored in the existing literature. Thus, the novelty of this study lies in the development of a hybrid fuzzy decision framework to address this particular problem. In contrast, despite the growing significance of sustainable elements in the agro-food supply chain, such as Greenhouse Gas (GHG) emissions and efficient utilization of natural resources, coupled with the escalating importance of resilience in the face of diverse risks like climate change, there is a notable dearth of related case studies, especially when compared to industries like electronics and automotive, as indicated in
Table 1 [
1]. Against this backdrop, it becomes imperative to contextualize the intricacies of the dairy industry concerning the selection of farmers to ensure efficient, sustainable, and resilient milk production. Consequently, the integrated methodology was implemented in Tunisia to identify proficient farmers based on specific criteria. This research operates within a fuzzy environment, and therefore, fuzzy-AHP-MABAC techniques are integrated to overcome the limitations of each method. Fuzzy-AHP proves adept at handling sustainable and resilient criteria, employing subjective data and facilitating consistent pairwise comparisons through consistency analysis. The inclusion of the relatively new Multi-Criteria Decision Making (MCDM) approach, fuzzy-MABAC, is strategically chosen for optimal supplier selection. The amalgamation of these multifaceted decision analysis systems enhances the efficiency of complex decision-making processes. Consequently, this study aims not only to contribute to the theoretical discourse but also to provide practical insights, enabling decision-makers in the realm of farmer selection to make more informed and effective decisions.
3. Proposed Methodology
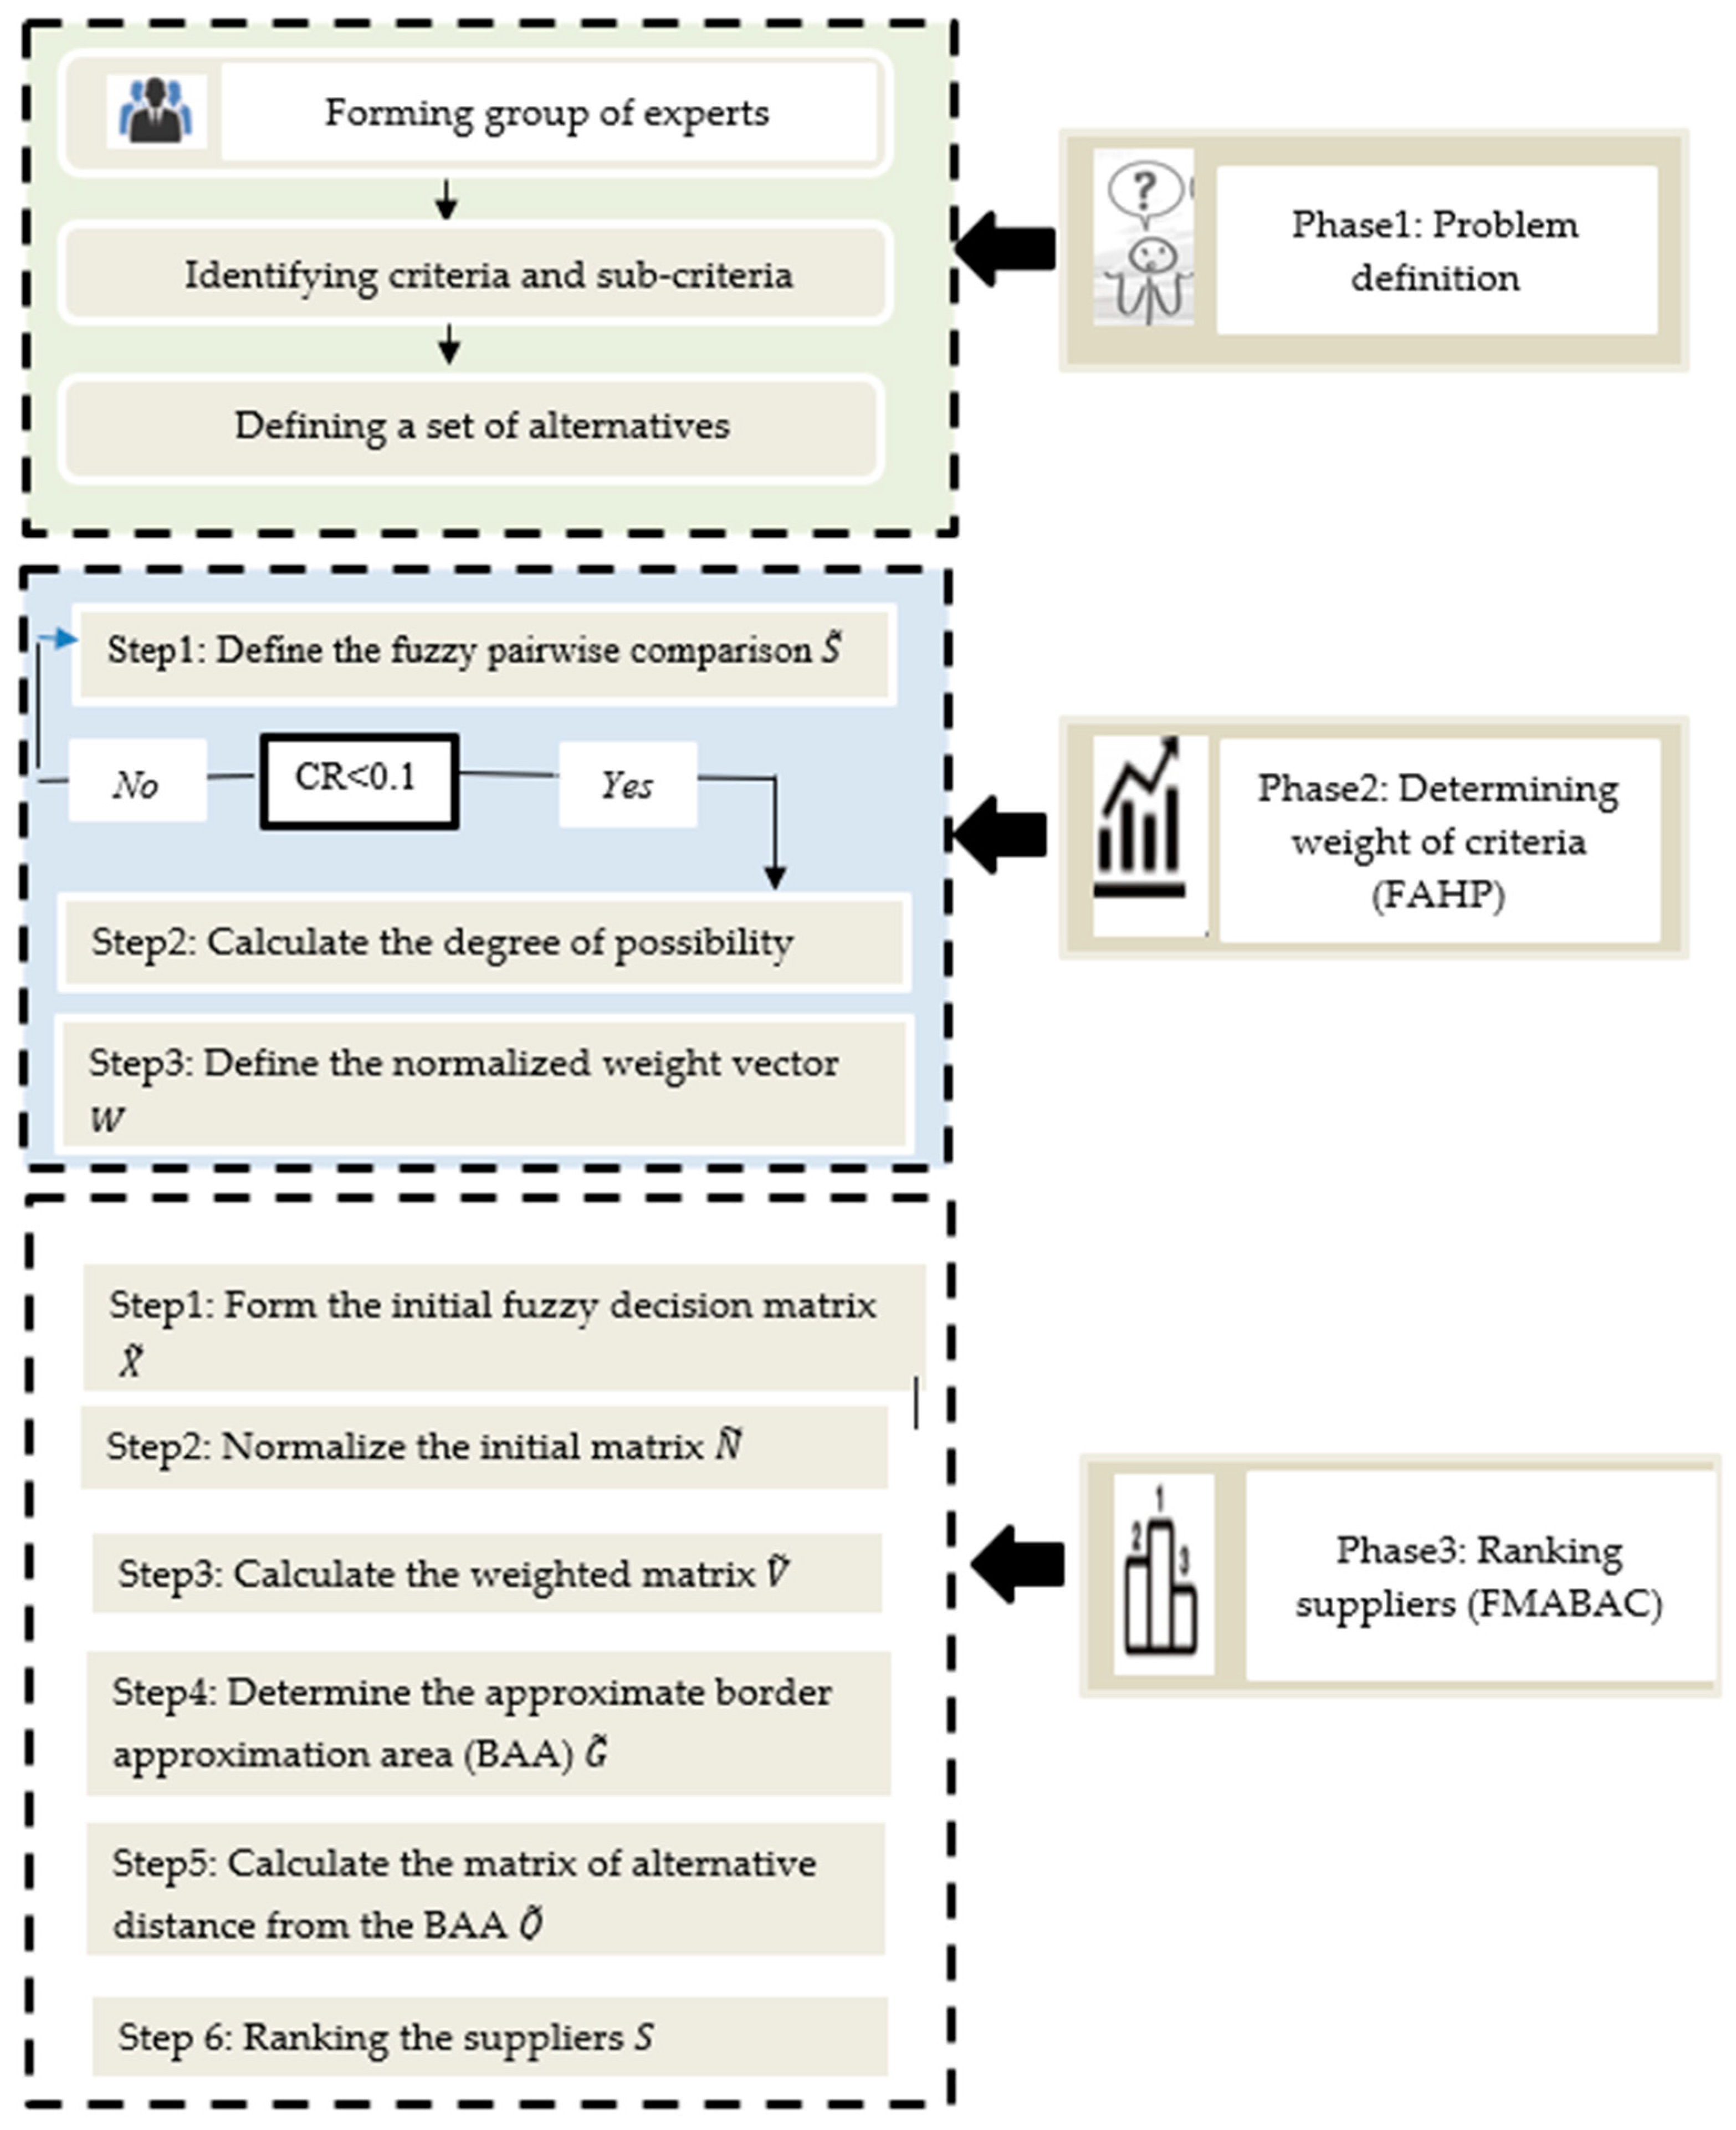
In this section, a new decision model for SRSS under uncertainty is developed. The proposed methodology uses the hybrid AHP-MABAC and the fuzzy set theory to represent the human vagueness when making judgments to identify sustainable and resilient suppliers. The flowchart of the proposed framework is presented in
Figure 1. The following three steps are listed:
Phase 1 (Problem definition): Identify criteria and sub-criteria based on literature review and experts ‘opinion and define set of suppliers [
1,
55,
56].
Phase 2: Compute the weight of sustainable and resilient criteria using fuzzy AHP method. In this technique, researchers based on pairwise comparisons [
1,
55,
56].
Phase 3: Rank the suppliers using fuzzy MABAC method by utilizing the obtained weights derived from phase 2 [
7].
A general model of SRSS is formed with the selection of one of
potential alternatives
, which evaluated and compared on the basis of
identified criteria
. A group of experts are formed to evaluate the significance importance of criteria and the performance of suppliers. A group of experts are formed to evaluate the significance importance of criteria and the performance of suppliers. In decision making problems, the use of linguistic scales is more meaningful to the real life [
57]. In such cases, using fuzzy set theory is one of way to manage uncertainty. Recently, fuzzy set theory (FST) is integrated with MCDM methods for solving complex decision-making problems under uncertain environments [
7]. FST has been introduced by Ref. [
58] to handle the imprecision and vagueness related to human judgments. The most important terms in FST are linguistic, membership functions, fuzzy operators and fuzzy inference systems [
2]. Here, let
is a universe of discourse; the fuzzy set
in
is defined as:
where
denotes the membership function of each element
in
[
59].
Definition 1. Triangular fuzzy number (TFN).
Let a TFN
is represented by
which
and
mean the lower and upper value of fuzzy number presented by
and
is the modal. The membership function
is defined as:
Definition 2. The operational rules between two TFNs.
Suppose there are two arbitrary TFNs
and
, the few algebraic operations that can be applied on
and
are listed as follows:
Definition 3. Linguistic variables.
Linguistic variables are defined by Ref. [
58] as linguistic labels of fuzzy sets. There are used when crisp data are not sufficient to define the real-life situation [
60] and can be used quantified by using TFN. For instance, the relative importance of each criterion can be defined by decision maker (DM) using linguistic terms such as “Equally preferred”, “Weakly preferred”, “Fairly strongly preferred”, “Very strongly preferred” and “Absolutely preferred” and converted to TFN as shown in
Table 2. Hence, the evaluation of alternative can be defined as linguistic terms such as “Very good”, “Good”, “Fair”, “Poor” and “Very poor” and converted to TFN as presented in
Table 3.
Definition 4. De-fuzzify the fuzzy numbers.
The defuzzification can be performed via the next expressions [
63].
3.1. Identify the Weighs of Criteria
In this phase of the proposed model, the criteria weights are determined based on expert opinions. In practical scenarios, decision-makers often face challenges in assigning weights to criteria that involve uncertainty. Consequently, pairwise comparisons are frequently preferred in decision-making processes [
12]. The Analytic Hierarchy Process (AHP), initially introduced by Ref. [
64], employs pairwise comparisons to calculate the relative weights of criteria in relation to the main goal, utilizing a predefined scale. It has found extensive application in resolving multi-criteria decision-making problems, including resource allocation, vendor selection, and risk assessment, owing to its robustness and ease of implementation for prioritizing diverse factors [
57]. AHP decomposes complex problems into hierarchical levels such as the main goal, main criteria, sub-criteria, and alternatives. However, a notable limitation of this method is its incapacity to handle uncertainty and imprecision in decision-making, as it relies on crisp numbers in its scale. To address this limitation, Fuzzy AHP (FAHP) was introduced by Ref. [
65] as a fuzzy extension of AHP, incorporating fuzzy set theory and extent analysis method to manage fuzziness in the decision process. This approach utilizes triangular fuzzy numbers instead of the nine-point scale employed in traditional AHP for computing criteria weights. Over the recent years, there has been a growing trend in the literature towards the utilization of this method. For an in-depth exploration of various FAHP techniques applied to decision-making problems in the industry, interested readers are directed to a comprehensive literature review recently published by Ref. [
1]. The construction of a fuzzy AHP model involves establishing the comparison matrix, consolidating multiple judgments, assessing consistency, and defuzzifying the fuzzy weights [
1]. In this study, the fuzzy AHP method employed is adapted from the works of Refs. [
1,
55,
56] and is implemented using the following steps:
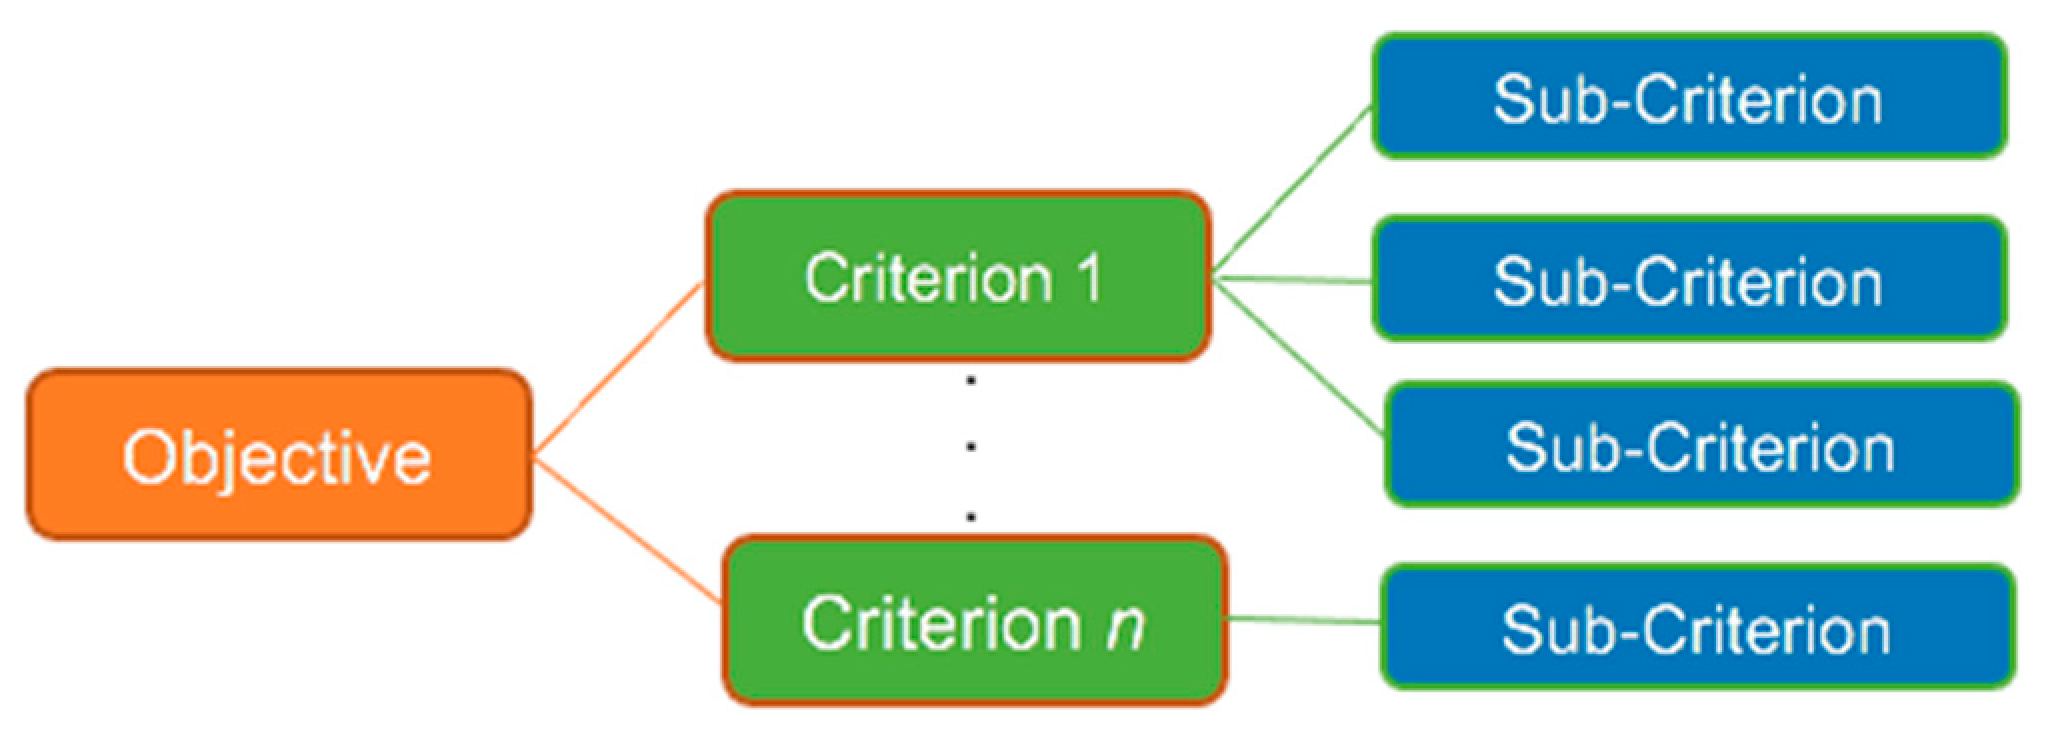
Step 1: Define the problem’s hierarchy structure.
The main objective of this step is to decompose the problem into hierarchy including the goal in the top level (determine the relative importance of each criterion), criteria and sub-criteria in the second level and bottom level respectively to design the FAHP process tree structure as shown in
Figure 2.
Step 2: Construct the fuzzy pairwise comparison matrices.
First, the decision-makers compared the various elements at a given level of the hierarchy with respect to the main goal by using linguistic variables to make pairwise comparison. Then, the linguistic variables are converted into triangular fuzzy numbers. Five TFNs
are used in our study where
denotes an equal importance while
denotes an extremely relative importance. A reciprocal value is assigned to the inverse comparison, i.e.,
where
denotes the importance of the
element compared to the
element [
61]. Therefore, the general fuzzy judgement matrix
obtained through pairwise comparison can be expressed as follows [
56].
with
and
are the fuzzy numbers.
After generating all matrices of pairwise comparison between criteria, the aggregated fuzzy matrix is obtained by Equations (4)–(6) according to [
66]).
where
,
and
are the lower limit value, the most suitable value and the upper limit, respectively of the decision maker
.
After the aggregated pairwise comparison matrix was formed, the consistency of pairwise comparison shall be defined by using the calculation method of consistency index and consistency ratio in crisp AHP. This test is performed in order to ensure that the given expert’s inputs are consistent. In fuzzy AHP, the test consistency ratio is performed after de-fuzzification process. To this end, the fuzzy pairwise matrix is converted into crisp matrix by using the
equation [
55].
Then, the consistency ratio (CR) is calculated by the method in crisp AHP [
55] using the following Equation (7).
where
.
If the obtained CR is less than 0.1, the level of inconsistency considered is acceptable. Otherwise, the decision maker should review the value of judgment.
Step 3: Calculate the degree of possibility .
Firstly, the value of fuzzy synthetic extent with respect to
ith criterion is defined as:
with
Then, the degree of possibility of
can be defined as
where
represents the highest intersection between two fuzzy numbers and expressed mathematically as in Equation (9).
Then, the weight vector given by
is calculated as follows.
Step 4: Define the normalized weight vector .
Via normalization, the normalized weight vector of the fuzzy comparison matrix is given to define the weight of each criterion over another where W is a non-fuzzy number.
3.2. Rank the Sustainable Resilient Suppliers
The Multi-attribute border approximation area comparison (MABAC) method is one of the most recent method of multi-criteria decision-making (MCDM) [
67]. It is first introduced by [
68] at the research center at the University of Defence in Belgrade in forklift evaluation. The main advantage of this method compared to other MCDM tools is its practical, reliable, and stable solutions to complex problems) as well as its flexibility and adaptability to combining with other methods [
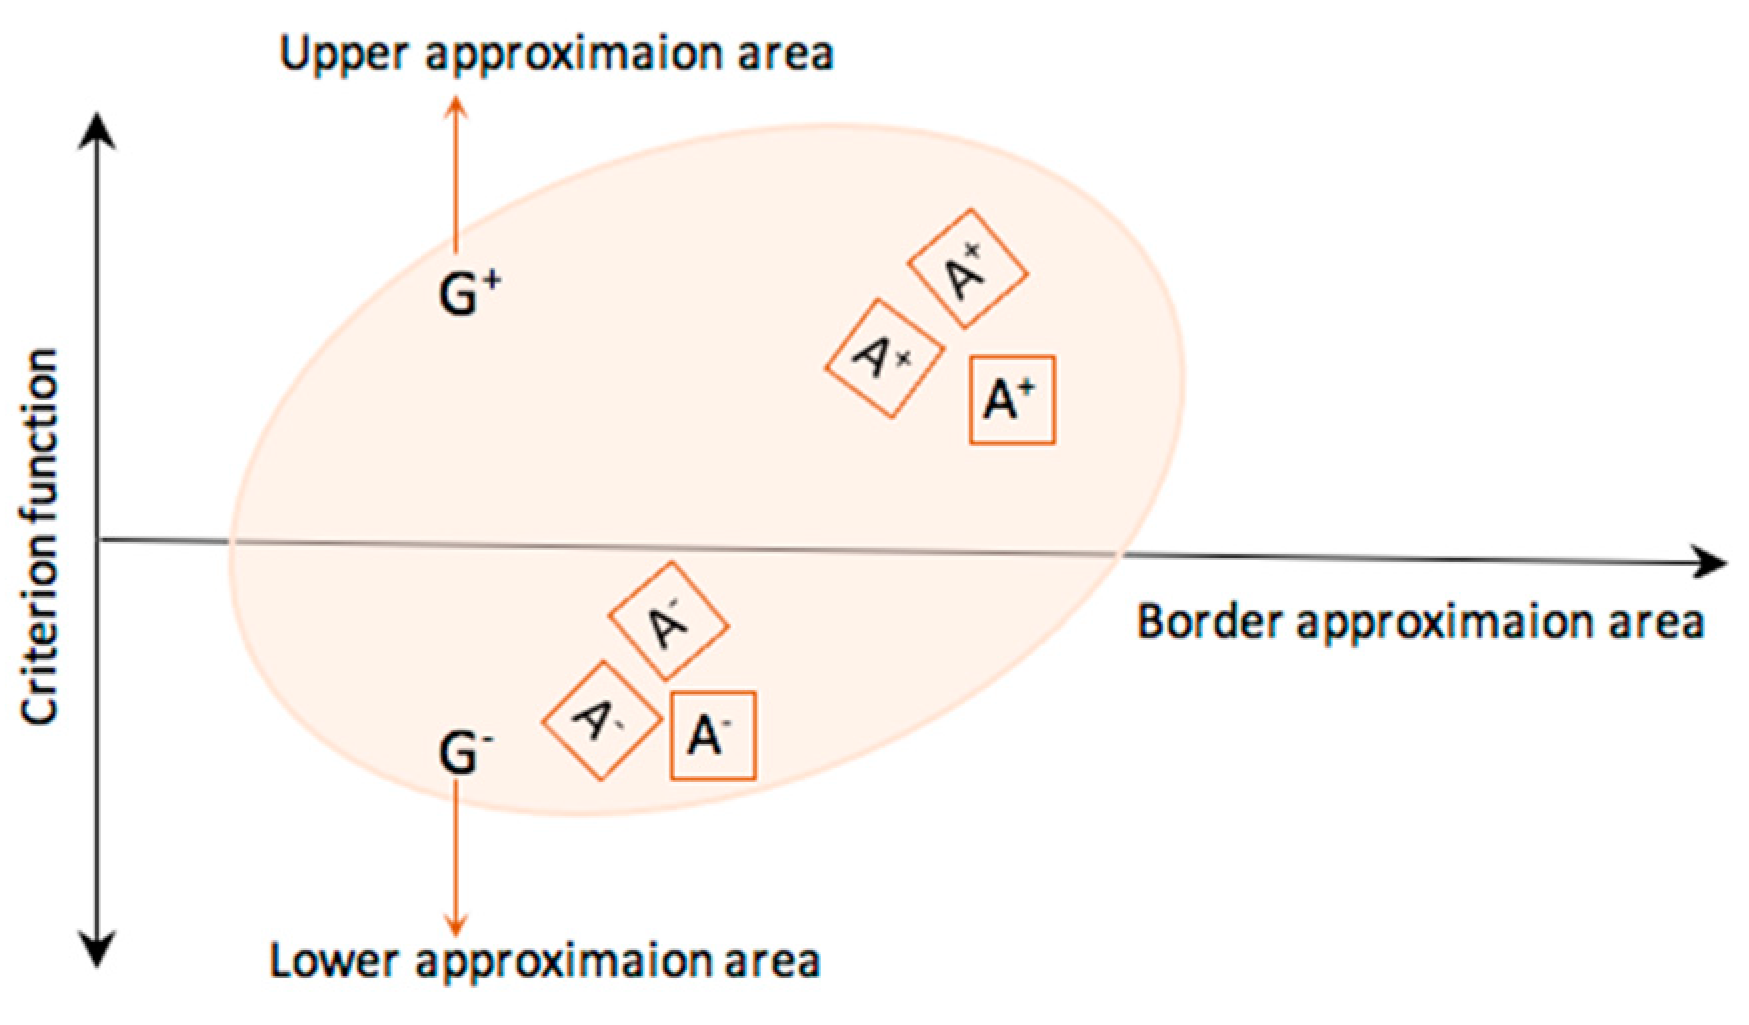
67]. The main idea of this decision-making method is focused on the definition of the distance of the criterion function of each alternative from the border approximation area [
68].
Figure 3 exhibits the border
, lower
, and upper
approximation areas [
7,
69]. Due to its simple computation procedure and the consistency of solution, several applications and modifications of the original MABAC with the aim of solving numerous problems in the area of multi-criteria decision-making are proposed in literature. For instance, Ref. [
67] proposed interval-valued fuzzy rough number integrated with BWM (Best-Worst method) and MABAC for selecting optimal fire helicopters. Ref. [
67] used Interval rough AHP and interval rough MABAC for evaluating university websites under uncertainty. In their study, Ref. [
70] developed an extension of MABAC with intuitionistic fuzzy rough numbers to rank suppliers for medical services. Ref. [
7] suggested a hybrid methodology Fuzzy AHP –Fuzzy MABAC for selecting green suppliers under fuzzy environment in automotive industry. In Ref. [
59], the authors extended MABAC under fuzzy environment for assessing the risk of rock burst in Chine. Bozanic et al., 2019 proposed FUCOM-Fuzzy MABAC to select of the most favorable location for construction of single span Bailey bridge.
The modified fuzzy MABAC method used in this paper is adapted from Ref. [
7]. The mathematical formulation and implementation of the fuzzified MABAC technique are presented in six steps as follows.
Step 1: Define the problem’s hierarchy structure.
In the first step, the evaluation of
m alternatives
is performed with respect to n evaluation criteria
. The initial matrix
is constructed where
indicates the value of the
i-th alternative according to the
j-th criterion
.
Step 2: Obtain the Normalized decision matrix
.
The elements of the normalized matrix are determined as follows:
where
,
and
represent the elements of the initial decision matrix
, for which
and
are defined as follows:
represents the maximum values of the “right distribution of fuzzy numbers” of the observed criterion according to the alternatives.
represent the minimum values of the “left distribution of fuzzy numbers” of the observed criterion according to the alternatives.
Step 3: Calculate the weighted matrix .
The elements
of the weighted matrix
are determined as follows:
where
represent the elements of the normalized matrix
,
represents the weighted coefficients of the criterion. Using the Equation (16), the weighted decision matrix
can be obtained by:
Step 4: Determine the approximate border area matrix .
Using Equation (16), the border approximate area for every criterion is determined by:
where
represent the elements of the weighted matrix
,
m represents a total number of alternatives. After calculating the value of
by criteria, a matrix of border approximate areas is obtained in the form
(
n represents total number of criteria by which the selection of the offered alternatives is performed) as
.
Step 5: Calculate the matrix elements of alternatives distance from the border approximate area .
The distance of the alternatives from the border approximate area
is defined as the difference between the weighted matrix elements
and the values of the border approximate areas
.
The value of alternative
may belong to the border approximate area
, to the upper approximate area
, or to the lower approximate area
, that is,
. The upper approximate area
represents the area in which the ideal alternative is found
, while the lower approximate area
represents the area where the anti-ideal alternative is found
as presented in
Figure 3. The membership of alternative
to the approximate area
is defined on the basis of the following expressions:
For alternatives to be selected as the best in the set, it is necessary to have as many criteria as possible belonging to the upper approximation area . The higher the value indicates that the alternative is near or equal to the ideal alternative, while the lower the value indicates that the alternative is closer to the anti-ideal alternative.
Step 6: Rank alternatives.
The calculation of the values of the criteria functions by alternatives is obtained as the sum of the distance of alternatives from the border approximate areas
. By summing up the matrix
elements per rows, the final values of the criteria function of alternatives are obtained.
where
n represents the number of criteria, and
m is the number of alternatives. In the last step, by defuzzification of the obtained values
, the final rank of alternatives is reached. The defuzzification can be performed via the Equation (2).
4. An Implementation of Proposed Methodology
4.1. Short Description of the Case Study
The applicability and feasibility of the proposed integrated method are demonstrated in the Tunisian milk collection center. To the best of our knowledge, there are no studies in the field of selecting sustainable and resilient dairy farmers. The dairy supply chain holds a crucial position in the global agro-food sector in Tunisia, contributing to employment opportunities, economic growth, and environmental impact [
71]. Agro-food decision-makers in Tunisia face numerous challenges, including natural resource scarcity, climate change, and market fluctuations, among others. For instance, Tunisia is recognized as one of the driest countries with low water availability per capita per year, making sustainable water use a pressing challenge [
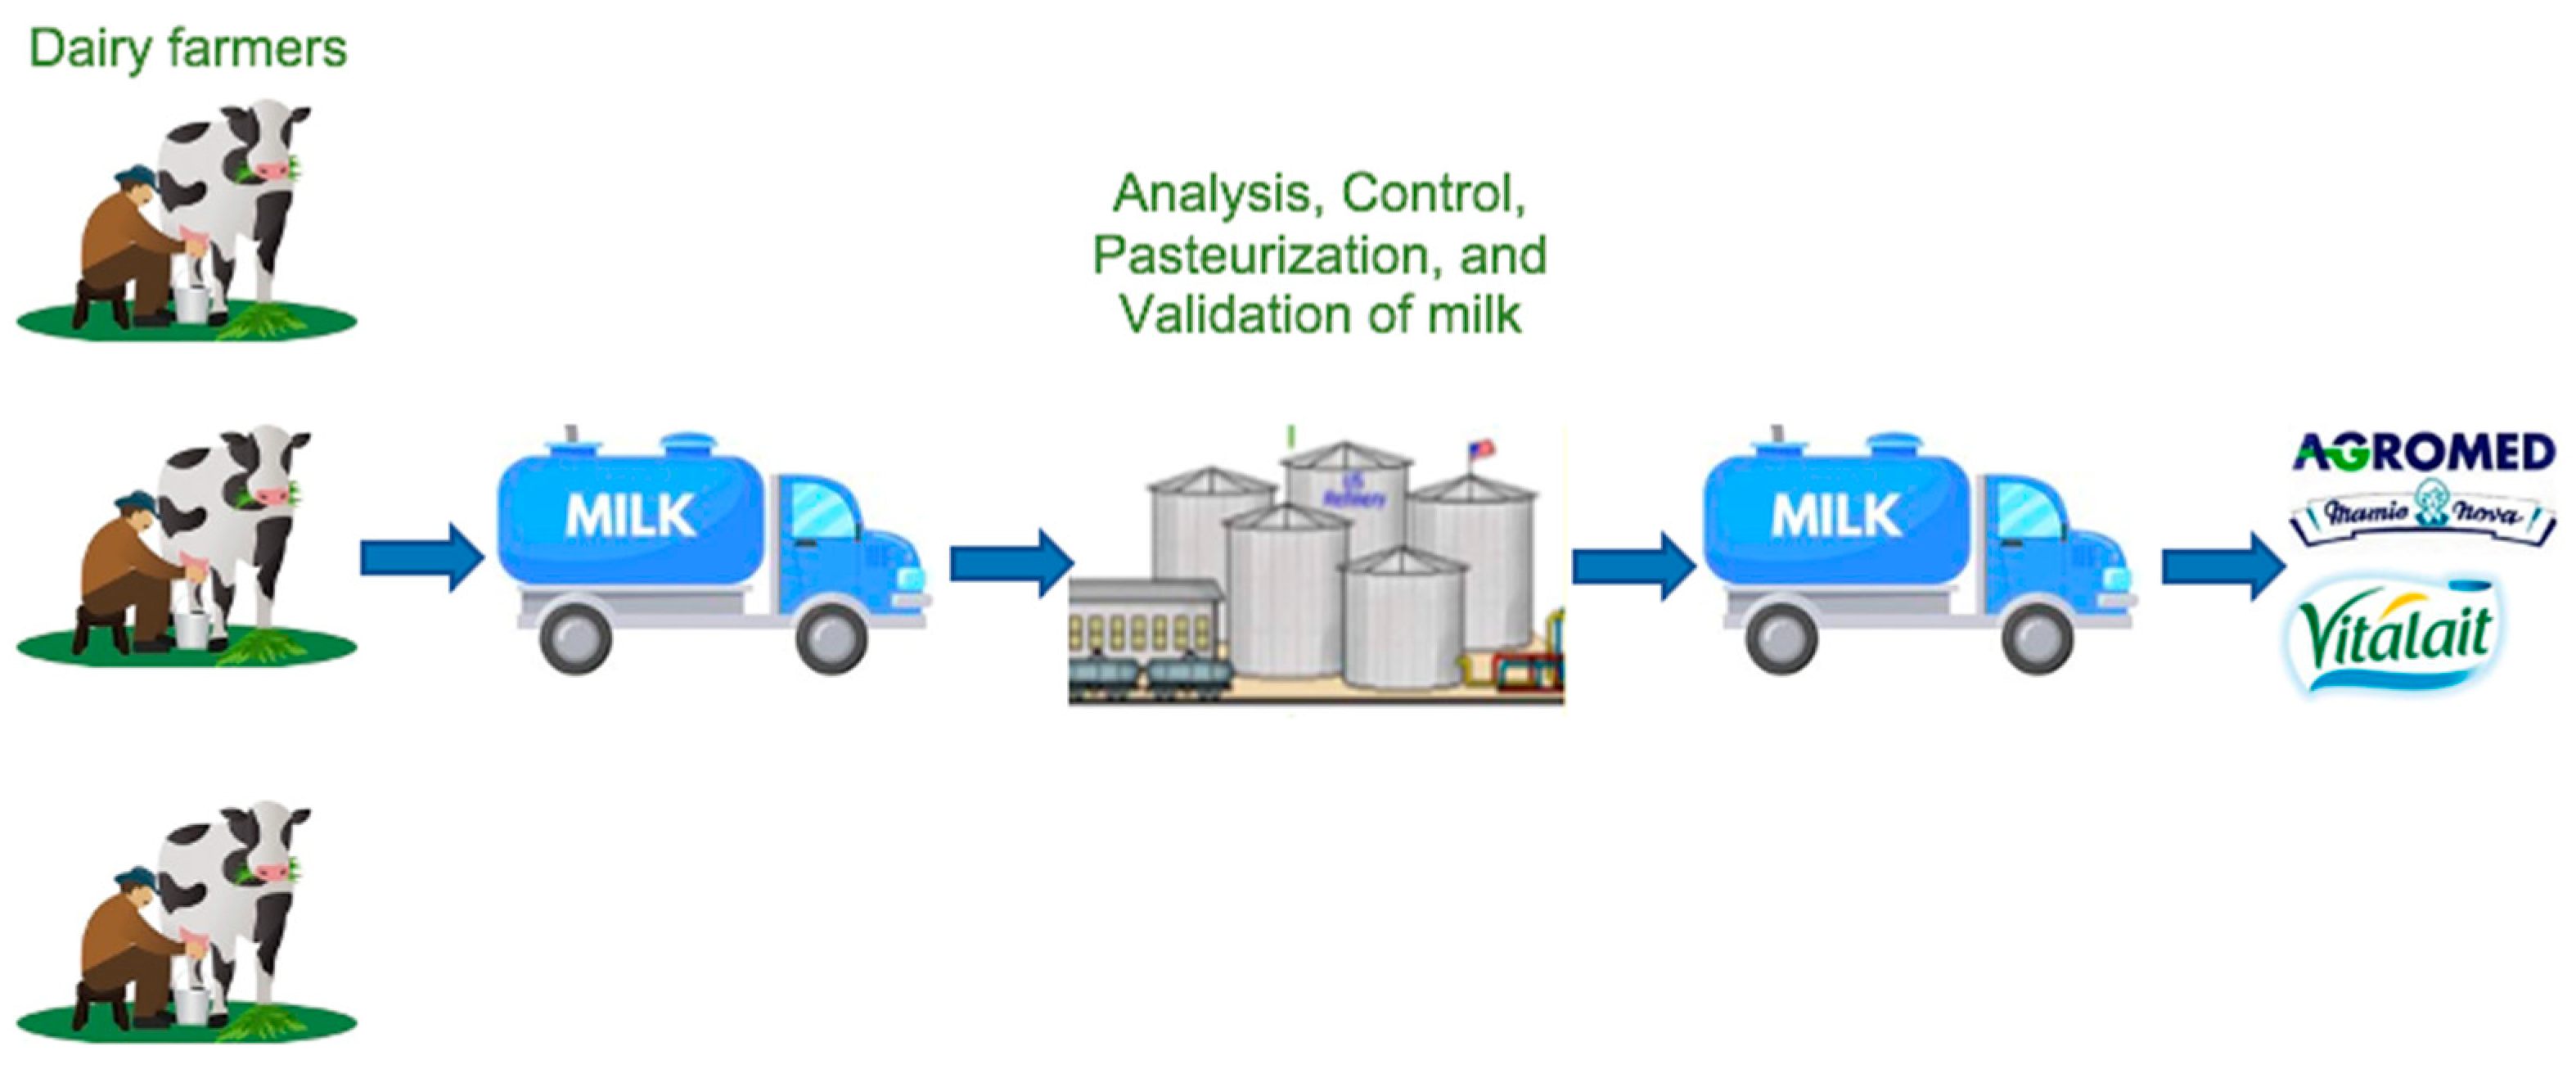
4]. Therefore, a real case study is undertaken to comprehend the feasibility and applicability of the proposed approach. The case revolves around one of the largest milk collection centers, El Rahma, situated in Sfax in the South of Tunisia. As illustrated in
Figure 4, this center receives daily supplies of raw milk from a group of affiliated dairy farmers. The raw milk undergoes analysis and is stored for a limited shelf-life before being distributed to manufacturing plants (Vitalait and Agromed, Sfax, Tunisia) within the complex. The pick-up and delivery activities are carried out by a fleet of capacitated heterogeneous vehicles. To thrive in the national market, this center must assess the performance of candidate dairy farmers from both resilient and sustainable perspectives, aligning with the proposed approach. As depicted in
Figure 1, the framework comprises three steps. Firstly, three decision-makers from different functions of the El Rahma company are invited to evaluate the farmers based on resilience and sustainability criteria, denoted by {DM1, DM2, DM3}. These decision-makers are the supply chain manager (DM1), responsible quality manager (DM2), and purchasing manager (DM3). Secondly, the evaluation sub-criteria are defined based on a review of recent literature and confirmed by experts.
These sub-criteria are denoted by
and clustered into four groups:
are economic sub-criteria,
are environmental sub-criteria,
are social sub-criteria and
resilience sub-criteria as shown in
Appendix A. After determining decision criteria, five potential dairy farmers are defined
. After setting the problem, the weights of sub-criteria are calculated by fuzzy AHP method. The weight coefficients obtained in this phase of the model are used in the third phase for evaluating dairy farmers by implementing the fuzzy MABAC model.
Our methodology is motivated by the valuable advantages offered by the fuzzy AHP and MABAC. These approaches bring substantial benefits to our study, providing robust and flexible frameworks for decision-making in complex and uncertain environments. Indeed, fuzzy AHP and MABAC methods offer valuable advantages in supplier selection. They adeptly handle uncertainty and ambiguity, accommodating subjective judgments and expert opinions. Fuzzy AHP’s use of fuzzy logic enables the modeling of preferences with linguistic terms, making it suitable for scenarios involving qualitative criteria, such as social and resilient criteria in our resilient suppliers selection case. Similarly, MABAC excels in considering imprecise information and preferences in a comprehensive manner. Both approaches effectively manage multiple criteria, providing structured approaches for decision-makers.
By merging these approaches, we aim to enhance the robustness and effectiveness of decision support, contributing to a more comprehensive and informed decision-making process in our complex and uncertain study setting.
4.2. Determine the Importance of Criteria Weights through FAHP
Step 1: Define the main criteria and sub criteria.
First, the main objective of implementing FAHP method is to define the relative importance of sustainability and resilience criteria for selecting the most appropriate Tunisian dairy farmers. As mentioned, three experts are contacted
for evaluating twelve criteria. As shown in
Figure 2, the hierarchy structure of the problem composed of three levels: The top level of the structure represents the ultimate objective which is “define the relative importance of each index and criterion”. In the second level, the main criteria of selection are grouped into four categories under economic, environmental, social and resiliency. In the bottom level, the main indexes are subdivided into 12 criteria.
Step 2: Construct the fuzzy pairwise comparison matrices.
The scale of linguistic variables presented in
Table 2 was used by the three experts to evaluate the importance of criteria with respect to the goal. Then, the linguistic variables are converted to triangular fuzzy numbers, as shown in Equation (3). Then, the assessments are aggregated by using Equations (4)–(6) and the obtained matrix is presented in
Appendix B. The consistency of pairwise comparison is calculated. For this purpose, the fuzzy pairwise matrix undergoes a transformation into a crisp matrix through the application of the Equation (7), as presented in
Table 4. The consistency ratio, computed through Equation (8), is 0.0310, indicating a value below the 0.1 threshold. So, we can conclude that the consistency is acceptable to be able to reach the next step.
Step 3: Calculate the degree of possibility .
The pairwise comparison matrix is further used to find the fuzzy synthetic extent value for every criterion by Equation (9). Firstly, the computation
is done in the following way:
| ; | ; | ; |
| ; | ; | ; |
| ; | ; | ; |
| ;
| ;
| . |
Next, the value of fuzzy synthetic extend of 12 sub-criteria is calculated and shown in
Table 5. Then, the degree of possibility of
for
and
is determined by the help of the Equation (10),) and the weight vector
is determined by the minimum of degree of possibility, as shown in Equation (11).
Step 4: Define the normalized weight vector.
After normalization of
, the weight vector was found as:
The priority weights of each criterion can be found in
Table 5 with respect to the main indexes.
Table 5 shows the weights ranking of criteria as follows:
Based on the results obtained from FAHP, the priority of the main indexes and criteria are identified in
Figure 5 and
Figure 6.
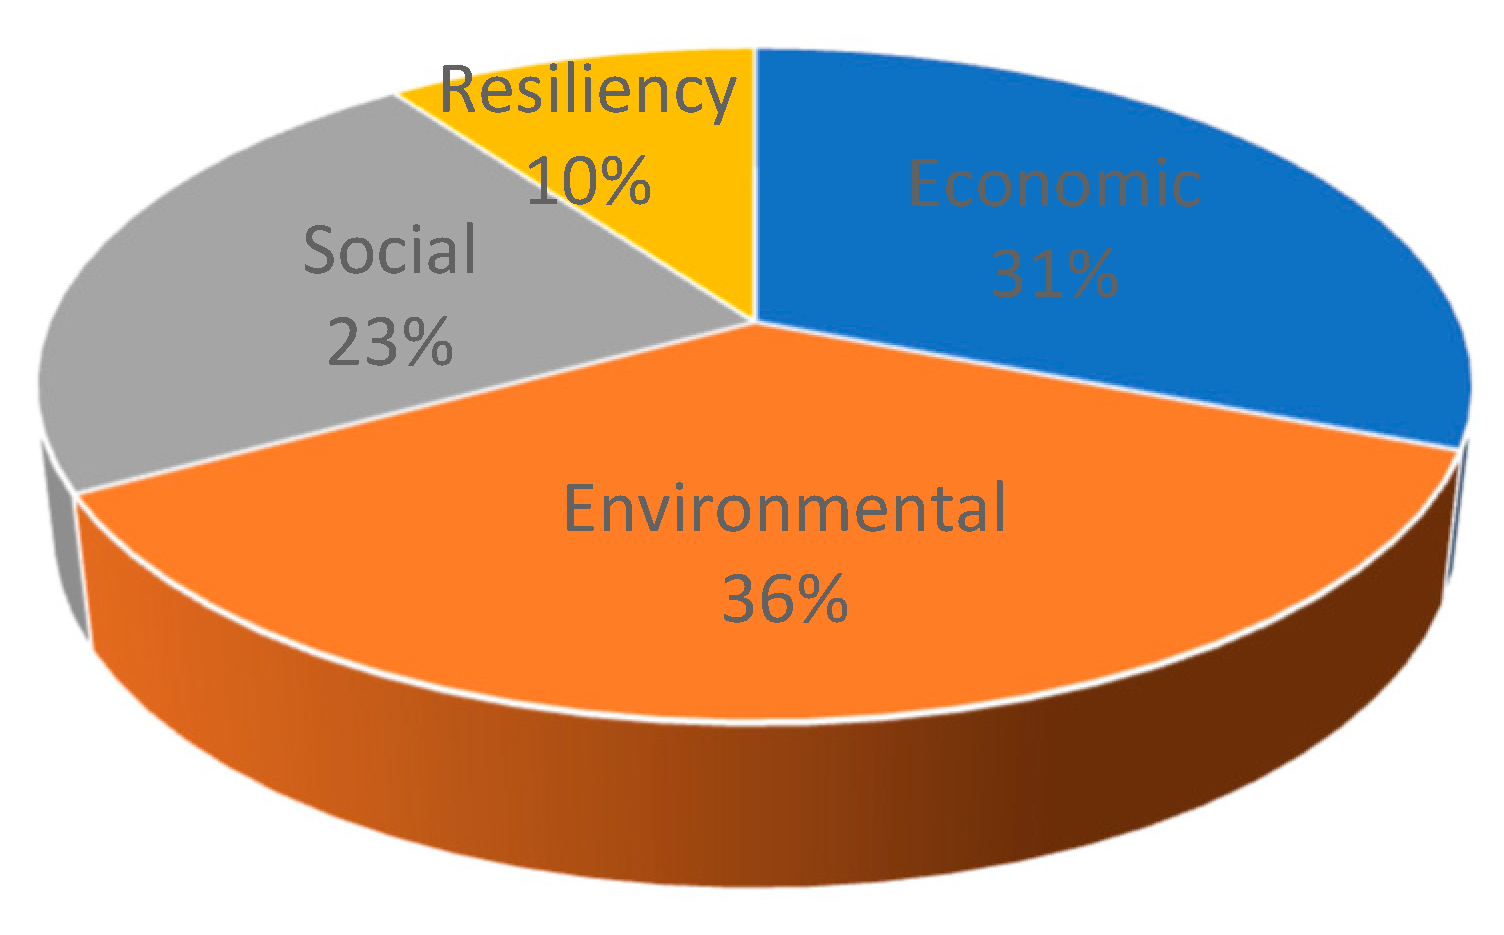
Figure 5 illustrates the significant importance of environmental criteria, lading at 36%, followed by economic criteria at 31%. Social and resiliency criteria hold importance percentages of 23% and 10%, respectively. Referring to
Figure 6, the top six sub-criteria are identified as
(Water use efficiency),
(Profitability),
(Access to market),
(Land use and forage area),
(GHG emissions) and
(Working conditions). On the contrary, as depicted in
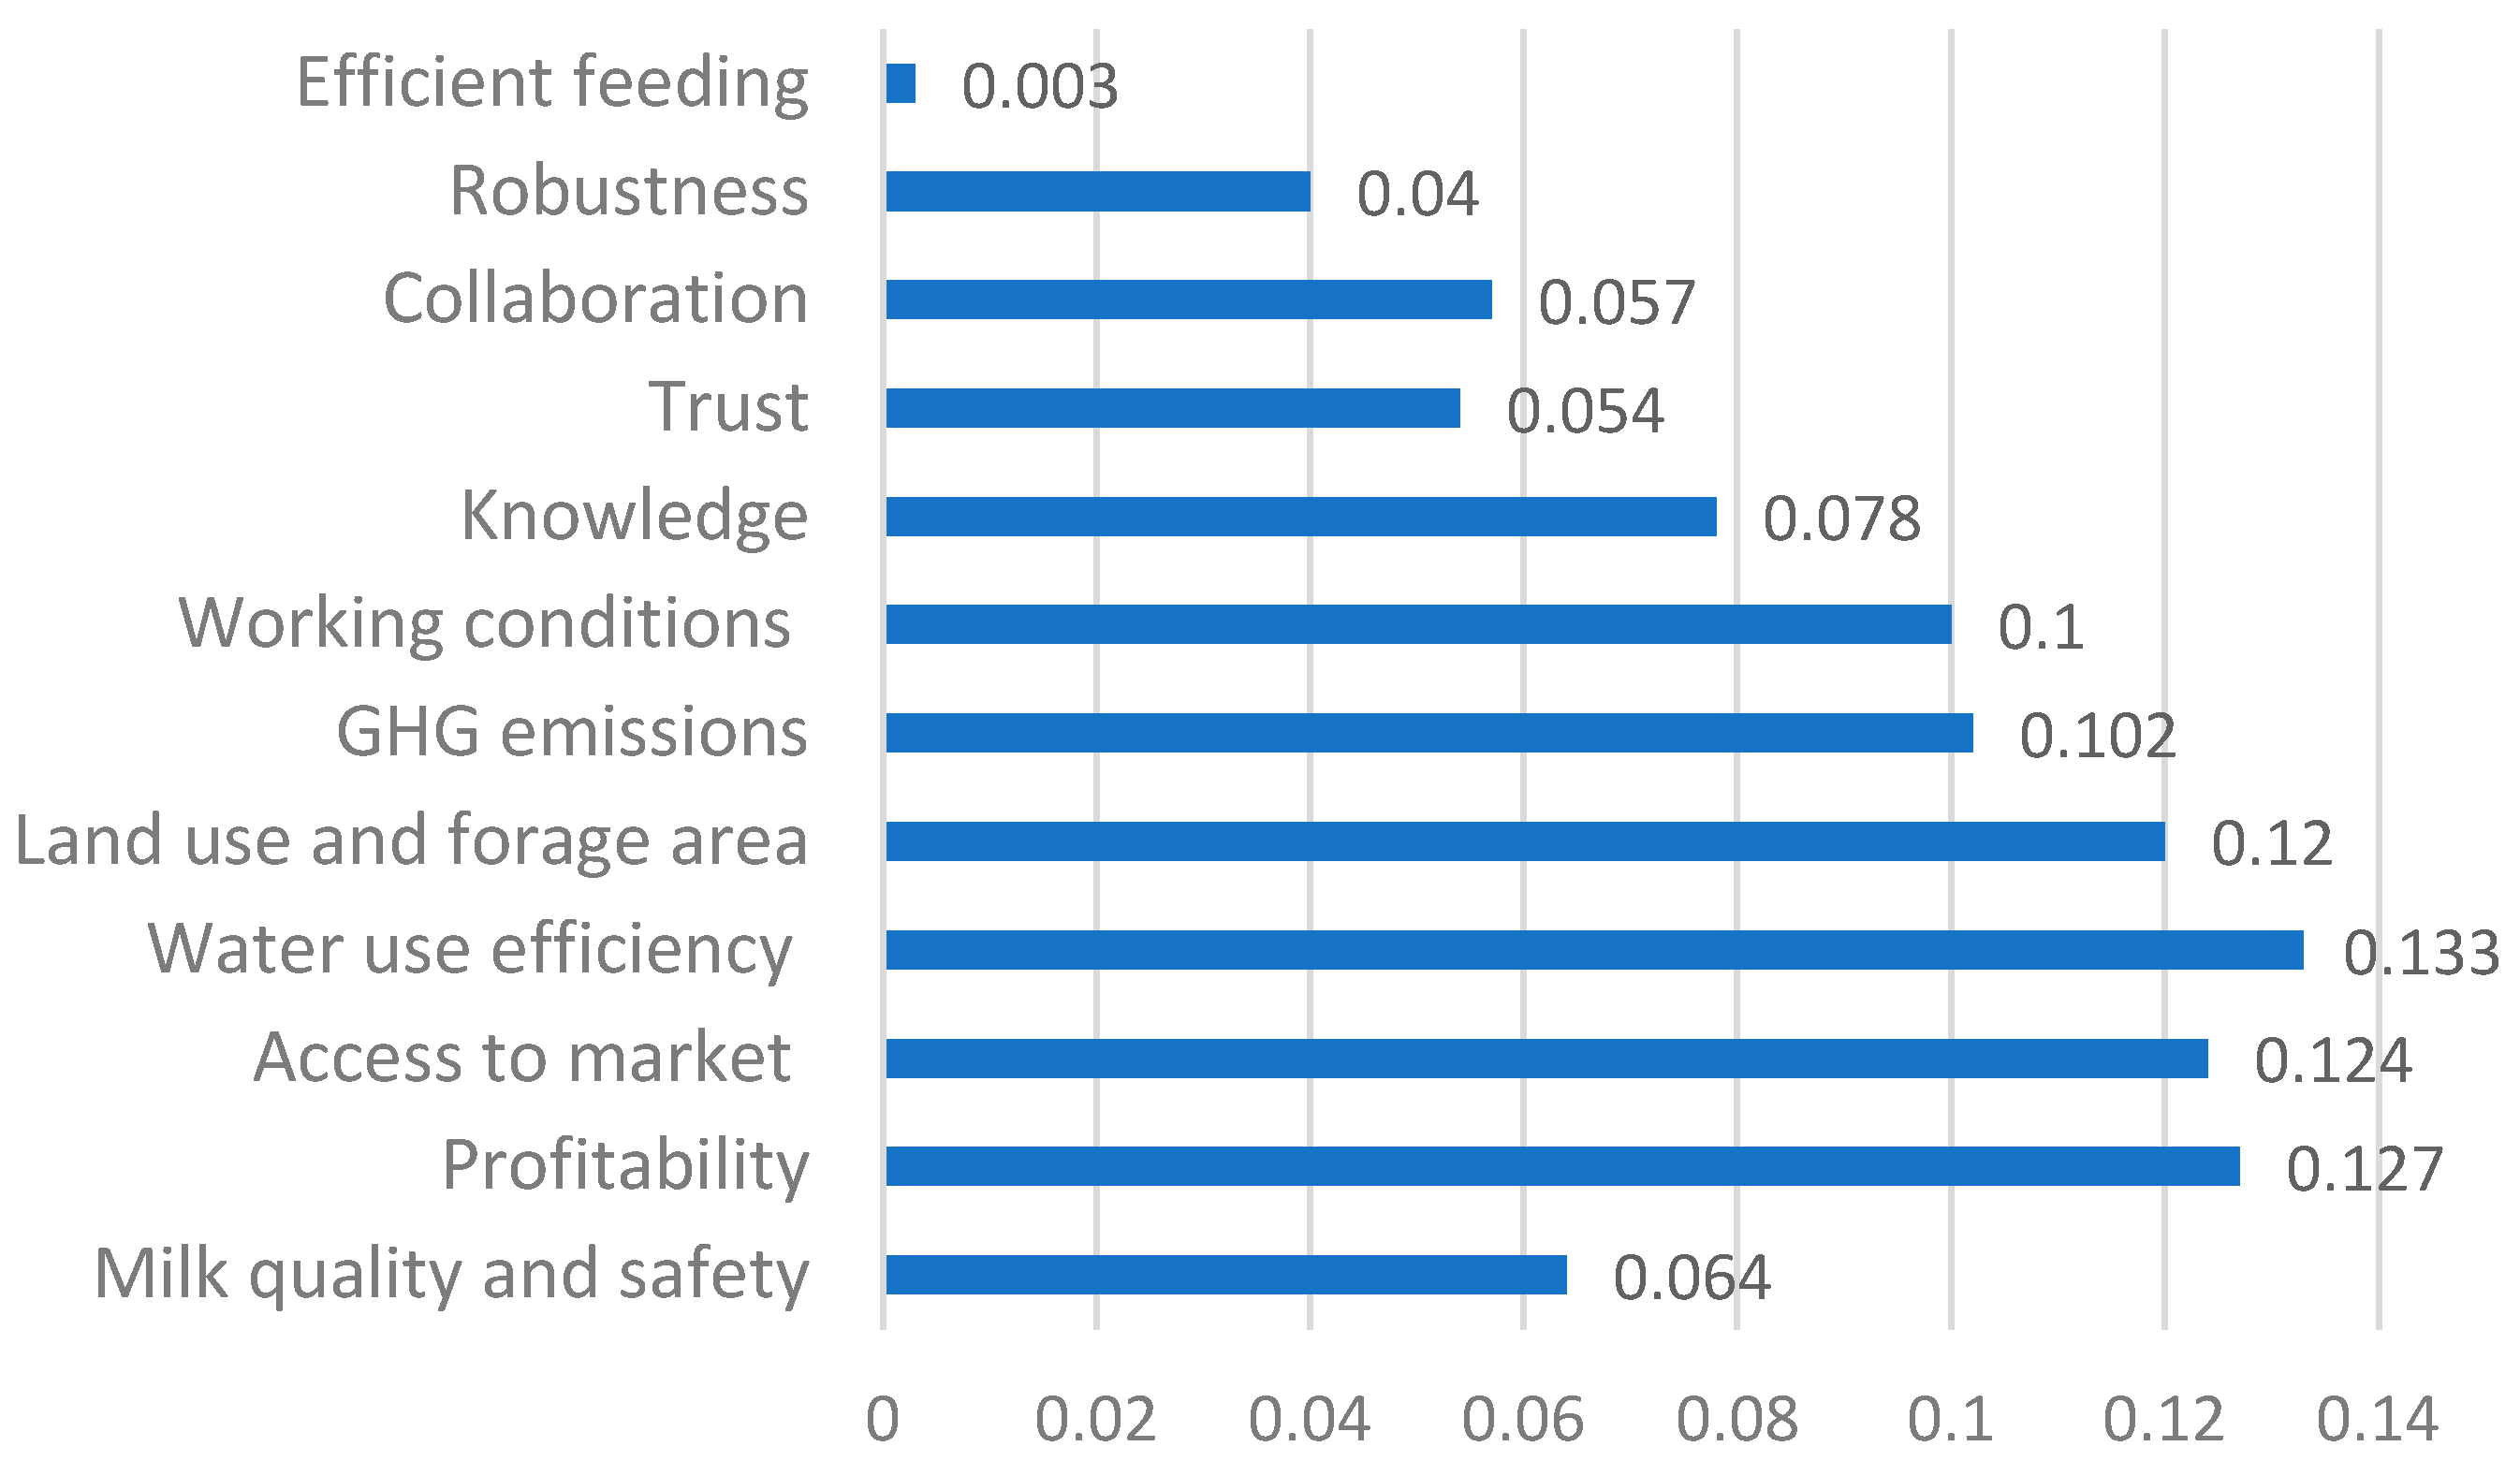
Figure 6, the prioritization of economic, environmental, social, and resilience criteria is determined as follows. Among the three economic criteria, profitability holds the highest weight (0.127), followed by access to market (0.124), and milk quality (0.064). Regarding the three environmental criteria, water use efficiency takes the top priority (0.133), followed by land use and forage area (0.120), while GHG emissions have a lower priority with a weight of (0.102). Within the social criteria, working conditions secure the foremost position with a weight of 0.10, followed by knowledge at the second place with a weight of 0.078, and trust holds the third spot with a weight of 0.054. For resilience sub-criteria, the three main sub-criteria are weighted as (0.057 for collaboration, 0.04 for robustness, and 0.14 for feed efficiency).
4.3. Rank Suppliers by Using FMABAC
Following the establishment of criteria weights, the second phase of the hybrid fuzzy AHP-MABAC approach entails the evaluation of farmers using fuzzy MABAC method. In this phase, a total of five dairy farmers are assessed by three decision makers namely supply chain manager, environmental engineer and management quality responsible. All criteria are presented as the benefit (higher value is preferred); only GHG emission (C6) is considered as a cost criterion (lower value is preferred). The assessment of farmers according to twelve criteria is based on the experiential knowledge of the decision maker.
Step 1: Define the initial fuzzy-decision matrix .
In the first step of fuzzy MABAC, the fuzzified scale shown in
Table 3 is used for obtaining linguistic matrices of decision makers (
Table 6). Then, each linguistic matrix is converted into fuzzy matrix by using Equation (12). After aggregating the three matrices by using Equations (4)–(6), the obtained matrix aggregated
is given in
Appendix C.1.
Step 2: Obtain the Normalized decision matrix .
By using the Equations (14) and (15) for normalization of benefit and cost criteria respectively, the normalized matrix
is given in
Appendix C.2.
Step 3: Calculate the weighted matrix .
The values of weighted matrix
is calculated by producing the values of matrix
and the results obtained by FAHP method. Using the Equation (16),
is presented in
Appendix C.3.
Step 4: Determine the approximate border area matrix .
By using Equation (18), the border approximation area (BAA) matrix
of dimension
is presented in
Table 7.
Step 5: Calculate the matrix elements of alternatives distance from the border approximate area .
Appendix C.4 represents the distance of each alternative from BAA
calculated by using Equation (18). Alternative distance from BAA matrix can be obtained by using equation as:
Similarly, other values are calculated.
Step 6: Rank the alternatives.
The final value of the criteria functions by alternatives are obtained by summing up the matrix
elements per rows. Then,
values for all alternatives are calculated by Equation (20) and by defuzzification
using Equation (2) the overall ranking of alternatives is given in
Table 8. According to
Table 8, it is observed that the supplier 5 is the best alternative with score of 0.774, supplier 2 is in the second rank with the priority of 0.621 and the supplier 3 is located in the last place
.
5. Performance Analysis
The outcomes of MCDM problems can be incorrect or change depending on different circumstances. This may happen, for example, if one or more experts belonging to the evaluation team are replaced by different experts. Therefore, it is important to perform a sensitivity analysis that allows evaluating the robustness of the results. In this section, the results are validated through two phases. Firstly, the sensitivity analysis is applied to determine the robustness of the proposed method by assessing the impact of changing criteria weight on final ranking of alternatives. Secondly, the results of Fuzzy AHP-MABAC are compared with other fuzzy MCDM methods.
In the context of our study, we specifically focused on five criteria and we chose a sensitivity analysis margin of 35%, based on expert recommendations. Sensitivity analysis in scenario ranking proposed here aims to enhance decision-making by scrutinizing the impact of parameter variations on the order of scenarios. By assessing robustness, it provides a nuanced understanding of the stability and reliability of rankings. This analysis quantifies uncertainty and optimizing decision strategies.
The results of suppliers’ evaluation have been analyzed through five scenarios (S1–S5). In each scenario, we favored one criterion (
C1,
C4,
C5,
C9,
C11) whose weights coefficient was increased by 35% as shown in
Table 9. By varying the importance of criteria, if the ranking changes, it can be referred that the obtained results are sensitive and vulnerable in nature. Else, the method is robust.
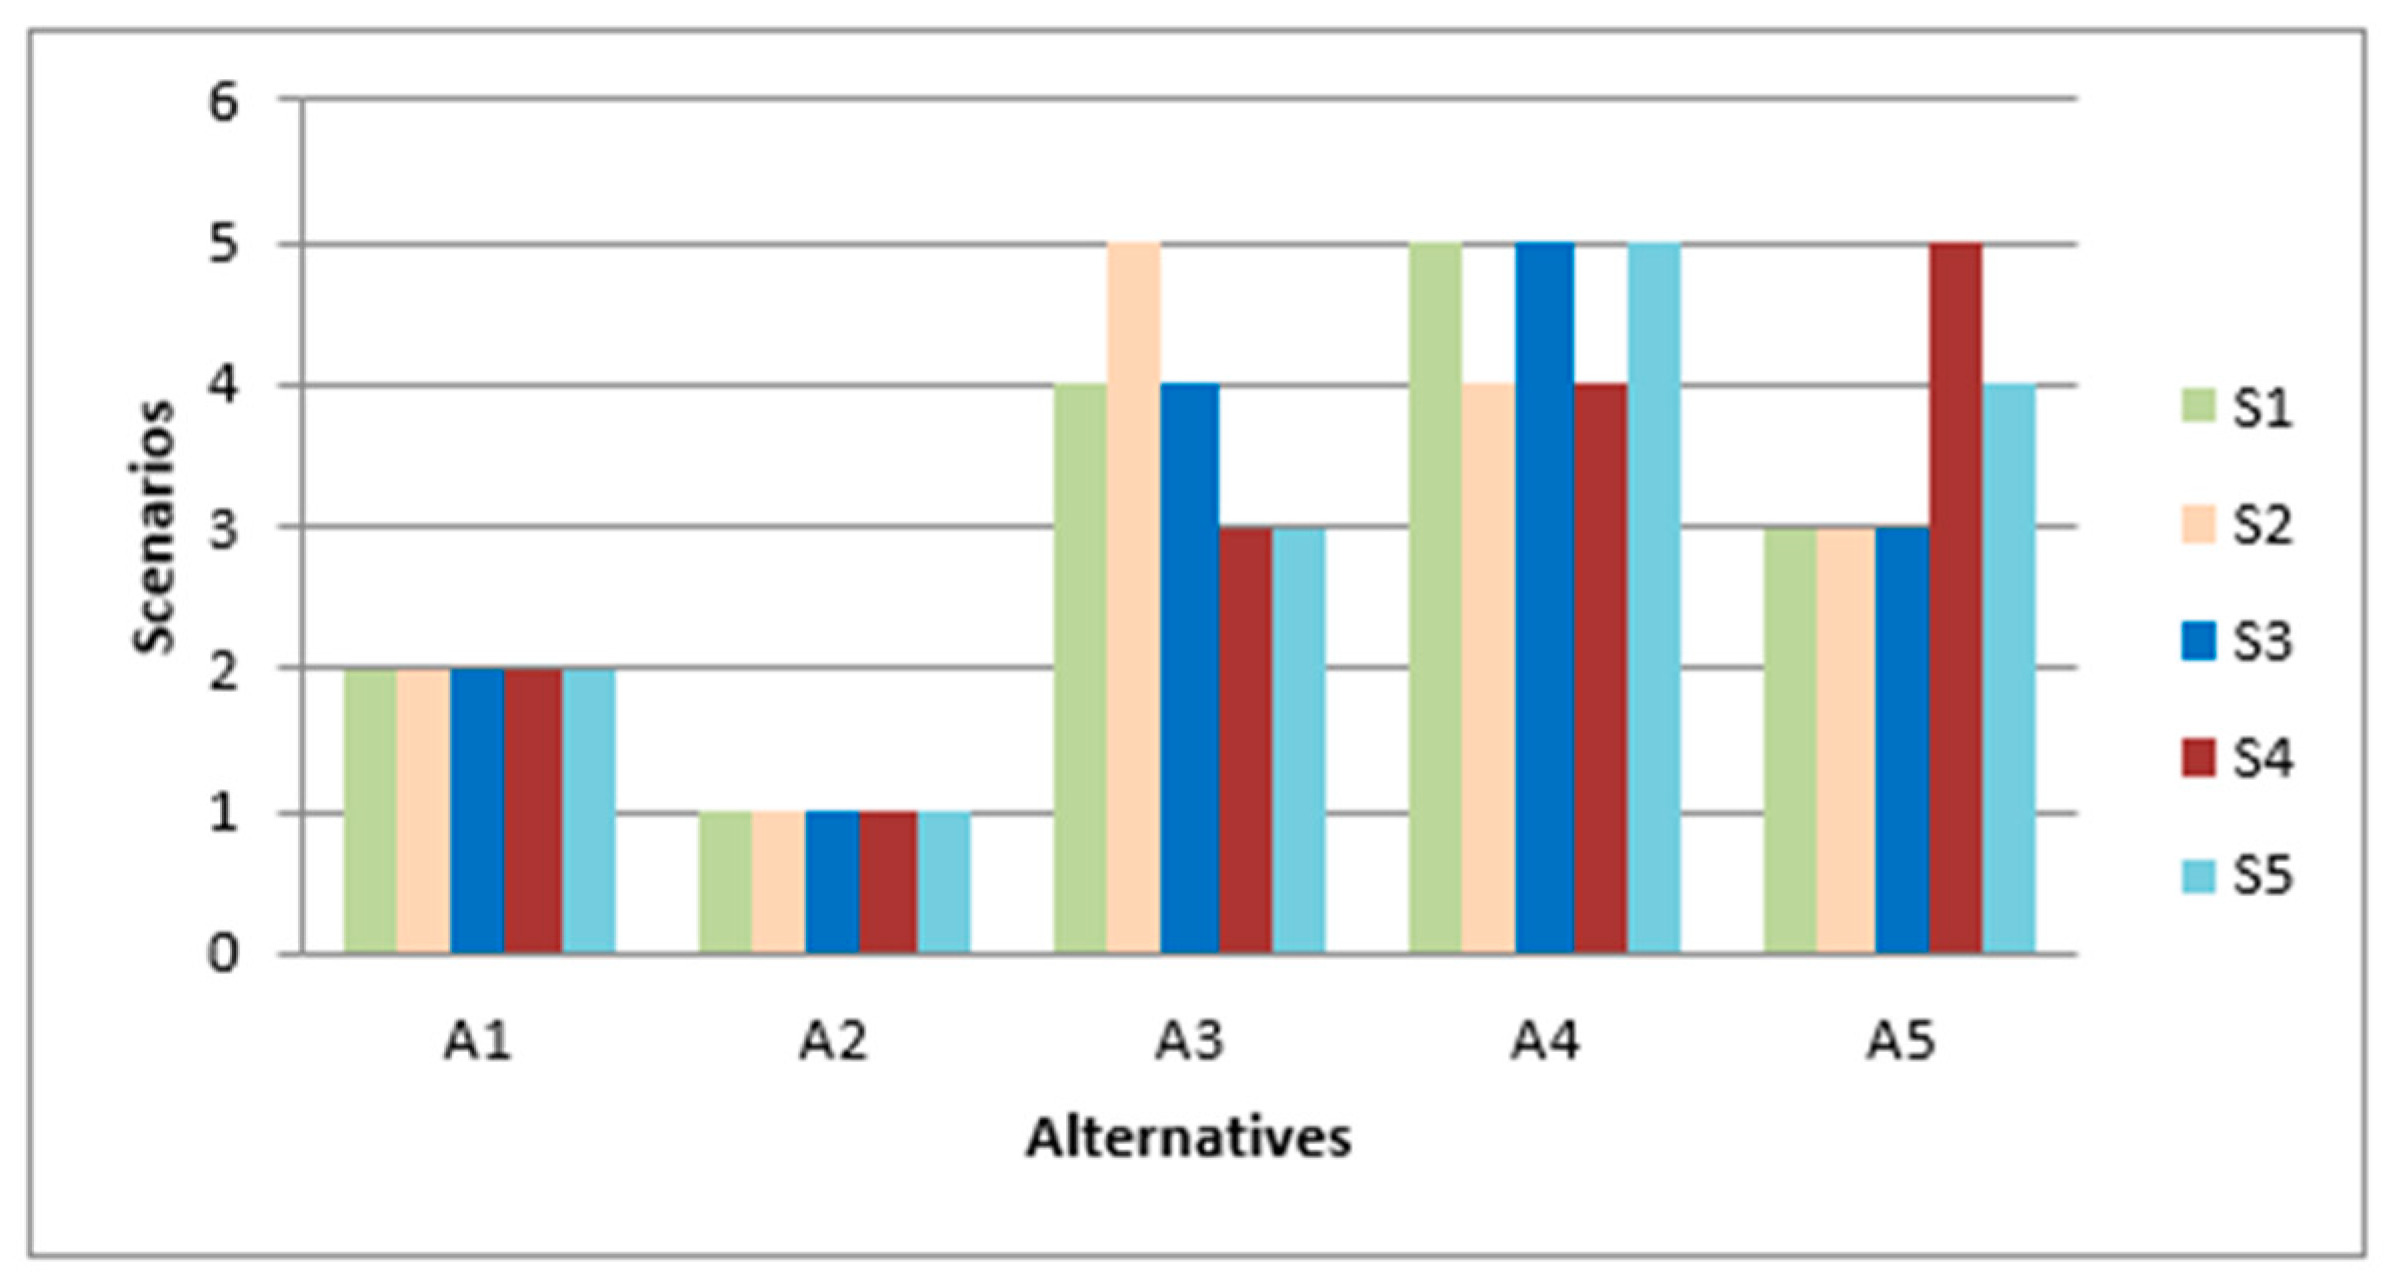
The rank of alternatives at each scenario using an integrated fuzzy AHP-MABAC is shown in
Figure 7. As can be seen, alternative A1 remained ranked in second place at all scenarios. A2 is ranked in the first place at all scenario. For other alternatives, there has not been a significant change in ranking by scenarios. It can be concluded that by varying the importance of the criterion, the alternative rank remains unchanged. Therefore, it can be concluded that obtained results are robust in nature.
Further, Sperman’s rank correlation test was also carried out for the methodology validation purpose.
Analyzing the coefficients of
Table 10 reveals the strength and direction of monotonic associations between pairs of scenarios. A coefficient near +1 or −1 signifies a robust monotonic relationship, while values close to 0 indicate a weaker correlation. Positive coefficients imply that as one scenario increases, the other tends to increase, and vice versa for negative coefficients. For instance, the correlation between S1 and S2 is 0.90, suggesting a strong positive correlation between Scenario 1 and Scenario 2. Notably, the diagonal elements are consistently 1, denoting the perfect correlation of each scenario with itself. In summary, the Spearman’s coefficient values provide a more detailed and nuanced expression of the absence of significant differences in the rankings among the five scenarios.
At the second phase of the results validation, the obtained results of fuzzy AHP-MABAC are compared with the results of the fuzzy TOPSIS [
5], fuzzy VIKOR and fuzzy MABAC [
7]. The ranking for applying the different methods are presented in
Table 11. As it can be seen in
Table 11 the results show that the proposed approach and fuzzy TOPSIS suggest the identical rankings (
, whereas the methods fuzzy VIKOR propose a slightly modified ranking. On the other hand, all methods favored
and
as the best alternatives. This finding indicates that the suggested fuzzy AHP-MABAC method is validated.
6. Discussion
While fuzzy AHP and MABAC offer advantages in supplier selection, they also come with inherent limitations. Fuzzy AHP’s computational complexity, dependence on subjective expert knowledge, and sensitivity to parameter selection pose challenges. Additionally, the subjective nature of fuzzy sets and potential variations in interpretations can impact result consistency. MABAC assumes linear relationships between criteria, making it less adaptable to non-linear scenarios, and accurate weight elicitation can be challenging. Nevertheless, careful consideration of the specific context and requirements aid in choosing appropriate weights and mitigating potential drawbacks, as we tried to do in this study.
So, the findings of this study indicate that environmental is the most important dimension (0.36) followed by economic dimension (0.31), social and resiliency with relative importance (0.23) and (0.10) respectively. “Water use efficiency (0.133)” are the most significant criteria, followed by “Profitability (0.127)”, “Access to market (0.124)”, “Land use and forage area (0.12)”, “GHG emissions (0.102)”, “Working conditions (0.1)”; “Knowledge (0.078)”, “Milk quality and safety (0.064)”, “Collaboration (0.057)”, “Trust (0.054)”, “Robustness (0.04)” and “Efficient feeding (0.003)”. The consistency value is well acceptable ensuring decision making process. The proposed methodology contributes various advantages, which are summarized as follow:
To make the ranking of farmers in the context of food industry considering sustainability and resiliency more accurate, the fuzzy sets is applied to deal with the vagueness of the experts’ judgments.
Due to the difference between this paper and other studies by the consideration of sustainability and resiliency criteria simultaneously, the ranking of suppliers is more consistent with the real decisions made by using the proposed framework.
The results show that the proposed methodology to solve supplier selection problem is a reliable tool for real decision-making problems.
By using this methodology, the managers of milk collection center “El Rahma” are able to construct a solid framework of farmer selection problem.


