
Effect of Proactive Interaction on Trust in Autonomous Vehicles


Abstract
1. Introduction
2. Related Work
2.1. System Factors
2.2. Personal Factors
2.3. Situational Factors
3. Materials and Methods
- (i)
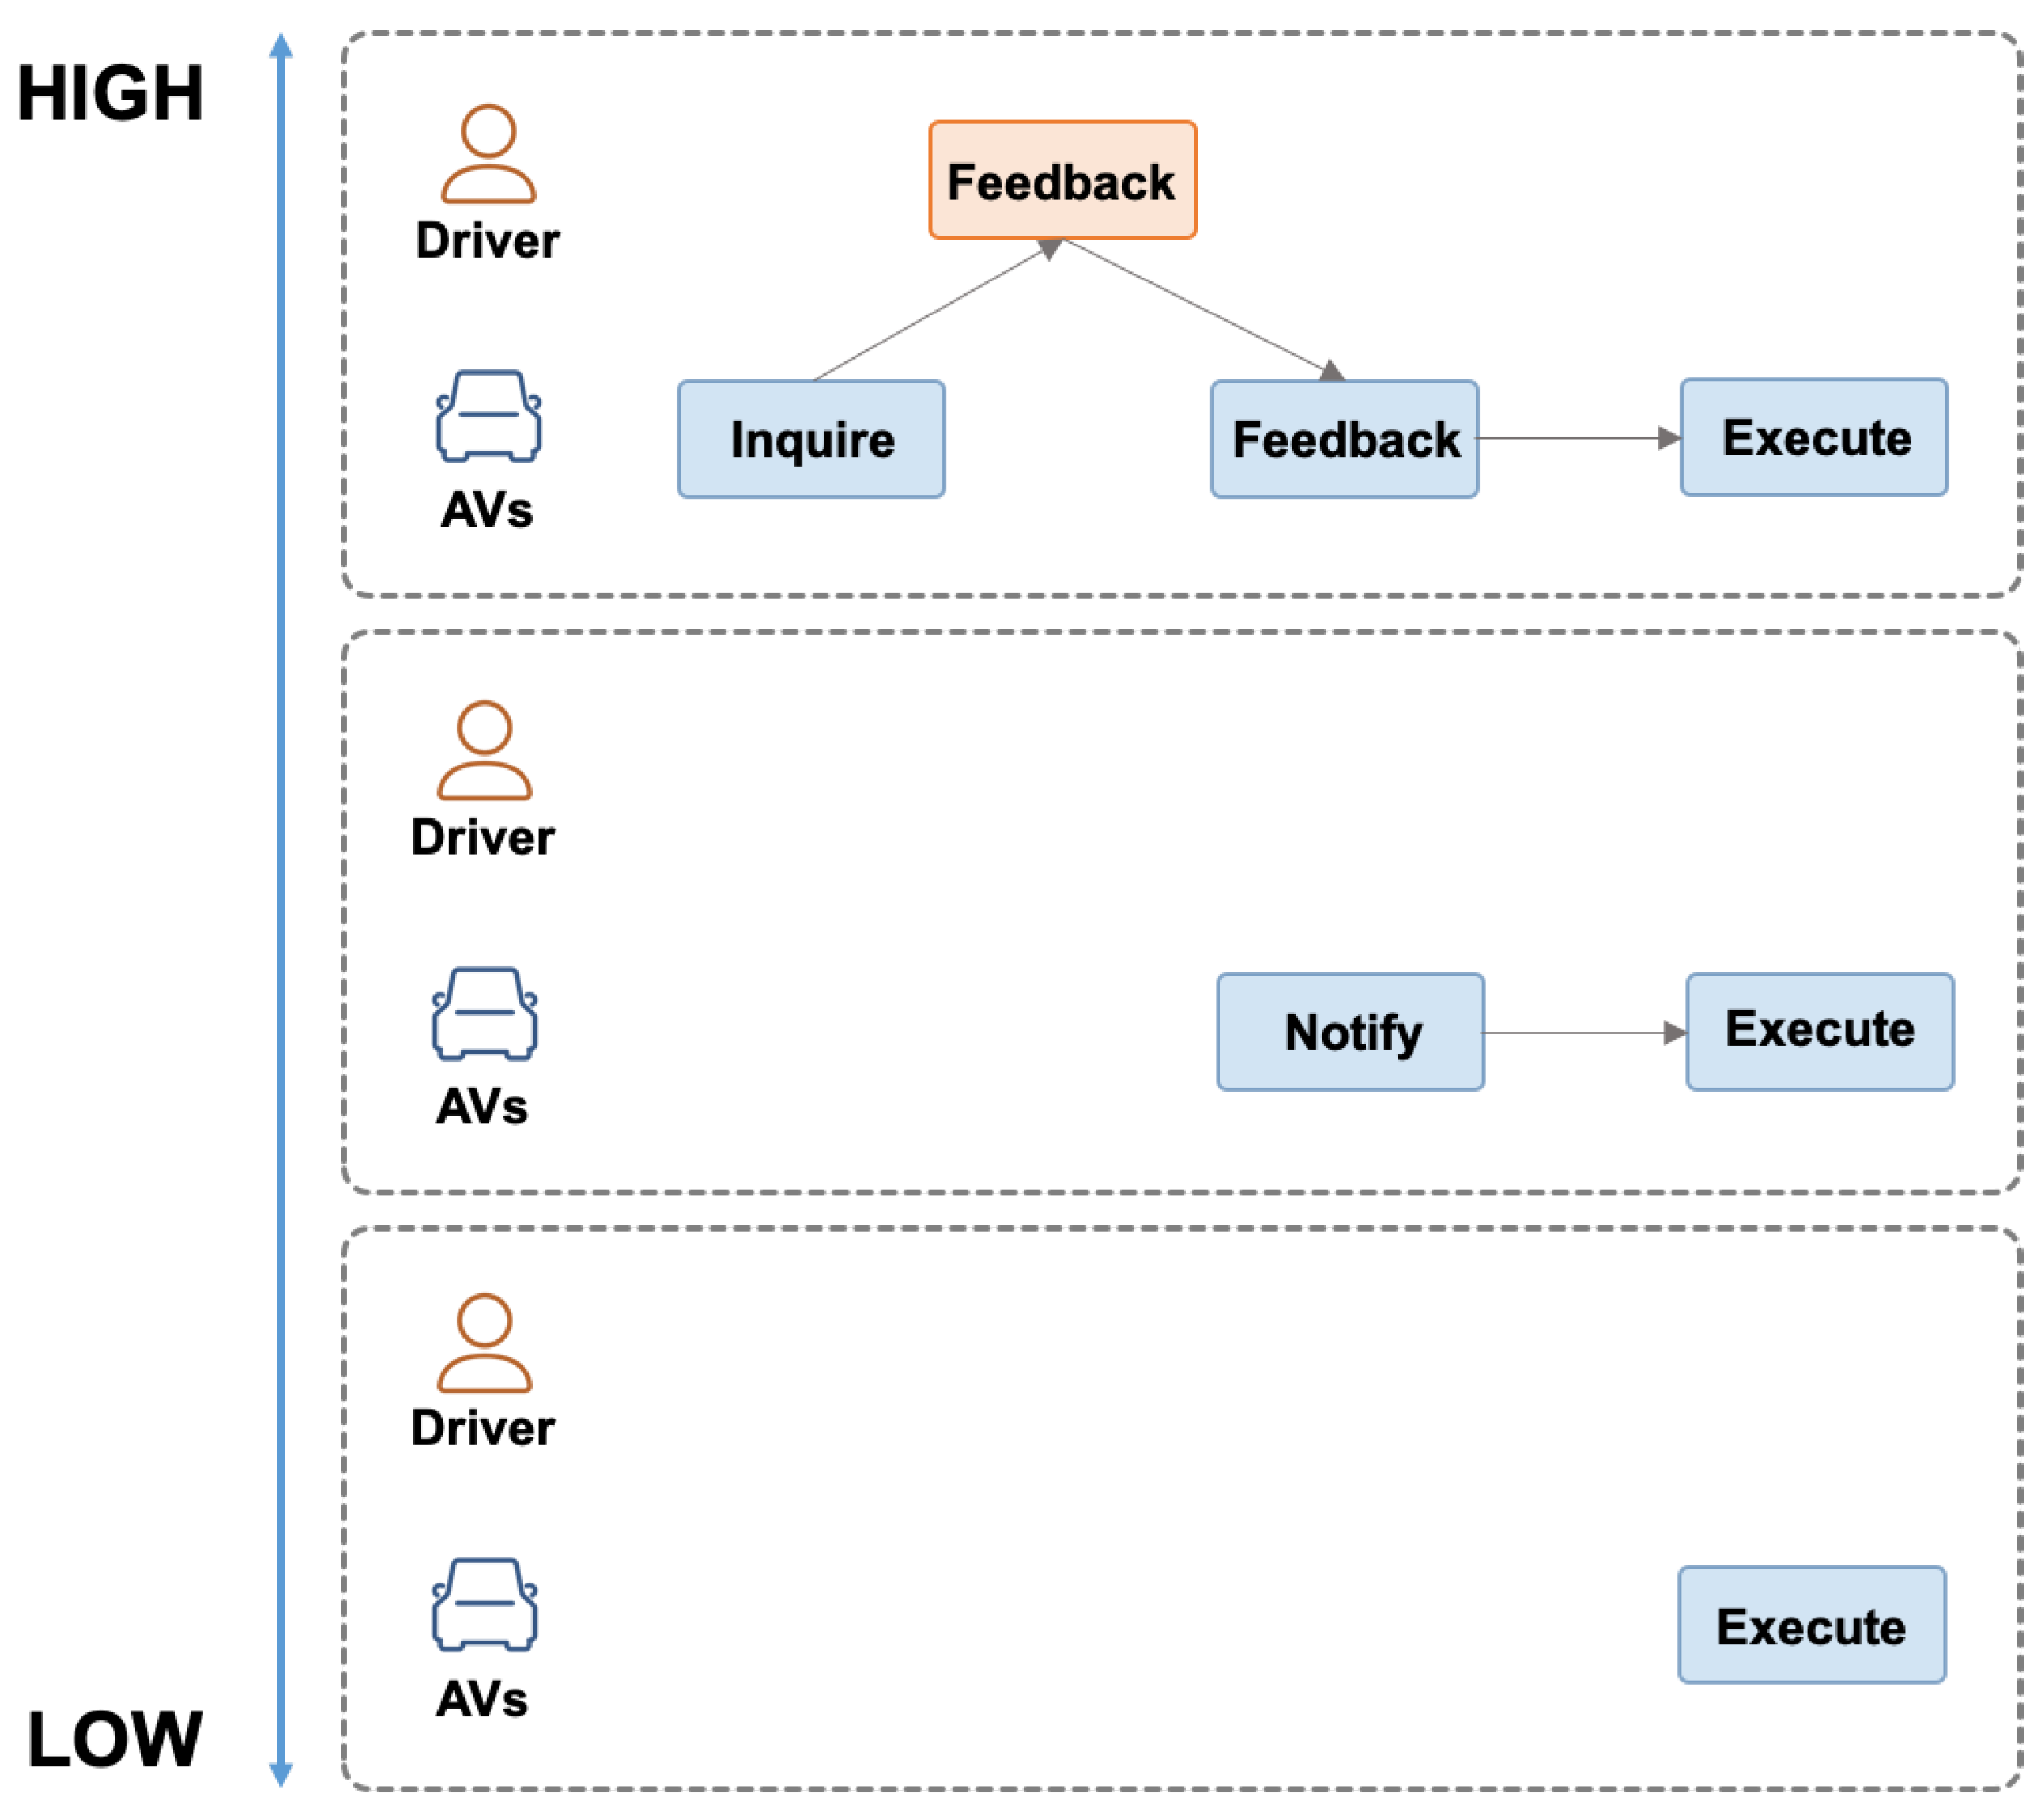
- High PI: The system provides the driver with the situation in their surroundings or traffic circumstances based on information gathered from sensors. It then suggests decisions according to those sensory inputs and requests confirmation from the driver. After receiving feedback from the driver, it sends a received response and executes or does not execute the previous decision based on the driver’s feedback.
- (ii)
- Medium PI: The system provides the driver with the situation in their surroundings or traffic circumstances based on information gathered from sensors. The system then provides the driver with a decision according to those sensory inputs and then directly executes the decision.
- (iii)
- Low PI: The system executes decisions directly without interactions with the driver.
3.1. Hypotheses
3.2. Experimental Design
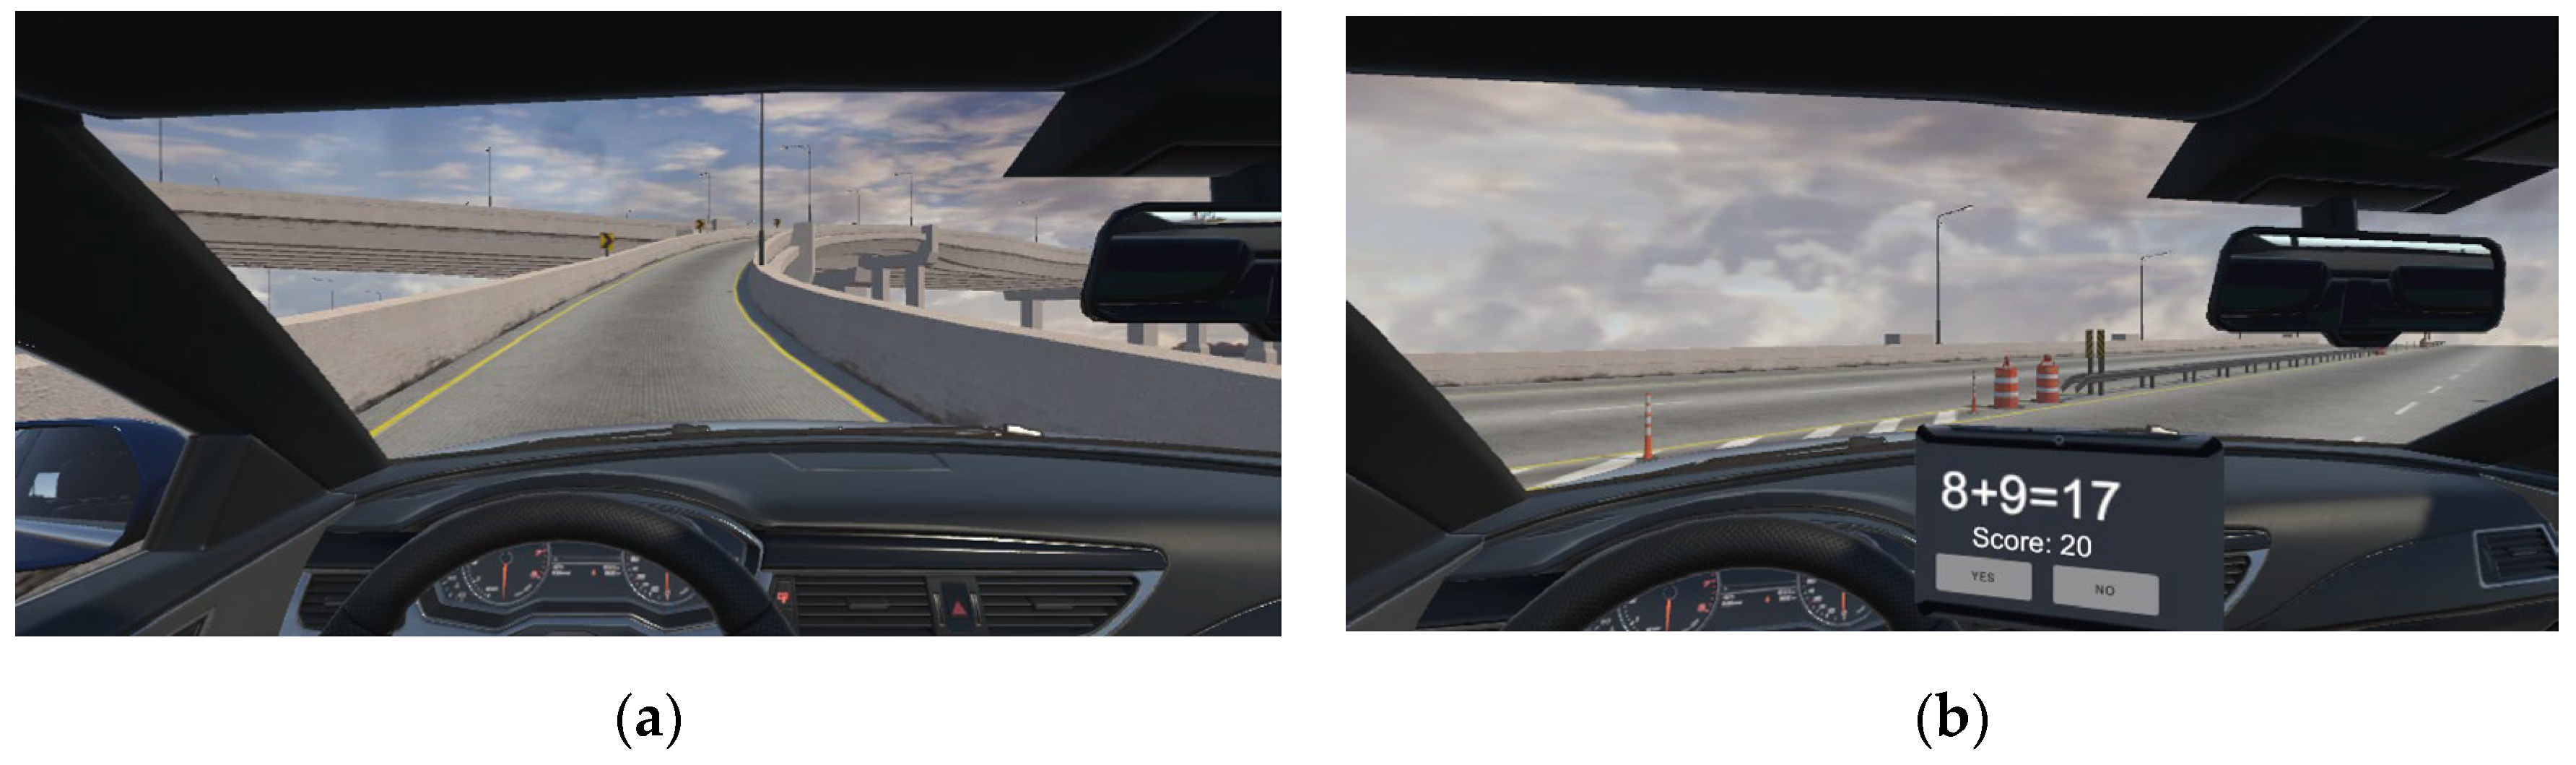
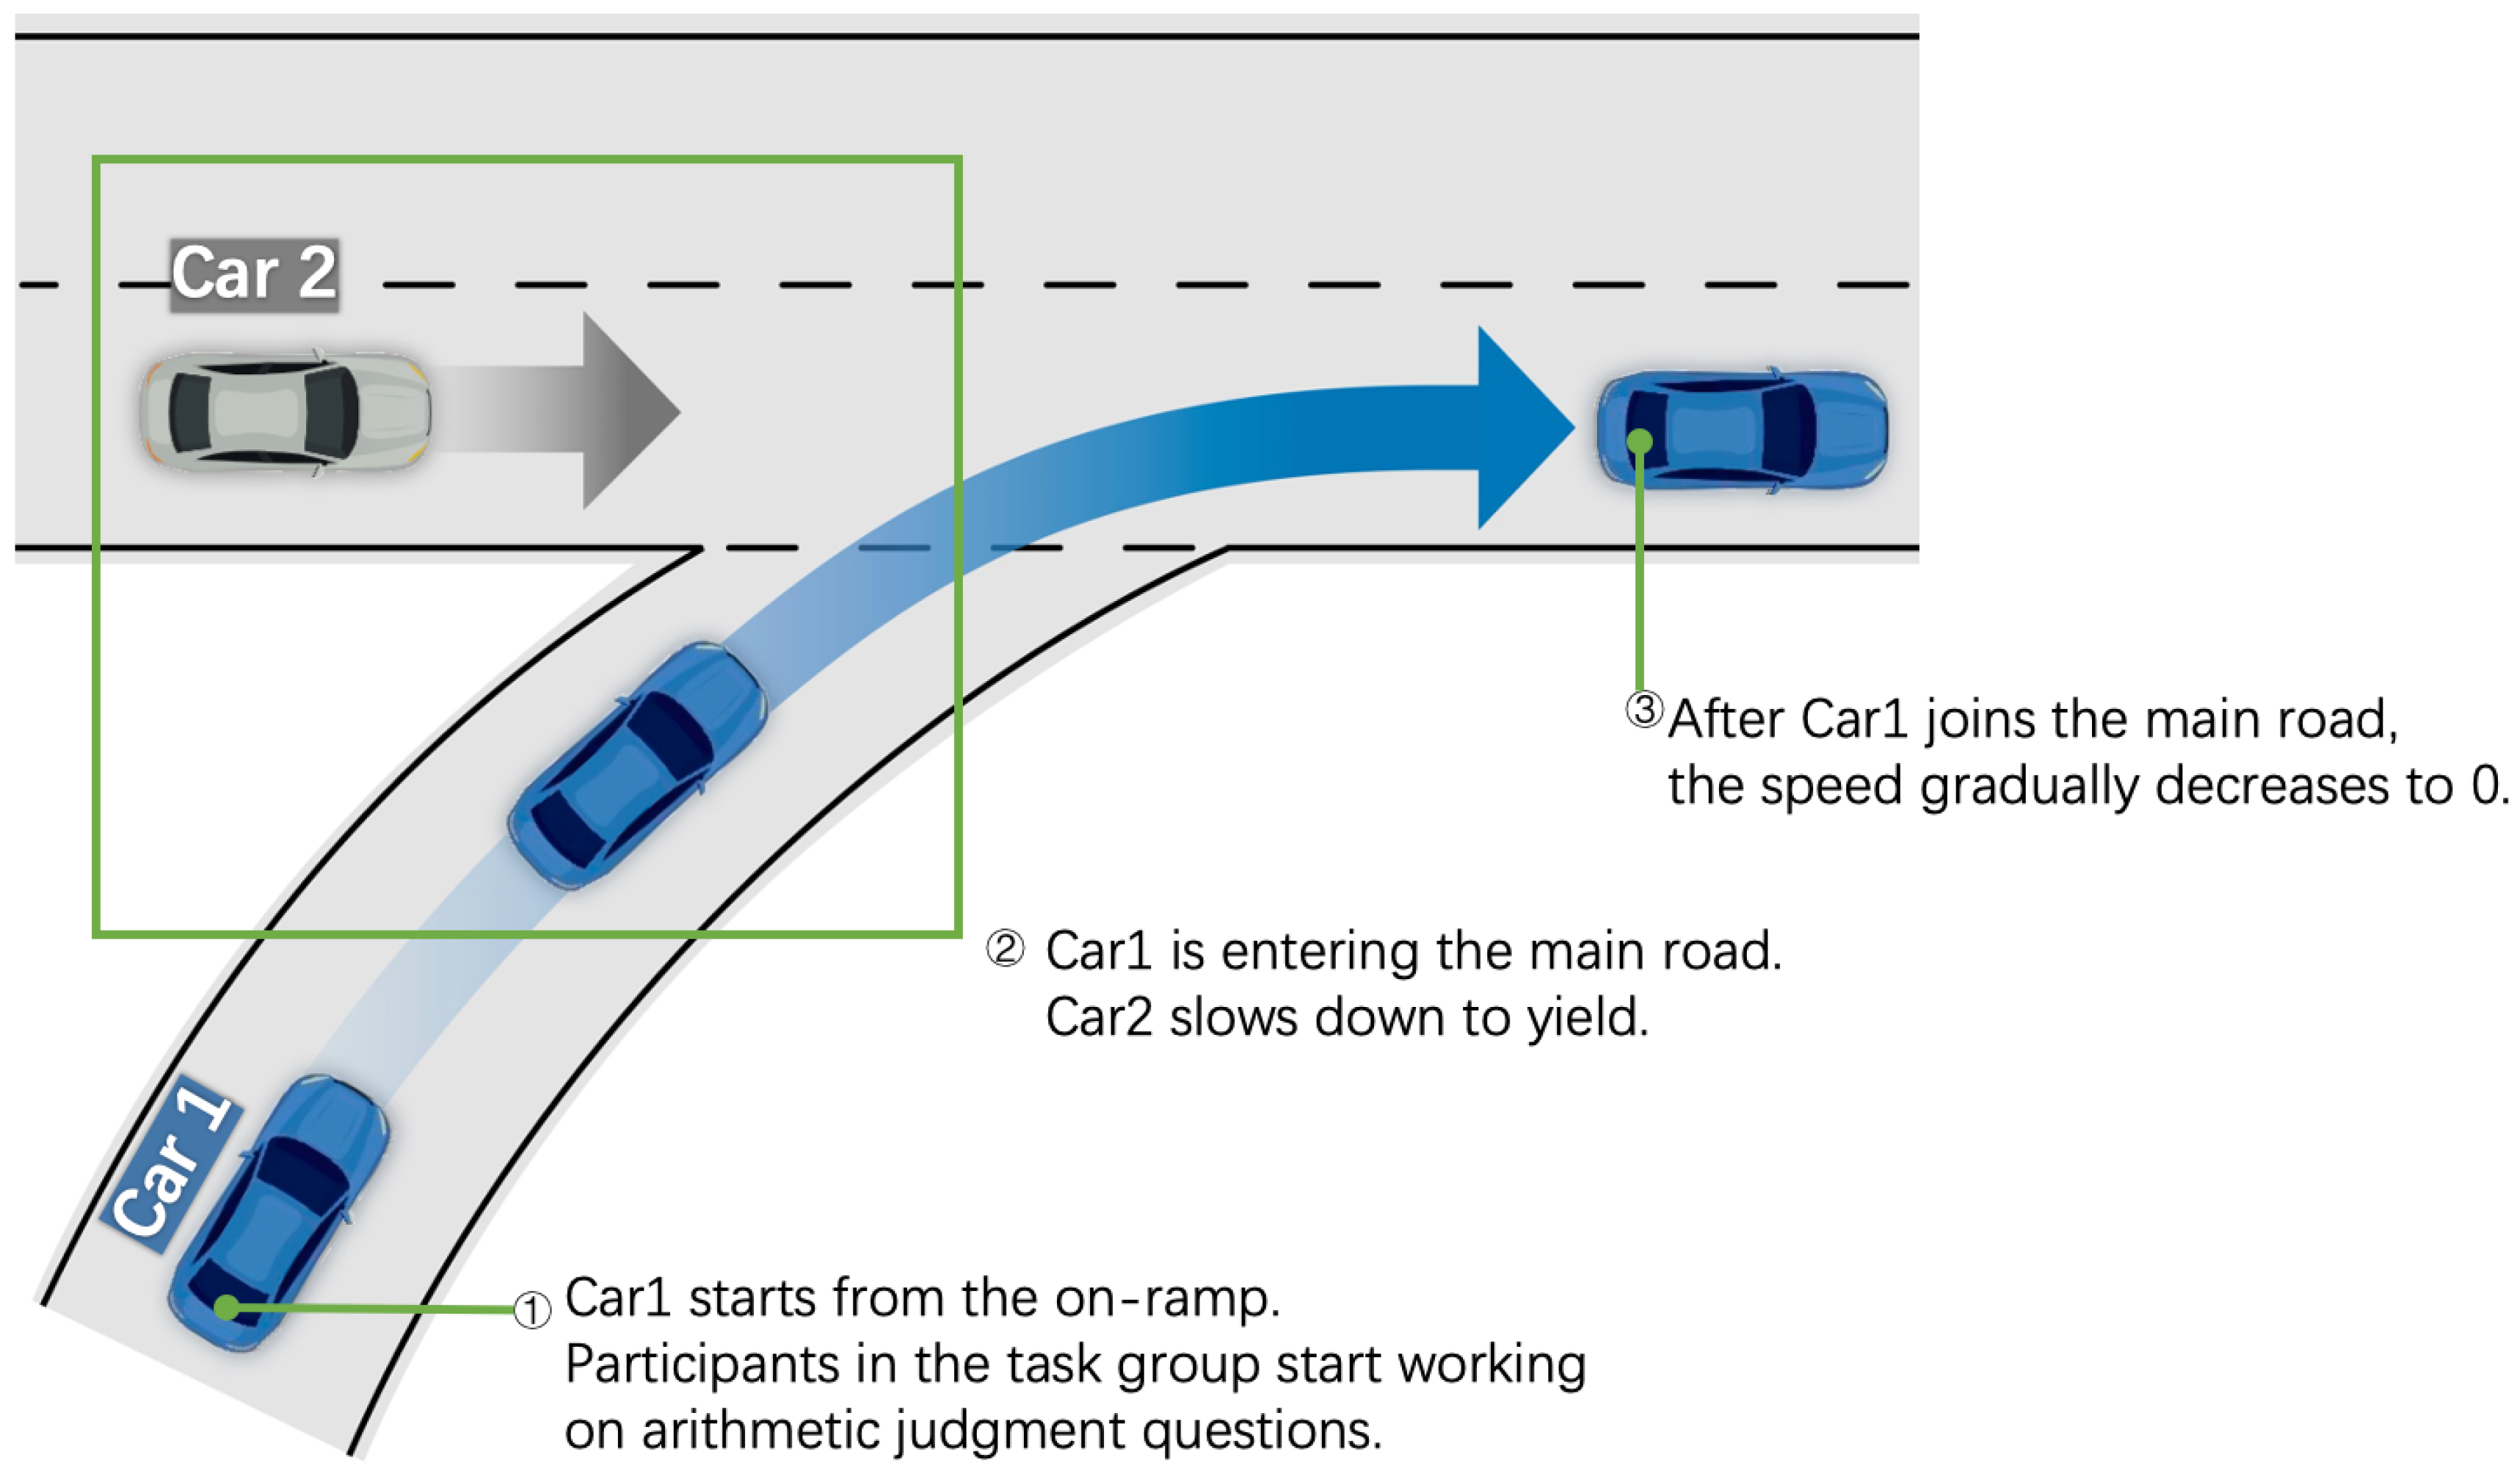
3.2.1. Scenario Design
3.2.2. Interaction Methods
- (i)
- Inquiry (high PI): AVs asked the participant, “We have the vehicle slowing down on the main road. Do you want to accelerate?” After the participant gave different feedback (such as “Yes” or “Do not speed up”), the system replied “Okay” and executed acceleration or no acceleration based on the participant’s feedback.
- (ii)
- Notification (medium PI): AVs informed the participant, “We have the vehicle slowing down on the main road. We’re about to speed up” and then accelerated to pass.
- (iii)
- None (low PI): AVs did not notify the participant and directly accelerated to pass.
3.2.3. Task Design
3.3. Participants
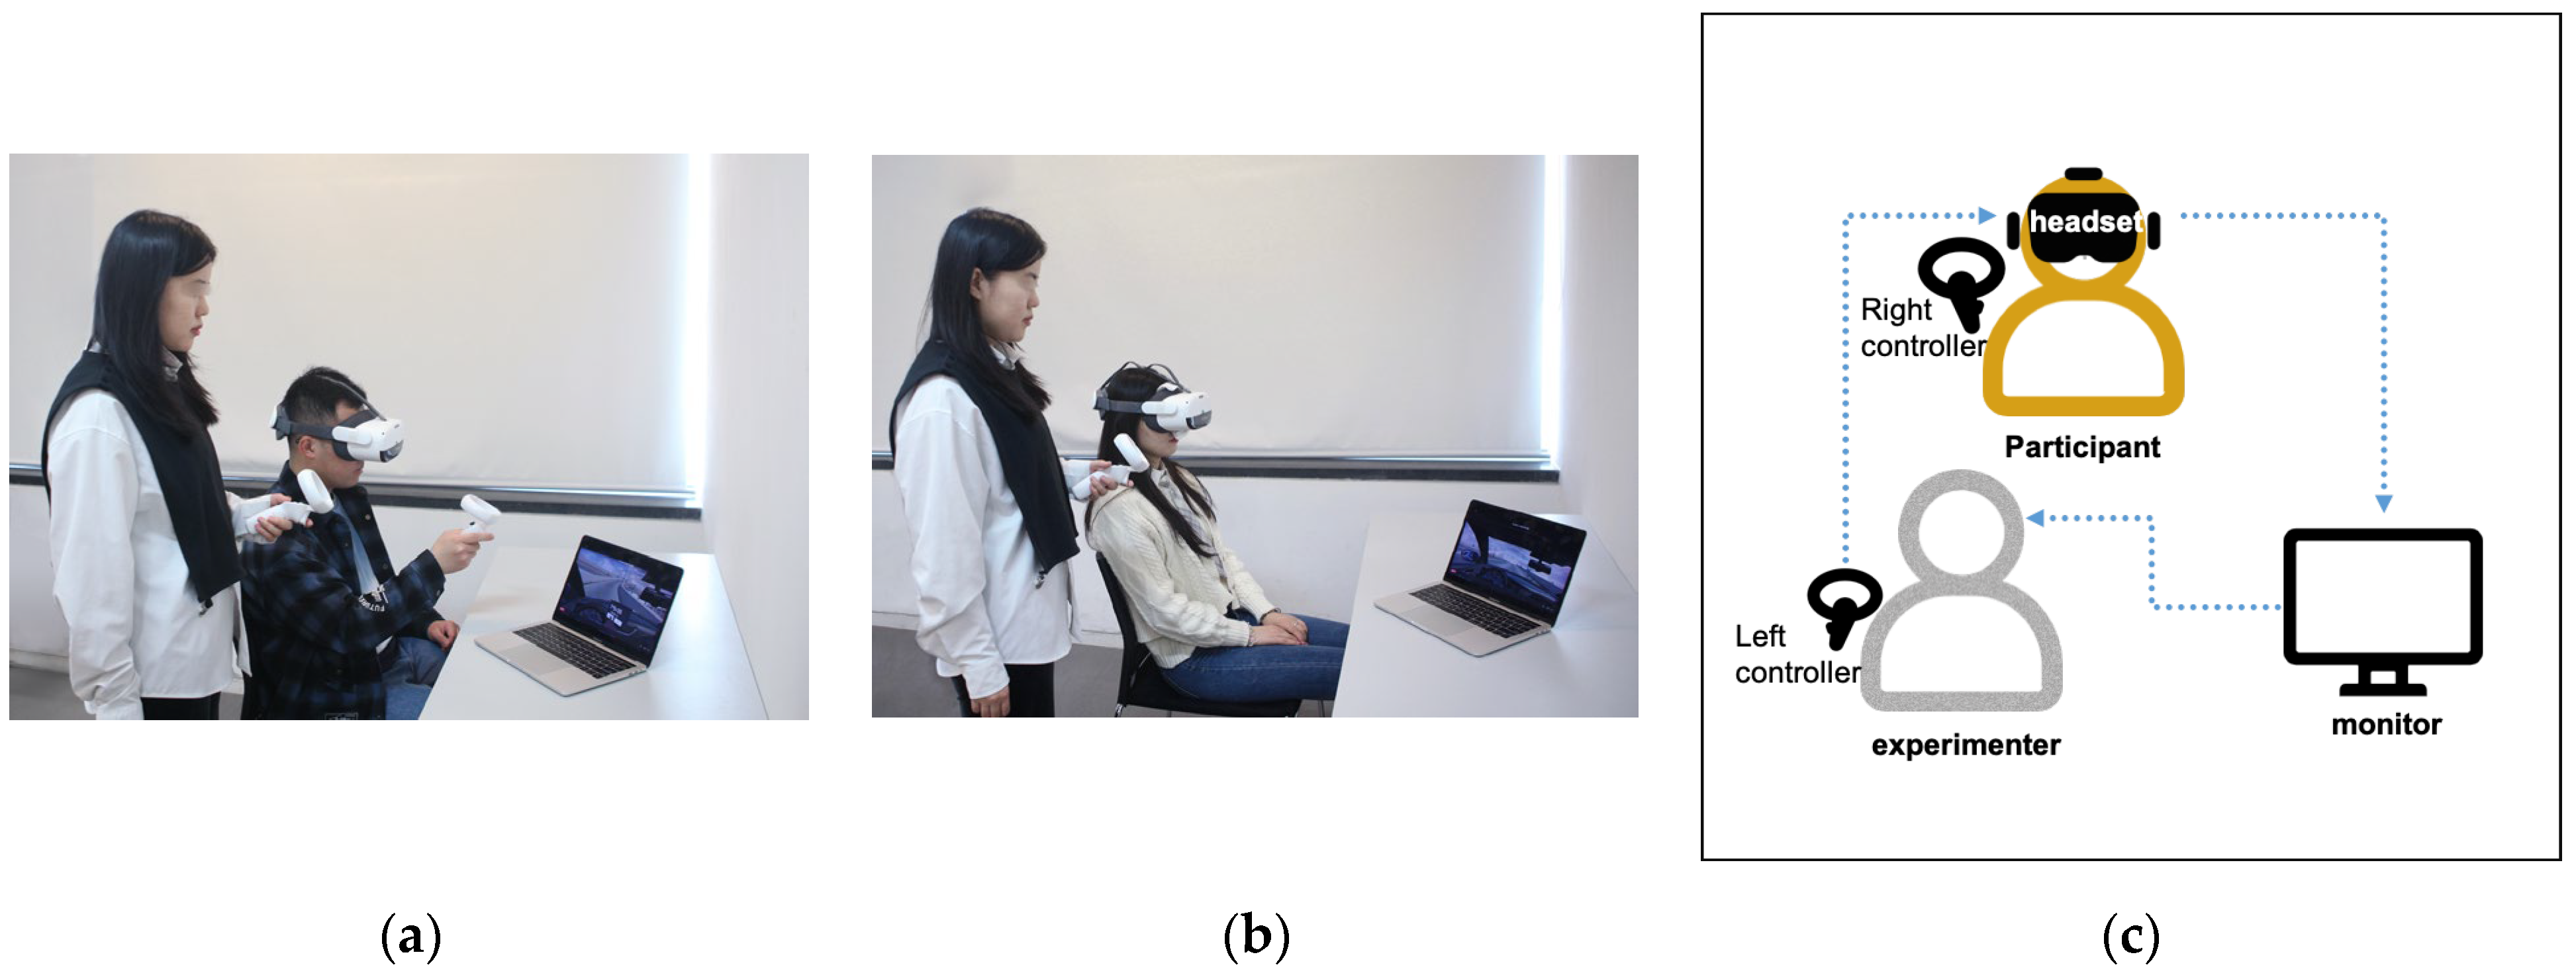
3.4. Stimuli and Apparatus
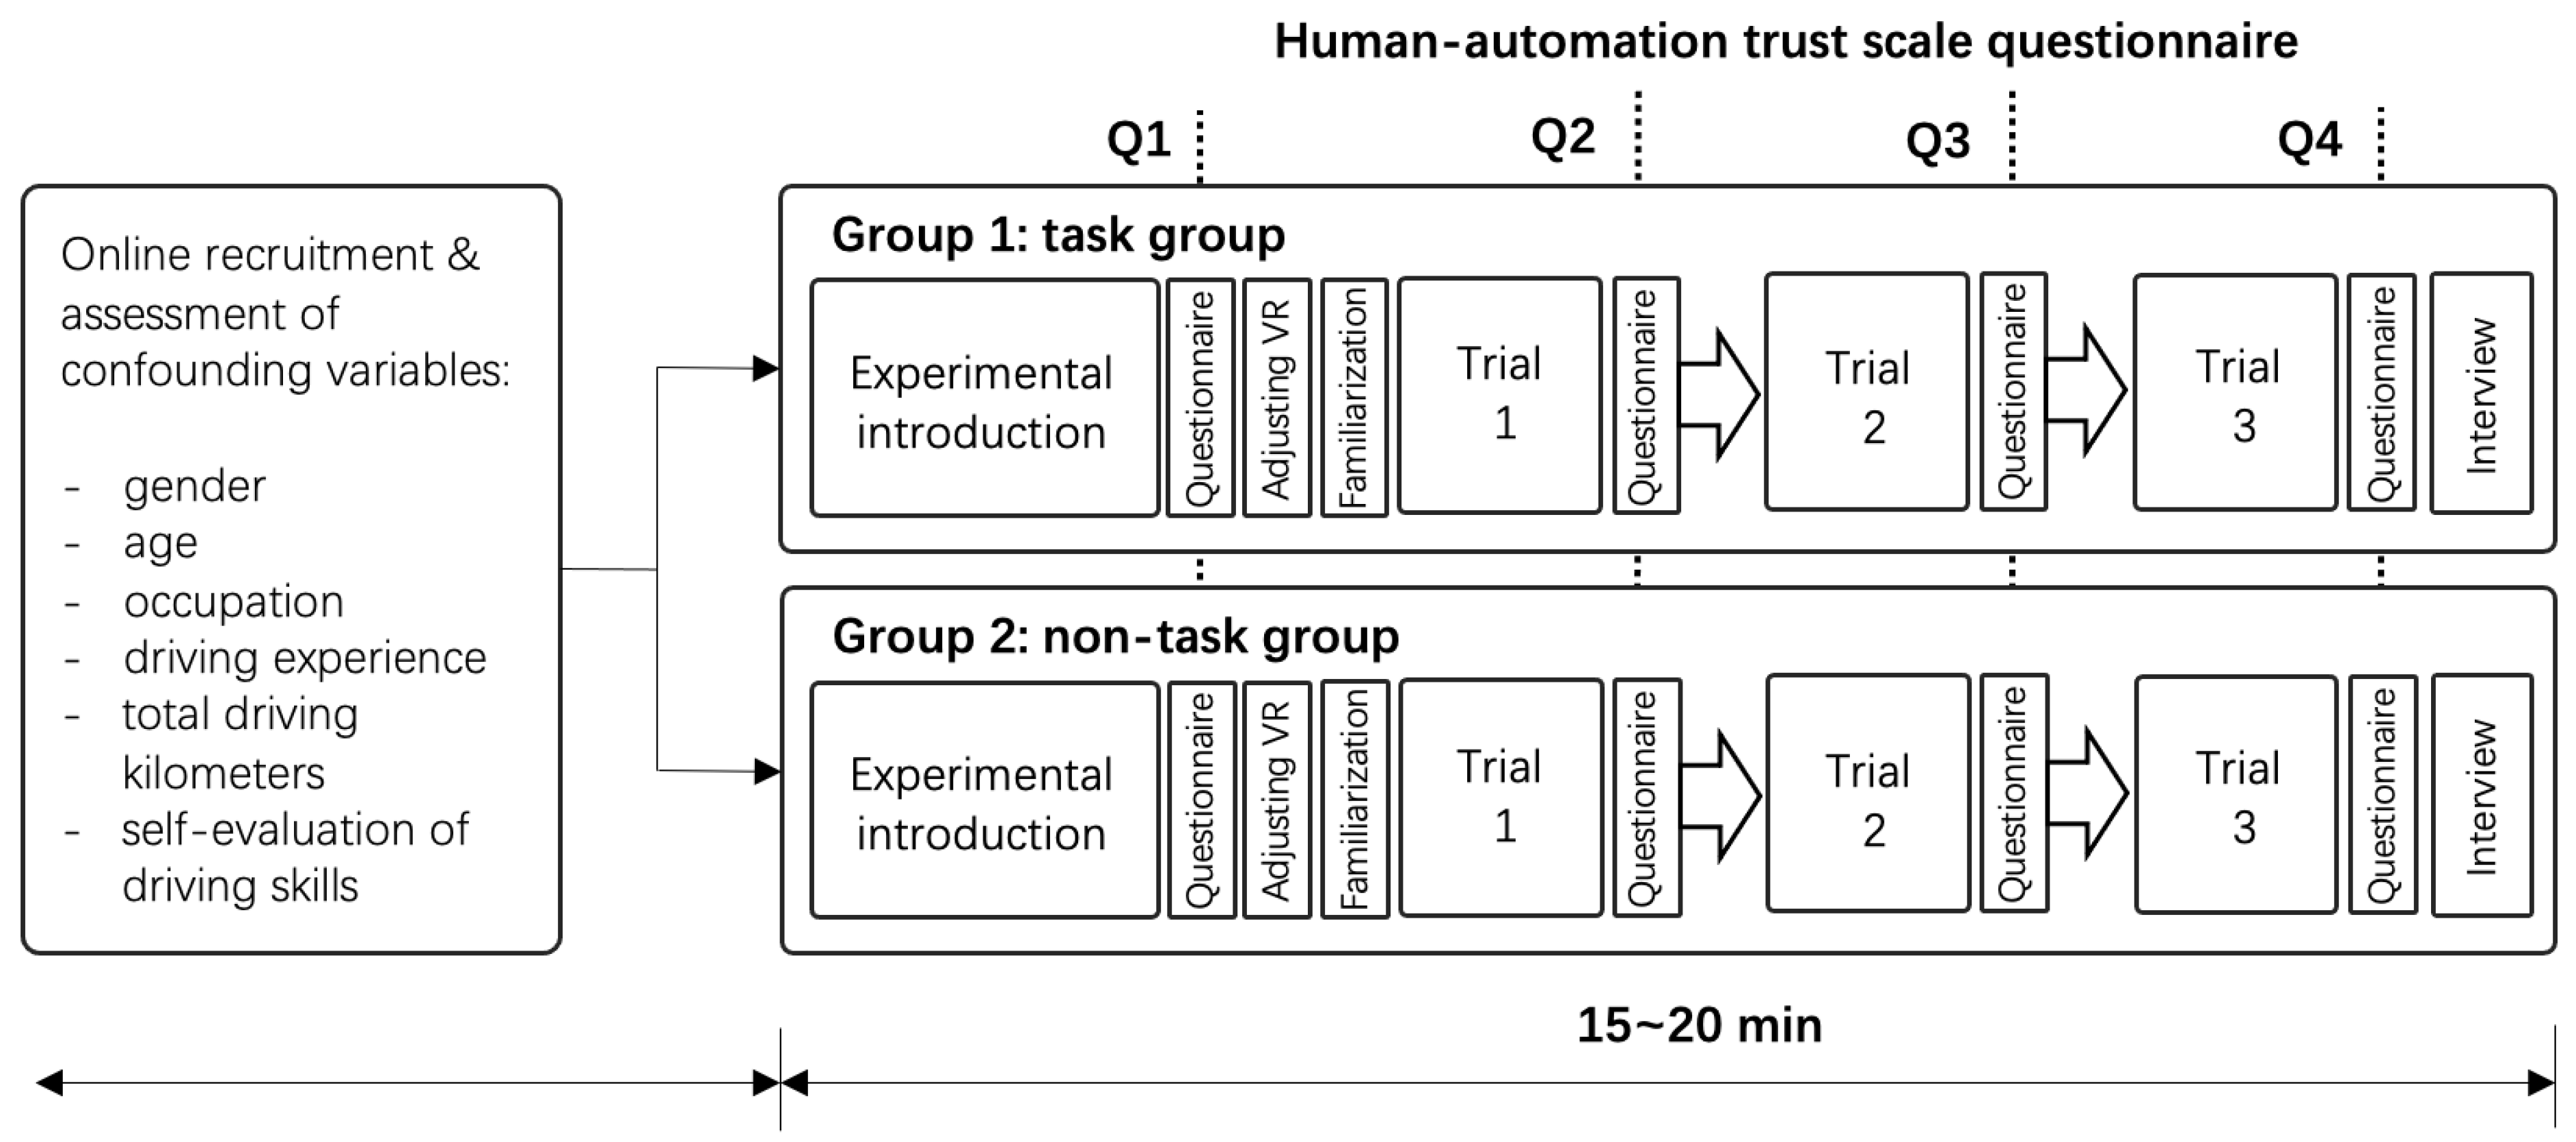
3.5. Experimental Procedure
- Step 1 Survey.
- Step 2 Introduction.
- Step 3 Preparation.
- Step 4 Experiment.
- Step 5 Interview.
4. Results
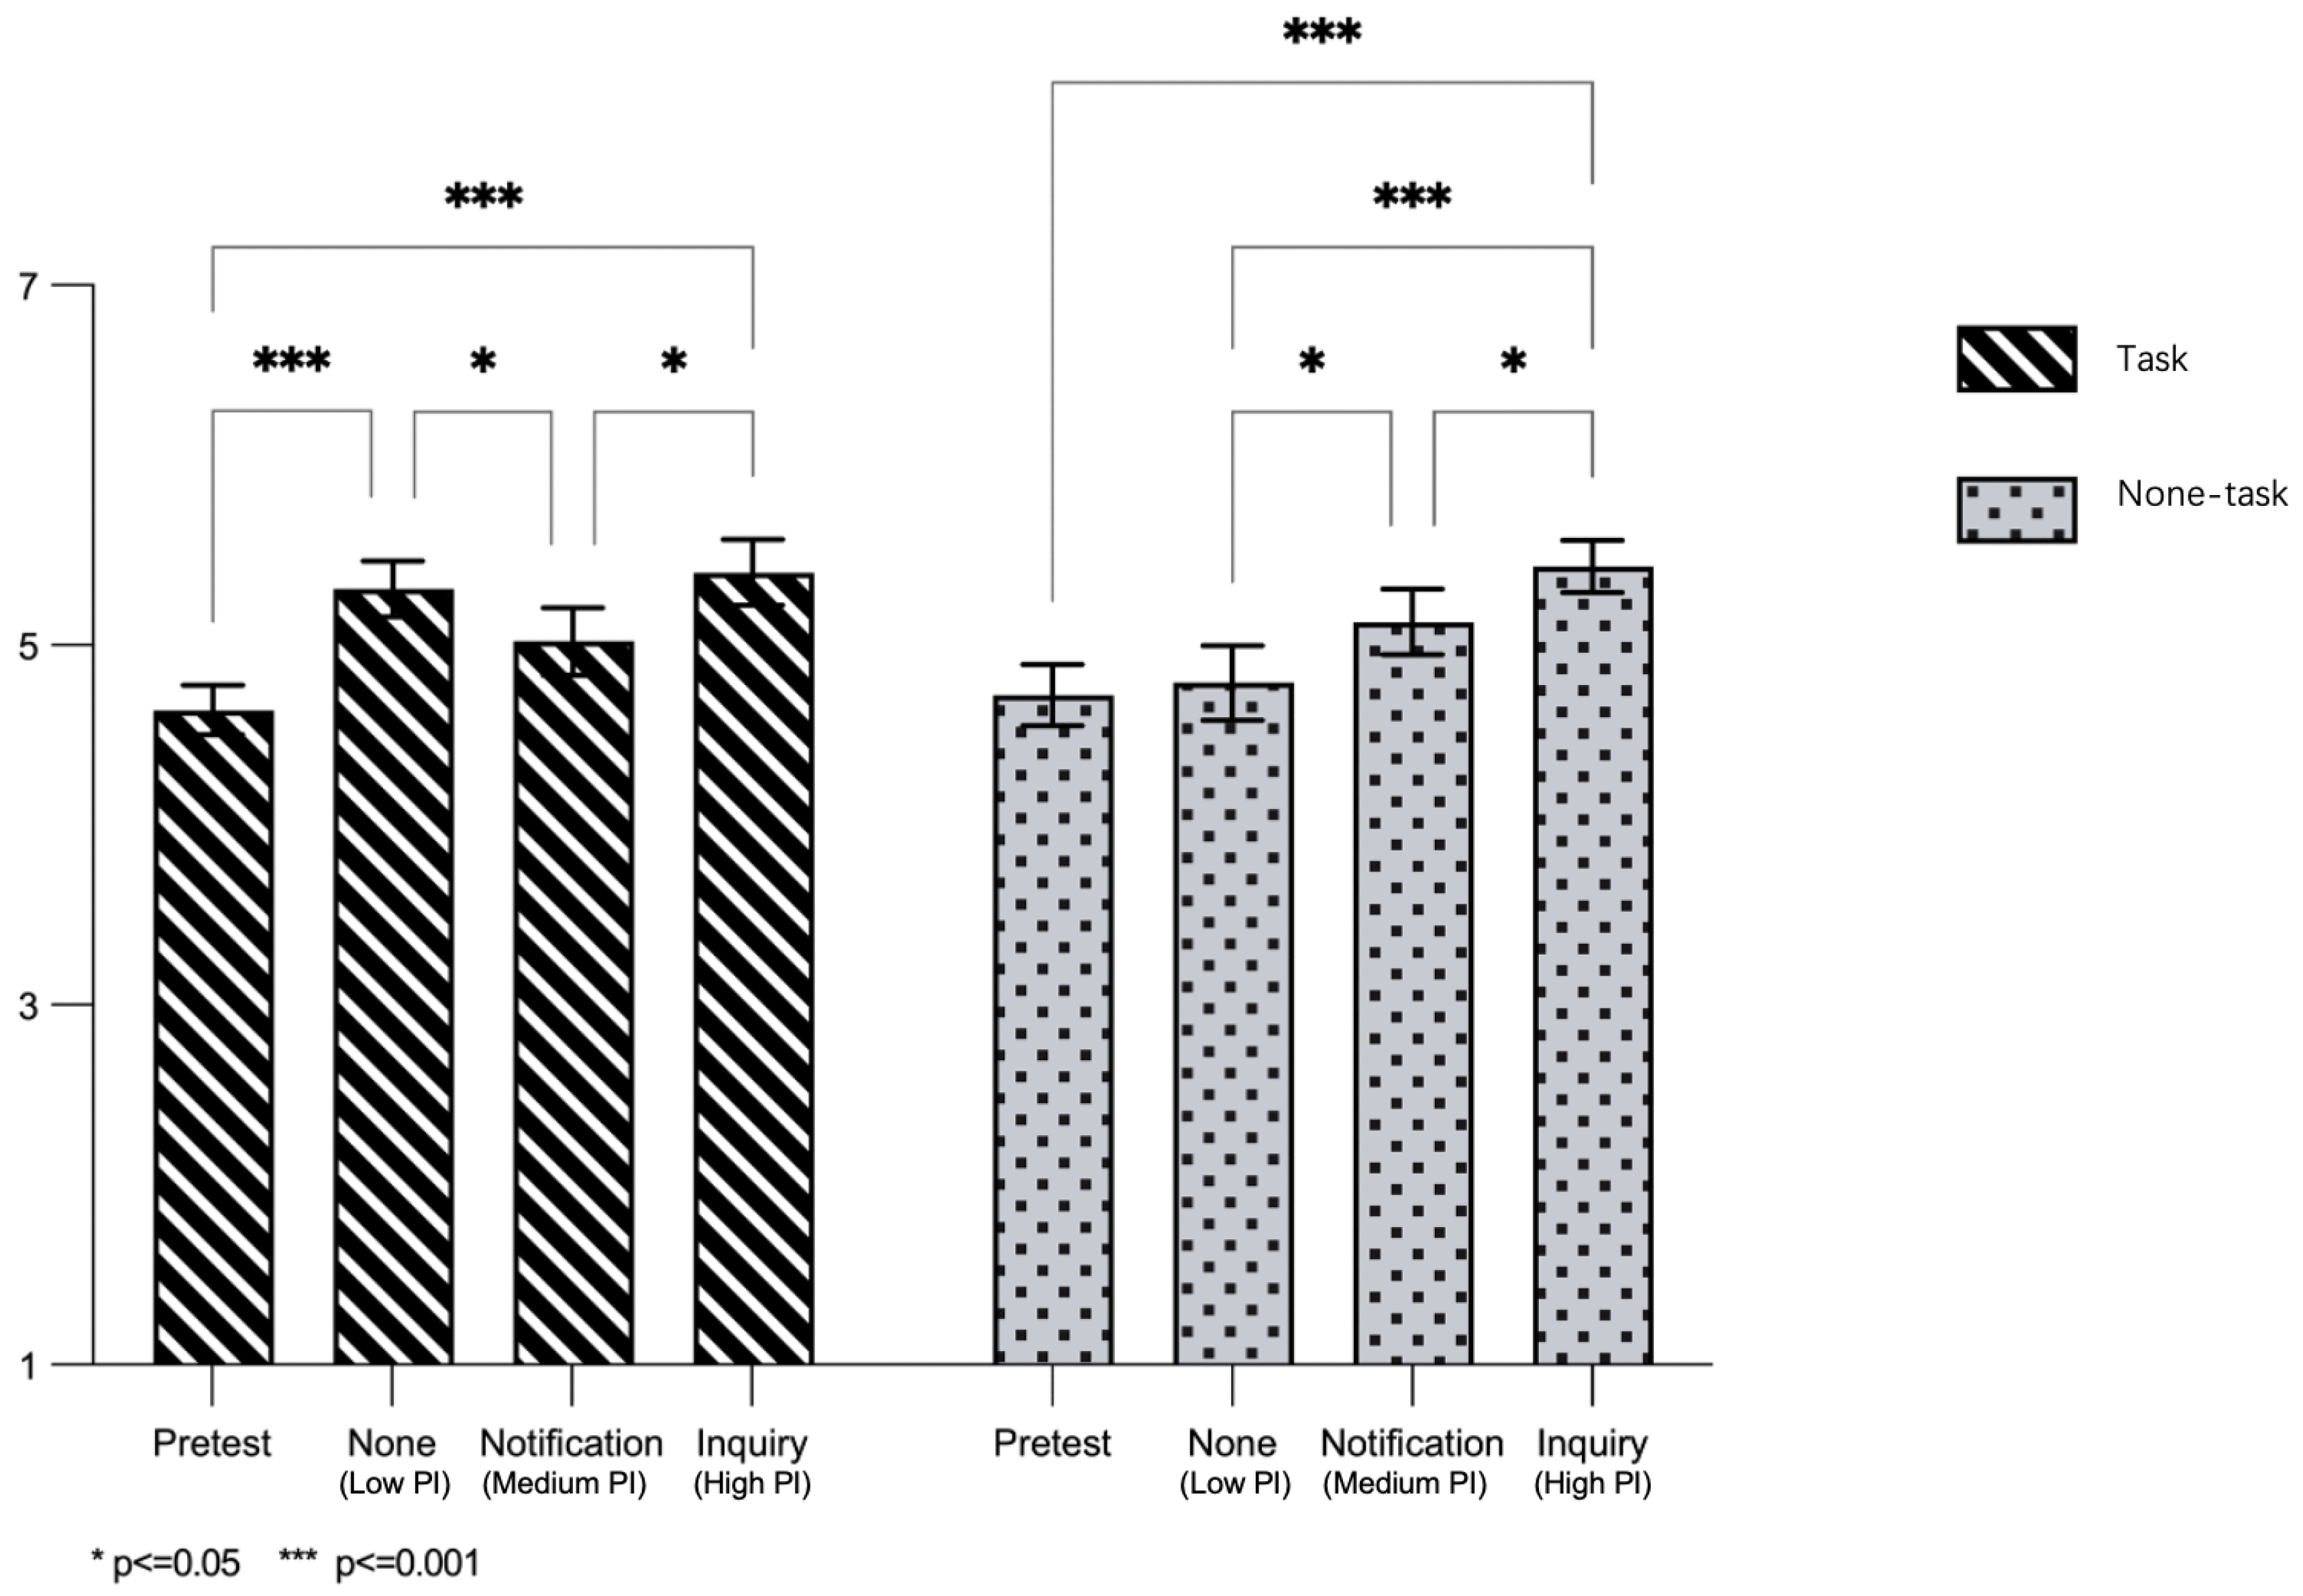
4.1. Task and Non-Task
4.2. Gender
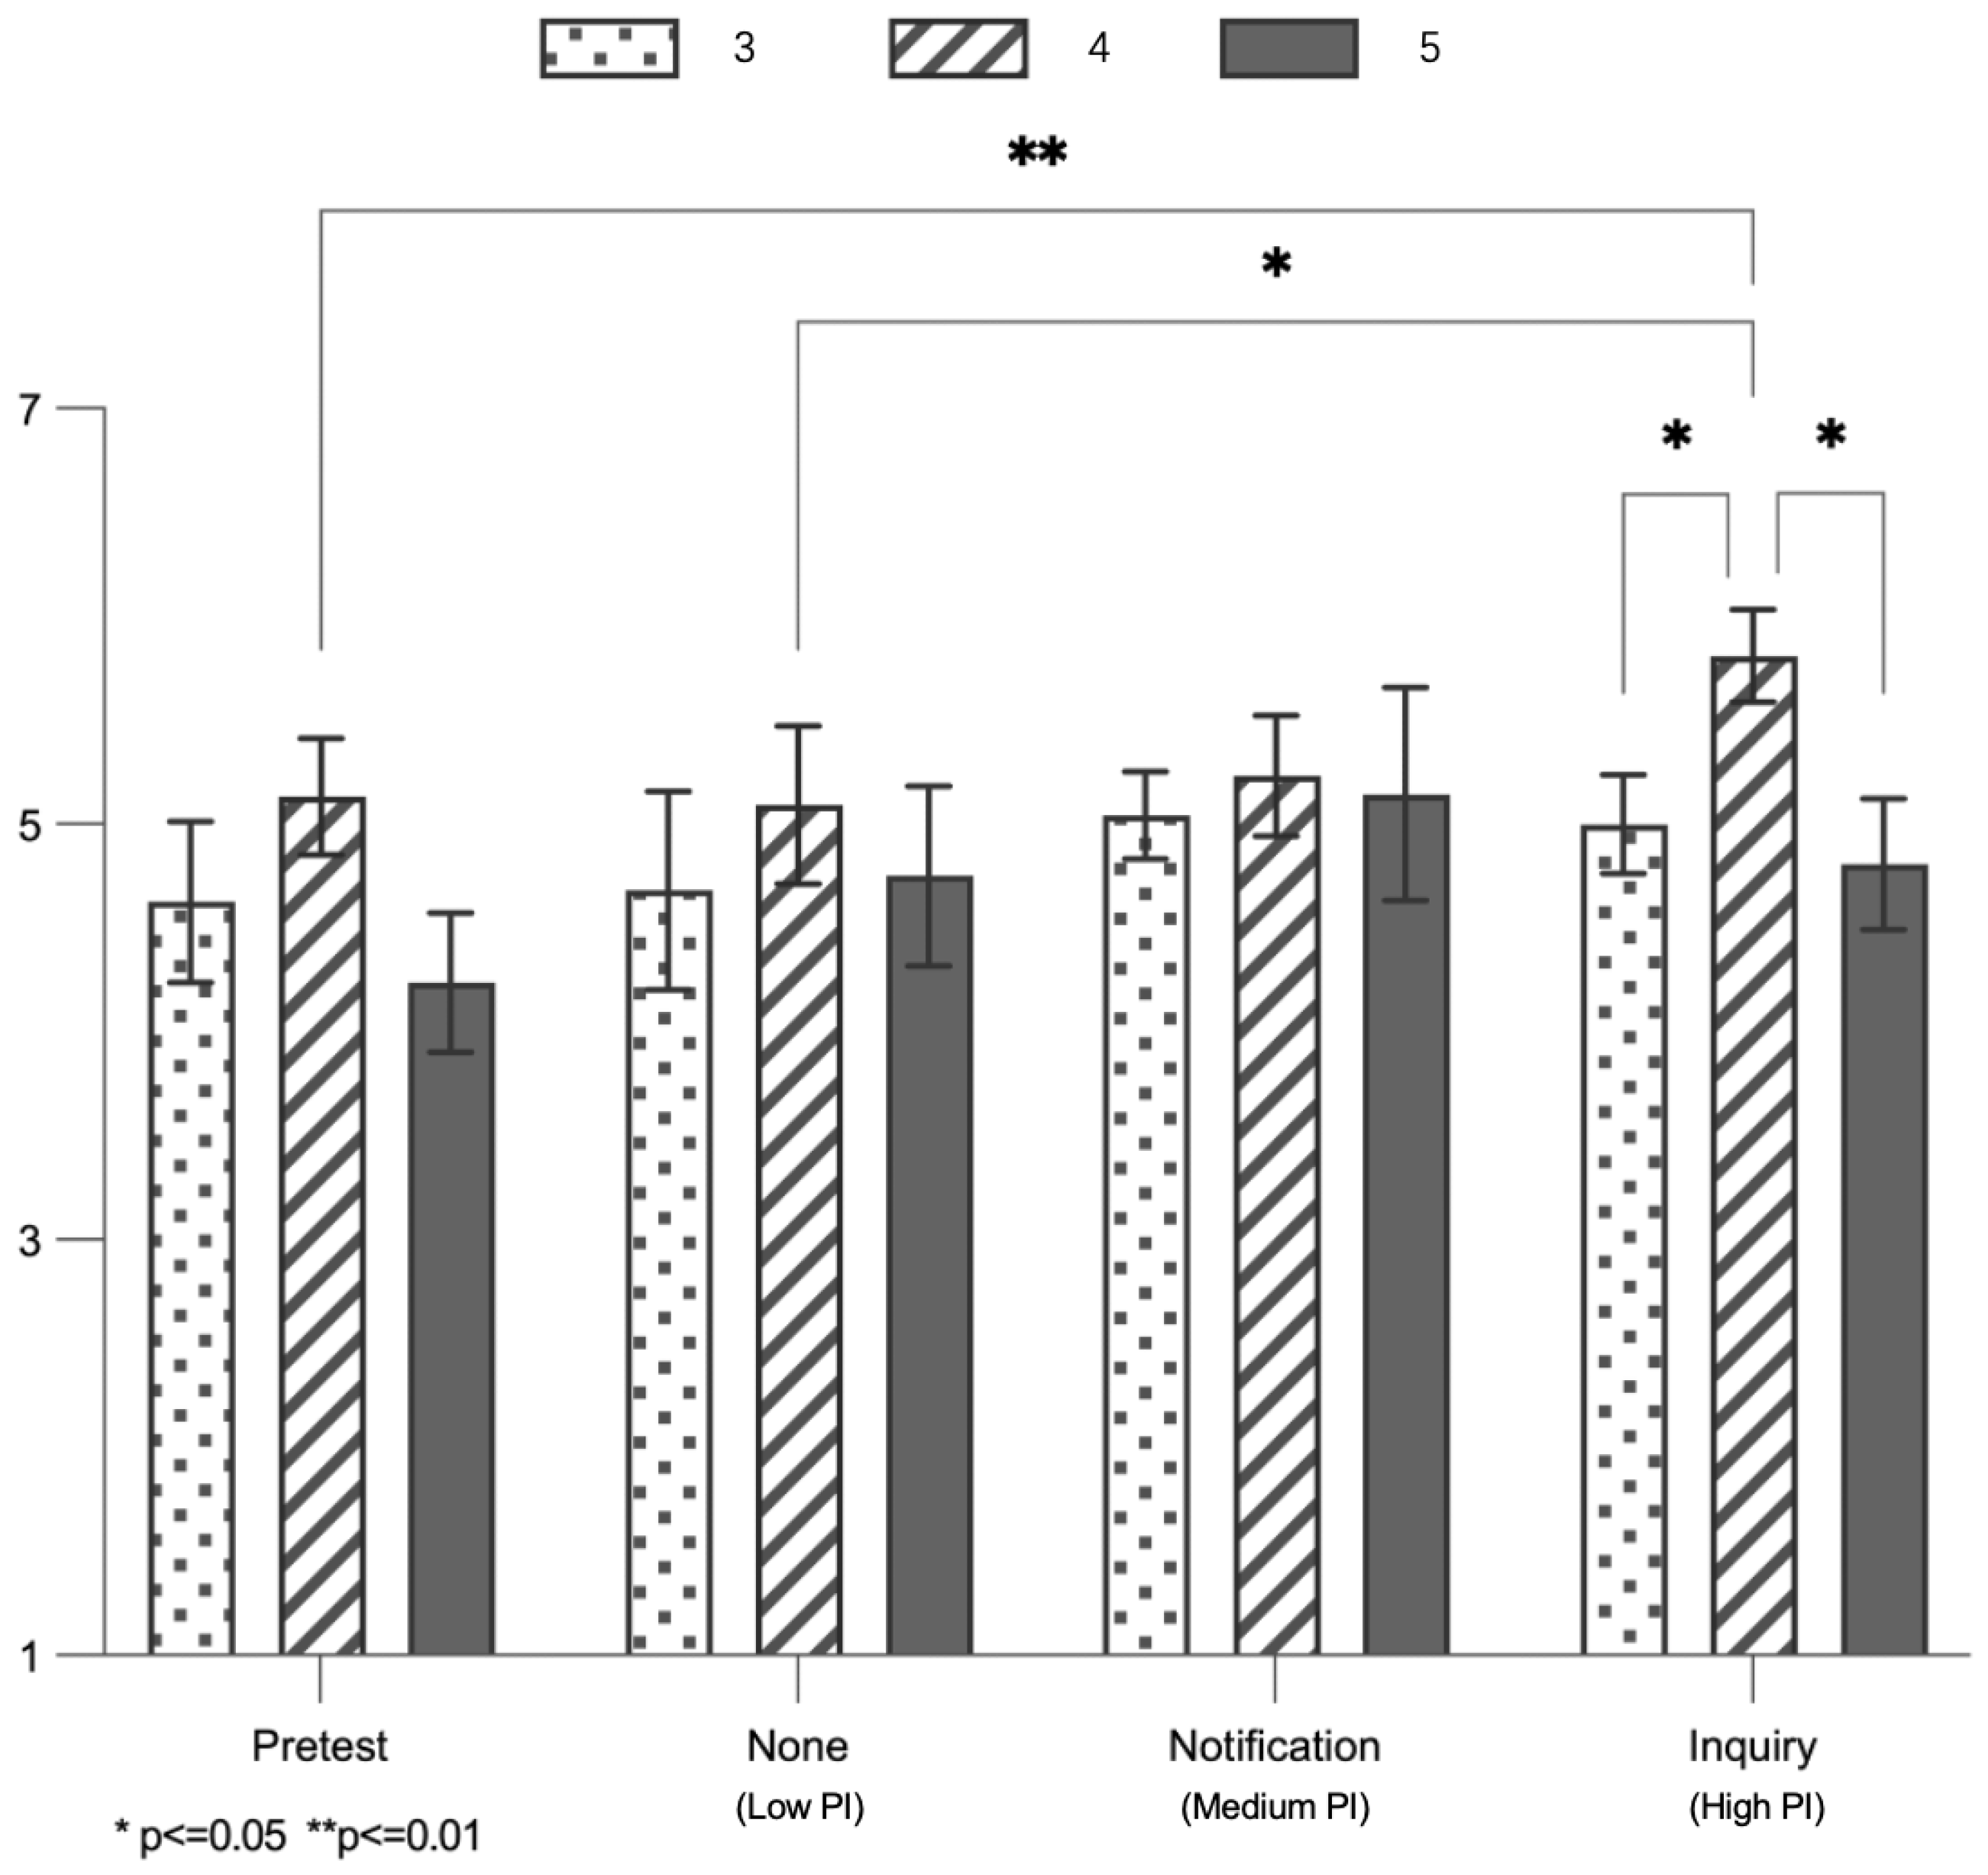
4.3. Extroversion
5. Discussion
6. Conclusions
- (i)
- In the future, trust in the system can be enhanced by increasing the PI level. During voice interaction with the driver, it will be more helpful for increasing trust when AVs proactively report current situational changes to the driver, delegate the authority for driving behavior decisions to the driver under suitable conditions, and inquire whether to execute the provided suggestions.
- (ii)
- When L4 AVs detect that the driver is handling other tasks, they may need to be cautious about informing the driver of driving decisions, especially male drivers, as this may have a negative impact on trust. Instead, AVs can choose to inquire or simply execute the decision directly without any interaction.
- (iii)
- It is also helpful to gather information about the driver’s personality beforehand to select interaction schemes for different extroverted groups. For drivers with extroverted but not extremely extroverted personalities, a higher level of PI can be utilized more frequently to enhance their trust in AVs.
Author Contributions
Funding
Institutional Review Board Statement
Informed Consent Statement
Data Availability Statement
Acknowledgments
Conflicts of Interest
References
- Dzindolet, M.T.; Peterson, S.A.; Pomranky, R.A.; Pierce, L.G.; Beck, H.P. The Role of Trust in Automation Reliance. Int. J. Hum. Comput. Stud. 2003, 58, 697–718. [Google Scholar] [CrossRef]
- Sheridan, T.B. Individual Differences in Attributes of Trust in Automation: Measurement and Application to System Design. Front. Psychol. 2019, 10, 1117. [Google Scholar] [CrossRef]
- Zhang, S.; Meng, Z.; Chen, B.; Yang, X.; Zhao, X. Motivation, Social Emotion, and the Acceptance of Artificial Intelligence Virtual Assistants—Trust-Based Mediating Effects. Front. Psychol. 2021, 12, 728495. [Google Scholar] [CrossRef] [PubMed]
- Lee, J.D.; See, K.A. Trust in Automation: Designing for Appropriate Reliance. Hum. Factors 2004, 46, 50–80. [Google Scholar] [CrossRef] [PubMed]
- Chen, Y.; Shiwakoti, N.; Stasinopoulos, P.; Khan, S.K. State-of-the-Art of Factors Affecting the Adoption of Automated Vehicles. Sustainability 2022, 14, 6697. [Google Scholar] [CrossRef]
- Tomasevic, N.; Young, K.L.; Horberry, T.; Fildes, B. A Path towards Sustainable Vehicle Automation: Willingness to Engage in Level 3 Automated Driving. Sustainability 2022, 14, 4602. [Google Scholar] [CrossRef]
- Tan, H.; Zhao, Y.; Li, S.; Wang, W.; Zhu, M.; Hong, J.; Yuan, X. Relationship between Social Robot Proactive Behavior and the Human Perception of Anthropomorphic Attributes. Adv. Robot. 2020, 34, 1324–1336. [Google Scholar] [CrossRef]
- Samson, K.; Kostyszyn, P. Effects of Cognitive Load on Trusting Behavior—An Experiment Using the Trust Game. PLoS ONE 2015, 10, e0127680. [Google Scholar] [CrossRef] [PubMed]
- Satake, S.; Glas, D.F.; Imai, M.; Ishiguro, H.; Hagita, N. How to approach humans?: Strategies for social robots to initiate interaction. In Proceedings of the HRI09: International Conference on Human Robot Interaction, La Jolla, CA, USA, 9–13 March 2009. [Google Scholar] [CrossRef]
- Peng, Z.; Kwon, Y.; Lu, J.; Wu, Z.; Ma, X. Design and Evaluation of Service Robot’s Proactivity in Decision-Making Support Process. In Proceedings of the CHI’19: CHI Conference on Human Factors in Computing Systems Glasgow, Scotland, UK, 4–9 May 2019. [Google Scholar] [CrossRef]
- Kraus, M.; Wagner, N.; Minker, W. Effects of Proactive Dialogue Strategies on Human-Computer Trust. In Proceedings of the Proceedings of the 28th ACM Conference on User Modeling, Adaptation and Personalization, New York, NY, USA, 13 July 2020; Association for Computing Machinery: New York, NY, USA; pp. 107–116.
- Grosinger, J.; Pecora, F.; Saffiotti, A. Making Robots Proactive through Equilibrium Maintenance. In Proceedings of the Twenty-Fifth International Joint Conference on Artificial Intelligence (IJCAI-16), New York, NY, USA, 9–15 July 2016. [Google Scholar]
- Brünken, R.; Steinbacher, S.; Plass, J.L.; Leutner, D. Assessment of Cognitive Load in Multimedia Learning Using Dual-Task Methodology. Exp. Psychol. 2002, 49, 109–119. [Google Scholar] [CrossRef]
- Jo, K.; Kim, J.; Kim, D.; Jang, C.; Sunwoo, M. Development of Autonomous Car—Part I: Distributed System Architecture and Development Process. IEEE Trans. Ind. Electron. 2014, 61, 7131–7140. [Google Scholar] [CrossRef]
- He, W.; Yan, G.; Xu, L. Developing Vehicular Data Cloud Services in the IoT Environment. IEEE Trans. Ind. Inform. 2014, 10, 1587–1595. [Google Scholar] [CrossRef]
- J3016_202104: Taxonomy and Definitions for Terms Related to Driving Automation Systems for On-Road Motor Vehicles—SAE International. Available online: https://www.sae.org/standards/content/j3016_202104/ (accessed on 24 February 2023).
- Schoettle, B.; Sivak, M. A Survey of Public Opinion about Autonomous and Self-Driving Vehicles in the U.S., the U.K., and Australia; University of Michigan, Transportation Research Institute: Ann Arbor, MI, USA, 2014. [Google Scholar]
- Shneiderman, B. Human-Centered Artificial Intelligence: Reliable, Safe & Trustworthy. Int. J. Hum. Comput. Interact. 2020, 36, 495–504. [Google Scholar] [CrossRef]
- Favarò, F.M.; Nader, N.; Eurich, S.O.; Tripp, M.; Varadaraju, N. Examining Accident Reports Involving Autonomous Vehicles in California. PLoS ONE 2017, 12, e0184952. [Google Scholar] [CrossRef] [PubMed]
- Kalra, N.; Paddock, S.M. Driving to Safety: How Many Miles of Driving Would It Take to Demonstrate Autonomous Vehicle Reliability? Transp. Res. Part A Policy Pract. 2016, 94, 182–193. [Google Scholar] [CrossRef]
- Kyriakidis, M.; Happee, R.; de Winter, J. Public Opinion on Automated Driving: Results of an International Questionnaire among 5000 Respondents. Transp. Res. Part F Traffic Psychol. Behav. 2015, 32, 127–140. [Google Scholar] [CrossRef]
- Schoettle, B.; Sivak, M. Motorists’ Preferences for Different Levels of Vehicle Automation; University of Michigan, Transportation Research Institute: Ann Arbor, MI, USA, 2015. [Google Scholar]
- Mayer, R.C.; Davis, J.H.; Schoorman, F.D. An Integrative Model Of Organizational Trust. AMR 1995, 20, 709–734. [Google Scholar] [CrossRef]
- Hoff, K.A.; Bashir, M. Trust in Automation: Integrating Empirical Evidence on Factors That Influence Trust. Hum. Factors 2015, 57, 407–434. [Google Scholar] [CrossRef]
- Chi, O.H.; Jia, S.; Li, Y.; Gursoy, D. Developing a Formative Scale to Measure Consumers’ Trust toward Interaction with Artificially Intelligent (AI) Social Robots in Service Delivery. Comput. Hum. Behav. 2021, 118, 106700. [Google Scholar] [CrossRef]
- Yuksel, B.F.; Collisson, P.; Czerwinski, M. Brains or Beauty: How to Engender Trust in User-Agent Interactions. ACM Trans. Internet Technol. 2017, 17, 1–20. [Google Scholar] [CrossRef]
- Desai, M.; Kaniarasu, P.; Medvedev, M.; Steinfeld, A.; Yanco, H. Impact of Robot Failures and Feedback on Real-Time Trust. In Proceedings of the 2013 8th ACM/IEEE International Conference on Human-Robot Interaction (HRI), Tokyo, Japan, 3–6 March 2013; pp. 251–258. [Google Scholar]
- Parasuraman, R.; Miller, C.A. Trust and Etiquette in High-Criticality Automated Systems. Commun. ACM 2004, 47, 51–55. [Google Scholar] [CrossRef]
- Niu, D.; Terken, J.; Eggen, B. Anthropomorphizing Information to Enhance Trust in Autonomous Vehicles. Hum. Factors Ergon. 2018, 28, 352–359. [Google Scholar] [CrossRef]
- Young, A.D. Autonomous Morals_ Inferences of Mind Predict Acceptance of AI Behavior in Sacrificial Moral Dilemmas. J. Exp. Soc. Psychol. 2019, 7, 103870. [Google Scholar] [CrossRef]
- King-Casas, B.; Tomlin, D.; Anen, C.; Camerer, C.F.; Quartz, S.R.; Montague, P.R. Getting to Know You: Reputation and Trust in a Two-Person Economic Exchange. Science 2005, 308, 78–83. [Google Scholar] [CrossRef]
- Humans and Intelligent Vehicles: The Hope, the Help, and the Harm. Available online: https://ieeexplore.ieee.org/abstract/document/7467508/ (accessed on 22 February 2023).
- Ma, J.; Feng, X. Analysing the Effects of Scenario-Based Explanations on Automated Vehicle HMIs from Objective and Subjective Perspectives. Sustainability 2024, 16, 63. [Google Scholar] [CrossRef]
- Omrani, N.; Rivieccio, G.; Fiore, U.; Schiavone, F.; Agreda, S.G. To Trust or Not to Trust? An Assessment of Trust in AI-Based Systems: Concerns, Ethics and Contexts. Technol. Forecast. Soc. Chang. 2022, 181, 121763. [Google Scholar] [CrossRef]
- Zhang, J.-D.; Liu, L.A.; Liu, W. Trust and Deception in Negotiation: Culturally Divergent Effects. Manag. Organ. Rev. 2015, 11, 123–144. [Google Scholar] [CrossRef]
- De Graaf, M.M.; Allouch, S.B. Exploring Influencing Variables for the Acceptance of Social Robots. Robot. Auton. Syst. 2013, 61, 1476–1486. [Google Scholar] [CrossRef]
- Lee, M.K.; Kiesler, S.; Forlizzi, J.; Srinivasa, S.; Rybski, P. Gracefully Mitigating Breakdowns in Robotic Services. In Proceedings of the 2010 5th ACM/IEEE International Conference on Human-Robot Interaction (HRI), Osaka, Japan, 2–5 March 2010; pp. 203–210. [Google Scholar]
- Looije, R.; Neerincx, M.A.; Cnossen, F. Persuasive Robotic Assistant for Health Self-Management of Older Adults: Design and Evaluation of Social Behaviors. Int. J. Hum. Comput. Stud. 2010, 68, 386–397. [Google Scholar] [CrossRef]
- Liao, Q.V.; Davis, M.; Geyer, W.; Muller, M.; Shami, N.S. What Can You Do?: Studying Social-Agent Orientation and Agent Proactive Interactions with an Agent for Employees. In Proceedings of the 2016 ACM Conference on Designing Interactive Systems, Brisbane, QLD, Australia, 4 June 2016; ACM: New York, NY, USA; pp. 264–275. [Google Scholar]
- Yokoi, R.; Nakayachi, K. The Effect of Value Similarity on Trust in the Automation Systems: A Case Of transportation and Medical Care. Int. J. Hum. Comput. Interact. 2021, 37, 1269–1282. [Google Scholar] [CrossRef]
- Goldberg, L.R. The Development of Markers for the Big-Five Factor Structure. Psychol. Assess. 1992, 4, 26–42. [Google Scholar] [CrossRef]
- Kraus, M.; Wagner, N.; Callejas, Z.; Minker, W. The Role of Trust in Proactive Conversational Assistants. IEEE Access 2021, 9, 112821–112836. [Google Scholar] [CrossRef]
- Parasuraman, R.; Riley, V. Humans and Automation: Use, Misuse, Disuse, Abuse. Hum. Factors 1997, 39, 230–253. [Google Scholar] [CrossRef]
- Robinette, P.; Li, W.; Allen, R.; Howard, A.M.; Wagner, A.R. Overtrust of robots in emergency evacuation scenarios. In Proceedings of the HRI 2016—11th ACM/IEEE International Conference on Human Robot Interaction, Christchurch, New Zealand, 7–10 March 2016. [Google Scholar] [CrossRef]
- Atoyan, H.; Duquet, J.-R.; Robert, J.-M. Trust in New Decision Aid Systems. In Proceedings of the 18th International Conference on Association Francophone d’Interaction Homme-Machine—IHM’06, Montreal, QC, Canada, 18–21 April 2006; ACM Press: New York, NY, USA; pp. 115–122.
- Robinette, P.; Howard, A.M.; Wagner, A.R. Effect of Robot Performance on Human–Robot Trust in Time-Critical Situations. IEEE Trans. Hum. Mach. Syst. 2017, 47, 425–436. [Google Scholar] [CrossRef]
- Jian, J.-Y.; Bisantz, A.M.; Drury, C.G. Foundations for an Empirically Determined Scale of Trust in Automated Systems. Int. J. Cogn. Ergon. 2000, 4, 53–71. [Google Scholar] [CrossRef]
- Choi, J.K.; Ji, Y.G. Investigating the Importance of Trust on Adopting an Autonomous Vehicle. Int. J. Hum. Comput. Interact. 2015, 31, 692–702. [Google Scholar] [CrossRef]
- Petersen, L.; Robert, L.; Yang, X.J.; Tilbury, D.M. Situational Awareness, Driver’s Trust in Automated Driving Systems and Secondary Task Performance. arXiv 2019, arXiv:1903.05251. [Google Scholar]
- Sarkar, S.; Araiza-Illan, D.; Eder, K. Effects of Faults, Experience, and Personality on Trust in a Robot Co-Worker. arXiv 2017, arXiv:1703.02335. [Google Scholar]


| Types of Interaction | Task | Non-Task | t | p | ||
|---|---|---|---|---|---|---|
| M | SD | M | SD | |||
| Pretest | 4.640 | 0.728 | 4.722 | 0.886 | −0.082 | 0.078 |
| Low PI | 5.313 | 0.824 | 4.790 | 1.090 | 0.522 | 0.885 |
| Medium PI | 5.021 | 0.987 | 5.130 | 0.941 | −0.109 | 0.678 |
| High PI | 5.405 | 0.954 | 5.438 | 0.744 | −0.033 | 0.050 |
| F | 15.549 | 12.507 | ||||
| p | <0.01 | <0.01 | ||||
| Partial η2 | 0.651 | 0.610 | ||||
| Gender | Male | Female | t | p | Effect Size (r) | |||
|---|---|---|---|---|---|---|---|---|
| M | SD | M | SD | |||||
| Task | Pretest | 4.618 | 0.612 | 4.656 | 0.824 | −0.135 | 0.894 | 0.026 |
| Low PI | 4.979 | 0.717 | 5.563 | 0.830 | −1.948 | 0.062 | 0.356 | |
| Medium PI | 4.451 | 0.938 | 5.448 | 0.808 | −3.015 | 0.006 | 0.509 | |
| High PI | 5.111 | 0.856 | 5.625 | 0.991 | −1.438 | 0.162 | 0.271 | |
| Non-task | Pretest | 4.326 | 0.934 | 4.995 | 0.766 | −2.041 | 0.052 | 0.378 |
| Low PI | 4.439 | 1.184 | 5.031 | 0.986 | −1.412 | 0.170 | 0.271 | |
| Medium PI | 5.098 | 1.094 | 5.151 | 0.858 | −0.140 | 0.890 | 0.028 | |
| High PI | 5.371 | 0.670 | 5.484 | 0.810 | −0.382 | 0.706 | 0.076 | |
| Levels of Extraversion | 3 | 4 | 5 | F | p | η2 | Means with LSD | |||
|---|---|---|---|---|---|---|---|---|---|---|
| M | SD | M | SD | M | SD | Post hoc Analysis | ||||
| Pretest | 4.625 | 0.369 | 5.133 | 0.286 | 4.238 | 0.342 | 1.522 | 0.239 | 0.186 | N/A |
| Low PI | 4.681 | 0.480 | 5.092 | 0.372 | 4.750 | 0.445 | 0.260 | 0.853 | 0.038 | N/A |
| Medium PI | 5.042 | 0.407 | 5.233 | 0.315 | 5.143 | 0.377 | 0.106 | 0.956 | 0.016 | N/A |
| High PI | 5.000 | 0.294 | 5.808 | 0.228 | 4.810 | 0.272 | 3.091 | 0.050 | 0.317 | 3 vs. 4: p = 0.042 |
| 4 vs. 5: p = 0.011 | ||||||||||
Disclaimer/Publisher’s Note: The statements, opinions and data contained in all publications are solely those of the individual author(s) and contributor(s) and not of MDPI and/or the editor(s). MDPI and/or the editor(s) disclaim responsibility for any injury to people or property resulting from any ideas, methods, instructions or products referred to in the content. |
© 2024 by the authors. Licensee MDPI, Basel, Switzerland. This article is an open access article distributed under the terms and conditions of the Creative Commons Attribution (CC BY) license (https://creativecommons.org/licenses/by/4.0/).
Share and Cite
Sun, J.; Huang, Y.; Huang, X.; Zhang, J.; Zhang, H. Effect of Proactive Interaction on Trust in Autonomous Vehicles. Sustainability 2024, 16, 3404. https://doi.org/10.3390/su16083404
Sun J, Huang Y, Huang X, Zhang J, Zhang H. Effect of Proactive Interaction on Trust in Autonomous Vehicles. Sustainability. 2024; 16(8):3404. https://doi.org/10.3390/su16083404
Chicago/Turabian StyleSun, Jingyue, Yanqun Huang, Xueqin Huang, Jian Zhang, and Hechen Zhang. 2024. "Effect of Proactive Interaction on Trust in Autonomous Vehicles" Sustainability 16, no. 8: 3404. https://doi.org/10.3390/su16083404
APA StyleSun, J., Huang, Y., Huang, X., Zhang, J., & Zhang, H. (2024). Effect of Proactive Interaction on Trust in Autonomous Vehicles. Sustainability, 16(8), 3404. https://doi.org/10.3390/su16083404