Abstract
Particle size reduction is a commonly used pretreatment technique to promote methane production from anaerobic digestion (AD) of food waste (FW). However, limited research has focused on the effect of micron-sized particles on AD of FW. This research presented an ultrafine wet milling (UFWM) pretreatment method to reduce the particle size of FW particles. After four hours of milling, D90 was reduced to 73 μm and cumulative methane production boosted from 307.98 mL/g vs. to 406.75 mL/g vs. without ammonia inhibition. We evaluated the performance of the AD systems and explored their facilitation mechanisms. Kinetic analysis showed that the modified Gompertz model predicted experimental values most accurately. UFWM pretreatment increased the maximum methane production rate by 44.4% and reduced the lag time by 0.65 days. The mechanical stress and collisions of milling resulted in a scaly surface of the particles, which greatly increased the voids and surface area. A rise in the XPS peak area of the C–N and C=O bonds proved the promotion of the liberation of carbohydrates and fats. Further microbial community analysis revealed that the relative abundance of Bacteroidota and Methanosarcina were enriched by UFWM. Meanwhile, methane metabolism pathway analysis confirmed that module M00567, module M00357, and related enzymes were stimulated. This study provided a theoretical basis for UFWM pretreatment applications and improvements in AD of FW.
1. Introduction
A third of the food produced worldwide for human consumption goes to waste every year throughout the supply chain for food, amounting to over 1.6 billion tons [1]. Inadequate management of food waste (FW) can lead to the release of greenhouse gases (GHGs) and other detrimental compounds due to unregulated decomposition. According to reports, FW is responsible for 6.7% of the total GHG emissions caused by human activities worldwide [2]. Given the abundance of natural fiber, carbon, protein, fat, and other organic components in food waste, anaerobic digestion, considered an effective treatment, has gained significant attention. The rate-limiting stage in the AD of multifaceted, hard biodegradable, organic substrates has been proven to be hydrolysis [3]. Hence, a multitude of pretreatment methodologies have been devised to dismantle the intricate composition of FW and enhance the microbial interface with the digesting substrate [4].
Pretreatment technologies aimed at enhancing the hydrolysis stage can be broadly categorized into physical and mechanical methods (e.g., mechanical pulverization, thermal, ultrasonic, microwave, etc.), chemical oxidative pretreatment, and biological pretreatment. Mechanical milling has been proven as an effective technique for reducing particle size and disrupting structure, but it has been criticized for its high energy consumption [5]. Recent research has discovered that the use of chemical pretreatment might result in the presence of reagent residues and inhibitory chemicals, which have a detrimental effect on AD [6,7]. Furthermore, the exorbitant expenses and intricate operational procedures associated with biological pretreatment pose significant challenges to its implementation in practical applications [8]. Consequently, in the case of intricate FW matrices, the pursuit of procedures that employ a reduced number of chemical additives, generate less amount of waste, and prioritize operational ease, has resulted in the revival of milling [9,10].
The three main grinding modes include hammer milling, wet disc milling, and ball milling [10,11]. Ball milling is the predominant technique for grinding FW given its elevated moisture content, which promotes particle contact and chemical reactions through impacts with medium balls and FW particles. Regarding the decrease in particle size, the majority of studies have concentrated on decreasing particle diameters from centimeters to millimeters [12,13]. These studies have examined the production of methane and the stability of the process, which have demonstrated a notable increase in methane. For example, Izumi, K et al. [14] managed to decrease the mean particle size (MPS) of FW from 0.843 to 0.391 mm by bead milling, which received a 28% boost in methane production.
The hydrolysis of FW is considerably influenced by particle size, which can affect surface properties, specific surface area, solubilization of macromolecules, etc. [15]. Researchers have conducted detailed investigations into the impact of grinding on organic matter dissolution and found that ball milling can lead to depolymerization of polysaccharide chains, disruption of ordered fibrous matrix, and degradation of lignin–carbohydrate complex bonds. As a result, the solubility of carbohydrates is enhanced without the requirement of enzyme addition [16]. Additionally, researchers have found that the grinding pressure minimally affects the growth of existing microorganisms in the original matrix, and smaller particle sizes in reactors result in an increase in the proportion of hydrolytic bacteria such as Porphyomonadaceae and Bacteoidales_UCG-001 through microbial investigations [17,18,19]. However, previous studies have not investigated the changes in particle size during continuous grinding processes or the performance of anaerobic digestion of FW at micron scales.
The UFWM process is capable of processing feeds with a reasonably large particle size (several millimeters) and reducing it to a smaller size of 10 µm [20]. Nevertheless, there is currently no known work that has successfully achieved a reduction in the D90 particle size of FW to less than 0.1 mm and its AD performance. The change in substrate morphology and surface structure is also worth studying, which can explain the effects of particle morphology due to collision during the milling process. Additionally, the potential correlation between FW particles and microbial pathways has not been clarified.
This study aimed to examine the decrease in FW particle size by UFWM and its effects on the properties of FW particles and methane generation throughout the AD process. Subsequently, three kinetic models were utilized to accurately match the empirically observed methane production and elucidate the reaction kinetics of AD under various milling times. This study sought to clarify the various ways in which UFWM might enhance AD of FW. This was achieved by examining the physical, chemical, and microbiological changes that occur in FW. The results are anticipated to explain the mechanism of particle size reduction to enhance the anaerobic digestion of food waste from multiple physical, chemical, and microbiological perspectives and offer direction for the practical treatment of FW and the recovery of energy.
2. Materials and Methods
2.1. Food Waste and Inoculum
FW used for pretreatment tests and AD tests was obtained from the refectory of Tongji University, Shanghai, China. To make the samples more representative, the mixture was collected after lunch and dinner for 5 consecutive days. Before pretreatment, large bones, eggshells, chopsticks, plastics, and other components that are difficult to biodegrade are manually picked out. Then, the collected FW is shattered by homogenizer for 30 s as the original substrate and stored at −20 °C until required for the experiments.
The inoculated sludge employed for the AD experiment was obtained from a municipal WWTP in Shanghai, China. After being left undisturbed for 12 h, the sludge was filtered using a 1 mm screen to eliminate any sizable particles or debris. Before AD, acclimation of the inoculum was carried out by adding 15 g/L (TS) fresh sludge once, two days over 30 days, incubating at 37 °C. The properties of inoculum and FW used for AD are listed in Table S1.
2.2. UFWM Pretreatment
The FW was milled to reduce the particle size (PS) to a micron level by a stirred ball–attritor (WR, JM-2A, CSWRmill, Changsha, China). Parameters of the machine were based on the preliminary investigation: mixing shaft speed (1500 rpm), material solids content (5%), ball material ratio (2), and ball size grading (1.4–1.6 mm and 2 mm). The following is the process of milling to disintegrate FW: Firstly, the FW slurry was adjusted to 5% TS using ultrapure waster Next, 800 g adjusted FW was ground by the attritor in the presence of 400 g of zirconium oxide spheres with particle size gradation. Six types of AD substrates were pretreated by varying the operation time based on hours at 1500 rpm. The slurries were collected through a 2 mm screen and stored at 4 °C (control, M-0.5h, M-1h, M-2h, M-3h, M-4h).
2.3. Anaerobic Digestion Experiment Design
A batch AD experiment was carried out in replicate gas-tight glass flasks with a working volume of 250 mL. Prior to filling flasks with substrates, each flask underwent meticulous inspection to guarantee its airtightness. The ground FW and inoculum were mixed in a 2:1 ratio (based on VS) and the remainder was supplemented with distilled water, with two additional parallels per particle size and a blank sample. Before AD, the pH of the mixed substrates was regulated to a value of 7.0 ± 0.1. Each bottle was infused with nitrogen gas for a duration of 3 min in order to establish an atmosphere devoid of oxygen and then incubated at 37 ± 1 °C and 150 rpm in a constant temperature shaker. The experiment lasted 20 days until the methane cumulation curve flattened. Methane production and proportion were measured daily. pH, VFA composition, and NH4+-N were analyzed every two days. Microbial activity was measured on the digestate after AD.
2.4. Analytical Methods
The particle size and specific surface area of the milling FW particles were determined using a laser particle sizer (Mastersizer 3000, 0.01–3000 µm, Malvern Panalytical, Stamford, Connecticut, USA). Measurement of soluble substances in micron-sized particles includes Soluble Carbon Organic Dioxide Demand (SCOD), soluble proteins (SPN), and soluble sugars (SPS). The contents of SPN and SPS were determined by the Lowry method and the anthrone sulfuric method. Processing data (TS, VS, NH4+-N) were determined by APHA 1995. The biogas concentration and composition were measured using gas chromatography (Agilent 7890B, Agilent Technologies, Santa Clara, CA, USA). The VFA composition was analyzed by gas chromatography equipped with FID (Agilent 7820, Agilent Technologies, Santa Clara, CA, USA). A sample injection volume of 1 μL was used, and nitrogen served as the carrier gas with a flow rate of 50 mL/min. The detector and injection port temperatures were maintained at 200 and 220 °C, respectively.
2.5. DNA Extraction and Metagenomic Sequencing
Specific DNA extraction methods have been described in the Supplementary Data. Sequence data associated with this project have been deposited in the NCBI Short Read Archive database (Accession Number: PRJNA1037748).
2.6. Kinetic Modeling
The efficiency of the biochemical and mass transfer processes in each AD stage affects the biogas production and composition. Kinetic modeling is a powerful tool for estimating fundamental biochemical parameters. Appropriate kinetic models can provide effective solutions for improving the selection and concentration of anaerobic digestion substrates and optimizing the performance of AD. The modified Gompertz model (Equation (1)), first-order kinetic model (Equation (2)), and logistic model (Equation (3)) were utilized to describe the relationship between microbial growth and methane production.
where P(t) is the accumulated methane production (mL CH4 g−1VS). t is anaerobic digestion time (d). Pmax is the maximum production (mL CH4 g−1VS), Rm denotes the maximum CH4 production rate (mL CH4 g−1VS d−1), λ is the lag time (d), and k is the kinetic constant in (d−1). The mean value of the experimental methane production data was used as the simulation data point.
2.7. Statistical Analysis
All the tests were conducted in triplicate. The significance of data was evaluated using the IBM SPASS Statistics 26, and p < 0.05 was significant in statistics. OriginPro 2021 was used to draw graphics and kinetic modeling.
3. Results
3.1. Methane Production Improvement Triggered by UFWM Pretreatment
3.1.1. Methane Production
In general, increasing the duration of milling led to a higher total methane generation. Figure 1a illustrates the cumulative methane production under different milling times during a 20-day batch digestion experiment under mesophilic conditions. A higher cumulative methane production (CMP) was obtained from UFWM pretreated FW groups than that of the control group. The optimal condition was milling for 4 h (M-4h), as the highest CMP was attained. Under this milling time, the CMP (406.75 mL/g VSS) increased by 32.07% compared with the control group (307.98 mL/g VS). In addition, CMP increased by 10.25% (M-0.5h), 13.42% (M-1h), 20.47% (M-2h), and 26.40% (M-3h) than the control group, respectively. Comparison of data from other studies yielded similar growth trends [21,22]. Higher cumulative methane production was obtained in the present study, which may be due to differences in substrate composition. Lower C/N can lead to high ammonia nitrogen inhibiting AD. The first 10 days saw the most methane gas production, whereas the latter 10 days rose slowly. This result demonstrated the optimistic effect of UFWM pretreatment on substrate degradation and methane recovery from AD of FW.
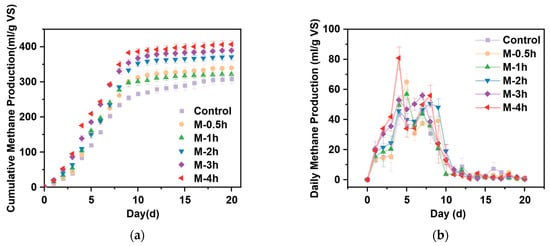
Figure 1.
Methane production from pretreated FW (a) and daily methane production from pretreated FW (b).
Figure 1b presents the daily gas production (DMP) of each group. In this digestion process, each group had two peaks of DMP. Nearly every group observed their first peak appeared on day 3, while the second was often noticed between day 8 to day 10. The results were similar between the control and the other milling groups, except M-4h during the first peaks, which achieved a value of 80.82 mL/g VS. The milling groups achieved the second peak gas production sooner than the control group, and the peak of DMP was greater than that of the control. These findings suggested that finer particles of FW have a beneficial impact on the methane generation rate [23].
3.1.2. Kinetic Analysis
Figure 2 displays the fitting curves for the cumulative methane production of the three kinetic models. The relevant kinetic parameters can be found in Table 1. In general, both MGM and MLM were well-suited for the AD process. The R-squared values for all groups exceeded 0.99 (0.994–0.999), and the root mean square error (RMSE) was below 15. Nevertheless, FOM considers the entire gas generation as a single reaction, which is inadequately suited for all groups save the control group. The RMSE values for all groups were significantly high (>25). Furthermore, the 95% confidence intervals also show an upward trend as the AD proceeds. Based on the observation that the simulation curves closely matched the experimental data, it can be concluded that both MGM and MLM were capable of reliably forecasting production at each stage. Nevertheless, the MLM model exhibited an initial methane output that was higher than 0, while maintaining the accuracy of the fit. This suggested that the MLM model forecasted a longer digestion time than MGM with accuracy. MGM outperformed MLM in accurately forecasting CMP during the initial 5 days. MGM reaches its maximum gas output plateau earlier than the MLM model, following the exponential development phase. Regarding maximal methane production and model accuracy, MGM achieves superior R2 and lower RMSE values, with the exception of the M-2h and M-3h groups. Table S2 displayed the anticipated values and experimental values of the three models, along with the absolute values of the error percentages for each group. MLM consistently underestimates the predicted Pm values, while MGM shows smaller errors compared to the experimental values. This was consistent with previous research findings [24,25]. Thus, MGM was more suitable for the AD process of FW with a short milling time (0–1 h), while MLM demonstrated more accurate fitting for a long time (2–4 h).
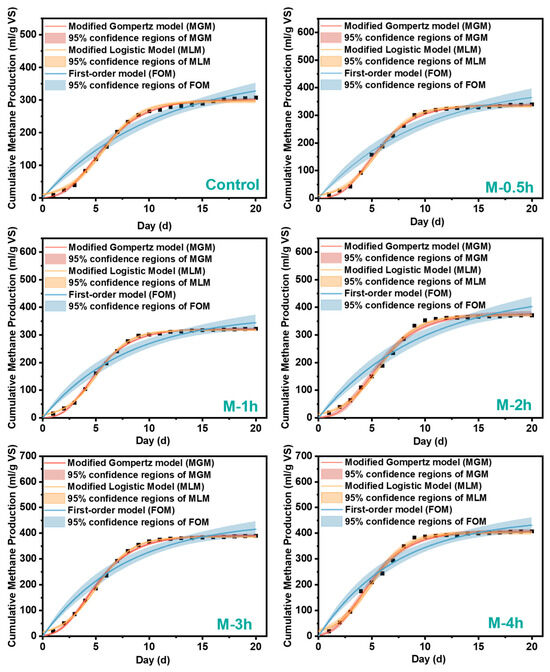
Figure 2.
Curve fitting of cumulative methane production and 95% confidence regions of each model with modified Gompertz model (MGM), First-order model (FOM), and Modified Logistic Model (MLM).

Table 1.
Kinetic parameters of modified Gompertz model, Modified Logistic Model, and First-order model.
In general, micron FW particles overcame the obstacle of low hydrolysis rate in AD, hence improving the decrease in sludge retention time and increasing methane production [12]. UFWM pretreatment apparently increased Pm more than that of the control group. For example, the M-4h group increased by 34.64% and 44.41% compared to the control, respectively [26]. Conversely, λ decreased by a maximum of 0.65 days (M-4h) after UFWM than that of the control group. This demonstrated that ultrafine particle size led to faster hydrolysis and shortened the time of domestication. UFWM pretreatment enhanced the solubility of the substrate, which allowed earlier entry into the exponential growth period in anaerobic bacteria without being limited by substrate concentration [27]. Unlike the Grind Two Hour and Shorter group, M-3h is a one-time 0.415 day shorter, which echoes the high daily methane production of the first four days of M-3h versus M-4h. Remarkably, the enhancement of Pmax was greater than the decrease in λ caused by pretreatment, as compared to the control. Additionally, UFWM pretreatment enhanced the maximum rate of methane conversion (Rm). Micron size (M-4h) was enhanced by 44.40% compared to the control group. Groups M-3h and M-4h enhanced more compared to other groups like λ. It implied that micron-sized particle size of kitchen waste enhances the efficiency of conversion of organic components to methane.
The Rm and λ values in the M-1h group exhibited distinct patterns compared to the other groups. The Rm value was lower in the M-0.5h group compared to the M-2h group, whereas the λ value increased. The pattern seen in this case is similar to the trend seen in the DP and CMP data presented in Figure 1. Specifically, the peak value of DP on day 4 was higher in group M-0.5h compared to group M-1h. Nevertheless, its DP remained lower than group M-1h until it reached the top. This could be attributed to variations in the rate of methane generation resulting from disparities in acid production during hydrolysis. When the concentrations of propionic and butyric acids are significantly lower than those of acetic acid, volatile acids accumulate, leading to a decrease in the rate of methane generation. These volatile acids are only slowly broken down during the final stages of digestion, corresponding to an upward movement at the end of the curve rather than a horizontal trend [28,29].
3.1.3. Effects of UFWM Pretreatment on AD Performance
Ensuring a steady state of AD is essential for achieving optimal methane production [1]. Figure 3 shows two statistical process parameters for each group in AD. The pH value had a significant effect on AD of FW. Microorganisms tend to grow in the range of 6.8–7.2 rather than under excessively acidic or alkaline conditions [30]. Fixing the initial pH value gave a clearer picture of the effect of the change in particle size on the change in pH of the digestion process. From Figure 3a, it can be seen that the pH value of all groups decreased rapidly to below 6.2 due to the acidification of a large amount of substrate to generate VFAs during the first and second days of AD. With the continuous production of methane, the VFAs were continuously consumed, leading to a slow increase in pH to equilibrium in 3–8 d (7.3–7.4) and continuing until the end of AD.
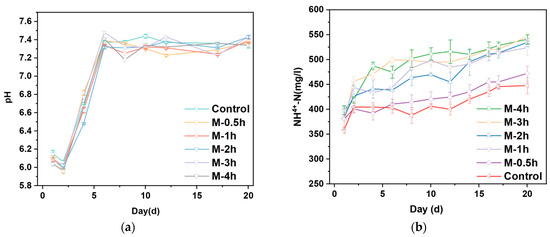
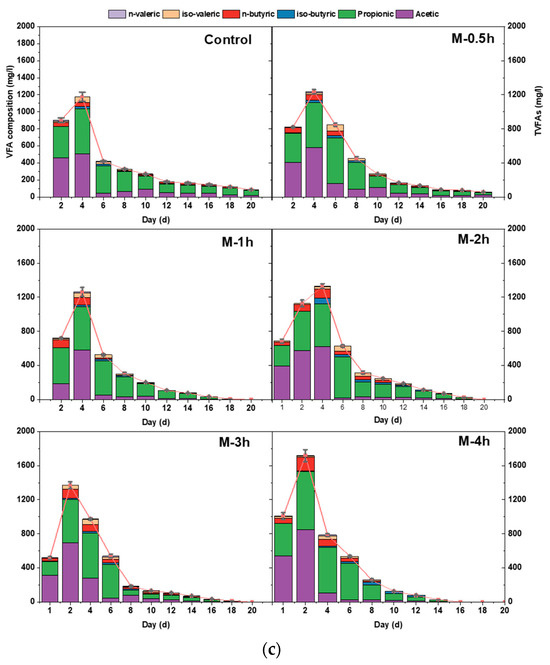
Figure 3.
Variation of pH (a), NH4+-N (b), and VFAs (c) in AD system.
Although ammonia is essential for bacteria, it can act as an inhibitor when concentrations are at high levels (1.7–14 g/L), which might hinder the activities of related enzymes and microbial metabolism [31]. Figure 3b demonstrates the variation of NH4+-N concentration during the AD process. The NH4+-N concentration in all reactors ranged from 358.04 to 545.49 mg/L, which increased dramatically with the milling time increasing. Milling groups increased rapidly to higher levels compared to the control group in the first four days due to the accelerated rate of hydrolysis. The NH4+-N concentration in the M-4h group on day 5 was 1.3 times higher than that in the control group. The results above demonstrated that NH4+-N had little inhibitory effect on the AD systems in this research.
Changes in the concentration and composition of VFAs respond to the metabolic levels of methanogenic archaea and acidogenic bacteria and the equilibrium of the reaction system. Under all conditions, TVFA increased rapidly and reached peaks in the range of 1064.46–1717.96 mg/L, while group M-4h obtained the highest value. Interestingly, the M-3h and M-4h groups reached their maximum values on day 2, while the rest of the groups reached them on day 4. The UFWM treatment resulted in the destruction of the cell membrane of the substrate, which subsequently allowed extracellular hydrolytic enzymes to assault it. The macromolecular substances in FW were rapidly degraded and converted into VFAs. This indicated that the reduction in particle size accelerated the rate of hydrolysis of FW, which is similar to previous studies [32,33].
Additionally, the unique VFA component concentration was affected by UFWM. Following the milling of FW, the predominant acids generated consist primarily of acetic acid and propionic acid, with a diminished presence of butyric acid. Valeric acid was notably scarce. As depicted in Figure 3c, with the progression of milling time, the peak concentration of acetic acid steadily ascended from 511.20 mg/L to 848.41 mg/L. Simultaneously, the peak value of propionic acid coincided with acetic acid, except for the M-4h group, where it displayed minor fluctuations, ranging between 502.18 and 530.09 mg/L. It is notable that acetic acid exhibited a higher propensity for conversion into methane [28]. Milling enabled the transformation of insoluble organic constituents into soluble and diminutive carbon molecules. Acetic acid continuously prevailed throughout the early phase of AD. When acetic acid attained its maximum in each group, it comprised 43.34%, 47.10%, 46.21%, 46.81%, 50.78%, and 49.39% of the aggregate VFA content, respectively.
Moreover, butyric acid also underwent a substantial augmentation following ultrafine milling pretreatment. In the control group, as well as the M-2h and M-4h groups, the concentrations of iso-butyric acid were 47.18 mg/L, 104.41 mg/L, and 157.93 mg/L, respectively. Butyric acid serves as a favorable precursor of acid [34]. It suggested that milling similarly promoted the synthesis of butyric acid. Interestingly, various VFA components had different degradation trends. The concentrations of acetic acid and butyric acid exhibited a quick initial increase, followed by a subsequent rapid decline after reaching their peak values. Conversely, propionic acid exhibited a gradual decrease after reaching its peak, suggesting that the majority of small molecules had been converted and gas was generated during the initial phase. The methane production in the later stage mainly depended on the consumption of the accumulated hard-to-convert propionic acid, which also corresponded to the trend of methane production every day.
3.2. Substrate Quality Affected by UFWM Pretreatment
3.2.1. Physical Properties of Pretreated Food Waste
Figure 4 exhibited the SEM images (a,b), FTIR (c), and XPS (d–f) spectra of the original and UFWM pretreatment FW. In Figure 4a,b, the unpretreated particles all had smooth and dense surfaces. After UFWM pretreatment, the large particles were crushed into small particles due to impact, shear, and other interactions, which showed a scale-like surface. Simultaneously, the large number of voids and pores left by the milling provided an easily accessible area for hydrolyzing enzymes.
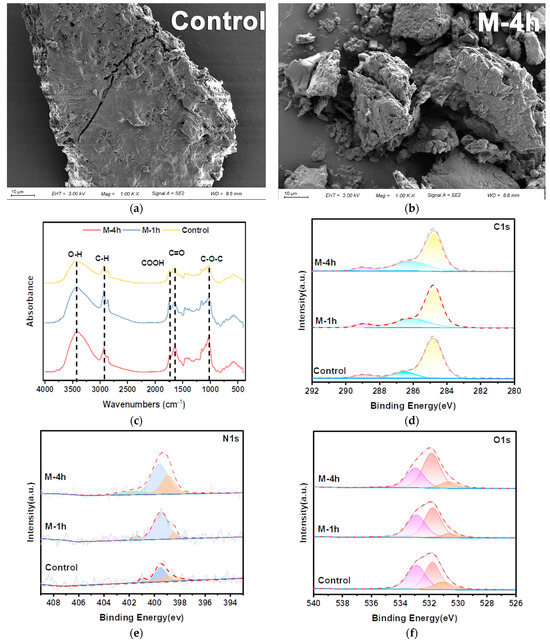
Figure 4.
Scanning electron microscopy images of control group (a) and M-4h (b) group; FTIR spectrum of FW (c); X-ray photoelectron spectra of FW: (d) C1s; (e) N1s; (f) O1s.
Fourier Transform Infrared Spectroscopy (FTIR) is frequently employed for the characterization of the surface functional groups of FW. Figure 4c illustrates the infrared spectra under varying milling times. In general, all peaks exhibited a similar pattern of steady rise with increased milling times. The adsorption peak near 3400 cm−1 was identified as a hydroxyl functional group (O−H stretching vibration) that evolved from cellulose [35]. Several investigations have verified that milling pretreatment effectively decreases the crystallinity of cellulose, which is beneficial for the hydrolysis and digesting processes [36]. The C−H stretching structure was observed at 2800–3000 cm–1. This peak represented aliphatic chain structures, predominantly originating from fatty acids. The −C=O bending vibration (1600–1760 cm–1) and C−O−C bending vibration (around 1050 cm–1), which were assigned to carboxylic components and aromatic structure, respectively, are also common functional groups in FW [37]. The FTIR analysis revealed that milling had a negligible impact on the initial functional group of the FW. Nevertheless, the alteration in the highest level of intensity suggested that the process of milling boosts the movement of mass between solid and liquid phases, leading to an enhancement in the solubility of FW. This observation aligns with the variation in the ratio of the three phases, as seen in Figure S1.
Furthermore, this study employed X-ray Photoelectron Spectroscopy (XPS) to assess the surface composition of pretreated FW particles. Figure 4d illustrates the C1s spectrum of the FW. The C1s spectrum was deconvoluted, which resulted in three distinct peaks. The first peak with the binding energy of 284.7 eV corresponds to the C−C or C=C bond, while the peaks at 286.4 and 288.9 eV were correlated with C−N and C=O, respectively [38,39,40]. It is well documented that the peaks at 530.8 eV, 531.8 eV, and 532.9 eV in the O1s high-resolution spectrum are assigned to O−H, C=O, and O=C−O bonds [40,41,42]. The peaks of raw FW maintain their locations after UFWM pretreatment (Figure 4e). However, following 4 h of milling pretreatment, the ratio of C=O to C−N bond areas rose from 5.59% and 15.98% to 5.87% and 32.71%, respectively (Table 2). This indicated that the surface functional group species of FW were not affected by UFWM treatment, which aligned with the FTIR data. Nevertheless, the milling pretreatment enhanced the release of lipids and carbs from FW and promoted the improvement of the respective groups. The N1S spectra mainly contained three peaks (Figure 4f), and the peaks of 399.9 eV and 401.1 eV were mainly related to amino acids [43]. The correlation between the N1S and the C=O peak area increase also proved the solubilization and hydrolysis of proteins by UFWM. The observed rise in C−N and C=N peak areas indicated that milling predominantly enhances the breakdown and dissolution of carbohydrates and cellulose. Previous studies indicated that milling pretreatment can expose more active sites on biomass particles and improve enzymatic efficiency [44].
Table 2.
Quantization of XPS Spectral Bonds of FW before and after UFWM pretreatment.
Hence, it could also be inferred that the enzymatic treatment was beneficial for the solubilization and hydrolysis of FW via depolymerization, which could effectively convert large particles to small molecules, promote the solubilization of substrates and lipids, and induce the disintegration of proteins, resulting in the enhancement of the ultimate VFA generation.
3.2.2. Particle Size, Specific Area, and Chemical Properties of Pretreated FW
Obviously, the UFWM pretreatment led to smaller particle size and better dispersion of the FW slurry. Figure 5a illustrates the particle size distribution of the pretreated FW when subjected to the most favorable milling parameters. The particle size distribution of FW exhibited two distinct peaks. One peak was seen in the range of less than 25 μm, which likely corresponds to particles such as carbohydrates with relatively tiny sizes. The second peak was seen inside the >300 μm range, which might be similar to bigger cellulose particles, inert matter particles, and so on [45]. Additionally, as the milling time increased, the proportion of particles with a size distribution smaller than 25 μm also increased. This proportion reached its maximum in the M-3h and M-4h groups. This result indicated that milling effectively decreased the proportion of larger particles and resulted in a more dispersed particle size distribution.
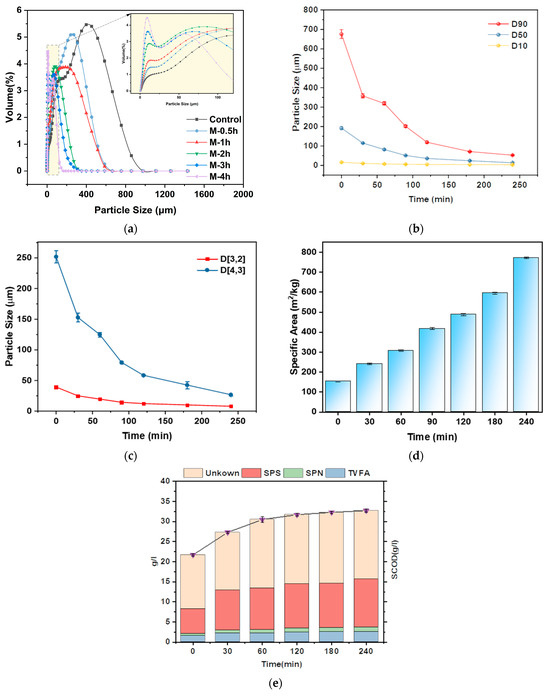
Figure 5.
Properties comparison between control and UFWM pretreated FW: particle size distribution (a); variation of d90, d50, d10 (b); d(3,2) and d(4,3) (c); specific area (d); SCOD, SPS, SPN, TVFA concentrations (e).
Specifically, the reduction in particle size of different grades of FW by UFWM can be seen in Figure 5b. d90 of FW particles was reduced from 675.7 μm (control) to 52.7 μm (M-4h), which was a 12.82-fold reduction, whereas the d50 and d10 were reduced by a factor of 5.3 μm and 4.73 μm, respectively. d90 was very close to d10 after 4 h of milling. Due to the limitations of small ball size and ball milling speed [46], UFWM for FW mainly crushed large particles and the crushing effect on small particles less than 25 μm is not significant.
d(3,2) and d(4,3) can characterize the sphericity of the particles after milling. Figure 5c shows the change of the two parameters during UFWM pretreatment. d(3,2) and d(4,3) were constantly close to each other. It can be inferred that ultrafine milling made the FW particles close to round and particle size distribution more uniform. These alterations can increase substrate contact with enzymes and microorganisms [47]. In addition, surface area plays a crucial role in determining the effectiveness of enzymatic hydrolysis of biomass [48]. As shown in Figure 5d, the specific surface area exhibited an increase as the milling duration increased, resulting in a decrease in particle size. The specific surface area of the M-4h group was 5.03 times higher than that of the control group, which had the highest growth rate of 29.59% in the 3–4 h period. Apparently, the alterations in particle size and specific surface area promoted the breakdown of the substrate, hence facilitating the subsequent AD process [49].
The hydrolysis of FW is the rate-determining step since organic matter in FW mainly exists in the solid phase [50]. Big organic particles of FW were required to be broken and liberated into the liquor phase, which was transformed into small biodegradable particles. Hence, concentrations of soluble components were used to evaluate the solubilization of pretreated FW. Figure 5e displays the variations of TVFA, SPN, SPS, and SCOD. As we expected, increased milling time resulted in increased release of SCOD. The SCOD evaluated from 21.7 g/L (control) to 32.7 g/L (M-4h), which was 1.51 times that without UFWM pretreatment. A similar trend was also observed in the cases of SPN, SPS, and TVFA. The increases in SPN, SPS, and TVFA were 99.61%, 95.03%, and 66.87%, respectively, compared to the control group, which was obtained from the M-4h group. Prior research consistently found a strong correlation between the content of soluble organic components and increased methane generation [51].
The biochemical mechanism of UFWM pretreatment could be obtained based on the results above. Large particles of FW in the ultrafine milling process through a long period and the complex interaction between the mixing shaft and the milling ball into a more uniform micron-sized particle. Throughout this process, organic molecules from intracellular and extracellular were either released into the liquid phase or remained on the surface, primarily in a soluble form. Additionally, the high temperatures generated in the chamber by high-speed milling also promote free radical oxidation reactions that enhance the dissolution of substances. The significant decrease in particle size results in a corresponding rise in the specific surface area. The combination of the larger surface area and the release of organic matter resulted in a decrease in the barrier to the transfer of mass between the microbes and the substrate. This led to an increase in the activity of the corresponding enzymes, resulting in a significant supply of small molecule substrates for the subsequent methanation process.
3.3. Impact of UFWM Pretreatment on the Microbial Activities in AD Process
3.3.1. Microbial Community
After completing the process of digestion, samples were obtained from the M-4h group, which had superior gas generation, as well as from the control group reactors. These samples were then subjected to metagenomics analysis. Figure 6a demonstrates that Bacteroidota and Proteobacteria were the predominant phyla in all reactors. The prevalence of these phyla has been often noted in earlier investigations [52]. Bacteroidetes had a significant function in breaking down large organic molecules and complicated polymers. They were able to release enzymes that break down these compounds and produce acetic acid, which can be utilized by methanogens [53]. Proteobacteria was the primary bacteria responsible for cellulose hydrolysis and acidification. It had the ability to convert polysaccharides and monosaccharides into VFAs through fermentation [54]. After the UFWM pretreatment, the relative abundance of Bacteroidota and Proteobacteria increased from 19.58% to 24.81%, and 19.08% to 20.93%, respectively. This change indicated that micron-level particle size altered the microbial community structure of digestion. By milling, hydrolyzing bacteria were enriched to accelerate the hydrolysis process.
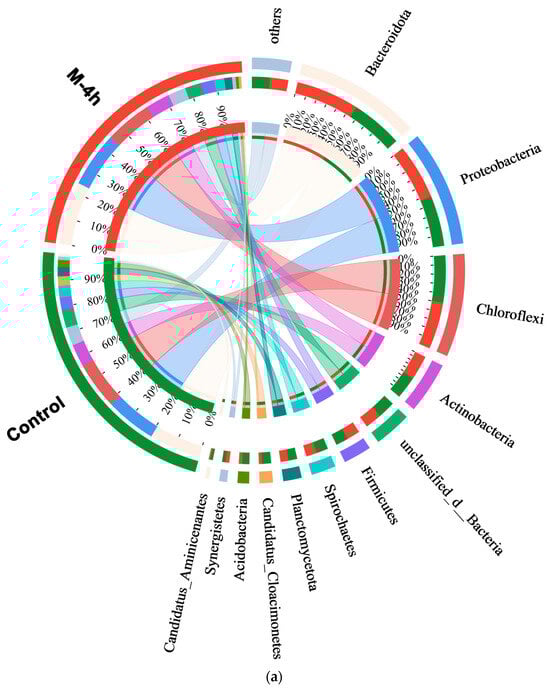
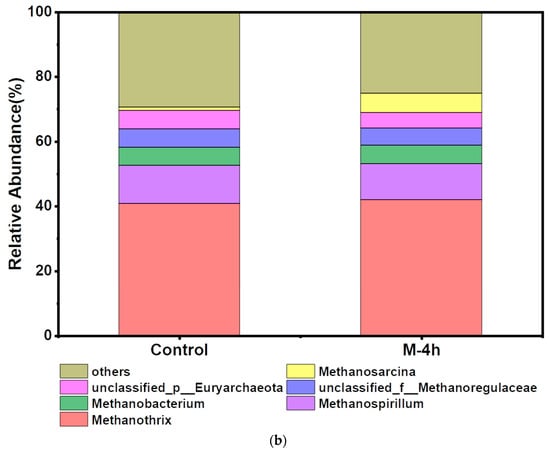
Figure 6.
Variation of bacterial communities at phylum level (a); and archaea community at genus level (b) of control and M-4h group.
The structure of archaeal communities was similar in the two groups after UFWM treatment. According to Figure 6b, Methanothrix and Methanospirillum were the most prevalent genera seen among all the archaea that were examined. Following pretreatment, the relative abundance of Methanothrix increased from 40.74% (control) to 41.98% (M-4h), while the abundance of Methanosarcina increased from 1.54% (control) to 5.86% (M-4h), approximately 3.81 times that of the control. Methanothrix was described as an archaea that used CO2 to facilitate direct interspecies electron transfer (DIET) to manufacture methane in addition to producing CH4 from acetate [53] Methanosarcina could ferment diverse substrates into CH4 through both acetoclastic and hydrogenotrophic pathways. Conversely, as the AD process advanced, the reaction of microorganisms to the presence of ammonia might lead to instability. Increased relative abundance of Methanosarcina led to the restoration of acetate metabolism and AD performance which have a high tolerance to ammonia [55]. Thus, it could be inferred that UFWM pretreatment facilitated both acetoclastic methanogen (AM) and hydrogenotrophic methanogenesis (HM). A higher relative abundance of Methanosarcina in the UFWM group was less susceptible to ammonia stress than those in the control, resulting in a more stable gas production process. This was consistent with VFAs and NH4+ analyses conducted before. In summary, ultrafine particles accelerated the hydrolysis process by enriching hydrolysis bacteria such as Bacteroidota. In the methanogenic stage, the simultaneously enriched Methanothrix and Methanosarcina jointly facilitated the consumption of different intermediates and DIET during the methanogenesis process. This synergy likely contributed to the observed increase in methane production.
3.3.2. Analysis of Pathways
The impact of UFWM on methanogenic pathways was investigated by conducting a detailed analysis of methane metabolism (ko00680). Among the modules related to methanogenesis, M00356, M00357, M00563, and M00567 were the major metabolic pathways (Figure 7a). Figure 7b shows the absolute abundance of the four metabolic pathways in the M-4h group versus the control group. The absolute abundance of all four modules increased after UFWM pretreatment. Among them, acetoclastic methanogenic (M00357) and hydrogenotrophic methanogenic (M00567) were dominant. The absolute abundance of M00567 was increased by 19.47%, and M00357 was increased by 21.29% in the M-4h group. This suggested that the reduction of particle size promoted both acetate and CO2 methanogenesis, consistent with the findings of previously reported investigations of the microbial community.
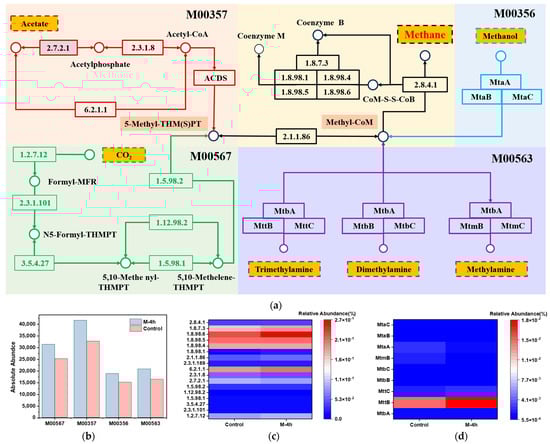
Figure 7.
Four main methanogenic pathways of map: 00680 based on KEGG (a); absolute abundance of four modules in map00680 (b); relative abundance of key enzymes; (c) and functional genes (d) in four modules.
In acetoclastic methanogenic pathway (M00357), relative abundance of acetate kinase [EC:2.7.2.1] (M-4h = 0.09%, control = 0.08%) and acetyl-CoA synthetase [EC:6.2.1.1] (M-4h = 0.18%, control = 0.20%) increased in M-4h group, while phosphate acetyltransferase [EC:2.3.1.8] (M-4h = 0.47%, control = 0.55%) decreased. This indicated that UFWM pretreatment enhanced the conversion of acetate to acetate-CoA by stimulating the activity of acetyl-CoA synthetase. This observation elucidated the increased use of VFAs during the methanogenic phase, which correlated with the elevated prevalence of Methanothrix. Among the three forms of methane metabolism, the hydrogenotrophic methanogenic route has the best energy generation efficiency, which can transform CO2 and H2 into methane. The absolute abundance of 5,10-methylenetetra-hydromethanopterin reductase [EC:1.5.98.2] and formylmethanofuran dehydrogenase [EC:1.2.7.12] were elevated by 18.47% and 20.35% compared to the control group, respectively. Additionally, Zhang, J et al. [56] paid attention to the F420 hydrogenase [EC: 1.12.98.1], which converts F420 to CoenzymeF420H2. The relative abundance of it in the M-4h group (0.046%) was higher than that group of control (0.041%). These results indicated that UFWM was conducive to strengthening CO2 methanogenesis.
Methanol, trimethylamine, dimethylamine, and methylamine underwent reduction to create Methyl-CoM, which subsequently converted into methane in reactions M00356 and M00563 Figure 7a. The functional gene MttB was 1.67-fold higher in the transformation pathway with trimethylamine as substrate than in the control group. Furthermore, the nodes of four modules were identified as heterodisulfide reductase subunit A2 [EC:1.8.7.3 1.8.98.4 1.8.98.5 1.8.98.6], and their primary role is to catalyze the conversion of the product into methane. They were increased under UFWM pretreatment according to Figure 7c, indicating that particles at the micron scale have the ability to stimulate many enzymes that play a role in methane generation.
4. Conclusions
This study demonstrated the effectiveness of UFWM pretreatment in boosting methane production from FW. The results showed that methane production increased by 32.07% after milling for four hours. Kinetic analysis showed that MGM was the best model to anticipate the cumulative methane production. The UFWM pretreatment changed the particle size distribution and reduced D90 to 73 μm. Micron particle size increased the inter-particle voids and surface area, as well as the solubilization of carbohydrates and lipids, which is consistent with changes in soluble organic matter. Reduction of particle size enhances AD hydrolysis efficiency and avoids ammonia inhibition, which is due to an increase in the abundance of the hydrolyzing bacterium Bacteroidota and the acid-resistant archaeon Methanosarcina. Metabolic pathway analysis revealed that both the acetoclastic and hydrogenotrophic methanogenic pathways. These results demonstrated the favorable performance of UFWM pretreatment technology whose process and equipment were not complex. Semi-continuous experiments and the effects of different substrates deserve future exploration. This study could be valuable in practice for AD of FW.
Supplementary Materials
The following supporting information can be downloaded at https://www.mdpi.com/article/10.3390/su16072933/s1, Figure S1: distributions of different phases before and after UFWM pretreatment; Table S1: the main properties of food waste and inoculum sludge; Table S2: fitting parameters by the modified Gompertz model. Reference [57] is cited in the supplementary materials.
Author Contributions
Conceptualization, Z.L.; methodology, Z.L. and W.S.; formal analysis, X.J.; investigation, W.S.; resources data curation, X.J. and D.Y.; writing—original draft preparation, Z.L.; writing—review and editing, Y.Z. and T.Z.; visualization, W.S. and D.Y.; supervision, T.Z.; funding acquisition, Y.Z. and T.Z. All authors have read and agreed to the published version of the manuscript.
Funding
This research was funded by Tongji University, grant number 2022-4-YB-12, the Social Development Program of Science and Technology Committee Foundation of Shanghai, grant number No. 21DZ1209501, Shanghai Chengtou Research Project, grant number No. CTKY-CYHYD-2022-004, and National Natural Science Foundation of China, grant number No. 52000143.
Institutional Review Board Statement
Not applicable.
Informed Consent Statement
Not applicable.
Data Availability Statement
The data are available upon reasonable request.
Conflicts of Interest
The authors declare no conflicts of interest.
References
- Braguglia, C.M.; Gallipoli, A.; Gianico, A.; Pagliaccia, P. Anaerobic Bioconversion of Food Waste into Energy: A Critical Review. Bioresour. Technol. 2018, 248, 37–56. [Google Scholar] [CrossRef] [PubMed]
- Liu, M.; Ogunmoroti, A.; Liu, W.; Li, M.; Bi, M.; Liu, W.; Cui, Z. Assessment and Projection of Environmental Impacts of Food Waste Treatment in China from Life Cycle Perspectives. Sci. Total Environ. 2022, 807, 150751. [Google Scholar] [CrossRef] [PubMed]
- Hidalgo, D.; Castro, J.; Díez, D.; Martín-Marroquín, J.M.; Gómez, M.; Pérez, E. Torrefaction at Low Temperature as a Promising Pretreatment of Lignocellulosic Biomass in Anaerobic Digestion. Energy 2023, 263, 125822. [Google Scholar] [CrossRef]
- Li, H.; Pang, Y.; Sun, Y.; Xing, T.; Yang, G.; Kong, X.; Li, L.; Zhen, F. Cold Isotherm Pressing Pretreatment for Effective Improvement of Methane Production from Hybrid Pennisetum. Fuel 2023, 353, 129274. [Google Scholar] [CrossRef]
- Ali, N.; Zhang, Q.; Liu, Z.-Y.; Li, F.-L.; Lu, M.; Fang, X.-C. Emerging Technologies for the Pretreatment of Lignocellulosic Materials for Bio-Based Products. Appl. Microbiol. Biotechnol. 2020, 104, 455–473. [Google Scholar] [CrossRef] [PubMed]
- Ab Rasid, N.S.; Shamjuddin, A.; Abdul Rahman, A.Z.; Amin, N.A.S. Recent Advances in Green Pre-Treatment Methods of Lignocellulosic Biomass for Enhanced Biofuel Production. J. Clean. Prod. 2021, 321, 129038. [Google Scholar] [CrossRef]
- Neri, A.; Bernardi, B.; Zimbalatti, G.; Benalia, S. An Overview of Anaerobic Digestion of Agricultural By-Products and Food Waste for Biomethane Production. Energies 2023, 16, 6851. [Google Scholar] [CrossRef]
- Taheri, M.E.; Salimi, E.; Saragas, K.; Novakovic, J.; Barampouti, E.M.; Mai, S.; Malamis, D.; Moustakas, K.; Loizidou, M. Effect of Pretreatment Techniques on Enzymatic Hydrolysis of Food Waste. Biomass Conv. Bioref. 2021, 11, 219–226. [Google Scholar] [CrossRef]
- Abraham, A.; Mathew, A.K.; Park, H.; Choi, O.; Sindhu, R.; Parameswaran, B.; Pandey, A.; Park, J.H.; Sang, B.-I. Pretreatment Strategies for Enhanced Biogas Production from Lignocellulosic Biomass. Bioresour. Technol. 2020, 301, 122725. [Google Scholar] [CrossRef] [PubMed]
- Gallego-García, M.; Moreno, A.D.; Manzanares, P.; Negro, M.J.; Duque, A. Recent Advances on Physical Technologies for the Pretreatment of Food Waste and Lignocellulosic Residues. Bioresour. Technol. 2023, 369, 128397. [Google Scholar] [CrossRef] [PubMed]
- Saravanan, A.; Yaashikaa, P.R.; Kumar, P.S.; Thamarai, P.; Deivayanai, V.C.; Rangasamy, G. A Comprehensive Review on Techno-Economic Analysis of Biomass Valorization and Conversional Technologies of Lignocellulosic Residues. Ind. Crops Prod. 2023, 200, 116822. [Google Scholar] [CrossRef]
- Okoro-Shekwaga, C.K.; Turnell Suruagy, M.V.; Ross, A.; Camargo-Valero, M.A. Particle Size, Inoculum-to-Substrate Ratio and Nutrient Media Effects on Biomethane Yield from Food Waste. Renew. Energy 2020, 151, 311–321. [Google Scholar] [CrossRef]
- Agyeman, F.O.; Tao, W. Anaerobic Co-Digestion of Food Waste and Dairy Manure: Effects of Food Waste Particle Size and Organic Loading Rate. J. Environ. Manag. 2014, 133, 268–274. [Google Scholar] [CrossRef]
- Izumi, K.; Okishio, Y.; Nagao, N.; Niwa, C.; Yamamoto, S.; Toda, T. Effects of Particle Size on Anaerobic Digestion of Food Waste. Int. Biodeterior. Biodegrad. 2010, 64, 601–608. [Google Scholar] [CrossRef]
- Fisgativa, H.; Tremier, A.; Dabert, P. Characterizing the Variability of Food Waste Quality: A Need for Efficient Valorisation through Anaerobic Digestion. Waste Manag. 2016, 50, 264–274. [Google Scholar] [CrossRef]
- Balch, M.L.; Chamberlain, M.B.; Worthen, R.S.; Holwerda, E.K.; Lynd, L.R. Fermentation with Continuous Ball Milling: Effectiveness at Enhancing Solubilization for Several Cellulosic Feedstocks and Comparative Tolerance of Several Microorganisms. Biomass Bioenergy 2020, 134, 105468. [Google Scholar] [CrossRef]
- Dai, X.; Hua, Y.; Dai, L.; Cai, C. Particle Size Reduction of Rice Straw Enhances Methane Production under Anaerobic Digestion. Bioresour. Technol. 2019, 293, 122043. [Google Scholar] [CrossRef] [PubMed]
- Shrestha, S.; Pandey, R.; Aryal, N.; Lohani, S.P. Recent Advances in Co-Digestion Conjugates for Anaerobic Digestion of Food Waste. J. Environ. Manag. 2023, 345, 118785. [Google Scholar] [CrossRef] [PubMed]
- Liu, H.; Chen, X.; Ji, G.; Yu, H.; Gao, C.; Han, L.; Xiao, W. Mechanochemical Deconstruction of Lignocellulosic Cell Wall Polymers with Ball-Milling. Bioresour. Technol. 2019, 286, 121364. [Google Scholar] [CrossRef]
- Uçurum, M.; Güleç, Ö.; Cıngıtaş, M. Wet Grindability of Calcite to Ultra-Fine Sizes in Conventional Ball Mill. Part. Sci. Technol. 2015, 33, 342–348. [Google Scholar] [CrossRef]
- Luo, L.; Qu, Y.; Gong, W.; Qin, L.; Li, W.; Sun, Y. Effect of Particle Size on the Aerobic and Anaerobic Digestion Characteristics of Whole Rice Straw: Energies (19961073). Energies 2021, 14, 3960. [Google Scholar] [CrossRef]
- Ajayi-Banji, A.A.; Rahman, S.; Sunoj, S.; Igathinathane, C. Impact of Corn Stover Particle Size and C/N Ratio on Reactor Performance in Solid-State Anaerobic Co-Digestion with Dairy Manure: Journal of the Air & Waste Management Association (Taylor & Francis Ltd). J. Air Waste Manag. Assoc. 2020, 70, 436–454. [Google Scholar] [CrossRef] [PubMed]
- Suarez, E.; Tobajas, M.; Mohedano, A.F.; de la Rubia, M.A. Energy Recovery from Food Waste and Garden and Park Waste: Anaerobic Co-Digestion versus Hydrothermal Treatment and Anaerobic Co-Digestion. Chemosphere 2022, 297, 134223. [Google Scholar] [CrossRef] [PubMed]
- Jaimes-Estévez, J.; Martí-Herrero, J.; Poggio, D.; Zafra, G.; Gómez, K.; Escalante, H.; Castro, L. The Role of Biochar in the Psychrophilic Anaerobic Digestion: Effects on Kinetics, Acids Metabolism, and Microbial Population. Bioresour. Technol. Rep. 2023, 23, 101566. [Google Scholar] [CrossRef]
- Zhang, W.; Xiao, B.; Zhang, K.; Chen, H.; Guo, X. Effects of Mixing Ratios on Anaerobic Co-Digestion of Swine Manure and Rice Straw: Methane Production and Kinetics. Biomass Conv. Bioref. 2023, 13, 1553–1563. [Google Scholar] [CrossRef]
- Yang, Y.; Zhang, M.; Zhao, J.; Wang, D. Effects of Particle Size on Biomass Pretreatment and Hydrolysis Performances in Bioethanol Conversion. Biomass Conv. Bioref. 2022, 13, 13023–13036. [Google Scholar] [CrossRef]
- Wang, Y.; Zheng, K.; Ding, J.; Guo, H.; Chen, X.; Zhu, T.; Sun, P.; Liu, Y. Ultrasonic Radiation Enhances Percarbonate Oxidation for Improving Anaerobic Digestion of Waste Activated Sludge. Chem. Eng. J. 2023, 457, 141178. [Google Scholar] [CrossRef]
- Wu, Y.; Song, K. Anaerobic Co-Digestion of Waste Activated Sludge and Fish Waste: Methane Production Performance and Mechanism Analysis. J. Clean. Prod. 2021, 279, 123678. [Google Scholar] [CrossRef]
- Kainthola, J.; Shariq, M.; Kalamdhad, A.S.; Goud, V.V. Enhanced Methane Potential of Rice Straw with Microwave Assisted Pretreatment and Its Kinetic Analysis. J. Environ. Manag. 2019, 232, 188–196. [Google Scholar] [CrossRef] [PubMed]
- Savoo, S.; Mudhoo, A. Biomethanation Macrodynamics of Vegetable Residues Pretreated by Low-Frequency Microwave Irradiation. Bioresour. Technol. 2018, 248, 280–286. [Google Scholar] [CrossRef] [PubMed]
- Grosser, A.; Neczaj, E. Sewage Sludge and Fat Rich Materials Co-Digestion—Performance and Energy Potential. J. Clean. Prod. 2018, 198, 1076–1089. [Google Scholar] [CrossRef]
- Farghali, M.; Shimahata, A.; Mohamed, I.M.A.; Iwasaki, M.; Lu, J.; Ihara, I.; Umetsu, K. Integrating Anaerobic Digestion with Hydrothermal Pretreatment for Bioenergy Production: Waste Valorization of Plastic Containing Food Waste and Rice Husk. Biochem. Eng. J. 2022, 186, 108546. [Google Scholar] [CrossRef]
- Gaballah, E.S.; Abomohra, A.E.-F.; Xu, C.; Elsayed, M.; Abdelkader, T.K.; Lin, J.; Yuan, Q. Enhancement of Biogas Production from Rape Straw Using Different Co-Pretreatment Techniques and Anaerobic Co-Digestion with Cattle Manure. Bioresour. Technol. 2020, 309, 123311. [Google Scholar] [CrossRef] [PubMed]
- Azarmanesh, R.; Zonoozi, M.H.; Ghiasinejad, H. Characterization of Food Waste and Sewage Sludge Mesophilic Anaerobic Co-Digestion under Different Mixing Ratios of Primary Sludge, Secondary Sludge and Food Waste. Biomass Bioenerg. 2020, 139, 105610. [Google Scholar] [CrossRef]
- Liu, Q.; Zhang, G.; Kong, G.; Liu, M.; Cao, T.; Guo, Z.; Zhang, X.; Han, L. Valorizing Manure Waste into Green Coal-like Hydrochar: Parameters Study, Physicochemical Characteristics, Combustion Behaviors and Kinetics. Renew. Energy 2023, 216, 119103. [Google Scholar] [CrossRef]
- Mankar, A.R.; Pandey, A.; Modak, A.; Pant, K.K. Pretreatment of Lignocellulosic Biomass: A Review on Recent Advances. Bioresour. Technol. 2021, 334, 125235. [Google Scholar] [CrossRef] [PubMed]
- Liu, Q.; Zhang, G.; Liu, M.; Kong, G.; Xu, R.; Han, L.; Zhang, X. Fast Hydrothermal Liquefaction Coupled with Homogeneous Catalysts to Valorize Livestock Manure for Enhanced Biocrude Oil and Hydrochar Production. Renew. Energy 2022, 198, 521–533. [Google Scholar] [CrossRef]
- Ain, Q.-U.-; Farooq, M.U.; Jalees, M.I. Application of Magnetic Graphene Oxide for Water Purification: Heavy Metals Removal and Disinfection. J. Water Process. Eng. 2020, 33, 101044. [Google Scholar] [CrossRef]
- Liu, L.; Mi, Z.; Guo, Z.; Wang, J.; Feng, F. A Label-Free Fluorescent Sensor Based on Carbon Quantum Dots with Enhanced Sensitive for the Determination of Myricetin in Real Samples. Microchem. J. 2020, 157, 104956. [Google Scholar] [CrossRef]
- Wu, Y.; Hu, W.; Zhu, Z.; Zheng, X.; Chen, Y.; Chen, Y. Enhanced Volatile Fatty Acid Production from Food Waste Fermentation via Enzymatic Pretreatment: New Insights into the Depolymerization and Microbial Traits. ACS EST Eng. 2023, 3, 26–35. [Google Scholar] [CrossRef]
- Chen, P.; Peng, H.; Zhang, Z.; Zhang, Z.; Chen, Y.; Chen, J.; Zhu, X.; Peng, J. Facile Preparation of Highly Thermosensitive N-Doped Carbon Dots and Their Detection of Temperature and 6-Mercaotopurine. Microchem. J. 2021, 171, 106835. [Google Scholar] [CrossRef]
- Reguyal, F.; Sarmah, A.K. Adsorption of Sulfamethoxazole by Magnetic Biochar: Effects of pH, Ionic Strength, Natural Organic Matter and 17α-Ethinylestradiol. Sci. Total Environ. 2018, 628–629, 722–730. [Google Scholar] [CrossRef] [PubMed]
- Zhen, G.; Lu, X.; Su, L.; Kobayashi, T.; Kumar, G.; Zhou, T.; Xu, K.; Li, Y.-Y.; Zhu, X.; Zhao, Y. Unraveling the Catalyzing Behaviors of Different Iron Species (Fe2+ vs. Fe0) in Activating Persulfate-Based Oxidation Process with Implications to Waste Activated Sludge Dewaterability. Water Res. 2018, 134, 101–114. [Google Scholar] [CrossRef] [PubMed]
- Liu, X.; Fang, Z.; Tian, X.; Miao, Z. Effect of Alkali Salt-Coupled Ball Milling Pretreatment of Wheat Straw on Improving Enzymatic Hydrolysis and Energy Efficiency. Fuel 2023, 340, 127336. [Google Scholar] [CrossRef]
- Zhang, Z.; Tahir, N.; Li, Y.; Zhang, T.; Zhu, S.; Zhang, Q. Tailoring of Structural and Optical Parameters of Corncobs through Ball Milling Pretreatment. Renew. Energy 2019, 141, 298–304. [Google Scholar] [CrossRef]
- Sitotaw, Y.W.; Habtu, N.G.; Gebreyohannes, A.Y.; Nunes, S.P.; Van Gerven, T. Ball Milling as an Important Pretreatment Technique in Lignocellulose Biorefineries: A Review. Biomass Conv. Bioref. 2021, 13, 15593–15616. [Google Scholar] [CrossRef]
- Li, Y.; Wang, H.; Wang, L.; Qiu, J.; Li, Z.; Wang, L. Milling of Wheat Bran: Influence on Digestibility, Hydrolysis and Nutritional Properties of Bran Protein during in Vitro Digestion. Food Chem. 2023, 404, 134559. [Google Scholar] [CrossRef] [PubMed]
- Pihlajaniemi, V.; Sipponen, M.H.; Liimatainen, H.; Sirviö, J.A.; Nyyssölä, A.; Laakso, S. Weighing the Factors behind Enzymatic Hydrolyzability of Pretreated Lignocellulose. Green Chem. 2016, 18, 1295–1305. [Google Scholar] [CrossRef]
- Wang, Y.; Wang, X.; Wang, D.; Zhu, T.; Zhang, Y.; Horn, H.; Liu, Y. Ferrate Pretreatment-Anaerobic Fermentation Enhances Medium-Chain Fatty Acids Production from Waste Activated Sludge: Performance and Mechanisms. Water Res. 2023, 229, 119457. [Google Scholar] [CrossRef]
- Gupta, D.; Mahajani, S.M.; Garg, A. Investigation on Hydrochar and Macromolecules Recovery Opportunities from Food Waste after Hydrothermal Carbonization. Sci. Total Environ. 2020, 749, 142294. [Google Scholar] [CrossRef] [PubMed]
- Wei, W.; Zhou, X.; Wang, D.; Sun, J.; Wang, Q. Free Ammonia Pre-Treatment of Secondary Sludge Significantly Increases Anaerobic Methane Production. Water Res. 2017, 118, 12–19. [Google Scholar] [CrossRef] [PubMed]
- Wang, X.; Wang, P.; Meng, X.; Ren, L. Performance and Metagenomics Analysis of Anaerobic Digestion of Food Waste with Adding Biochar Supported Nano Zero-Valent Iron under Mesophilic and Thermophilic Condition. Sci. Total Environ. 2022, 820, 153244. [Google Scholar] [CrossRef] [PubMed]
- Wang, P.; Yu, M.; Lin, P.; Zheng, Y.; Ren, L. Effects of Biochar Supported Nano Zero-Valent Iron with Different Carbon/Iron Ratios on Two-Phase Anaerobic Digestion of Food Waste. Bioresour. Technol. 2023, 382, 129158. [Google Scholar] [CrossRef] [PubMed]
- Bareither, C.A.; Wolfe, G.L.; McMahon, K.D.; Benson, C.H. Microbial Diversity and Dynamics during Methane Production from Municipal Solid Waste. Waste Manag. 2013, 33, 1982–1992. [Google Scholar] [CrossRef] [PubMed]
- Zhang, H.; Yuan, W.; Dong, Q.; Wu, D.; Yang, P.; Peng, Y.; Li, L.; Peng, X. Integrated Multi-Omics Analyses Reveal the Key Microbial Phylotypes Affecting Anaerobic Digestion Performance under Ammonia Stress. Water Res. 2022, 213, 118152. [Google Scholar] [CrossRef] [PubMed]
- Zhang, J.; Buhe, C.; Yu, D.; Zhong, H.; Wei, Y. Ammonia Stress Reduces Antibiotic Efflux but Enriches Horizontal Gene Transfer of Antibiotic Resistance Genes in Anaerobic Digestion. Bioresour. Technol. 2020, 295, 122191. [Google Scholar] [CrossRef]
- Buchfink, B.; Xie, C.; Huson, D.H. Fast and Sensitive Protein Alignment Using DIAMOND. Nat. Methods 2015, 12, 59–60. [Google Scholar] [CrossRef] [PubMed]
Disclaimer/Publisher’s Note: The statements, opinions and data contained in all publications are solely those of the individual author(s) and contributor(s) and not of MDPI and/or the editor(s). MDPI and/or the editor(s) disclaim responsibility for any injury to people or property resulting from any ideas, methods, instructions or products referred to in the content. |
© 2024 by the authors. Licensee MDPI, Basel, Switzerland. This article is an open access article distributed under the terms and conditions of the Creative Commons Attribution (CC BY) license (https://creativecommons.org/licenses/by/4.0/).