Abstract
Colombia is the world’s leading producer of mildly washed arabica coffee and produces 12.6 million bags of green coffee, but at the same time, 784,000 tons of waste biomass are dumped in open fields, of which only 5% is recovered or used. The objective of this project was to evaluate the production of platform chemicals from these coffee wastes for sustainable resource management. To achieve this, biomass characterization was carried out using proximate analysis, ultimate analysis, and structural analysis. Hydrothermal valorization was carried out at a temperature range of 120–180 °C (LHW) and 180–260 °C (HTC) for one hour. The platform chemicals obtained were quantified by HPLC-RI and monitored by pH and conductivity, and the solid fraction was characterized by monitoring the functional groups in IR spectroscopy and elemental analysis. Hydrolysis processes were obtained at 150 °C, production of platform chemicals at 180 °C, and maximum concentration at 180 °C-4 h; over 200 °C, degradation of the products in the liquid fraction starts to take place. Homogeneous basic and acid catalysts were used to improve the yields of the reaction. The kinetics of the hydrolysis of lignocellulosic structures to sugars were also analyzed and described, and reaction orders of 1 (LHW), 3 (HTC), and their respective reaction rate equations were reported.
1. Introduction
Coffee is a beverage that has been integrated into modern society, becoming an integral part of the daily routine of millions of people around the world. There are approximately 1 billion coffee drinkers worldwide, and over 2 billion cups of coffee are consumed daily [1]. Coffee occupies a significant position in today’s industry and has a far-reaching impact on economies around the world. With an estimated annual production of more than 169.50 million bags (10 million Tons) [2], coffee has become one of the most traded commodities on the planet [3], supporting the livelihoods of countless farmers, traders, and businesses along its complex supply chain. But its importance transcends mere economic value; coffee represents culture, community, and connection, fostering social interactions and driving innovation [4,5].
Even though coffee is such an important commodity, its industry produces over 23 million tons of trash every year, from the pulp of fresh coffee cherries to the packing of roasted beans, according to sustainability researcher Gunter Pauli. Brazil, Vietnam, and Colombia are the main producers of coffee worldwide [6]. According to the FNC, in 2021, the top producer of mild-washed Arabica coffee in the world, Colombia, produced 12.6 million bags of green coffee weighing 60 kg [7]. The Colombian coffee agroindustry uses only 9.5% of the fruit for beverage preparation, with 90.5 percent being by-products dumped into water bodies. This pollution reduces ecosystem life and soil quality. Around two million tons of pulp and 420,000 tons of mucilage are dumped in open fields, affecting the value chain and environment. Efforts are being made to utilize these materials in the pig and livestock industries, beverages, vinegar, biogas, caffeine, pectins, peptic enzymes, proteins, and fertilizers [8,9,10,11]. There are several ways of coffee waste management, such as oxidation ponds [12], modular anaerobic treatment systems [13], anaerobic upflow filters [14], worm farming [15], composting [16], and hydrothermal valorization [17,18,19,20,21].
This paper will mainly focus on hydrothermal carbonization (HTC) and liquid hot water extraction (LHW). Hydrothermal carbonization (HTC) is a promising thermal conversion technology that transforms biomass into hydrochar through the application of heat and pressure in a water-rich environment. This process mimics the natural coal formation process, ranging from 180–260 °C, resulting in a carbon-rich product with improved fuel properties and potential applications in bioenergy, carbon sequestration, and soil improvement [22]. HTC is a sustainable and efficient method for converting waste biomass into valuable products, such as biofuels, chemicals, and other commodities, and it has the potential to improve energy recovery and economic performance in biomass waste treatment systems. Liquid hot water extraction (LHW) involves increasing the water temperature under high pressure. This enhances the solubility and extraction efficiency of target compounds, making LHW a valuable technique for obtaining bioactive compounds, essential oils, and other valuable substances from various natural sources [23,24]. LHW (120–180 °C) is considered an environmentally friendly and cost-effective alternative to traditional solvent extraction methods, as it eliminates the need for harmful organic solvents. The extracted bioactive compounds find applications in the food, pharmaceutical, and nutraceutical industries due to their potential health benefits.
Previous research has been performed regarding the use of coffee (mainly SGC (spent coffee grounds) and silverskin) (Scheme 1) and different hydrothermal processes to obtain platform molecules, such as biochar [25], polysaccharides (Cellobiose, Glucose, Xylose, Galactose, Arabinose, and Maltose) [26], and activated carbon [20] using HTC; via LHW polyphenols, hydroxymethylfurfural, feruloylquinic acid, epicatechin [27], and antioxidants (DPPH, ABTS, and HPLC) [28] were obtained. It is worth noticing that little to no information was found on the hydrothermal valorization of coffee berry waste (made up of husk, mucilage, parchment, and silverskin) in order to present a possibility for sustainable management of coffee wastes.
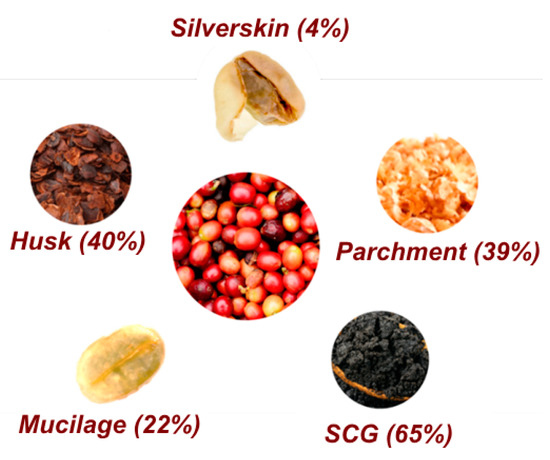
Scheme 1.
Composition of coffee waste. Data from [29].
Hydrothermal valorization offers a promising avenue for the sustainable utilization of coffee waste for the production of valuable platform chemicals. This innovative process involves subjecting coffee grounds to high-temperature, high-pressure conditions in water, breaking down the organic components into simpler molecules. This approach not only mitigates the environmental burden posed by coffee waste but also harnesses its potential as a renewable resource. By utilizing hydrothermal valorization, various platform chemicals, such as phenolic compounds, sugars, and organic acids, can be derived from coffee waste. These chemicals serve as building blocks for numerous industrial applications, including the production of biofuels, bioplastics, and pharmaceuticals. Embracing this method contributes to a circular economy model by reducing waste generation, lowering reliance on fossil fuels, and promoting the sustainable use of resources, ultimately advancing toward a more environmentally friendly and economically viable solution.
The scope of this paper is to analyze the different platform chemicals that are produced through LHW and HTC using residual waste from coffee cherries, their yields, and the best conditions in order to make the process sustainable. This was achieved via a set of hydrothermal experiments modifying time, temperature, and the implementation of homogeneous catalysts. The quantification and characterization were performed through analytic methods (HPLC-RI, IR-spectroscopy, elemental analysis). Purification, kinetic analysis, and optimization of variables based on each platform chemical are some of the goals of this research in order to assess the sustainability of the extraction of platform chemicals from agroindustrial waste as an alternative way of managing waste.
2. Materials and Methods
2.1. Biomass Characterization
The coffee cherry biomass was dried, ground, and sieved according to the technical report NREL/TP 510-42620 using an ASTM 18 mesh (>1 mm) sieve.
2.1.1. Proximate Assay
The assays consisted of moisture (NREL/TP-510-42621 [30]), ash (NREL/TP-510-42622 [31]), volatile matter (ISO-18123-2015 [32]), and fixed carbon (ASTM D 3172-89 [33]), and the procedure is shown in the Supplementary Material.
2.1.2. Ultimate Assay
A Thermo Scientific (Waltham, MA, USA) FLASH 2000 Series Organic Elemental Analyzer was used, and the Technical Report NREL/TP-510-42620 was followed.
2.1.3. Chemical Composition
The lignin, cellulose, and hemicellulose were measured as Neutral Detergent Fiber, Acid Detergent Fiber, and lignin. The procedure presented in the Journal of Dairy Science called “Methods for Dietary Fiber, Neutral Detergent Fiber, and Nonstarch Polysaccharides in Relation to Animal Nutrition” was carried out.
2.2. Hydrothermal Experiments
Experiments were performed in a 100 mL batch reactor with a 1:9 biomass-to-water ratio (3 g of biomass and 27 g of water), which was then placed in a Memmert oven at different temperatures (120–180 °C) at autogenous pressure for 1 h (measured after reaching the desired temperature). To analyze the kinetics of the processes, a set of experiments was conducted at 180 °C, modifying the reaction time from 1 to 5 h. To test another hydrothermal range, reactions were performed at different temperatures from 200 to 260 °C (HTC) at autogenous pressure for 1 h with a 1:9 biomass–water ratio (10 g biomass, 90 g water) in a 500 mL batch reactor. To analyze the kinetics of these processes, a set of experiments was performed at 200 °C, modifying the reaction time from 1 to 5 h. The heating was performed through a heating jacket that surrounded the reactor. The reactors are shown in the Supplementary Material.
2.3. Characterization of Solid and Liquid Fractions
The solid and liquid fractions obtained via hydrothermal processes were separated through vacuum filtration, and they were measured to keep a mass balance. The solid was recovered and washed with water, ethanol, and acetone and dried at 105 °C until constant weight. In order to characterize the solid, Infrared spectroscopy was conducted with a Nicolet iS10 Spectrometer Thermo Fisher Scientific, and elemental analysis was taken with a Thermo Flash 2000 following the NREL/TP-510-42620 as well as SEM images (TESCAN VEGA3). To monitor the liquid fraction, pH and conductivity were measured, and the platform chemicals (PC) were quantified using HPLC-RI. The yields were measured using Equation (1):
2.4. Analytical Methods
For the quantification of PC, a method was developed for HPLC-RI using standards of xylose, glucose, formic acid, levulinic acid, HMF, and furfural. Said method was obtained with a Hitachi Elite LaChrom (Tokyo, Japan) with a Hitachi L-2490 refraction index detector at 40 °C, a SHODEX Sugar SH1821 column at 60 °C, a mobile phase of 0.005 M H2SO4, and a flow rate of 0.5 mL/min. The validation of this method is presented in the Supplementary Material.
2.5. Homogeneous Catalysts
In order to improve the yields obtained in the hydrothermal reactions previously made, a set of acid and basic homogeneous catalysts were used to make the reactions more efficient and specific. H2SO4 [0.02 M], CH3COOH [0.2 M], KOH [0.02 M], and NaHCO3 [0.2 M] solutions were prepared in order to replace the water in the biomass/water (3 g biomass/27 g catalysts solution). Reactions at 180 °C were performed for 1, 2, and 3 h. The obtained fractions were characterized as previously carried out in the other experiments.
2.6. Purification
After optimizing the conditions and obtaining the best yielding conditions, tests of purification were performed using techniques such as distillation (at 100 °C), liquid–liquid partition (octanol–water), C-18 column chromatography (water and ethanol as mobile phases), and ionic interchange chromatography (DOWEX-50W, AMBERLITE IRA 400, and DOWEX* MARATHON* MR-3 with Buffers of pH 4.3, 7 and 12 as mobile phases). All of the obtained extracts were characterized via HPLC-RI in order to test the efficiency of the separation.
3. Results
3.1. Biomass Characterization
3.1.1. Proximal Assay
Table 1 presents the characterization of coffee biomass obtained in this study and other types of coffee biomass from the previous articles. The chemical composition of the biomass is influenced by moisture content, ash content, fixed carbon, volatile matter, and geographical location. Moisture content is crucial for accurate and repeatable results as it helps to start with conditions with similar moisture content. Ash content is influenced by the mineral content of the biomass source and corresponds to inorganic products specific to the biomass. Fixed carbon is related to the organic matter in the biomass and can be influenced by the type of biomass, maturity stage, and carbon/hydrogen ratio. Volatile matter, consisting of combustible gases and compounds, is affected by factors such as biomass decomposition, volatile organic compounds, and processing methods. Geographical location, harvesting and processing methods, contaminants, age and maturity of the biomass source, and species and variety within a biomass type also affect the results of proximate analysis. These factors are important for comparing the results with reports found in the literature, as they may not be consistent across different types of coffee residues used in valorization processes.

Table 1.
Proximal assay of coffee waste.
The biomass of coffee cherries is similar to that of coffee pulp, as it contains pulp, husk, and mucilage. The moisture of the biomass after kiln drying and grinding is calculated as BHP moisture. The initial biomass moisture corresponds to the characterization of coffee cherries without pre-treatment processes. Reducing the moisture from 80.79 to 10.94 (eight times) was possible. However, due to its high moisture percentage, hydrothermal techniques can be used by calculating the biomass-to-water ratio without having to add external water. The biomass has a low amount of volatile matter compared to husks and SCG, indicating a low amount of organic components that release gases when heated. It also has a low, but relevant, amount of volatile matter when compared to husks and SCG, implying that it consists of a low amount of organic components that release gases when the biomass is heated, but that will also be the organic groups that will later be extracted in the aqueous phase, so that, perhaps for recovery processes, parts of the coffee waste with a higher percentage of volatiles could be of interest.
3.1.2. Ultimate Assay
The ultimate assay is of great importance as it provides accurate information on the elemental composition of biomass, which is essential for understanding its potential and applications. It provides information on the amount of carbon, which is directly related to the energy content of the biomass and its suitability as a renewable energy source. The most relevant factors are the O/C, H/C, and C/N ratios, where said ratios classify the biomass within the van Krevelen diagram (Figure 1) and have been widely used to describe the change in biomass composition during thermochemical decomposition [37]. On the other hand, the C/N ratio shows how relevant and feasible a biomass valorization process by means of microbial decomposition can be. When the C/N ratio is over 24/1, the rate of relative decomposition is slower; when it is equal to 24/1, it is the ideal microbial diet, and when it is under 24/1, the rate is faster.
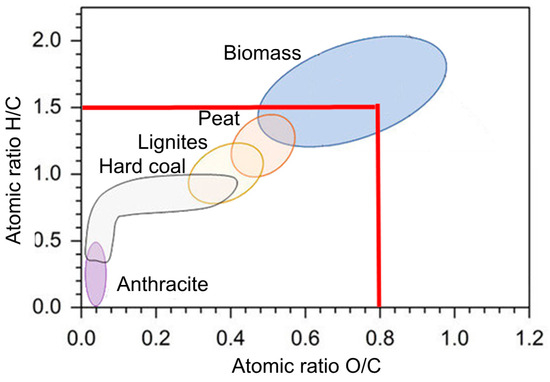
Figure 1.
Van Krevelen diagram for coffee cherry waste. The red line shows the characterization of the initial biomass.
Regarding the characterization of coffee cherries by ultimate assay, the percentages of the different elements are quite similar to those reported for coffee husks (Table 2) since, again, this type of residue is included in coffee cherries. No information was reported on the characterization of either the pulp or the cherry. Considering the O/C and H/C ratios and their location in the Van Krevelen diagram (Figure 1), the sample obtained can be effectively classified as a biomass-type fuel with a higher amount of oxygen and hydrogen than traditional fossil fuels and, therefore, has acceptable conditions to be implemented as biofuel.
Table 2.
Ultimate assay of coffee waste.
In the same way, the C/N ratio corresponding to 19.98 allows for the biomass to be classified according to its possibility of being valorized or treated with microorganisms. In the present case, the ratio favors the rapid decomposition of the biomass by the microorganisms (20:1), which is why one of the most common uses of coffee residues is as a soil fertilizer.
3.1.3. Structural Essay
Depending on the plant species and developmental circumstances, the structures and chemical composition of these biopolymers differ significantly. Hemicellulose and lignin are linked to cellulose by covalent bonds, while cellulose is linked to hemicellulose and lignin by hydrogen bonds. Their direct utilization is a challenge due to the complicated and dense spatial structure, so treatment, in this case hydrothermal, is required to enable efficient conversion. It is important to identify the composition of the biomass in order to know the possible platform chemicals that will be produced after valorization. Considering the results obtained in Table 3, a relevant percentage of all fractions (lignin, cellulose, and hemicellulose) and, therefore, different types of reactions and products will be obtained. For this work, the main focus was on monitoring the valorization of hemicellulose and cellulose (hydrolyzable fraction) in order to focus on the production of sugars (glucose and xylose), organic acids (levulinic, formic, and acetic), and furfural derivatives (furfural and hydroxymethylfurfural (HMF)). It is worth stressing the importance of this characterization process as it allows us to know the physicochemical routes and processes that the biomass and its possible valorization products will take.
Table 3.
Structural essay on coffee waste.
This study compares cherries and other types of coffee waste, revealing greater similarity to SCG but a decrease in hemicellulose compared to pulp and husk. Understanding the percentages of each structure in the biomass can help predict the type of platform chemicals and hydrothermal process to be implemented. In pulp, low hemicellulose makes it unlikely to obtain xylose and derivatives, requiring the use of lignin through an HTC process. In husk, cellulose is abundant but contains little hemicellulose and lignin, making it suitable for glucose extraction through LHW and fermentation processes. Lignin (13.7%), acts as a structural component in the biomass cell wall, enveloping and protecting hemicellulose. This hinders the breaking process with water, decreasing its decomposition and valorization efficiency. Pre-treatment at scaling up or initial fractionation of cellulose, hemicellulose, and lignin could be beneficial but would require more time, energy, and expenses. It is important to note that the sum of lignin, hemicellulose, and cellulose does not equal 100% due to the non-consideration of proteins, fats, fibers, and carbohydrates in the characterization process.
3.2. Hydrothermal Valorization via LHW
Hydrothermal processes were carried out from 120 to 180 °C for one hour and at 180 °C for 5 h, starting in all cases with 3 g of biomass and 27 g of water. The solid, liquid, and gas phase results were obtained, as shown in Table 4. Solids and liquids were measured after filtration, and the gas phase was obtained by subtracting the values of the solids and gases from the initial weight, considering the law of conservation of mass.
Table 4.
Fractions obtained via LHW.
It can then be observed that the ratios of solid fraction, liquid fraction, and gas fraction remain constant in all tests performed within one hour, indicating that there is not a large number of reactions taking place and that the physical characteristics of the solid phase remain relatively constant. On the other hand, with increasing time at a constant temperature, a variation in both the solid and liquid phases and an increase in the gaseous fraction are observed. This may be due to dehydration processes in the medium leading to the removal of water in gaseous form, decarboxylation leading to the removal of CO2, and changes in the structures in both the aqueous and solid phases.
3.2.1. Preliminary Follow-Up of Liquid Fraction
A preliminary follow-up was conducted on the obtaining species of interest by measuring pH and conductivity in liquid fractions obtained after hydrothermal experiments. Conductivity in acids is related to the capacity of an acid to conduct electric current, and it is directly proportional to the concentration of ions in the acid solution. When an acid dissolves in water, some covalent bonds in the acid molecules are broken, releasing hydrogen ions (H⁺) into the solution. These ions are electric charge carriers, moving toward the opposite electrode when an electric potential is applied across the solution. pH is a logarithmic scale that measures the concentration of hydrogen ions (H⁺) in an aqueous solution. In acidic solutions, the concentrations of H⁺ ions are higher, making the pH lower (less than 7 on the pH scale). A neutral solution with a pH of 7 and equal concentrations of H⁺ and OH- ions is the case in sugars. The variation in pH in the aqueous fraction may indicate the presence of acidic or basic species being produced in the medium.
Figure 2 shows the change in pH (decrease) and conductivity (increase) in the liquid fraction at different temperatures (120–180 °C) with a constant time (1 h). A change of 3.336 mS/cm of conductivity is observed, in general, and when applying the criterion of the first derivative, it is observed that the point of greatest change is at 140 °C, so it can be concluded that from this temperature onward, charged species start to be produced and not only the presence of sugars. As for the pH, there is a change of 0.51 pH units, and the greatest change in the acidity of the medium occurs at 150 °C; so it can be concluded that below 150 °C there are few acidic species in the system and there are no relevant changes in the liquid fraction.
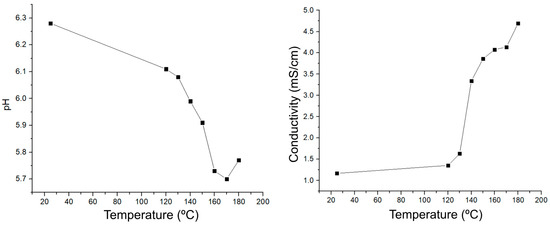
Figure 2.
Preliminary follow-up on experiments from 120–180 °C for 1 h.
The same procedure was repeated by monitoring the pH and conductivity of the liquid fraction at 180 for 5 h, obtaining Figure 3. In both cases, in both conductivity and pH, it is observed that after 4 h, both values decay, which can be explained by a possible degradation of the products previously obtained and, therefore, the decrease in the species of importance for this project. Analyzing the variations from 1–4 h, there is a variation of 1.74 pH units and 5.002 conductivity units, values higher than those obtained only by modifying the temperature. Therefore, it can be preliminarily concluded that the LHW process carried out at 180 °C for 4 h will be the one with the highest production of platform chemicals of interest or, at least, the one with the best transformation of biomass to the aqueous phase in the form of organics.
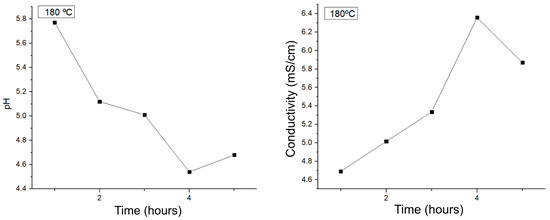
Figure 3.
Preliminary follow-up of experiments from 1 to 5 h at 180 °C.
3.2.2. Characterization of Solid Fraction
Figure 4 shows the infrared spectra obtained for the solid fraction before the hydrothermal treatment and with the hydrothermal processes at 120, 150, 170, and 180 °C. It is important to highlight that the main bands (Table 5) are those of O-H stretching (3284–3308 cm−1), C-H stretching (2919–2923 cm−1), C=C stretching (1608–1622 cm−1), and those present around 1500 cm−1 (C=C stretching of lignin and aromatic C), 1200 cm−1 (C-O-C in cellulose and hemicellulose), and finally, around 1000 cm−1 (corresponding to cellulose and hemicellulose as well). With the last three signals, it is possible to follow the transformation of the initial biomass and the breakdown of the primary structures (lignin, cellulose, and hemicellulose) and, thus, the disappearance of their functional groups in the solid fraction by hydrolysis to proceed to be extracted in the aqueous fraction.
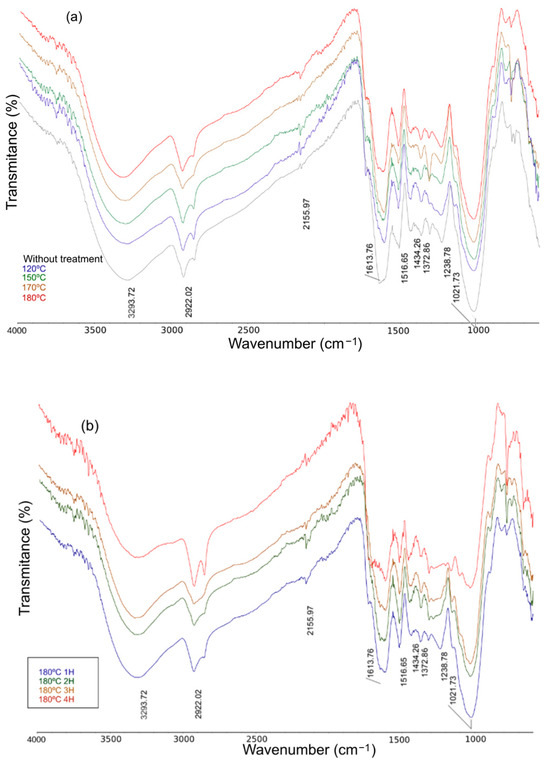
Figure 4.
Infrared spectra of biomass (a) from 120 °C to 180 °C for 1 h and (b) from 1 h to 4 h at 180 °C.
Table 5.
Characteristic vibrations and functionality of biomass.
In the case of Figure 4a, there is no relevant variation in the previously mentioned signals, so no transformation of biomass into biochar is taking place yet, nor are processes of breakdown of the primary lignocellulosic structures. Figure 4b shows a decrease in the OH stretching band, as well as a decrease in the intensity of the hemicellulose, cellulose, and lignin bands in the zone between 1000 and 1600 cm−1, which allows us to conclude that an effective process of hydrolysis and obtaining organic species in the liquid fraction of the hydrothermal process has been carried out, an aspect that goes hand in hand with the results previously obtained from the monitoring of pH and conductivity. It is also important to note the appearance of a band at around 780 cm−1, typical of alcohols and phenols that may have been produced after the hydrothermal reactions. On the other hand, in order to follow up and partially characterize the solid fraction, the elemental analysis of the solids obtained in each of the hydrothermal valorization processes was carried out (Table 6). It can be observed that there are no major changes in the H/C ratio under the temperature of 180 °C, where the ratio starts to decrease due to an increase in the percentage of carbon in the solid fraction. The percentage of oxygen decreases in a more relevant way in the experiments at 180 °C with a longer time, causing the O/C ratio to decrease as well.
Table 6.
Elemental analysis of solid fractions.
Considering these changes, the different experiments were placed on the Van Krevelen diagram (Figure 5) to characterize the fuel type in which the solid fraction is classified. The different colored signs represent the arrangement of the 120–180 °C tests for one hour, while the brown signs represent the experiments at 180 °C for different hours. It is observed that, at higher reaction times and temperatures, the residual biomass from the hydrothermal process starts to assimilate more to other types of fuels, in this case classifying the 180 °C 5 h test as a peat-type fuel, which has applications for cleaning oil spills and for water purification filters, as well as a fuel.
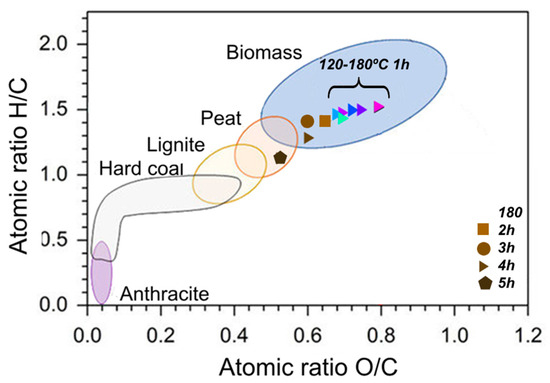
Figure 5.
Van Krevelen diagram of LHW experiments.
The C/N ratio is also modified by the hydrothermal processes, reaching 31:1. This increase in the ratio, as was shown in the initial characterization of the biomass, is above the 24:1 ratio, which allows us to classify the relative decomposition process as a slow-speed one, contrasting with what we had initially and suggesting that the biochar obtained would not be easily degraded by microorganisms.
3.2.3. Quantification of Platform Chemicals
The quantification of the platform chemicals (PC) was performed using the validated method for HPLC-RI described previously, which can be seen more in detail in the Supplementary Material, and an external calibration from 0.1 to 10 g/L of each PC (xylose, glucose, formic acid, levulinic acid, HMF, and furfural).
It was observed that in those experiments corresponding to temperatures of 120, 130, and 140 °C, there were no relevant products obtained, an aspect that goes hand in hand with what was found by monitoring the pH and conductivity of the liquid fractions. Subsequently, from 150 to 180 °C, an extraction of sugars and other compounds, possibly with characteristics of cellu-oligosaccharides, is observed. Then, quantified products in the LHW range with one-hour experiments are shown in Figure 6.
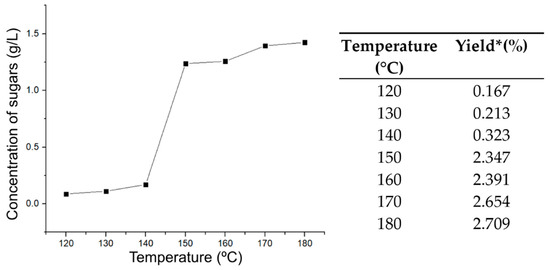
Figure 6.
Concentration of sugars and yield at every LHW experiment for 1 h. * Yield based on lignocellulosic structure.
It is observed that the results obtained correlate with those found in the monitoring by conductivity and pH, where there is an increase in the concentration of sugars at the temperature of 150 °C, where the process of hydrolysis of the hemicellulose/cellulose begins to take place. After this, hydrolysis continues to take place, but in a uniform manner as the temperature is raised to 180 °C. It is worth noting that no other chemical platform compounds were produced at these one-hour temperatures due to the inability to favor reaching products requiring further chemical processes such as hydrogenation, dehydrogenation, decarboxylations, and aldol condensations.
The yield of sugar production from two aspects was calculated in the same way, initially from the initially weighed biomass, in this case, 3 g, obtaining a maximum of 1.086%w sugar. The same process was also used, but taking the percentage of the biomass that corresponds to the lignocellulosic structure from which the sugars come (cellulose and hemicellulose) as the initial quantity for the process, as other components such as lignin, lipids, pigments, and others do not contribute to and could even inhibit the hydrolysis process. With this ratio, a yield of 2.709%w was obtained, which can also be maximized. It is worth mentioning that in the LHW range and with only one hour, it was not possible to obtain more PC, only the extraction of sugars. Subsequently, the same PC quantification and monitoring process was carried out for the experiments performed at constant temperature (180 °C) and modifying the reaction time, obtaining the results presented in Figure 7.
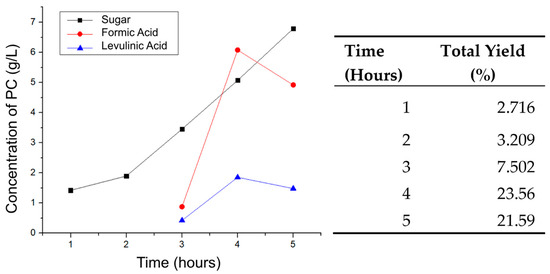
Figure 7.
Concentration of sugars at 180 °C for 1–5 h. Yield based on lignocellulosic structure.
It is observed that as the reaction time increases, the processes of hydrolysis, dehydration, rehydration, and condensation are favored (Figure 7), which leads to the production of PC. After 3 h, formic and levulinic acids start to be extracted, and after 4 h, HMF and furfural are obtained. After this, at 5 h, the efficiency of all products except sugars decreases due to possible degradation to smaller molecules and the instability of some of the previously quantified molecules.
On the other hand, Figure 7 shows the yield of the process based on the amount of initial biomass and its corresponding lignocellulosic structures. It is concluded that the best condition to valorize coffee without the implementation of catalysts and in the LHW range is a temperature of 180 °C for 4 h, achieving a valorization of about 25%w. As previously mentioned, continuing with this process for more hours would decrease the yield of the reaction, and, therefore, HMF and furfural would not be obtained, and the acids would start to break down into ketones and smaller acids, and would undergo decarboxylation, eliminating CO2.
3.3. Hydrothermal Valorization via HTC
To cover another area within the hydrothermal processes (HTC), reactions were carried out between 200 and 260 °C for one hour and at 200 °C for 5 h, starting in all cases with 10 g of biomass and 90 g of water. The solid, liquid, and gas phase results were obtained, as shown in Table 7.
Table 7.
Fractions obtained via HTC.
It is observed that when the temperature is modified between the 200 and 260 °C tests, there is an increase in the amount of liquid fraction and a significant decrease in the gaseous fraction. This can be attributed to the fact that the reaction is mainly going toward the production of biochar, an aspect that is denoted by the decrease in the weight of the solid fraction due to the loss of oxygen and hydrogen molecules from the initial biomass. By preferring the production of biochar, no significant extraction processes are carried out in the liquid fraction (which increases its quantity), and there are no dehydration, decarboxylation, or hydration processes that lead to the expulsion of gases into the reaction medium.
On the other hand, for the experiments carried out at constant temperatures for different times, there is an increase in the solid fraction, and the liquid fraction remains relatively constant; the opposite behavior is presented by the higher HTC valorization temperatures, which may imply that the biochar is not yet fully favored, and the organic species are maintained in the liquid phase.
3.3.1. Preliminary Follow-Ups on Liquid Fraction
The liquid fraction was monitored the same way as in the LHW process, using conductivity and pH properties to understand the behavior of dissociated, acidic, basic, and neutral species in the medium.
Figure 8 shows how the pH behavior in HTC is opposite to that found in LHW. As the temperature increases in HTC, the pH increases and becomes more basic; this implies a decrease in the acidic species in the medium. As for the conductivity, a maximum occurs at 220 °C, where the highest concentration of a species that dissociates in the medium probably occurs, and then, the conductivity decreases following the behavior of the pH, allowing us to conclude that the species of interest produced decrease. This goes hand in hand with the analysis in Table 7, where it can be assumed that higher temperatures favor the production of biochar and decrease some of the organic species of interest in the medium.
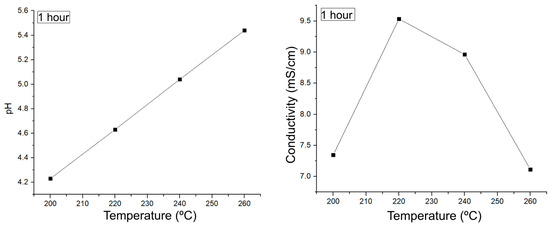
Figure 8.
Preliminary follow-up of experiments from 200 to 260 °C for 1 h.
A similar behavior is presented in Figure 9, where the reaction at 200 °C is followed. There is a minimum pH in the one-hour reaction, implying that most of the acidic species are present at this time and then decrease as the reaction continues until 5 h. As for the conductivity, it keeps oscillating after 2 h of reaction, which can happen due to the equilibrium present in the system, but it does not decay as it happens from 240 °C onwards.
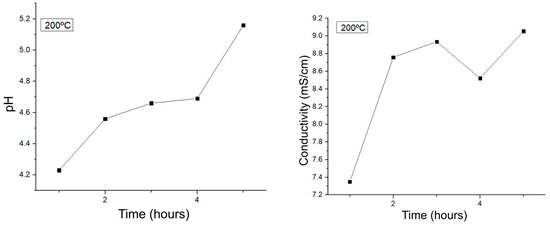
Figure 9.
Preliminary follow-up of experiments from 1 to 5 h at 200 °C.
3.3.2. Characterization of Solid Fraction
The same technique as in LHW was implemented to make a preliminary follow-up to the solid phase. Figure 10 shows the spectra of the hydrothermal processes carried out between 200 and 260 °C and the signal of the initial biomass. Table 8 shows the signals that are maintained, although they change in intensity in the biochar spectra. Initially, it can be observed that there is a decrease or disappearance of the signal at 3200 cm−1, characteristic of the OH vibration; there is also a significant decrease in the signals of the aromatic components and C=O (ketone and acid), as well as a decrease in the signals between 1500–1350 cm−1 of amorphous polysaccharides. Finally, and the most significant change, is the decrease in the signal at 1030 cm−1 corresponding to cellulose, hemicellulose, and lignin vibrations, showing that significant hydrolysis processes of the fundamental structures of the lignocellulosic biomass are being carried out in order to proceed to be transformed into biochar or extracted to the aqueous fraction.
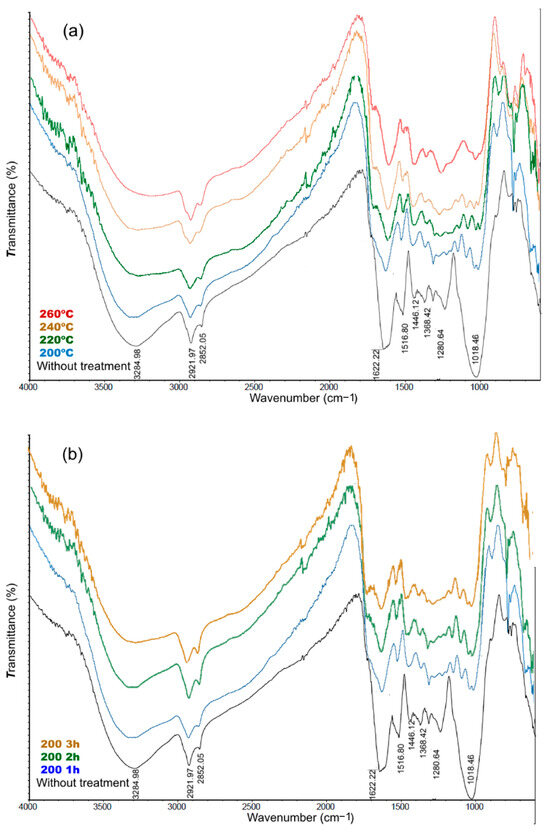
Figure 10.
Infrared spectra of HTC valorization (a) from 200 to 260 °C for 1 h, (b) from 1 to 3 h at 200 °C.
Table 8.
Elemental analysis of HTC experiments.
The same monitoring procedure was repeated for the experiments performed at 200 °C at different times, resulting in Figure 10b. In this figure, the same changes described above can be seen with respect to the initial biomass, and unlike the LHW process, there are no major changes between the spectra at different times, which suggests that the greatest change in the solid is found between the temperatures of 180–200 °C where the lignocellulosic structures of the biomass are broken. In order to monitor and partially characterize the solid fraction, elemental analysis of the solid obtained in each of the hydrothermal valorization processes was carried out, obtaining Table 8.
Figure 11 shows the location of the H/C and O/C ratios in the Van Krevelen diagram, where the different fractions were characterized as lignite, hard coal, and anthracite, with the highest temperature achieving a significant biomass transformation due to the loss of oxygen and hydrogen. Anthracite can be used as a fuel, and hard coal can be used as a coating for paints and binders. On the other hand, as the temperature increases, the organic characteristics of the biomass are lost, leaving mostly inorganic components that affect the C/N ratio and make these biochars unsuitable for implementation in processes related to microorganism treatments. Comparing Table 8 with that previously obtained for LHW, it is found that there is a greater change in the percentages of carbon, hydrogen, and nitrogen, and, therefore, that processes above 200 °C lead to carbonization of the biomass and obtaining new characteristics in the biomass.
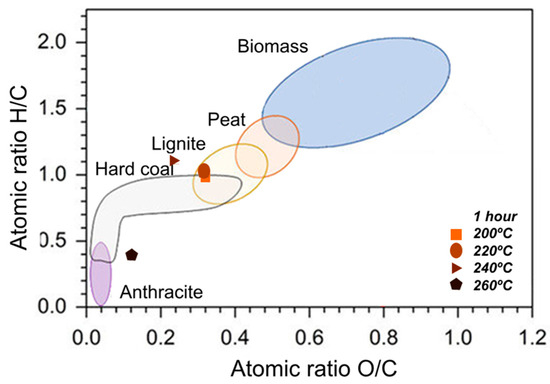
Figure 11.
Van Krevelen characterization of HTC solid fractions.
In order to observe the morphology, samples of the solid fractions obtained after hydrothermal processes at 200, 220, 240, and 260 °C were examined by SEM. The macrostructure of samples and the images (Scheme 2) of the internal structure of biomass after HTC were analyzed. At 220 °C, carbonization begins to break down the cell walls; in contrast, the sample carbonized for one hour at 260 °C looks darker and has a rough, disintegrating surface. The imaging at 260 °C shows a significant development of pores that start to form at 240 °C, which makes the material more reactive for processes of combustion and gasification, an aspect that goes hand in hand with the previously performed Van Krevelen characterization. It is worth noting that a BET analysis or adsorption assays can be carried out with the obtained biochar, but the scope of the present manuscript is the obtention of platform chemicals and not biochar.
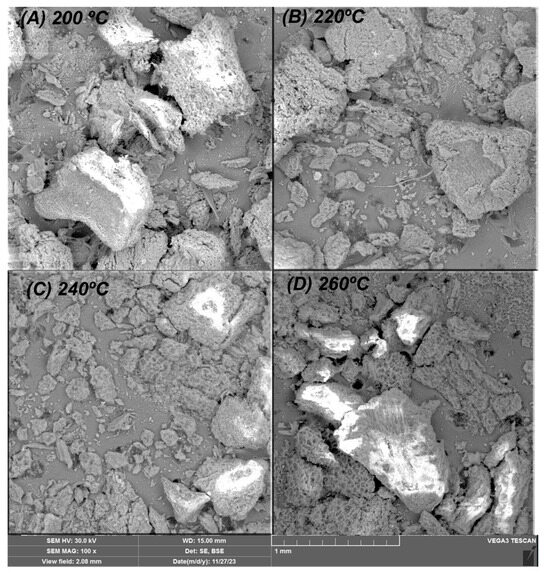
Scheme 2.
SEM imaging of HTC solid fraction.
3.3.3. Quantification of Platform Chemicals
For the quantification process, undiluted liquid fractions were injected into the chromatograph using the previously validated method to qualitatively monitor the production of platform chemicals of interest via the hydrothermal HTC processes from 200 °C to 260 °C for one hour, resulting in Figure 12.
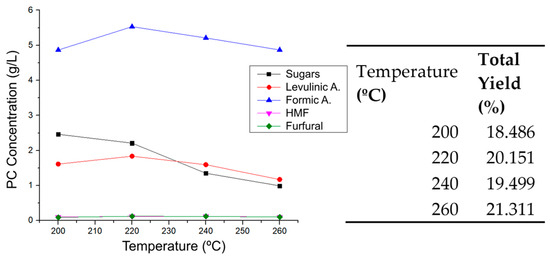
Figure 12.
Platform chemicals production in HTC experiments. Yield based on lignocellulosic structure.
Figure 12 shows that the highest concentrations were obtained at 220 °C (for acids) and at 200 °C for sugars, while HMF and furfural remained relatively constant; this information goes hand in hand with the results previously obtained for the conductivity of these experiments, where a maximum of conductivity was presented at 220 °C caused by the increase in acidic species. From that temperature onward, the concentrations start to decrease for all compounds except HMF and furfural due to degradation of the PCs. On the other hand, when observing Figure 12, the yield (calculated based on the corresponding lignocellulosic structure) of all the processes is very close, but 260 °C is the one with the highest yield, although the concentration of PCs is low compared to the others. This is because the final volume of the reaction at 260 °C (83.312 mL) is greater than that of the other temperatures (62 mL on average), and because the way of evaluating the yield is (g of PC/g of lignocellulosic structure) × 100%, having a greater final volume, the grams in these mL are greater than those of other reactions with higher concentrations but smaller volumes. It is also worth noting that HTC processes with coffee residues lead mostly to the formation of formic acid, and the concentration of sugars decreases compared to LHW processes. Figure 13 shows the PC results for the hydrothermal processes at constant temperatures and varying times.
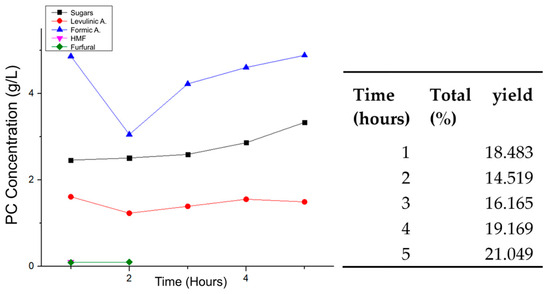
Figure 13.
Platform chemical production in HTC at different times. Based on lignocellulosic structure.
In the case of sugars and organic acids, an increase is observed as the reaction hours go by, while on the other hand, HMF concentrations decrease to the point of being below the calibration curve and not being relevant compared to the other species produced. A maximum yield of 21.049%w was achieved, a value similar to that obtained for the process at 260 °C for 1 h but obtaining a greater quantity of sugars instead of products such as HMF and furfural.
3.4. Kinetics
3.4.1. Kinetics of LHW
In order to analyze the behavior of hydrothermal reactions, the reason why they are carried out must be understood. Water is implemented as a reactant in these reactions due to its capacity to self-ionize, generating hydronium and hydroxyl ions that are free in the aqueous phase. As the temperature of the water increases, the ratio of hydronium and hydroxyl ions is maintained, but the concentration of these ions changes, causing both the Kw and the pH of the water to change as the temperature increases. The higher the temperature, the higher the concentration of free ions because the dissociation of water requires energy, this being an endothermic reaction, and the higher the concentration of hydronium ions, the more hydrolysis processes are favored by generating a positive charge in the oxygen of the β-1-4 glycosidic bonds and favoring the breaking of the bonds.
To analyze the kinetics of the initial hydrolysis of the lignocellulosic biomass to sugars, the concentrations obtained were taken as a function of time at 180 °C by HPLC-RI, and the respective mathematical treatments were made at the kinetics of orders 0, 1, 2, and 3 to obtain Figure 14.
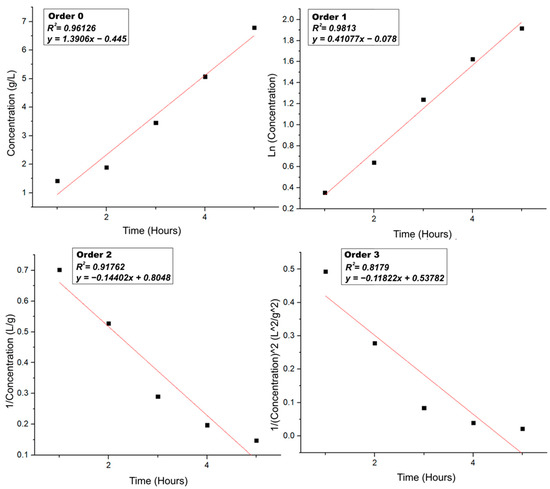
Figure 14.
Mathematical treatments to evaluate the reaction order of kinetics of LHW.
When comparing the correlation with the linear regression of each order, it is observed that the best R2 is that of order 1, which allows us to say that it is a pseudo-first-order reaction as it behaves like a first-order reaction because the rate equation of the reaction is expressed as a first-order-rate equation. The reaction is higher order because it involves more than one reactant (water and lignocellulosic biomass); because one of the reactants is present in excess, its concentration remains apparently unchanged throughout the reaction. Thus, the reaction, when dependent on the concentration of the other reactant, apparently follows a first-order-rate equation.
The fact that it is a pseudo-first-order reaction means that the rate of reaction (hydrolysis to sugars) is directly proportional to the concentration of the lignocellulosic biomass; therefore, the equation governing the process of hydrolysis of biomass to sugars in LHW is Equation (2) and the rate constant is the corresponding slope in Figure 14 order 1 (0.41077 s−1).
3.4.2. Kinetics of HTC
To describe the kinetics of the HTC process, the same technique previously introduced for LHW was implemented at a constant temperature of 200 °C, and at different times, the relevant mathematical treatments were carried out, and Figure 15 was obtained.
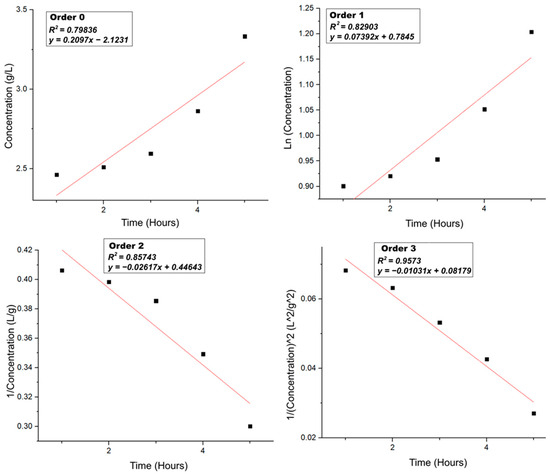
Figure 15.
Mathematical treatments to evaluate the reaction order of kinetics of HTC.
In the case of HTC, it is observed that the behavior is similar to that of higher-order kinetics; in these reactions, more than two species are involved, an aspect that can be explained by the fact that the higher temperature makes hydrolysis more effective, but in the same way, it does not stop at the sugars as it did in LHW, but the reaction continues until levulinic and formic acids form and then other compounds are derived from the degradation of these. It is also important to note that at the working temperature, biochar is also produced, which is another species that affects the kinetics of the reaction. The rate constant corresponds to the slope of the higher-order graph (0.0103 L/g), and Equation (3) governing the process is presented below:
This shows that the reactions carried out in HTC are more complex than those in LHW; the hydrolysis process is accompanied by other species and does not stop at the sugars but continues the process up to the other PCs. The production of acids, furfural, HMF, gases, biochar, and other products makes it impossible to follow the kinetics of specific reactions, as the chemical processes of hydrothermal valorization are simultaneous and can be favored or inhibited by the species present in the medium, making the kinetics and their description more complex.
3.5. Optimization Based on Platform Chemicals
Considering the experiments carried out, the mechanism, and the yields based on each platform’s chemical composition, the optimal conditions to favor the specific obtaining of each PC are reported.
For sugars, Figure 16 shows that the use of H2SO4 favors the production of sugars at 180 °C in less time and more selectively, but that similar concentrations can be reached with reactions at 180 °C, but for a longer time (5 h), because these processes allow for the hydrolysis of the lignocellulosic structures to take place, but the energy provided to the system is not enough for the subsequent reactions to take place. It is important to emphasize that the energy expenditure to carry out the reaction for 5 h is higher than that involved in a one-hour reaction. Weak basic catalysts also act favorably on the process and could be successfully implemented. On the other hand, the temperature increases above 220 °C, and the weak acid catalysts act as inhibitors of the sugar production process and favor the production of other products.
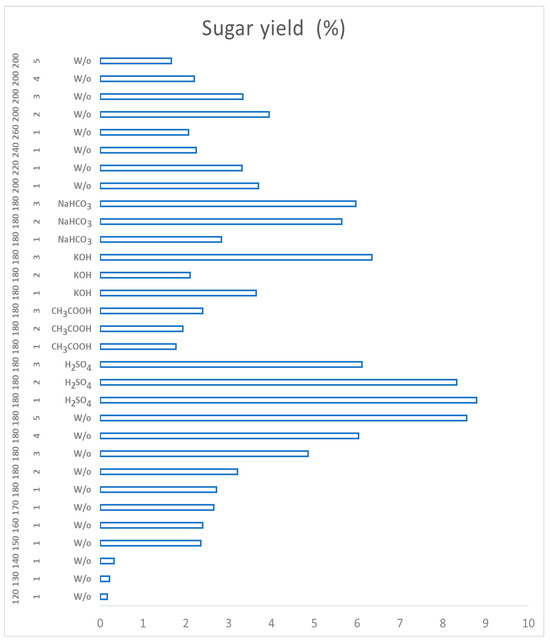
Figure 16.
Optimization of reaction conditions for sugar obtention.
The production of levulinic acid is also not favored at low temperatures as there is not enough energy for the reactions characteristic of hydrothermal processes to take place. Figure 17 shows how the process of obtaining levulinic acid requires the use of a catalyst that increases the yield and displaces the hydrothermal reactions to obtain it. With the results of the present work, the use of weak acid catalysts such as acetic acid is suggested since, as previously presented, strong acid catalysts lead to the majority production of sugars and not the breakdown of these to levulinic acid.
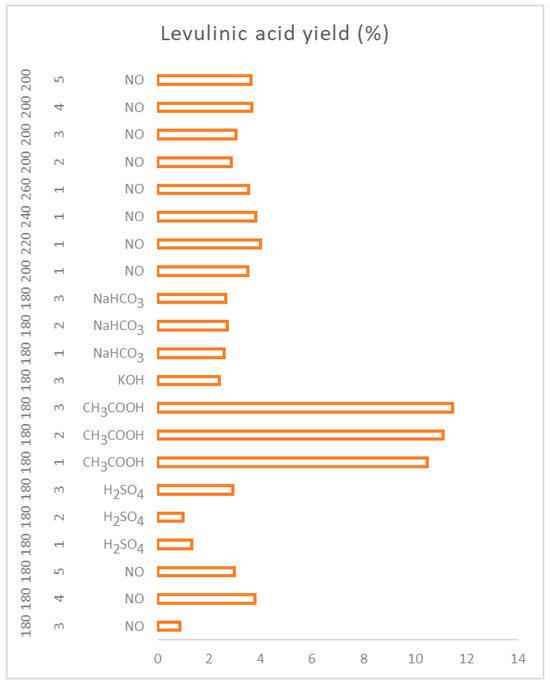
Figure 17.
Optimization of reaction conditions for levulinic acid obtention.
The increase in reaction time and temperature are factors that do not drastically change the yield of levulinic acid, so a catalyst is highly recommended. As for formic acid, Figure 18 shows that the process is not favored at low temperatures and short reaction times, which is why it is not produced below 180 °C for 3 h. Although there is enough energy to hydrolyze even sugars, the condensation and hydration reactions that form formic acid are not fully favored. The best condition for obtaining this PQP is the implementation of HTC, especially at temperatures above 240 °C, although significant concentrations can also be obtained by increasing the reaction time at temperatures not as high as 180 and 200 °C. In the same way, the implementation of weak basic catalysts leads to the formation of formic acid in less time and under LHW conditions.
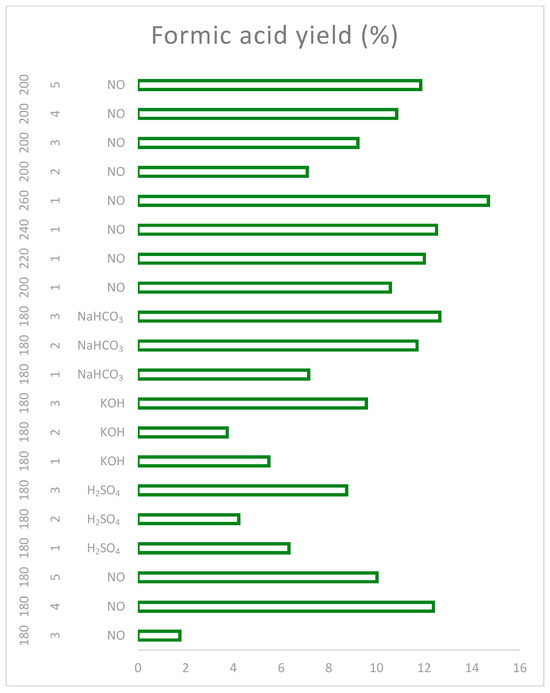
Figure 18.
Optimization of reaction conditions for formic acid obtention.
HMF and furfural are the minority products of the hydrothermal reactions carried out with coffee residues, achieving, as shown in Figure 19, a maximum yield of 1.480%w based on the corresponding lignocellulosic structures. In order to obtain these products, temperatures above 180 °C must be used, supported either by a longer reaction time or by strong acid catalysts. Reactions above 200 °C and for more than one hour start to cause degradation of the products and are, therefore, not suggested, and it is desired to stop the reaction on these specific products.
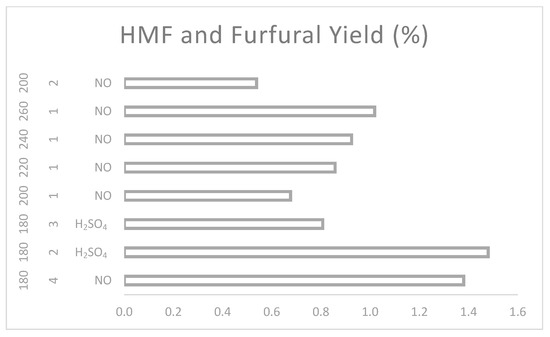
Figure 19.
Optimization of reaction conditions for HMF and furfural obtention.
Catalysts Influence
Table S10 of the Supplementary Material presents in detail the total yields and concentrations of catalysts used in the optimization previously shown. It is then observed that in all the hours, the total yield of all the catalysts exceeds the yield of the reaction without a catalyst, an aspect that demonstrates the efficiency of the catalysis. On the other hand, it can be observed how the different catalysts lead to the majority production of different PCs (as seen in Figure 16, Figure 17, Figure 18 and Figure 19).
In the case of basic catalysts, both potassium hydroxide and sodium bicarbonate favor the production of formic acid in addition to producing biochar with lignite characteristics and sodium in its structure, characteristics that are not favored by implementing acid catalysts. These conclusions go hand in hand with what has been reported in the literature, where acid catalysts decrease the quality of the biochar or biocrude obtained but improve the extraction of organic compounds [41]. It is also observed that the acidic medium increases the production of levulinic acid, HMF, and furfural, benefiting the dehydration reactions [42] as they form Lewis acid sites that can effectively catalyze the dehydration reactions. Lewis acids can also activate the carbonyl groups of the reactants, which is essential to initiate key reactions. Finally, Lewis acids’ sites can promote isomerization reactions, which may be involved in the conversion of intermediates into final products. This may improve the selectivity and increase the yield of HMF and levulinic acid [43]. Figure 20 shows a graph with the specific behavior of the coffee residues that allows us to know the functioning of the catalysts and their selectivity in order to select the reaction conditions depending on the desired PCs.
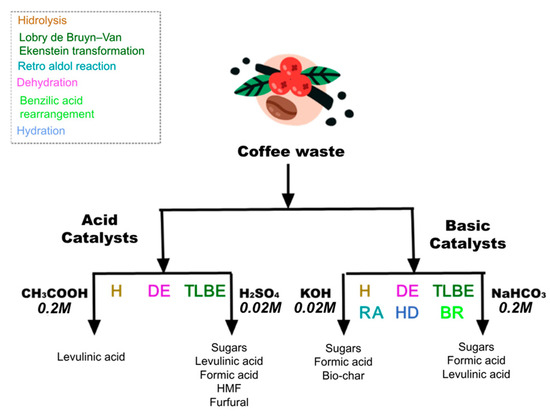
Figure 20.
Catalysts influence on coffee cherry waste valorization.
In the case of sulfuric acid, the presence of a variety of platform chemicals can be observed, as well as how they decrease the concentration of sugars (by means of hydrolysis) to proceed to produce organic acids, HMF, and furfural. Acetic acid is, on the contrary, a very selective catalyst for levulinic acid, obtaining mostly levulinic acid and non-hydrolyzed sugars, and it is also the catalyst with the highest yield against levulinic acid from the first hour. The basic catalysts produce mostly formic acid and levulinic acid, but unlike the acid catalysts, the concentration of sugars does not decrease over time, and more sugars continue to be produced. This may be because the acid medium favors the hydrolysis of cellulose and hemicellulose species more efficiently and rapidly, breaking the glycosidic bonds and obtaining sugars in shorter times; on the other hand, the base does not favor these initial breaks in the biomass, so hydrolysis is slower and takes place little by little.
3.6. Purification
To perform the separation of the formic acid, the boiling point difference in the system was used, implementing a simple distillation system at 100 °C to eliminate both water and formic acid. After the formic acid was collected, it was injected into the HPLC-RI to check the purity of the separated product.
Preliminary separation tests were performed with the remaining mixture from the distillation (mixture of sugars and levulinic acid). The liquid–liquid separation with octanol to extract the levulinic acid in the organic phase and the sugars in the aqueous phase was not successful because levulinic acid had polar characteristics, which means that the partition is not completely carried out and a large amount of the sample remains in the aqueous phase. In the same way, separation was attempted by implementing column chromatography with a silica gel stationary phase and ethanol mobile phase followed by water due to the affinity of levulinic acid toward ethanol. This process was again unsatisfactory due to the similarity in polarity of the compounds to be separated.
Due to the inability to separate by polarity, ion exchange (AMBERLITE IRA 400), cationic (DOWEX-50W), and anionic:cationic (DOWEX* MARATHON* MR-3) resins were implemented. Considering the behavior of acid when it is at a pH below its pKa, as is the case of levulinic acid, it would be expected that this would be in its anionic form at the elution pH of the first buffer (4.3) and, therefore, the most suitable resin for the separation process would be AMBERLITE IRA 400, which would retain the levulinic acid in its levulinate form while leaving the sugars in the mixture to elute. This process was confirmed by obtaining zero separation of the desired compounds in the case of the DOWEX MARATHON MR-3, while in the case of the DOWEX-50W, a separation was achieved, but of some colored compounds that do not absorb in the IR (a brown colored spot was retained), but not of levulinic acid and sugars. Finally, as expected, when implementing the anion exchange column, levulinic acid was retained as levulinate when eluting the column at pH 4.3, while the sugars came out with the buffer (Figure 21). Subsequently, when the pH of the buffer was changed above the pKa of the levulinic acid, the levulinic acid started to elute without sugars, thus achieving its separation.
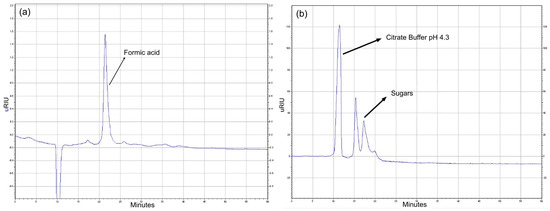
Figure 21.
Purification process for (a) formic acid and (b) sugars.
It is, therefore, suggested that separation methods such as liquid–liquid partitioning and silica gel column chromatography are not suitable for the separation of the platform chemicals. On the other hand, distillation, followed by anion exchange chromatography, can be implemented to separate and purify the desired compounds. It is worth noting that in this process, neither HMF nor furfural was separated due to their low concentrations and the loss of these in the distillation process due to possible residues in the assembly.
4. Conclusions
This study characterized coffee waste biomass through ultimate, proximate, and structural tests. It was found to be highly humid (80.79%) with fuel characteristics suitable for biorefinery processes and microorganism valorization processes. The biomass contained similar percentages of hemicellulose (12.5%), lignin (13.7%), and hemicellulose (27.6%).
For the LHW range, reactions below 150 °C did not allow for the hydrolysis of lignocellulosic structures to sugars. pH and conductivity were used as properties to monitor PC production. The solid fractions were classified according to fuel type, and infrared spectroscopy was used to follow the disappearance of functional groups from lignin, cellulose, and hemicellulose between 1000 and 1500 cm−1 and their relationship with the production of platform chemicals. The best conditions for obtaining platform chemicals were achieved at 180 °C at 4 h, with a yield of 23.565%w. The efficiency and selectivity of homogeneous catalysts were tested, with acetic acid leading to selective production of levulinic acid, sulfuric acid leading to the highest efficiency of hydrolysis of sugars, potassium hydroxide leading to the production of biochar, formic acid, and sugars, and sodium bicarbonate producing formic acid and levulinic acid. The kinetics of the hydrolysis of lignocellulosic structures to sugars in the LHW range was evaluated, with orders of 1 with their respective rate constant. Purification of PCs was achieved using distillation techniques and anion exchange chromatography with AMBERLITE IRA 400 exchange resin.
HTC valorization trials were conducted, with the solid phase characterized as hard coal and anthracites and an overall higher formation of formic acid due to the decomposition of bigger PC and a decrease in sugar formation due to its transformation into smaller PC. Optimal conditions for obtaining sugars involved using sulfuric acid as a catalyst or 180 °C for 5 h for the production of formic acid reactions should be carried out at HTC conditions, preferably 260 °C, and levulinic acid requires weak acid catalysts like acetic acid. HMF and furfural were benefited by strong acid catalysts at 180 °C or a longer reaction time. In conclusion, coffee cherry waste as a raw material for hydrothermal biorefinery is viable and favored for obtaining glucose, xylose, levulinic acid, and furfural, with lower percentages of HMF and furfural.
The utilization of millions of tons of coffee berry waste to produce 9% glucose and xylose, 1.5% furfural and HMF, 11.5% levulinic acid, and 15% formic acid presents a significant opportunity for sustainable resource management and the development of a circular bioeconomy. The production of glucose and xylose, key monomeric sugars, offers the potential for the synthesis of biofuels, biochemicals, and biopolymers, contributing to the reduction in reliance on fossil resources. Furfural and HMF, derived from the dehydration of sugars, can be utilized as platform chemicals for the production of various value-added products, including biofuels and bioplastics. Furthermore, levulinic acid and formic acid, as versatile building blocks, can be employed in the synthesis of pharmaceuticals, agrochemicals, and polymers, thus contributing to the diversification of the chemical industry and the reduction in environmental impact. This approach aligns with the principles of a sustainable bioeconomy, where waste materials are transformed into high-value products, contributing to resource efficiency, reduced environmental impact, and economic growth. The switch from conventional waste treatment techniques, such as burning and fertilizer, to HTC for the valorization of coffee berry waste can lead to a more sustainable and circular approach to waste management, reducing environmental impact and contributing to the development of a sustainable bioeconomy.
Supplementary Materials
The following supporting information can be downloaded at https://www.mdpi.com/article/10.3390/su16072854/s1. Equations (S1)–(S5). Image S1. LHW Batch 100 mL reactor for hydrothermal processes. Image S2. HTC 500 mL reactors for hydrothermal valorization. Table S1: Retention time for standards used; Figure S1: Standards used for analytic method development. Table S2: Information of calibration curves for platform chemicals (PC); Figure S2: Calibration curves done for every PC.; Figure S3: Residuals of calibration curves; Table S3: Repeatability of the system based on the retention time; Table S4: Repeatability of the system based on the area; Table S5: Results for the repeatability of the method; Table S6: Results for intermediate precision for the method developed; Table S7: Accuracy of the results obtained for the method; Table S8: Detection and quantification limit for the method; Table S9: Results for robustness of the method; Table S10: Yield of platform chemicals produced from LHW valorization; Table S11: Yields and concentration of platform chemicals produces at 180 °C for 1–5 h; Table S12: HTC yields and concentration; Table S13: HTC yields and concentration at 200 °C; Table S14: Yields and concentrations of PC using homogeneous catalysts.
Author Contributions
Conceptualization, A.S.L.-P.; methodology, A.S.L.-P.; validation, A.S.L.-P.; formal analysis, A.S.L.-P.; investigation, A.S.L.-P.; resources, C.A.G.-F.; data curation, A.S.L.-P.; writing—original draft preparation, A.S.L.-P.; writing—review and editing, C.A.G.-F.; supervision, C.A.G.-F.; project administration, C.A.G.-F.; funding acquisition, A.S.L.-P. All authors have read and agreed to the published version of the manuscript.
Funding
This research was funded by MINCIENCIAS, Contrato de financiamiento de recuperación contingente No. 80740-101-2022.
Data Availability Statement
Data are contained within the article and supplementary materials.
Acknowledgments
We thank the Universidad Nacional de Colombia and the Departamento de Química for their support and the possibility of using the equipment and techniques that allowed for the development of this article.
Conflicts of Interest
The authors declare no conflict of interest.
References
- Word Population Review. Coffee Consumption by Country 2023. Available online: https://worldpopulationreview.com/country-rankings/coffee-consumption-by-country (accessed on 1 December 2023).
- International Coffee Organization. Trade Statistics—December 2021. Available online: http://www.ico.org/#:~:text=Total%20production%20for%20coffee%20year,remains%201.2%25%20below%20world%20production (accessed on 28 November 2023).
- Apriani, D.; Marissa, F.; Gustriani, G.; Sinta, H. Determinants of Indonesia’s Coffee Commodity with Trading Partner Countries. J. Ekon. Pembang. Kaji. Masal. Ekon. Dan. Pembang. 2022, 23, 98–109. [Google Scholar] [CrossRef]
- Arruda, A.C.; Minim, V.P.R.; Ferreira, M.A.M.; Minim, L.A.; da Silva, N.M.; Soares, C.F. Justificativas e motivações do consumo e não consumo de café. Ciência E Tecnol. De Aliment. 2009, 29, 754–763. [Google Scholar] [CrossRef]
- Folch, A.; Planas, J. Cooperation, Fair Trade, and the Development of Organic Coffee Growing in Chiapas (1980–2015). Sustainability 2019, 11, 357. [Google Scholar] [CrossRef]
- FAO Statistics. World Coffee Production by Country; FAO Statistics: Rome, Italy, 2019. [Google Scholar]
- Federación de Cafeteros. Colombian Coffee Production Closes 2021 at 12.6 Million Bags. Available online: https://federaciondecafeteros.org/wp/listado-noticias/colombian-coffee-production-closes-2021-at-12-6-million-bags/?lang=en (accessed on 1 December 2023).
- Peshev, D.; Mitev, D.; Peeva, L.; Peev, G. Valorization of spent coffee grounds—A new approach. Sep. Purif. Technol. 2018, 192, 271–277. [Google Scholar] [CrossRef]
- Mazzafera, P. Degradation of caffeine by microorganisms and potential use of decaffeinated coffee husk and pulp in animal feeding. Sci. Agric. 2002, 59, 815–821. [Google Scholar] [CrossRef]
- Kasongo, R.K.; Verdoodt, A.; Kanyankagote, P.; Baert, G.; Van Ranst, E. Coffee waste as an alternative fertilizer with soil improving properties for sandy soils in humid tropical environments. Soil Use Manag. 2011, 27, 94–102. [Google Scholar] [CrossRef]
- Abdeltaif, S.; SirElkhatim, K.; Hassan, A. Estimation of Phenolic and Flavonoid Compounds and Antioxidant Activity of Spent Coffee and Black Tea (Processing) Waste for Potential Recovery and Reuse in Sudan. Recycling 2018, 3, 27. [Google Scholar] [CrossRef]
- Rodriguez, N. Manejo de Residuos en la Agroindustria Cafetera. Available online: https://silo.tips/download/manejo-de-residuos-en-la-agroindustria-cafetera (accessed on 1 December 2023).
- Asociación Interamericana de Ingeniería Sanitaria y Ambiental. Gestión Integral de Residuos Sólidos Urbanos; Asociación Interamericana de Ingeniería Sanitaria y Ambiental: São Paulo, Brazil, 2018. [Google Scholar]
- Gallego, D.; Montoya, J.; Valverde, J. Funcionamiento hidráulico de un filtro anaerobio de flujo ascendente. Ing. Química 2007, 450, 172–183. [Google Scholar]
- Gomez, L.M. Manual de Lombricultura. 2008. Available online: https://www.yumpu.com/es/document/read/14512054/manual-de-lombricultura-cecytech (accessed on 21 December 2023).
- De Bomfim, A.S.C.; de Oliveira, D.M.; Walling, E.; Babin, A.; Hersant, G.; Vaneeckhaute, C.; Dumont, M.-J.; Rodrigue, D. Spent Coffee Grounds Characterization and Reuse in Composting and Soil Amendment. Waste 2022, 1, 2–20. [Google Scholar] [CrossRef]
- Vijayalaxmi, S.; Jayalakshmi, S.K.; Sreeramulu, K. Polyphenols from different agricultural residues: Extraction, identification and their antioxidant properties. J. Food Sci. Technol. 2015, 52, 2761–2769. [Google Scholar] [CrossRef]
- Solomakou, N.; Tsafrakidou, P.; Goula, A.M. Valorization of SCG through Extraction of Phenolic Compounds and Synthesis of New Biosorbent. Sustainability 2022, 14, 9358. [Google Scholar] [CrossRef]
- Silva, N.C.S.; da Fonseca, Y.A.; de Camargos, A.B.; Lima, A.L.D.; Ribeiro, M.C.; Gurgel, L.V.A.; Baêta, B.E.L. Pretreatment and enzymatic hydrolysis of coffee husk for the production of potentially fermentable sugars. J. Chem. Technol. Biotechnol. 2022, 97, 676–688. [Google Scholar] [CrossRef]
- Kemp, K.C.; Baek, S.B.; Lee, W.-G.; Meyyappan, M.; Kim, K.S. Activated carbon derived from waste coffee grounds for stable methane storage. Nanotechnology 2015, 26, 385602. [Google Scholar] [CrossRef] [PubMed]
- Kim, D.; Lee, K.; Bae, D.; Park, K.Y. Characterizations of biochar from hydrothermal carbonization of exhausted coffee residue. J. Mater. Cycles Waste Manag. 2017, 19, 1036–1043. [Google Scholar] [CrossRef]
- Xiao, L.-P.; Shi, Z.-J.; Xu, F.; Sun, R.-C. Hydrothermal carbonization of lignocellulosic biomass. Bioresour. Technol. 2012, 118, 619–623. [Google Scholar] [CrossRef] [PubMed]
- Plaza, M.; Turner, C. Pressurized hot water extraction of bioactives. TrAC Trends Anal. Chem. 2015, 71, 39–54. [Google Scholar] [CrossRef]
- Çam, M.; Yüksel, E.; Alaşalvar, H.; Başyiğit, B.; Şen, H.; Yılmaztekin, M.; Ahhmed, A.; Sağdıç, O. Simultaneous extraction of phenolics and essential oil from peppermint by pressurized hot water extraction. J. Food Sci. Technol. 2019, 56, 200–207. [Google Scholar] [CrossRef]
- Massaya, J.; Pickens, G.; Mills-Lamptey, B.; Chuck, C.J. Enhanced Hydrothermal Carbonization of Spent Coffee Grounds for the Efficient Production of Solid Fuel with Lower Nitrogen Content. Energy Fuels 2021, 35, 9462–9473. [Google Scholar] [CrossRef]
- Kumar, N.; Weldon, R.; Lynam, J.G. Hydrothermal carbonization of coffee silverskins. Biocatal. Agric. Biotechnol. 2021, 36, 102145. [Google Scholar] [CrossRef]
- Mariotti-Celis, M.; Martínez-Cifuentes, M.; Huamán-Castilla, N.; Vargas-González, M.; Pedreschi, F.; Pérez-Correa, J. The Antioxidant and Safety Properties of Spent Coffee Ground Extracts Impacted by the Combined Hot Pressurized Liquid Extraction–Resin Purification Process. Molecules 2017, 23, 21. [Google Scholar] [CrossRef]
- Xu, J.L.; Kim, T.J.; Kim, J.-K.; Choi, Y. Simultaneous roasting and extraction of green coffee beans by pressurized liquid extraction. Food Chem. 2019, 281, 261–268. [Google Scholar] [CrossRef]
- Murthy, P.S.; Naidu, M.M. Sustainable management of coffee industry by-products and value addition—A review. Resour. Conserv. Recycl. 2012, 66, 45–58. [Google Scholar] [CrossRef]
- NREL/TP-510-42621; Determination of Total Solids in Biomass and Total Dissolved Solids in Liquid Process Samples. NREL: Golden, CO, USA, 2008.
- NREL/TP-510-42622; Determination of Ash in Biomass. NREL: Golden, CO, USA, 2005.
- ISO 18123:2015; Solid Biofuels—Determination of the Content of Volatile Matter. ISO: Santry, Dublin, 2015.
- ASTM D 3172-89; Standard Practice for Proximate Analysis of Coal and Coke. ASTM: West Conshohocken, PA, USA, 2002.
- Phuong, D.V.; Quoc, L.P.T.; Van Tan, P.; Duy, L.N.D. Production of bioethanol from Robusta coffee pulp (Coffea robusta L.) in Vietnam. Foods Raw Mater. 2019, 7, 10–17. [Google Scholar] [CrossRef]
- Manrique, R.; Vásquez, D.; Ceballos, C.; Chejne, F.; Amell, A. Evaluation of the Energy Density for Burning Disaggregated and Pelletized Coffee Husks. ACS Omega 2019, 4, 2957–2963. [Google Scholar] [CrossRef] [PubMed]
- Park, J.E.; Lee, G.B.; Jeong, C.J.; Kim, H.; Kim, C.G. Determination of Relationship between Higher Heating Value and Atomic Ratio of Hydrogen to Carbon in Spent Coffee Grounds by Hydrothermal Carbonization. Energies 2021, 14, 6551. [Google Scholar] [CrossRef]
- Poudel, J.; Karki, S.; Oh, S. Valorization of Waste Wood as a Solid Fuel by Torrefaction. Energies 2018, 11, 1641. [Google Scholar] [CrossRef]
- Frómeta, R.A.R.; Sánchez, J.L.; García, J.M.R. Evaluation of coffee pulp as substrate for polygalacturonase production in solid state fermentation. Emir. J. Food Agric. 2020, 32, 117–124. [Google Scholar] [CrossRef]
- Colantoni, A.; Paris, E.; Bianchini, L.; Ferri, S.; Marcantonio, V.; Carnevale, M.; Palma, A.; Civitarese, V.; Gallucci, F. Spent coffee ground characterization, pelletization test and emissions assessment in the combustion process. Sci. Rep. 2021, 11, 5119. [Google Scholar] [CrossRef]
- Gouvea, B.M.; Torres, C.; Franca, A.S.; Oliveira, L.S.; Oliveira, E.S. Feasibility of ethanol production from coffee husks. Biotechnol. Lett. 2009, 31, 1315–1319. [Google Scholar] [CrossRef]
- Yang, W.; Li, X.; Liu, S.; Feng, L. Direct hydrothermal liquefaction of undried macroalgae Enteromorpha prolifera using acid catalysts. Energy Convers. Manag. 2014, 87, 938–945. [Google Scholar] [CrossRef]
- Yin, S.; Tan, Z. Hydrothermal liquefaction of cellulose to bio-oil under acidic, neutral and alkaline conditions. Appl. Energy 2012, 92, 234–239. [Google Scholar] [CrossRef]
- Liu, S.; Wang, K.; Yu, H.; Li, B.; Yu, S. Catalytic preparation of levulinic acid from cellobiose via Brønsted-Lewis acidic ionic liquids functional catalysts. Sci. Rep. 2019, 9, 1810. [Google Scholar] [CrossRef] [PubMed]
Disclaimer/Publisher’s Note: The statements, opinions and data contained in all publications are solely those of the individual author(s) and contributor(s) and not of MDPI and/or the editor(s). MDPI and/or the editor(s) disclaim responsibility for any injury to people or property resulting from any ideas, methods, instructions or products referred to in the content. |
© 2024 by the authors. Licensee MDPI, Basel, Switzerland. This article is an open access article distributed under the terms and conditions of the Creative Commons Attribution (CC BY) license (https://creativecommons.org/licenses/by/4.0/).