Article

The Effects of Urbanization on Urban Land Green Use Efficiency of Yangtze River Delta Urban Agglomeration: Mechanism from the Technological Innovation

1
Department of Sociology, Hohai University, Nanjing 211100, China
2
Department of Land Resource Management, Hainan University, Haikou 570228, China
3
Institute of Population Research, Nanjing University of Posts and Telecommunications, Nanjing 210023, China
*
Author to whom correspondence should be addressed.
Sustainability 2024, 16(7), 2812; https://doi.org/10.3390/su16072812
Submission received: 22 February 2024 / Revised: 20 March 2024 / Accepted: 25 March 2024 / Published: 28 March 2024

Abstract

:
It is urgent and essential to explore the facilitating mechanism of urban land green use efficiency (ULGUE) in promoting the coordinated development of humans and land. In this study, the SBM-DEA model was used to measure ULGUE from 26 cities across the Yangtze River Delta Urban Agglomeration (YRDUA) in China from 2006 to 2019. Desired (eco-friendly) outputs and undesired (non-eco-friendly) green outputs were considered in the selection of ULGUE indicators. This study explored the impact of the mechanism of green, digital, and transportation technological innovation on ULGUE in the process of urbanization by the mediation model. The results showed that urbanization has a positive effect on ULGUE and technological innovation, and for every 1% increase in urbanization, ULGUE increases by 0.048%. The results are still significant after robustness tests. The findings suggest that the improvement of social and economic benefits brought by urbanization in the YRDUA is greater than its negative impact. A mechanistic analysis showed that green, digital, and transportation technological innovation can amplify the positive impact by curbing the growth of energy consumption and alleviating pollution. Therefore, the government should promote ULGUE with technological innovation, construct an ULGUE assessment mechanism, incorporate the promotion of green land use into the planning of targets and incentives for technological innovation, and promote the efficient use of land.

1. Introduction

In a given country, urbanization is a necessary step towards modernization and industrialization. In the process of urbanization, the degree of integration between human beings and the natural environment gradually deepens, while the complexity of the relationship increases due to the uncertainty of human activities. Urbanization is not only a process of rural to urban agglomeration, but it is also accompanied by a series of economic, social, cultural, and land resource transformations. Globally, continued urbanization has led to a surge in urban land area. According to the United Nations, the share of the global urban population is projected to rise 68 percent by 2050, up from 56 percent in 2021, with 2.2 billion new urban dwellers, mainly in Africa and Asia [1]. To accommodate the expected increase in the urban population, developing countries need to expand urban land space by more than 300 percent by 2050 [2]. Since 2004, China’s urbanization process has progressed faster than economic growth, China’s traditional expansionary land urbanization has led to environmental stresses such as inefficient land use [3], and urbanization, economic, and social development are seriously out of sync. In order to relieve the environmental pressure of the process of urbanization, the National New Urbanization Plan (2014–2020) issued by China in 2014 changed the previous land-centered urbanization [4] and proposed the development of a new type of high-quality, people-centered urbanization. Data from China’s National Bureau of Statistics (NBS) show that the urbanization rate of China’s population rose from 56.10% to 63.89% from 2016 to 2020, with an average annual growth rate of 3.18%; the area of built-up land use increased from 40,058.0 km2 to 60,312.5 km2, with an average annual growth rate of 2.96%. China’s urbanization has begun to transform. The rate of urban expansion basically matches the rate of urban population growth, which improves upon the country’s previous unreasonable state of urbanization, in which the rate of urban spatial expansion was significantly higher than the rate of urban population growth [5]. After the 18th National Congress of the Communist Party of China, the government has used concepts of green use and sustainable development to guide the relationship between humans and land and promote green development of regions and urban agglomerations [6]. Since then, China has incorporated green use efficiency into development goals on the basis of the economic efficiency of land use. Some scholars have studied the performance characteristics and influence of green development on land use [7], and urban land green use efficiency (ULGUE) has gradually become a new breakthrough point for land-use research.
As green development and related theoretical analysis have gradually matured, studies on ULGUE have gradually shifted toward empirical research measuring ULGUE and analyzing its spatiotemporal characteristics and driving factors, according to the concept of sustainable land use. In terms of choosing the measurement and empirical research methods for analyzing the spatial of ULGUE, existing studies have generally adopted classical models such as DEA, the spatial Durbin model, and the STIRPAT model [8,9]. In addition to this, the non-radial directional distance function approach has been used to measure the green utilization efficiency of agricultural land [10]. Compared to single-factor measures, DEA is more capable of holistically reflecting the land-use system and is the dominant measurement method for ULGUE. Regarding the choice of methodology for validating ULGUE drivers, Tobit modeling is used to examine the driving mechanisms of urban land use [11], and the mediation model is used to analyze the facilitating and influencing processes of ULGUE [12]. In contrast, on the basis of causal linkages, the mediation model facilitates the understanding of the process of specific facilitators.
Using the above research methodology, some scholars have analyzed the spatial and temporal characteristics and drivers of ULGUE in China both at the national level and in different urban agglomerations. In terms of the temporal dimension, ULGUE values first decline and then increase with time [13], which is consistent with China’s development path of polluting first and governing later. Spatially, ULGUE values show a gradual decrease from the eastern coast to the western mainland [14], which is a comprehensive reflection of the gap between the East and the West in terms of industrial structure, level of economic development, level of urbanization, and government investment. On the basis of spatiotemporal characteristics, researchers have examined the influence of industrial agglomeration patterns and spatial spillovers on ULGUE [15]. Some studies have analyzed the negative correlation between the level of industrial development and ULGUE as well as the significant positive impact of technological innovation [9]. In terms of spatiotemporal characteristics and spatial spillover analysis, while previous studies been thorough, research on facilitating factors is yet to be refined.
To summarize the above studies, technological innovation is becoming a new focus in ULGUE research. The level of technological innovation influences the breadth and depth of land use and is an important driver of changes in land resource utilization efficiency. Numerous studies have shown that technological innovation can alleviate but not completely compensate for the environmental pressure of urbanization [16]. Moreover, the role of technological innovation is heterogeneous across regions [17], and the inhibiting effect of technological innovation on environmental pollution is more obvious when the economy maintains a higher level of growth [18]. However, the process mechanism of technological innovation in the impact of urbanization on land use has not been fully elucidated. Until now, there has been no study on technological innovation as a mediating factor in the impact of urbanization on ULGUE.
This study measures the ULGUE of 26 cities in the China’s Yangtze River Delta Urban Agglomeration (YRDUA) from 2006 to 2019 and aims to analyze the mediating role and impact mechanisms of three types of technological innovation. The contributions of this study are as follows: (1) a systematic review of the mechanism of urbanization’s impact on ULGUE; (2) a measurement of ULGUE’s green desired and undesired outputs to gain a deeper understanding of ULGUE, and (3) an elucidation of the roles of different technological innovations on ULGUE, including an in-depth elaboration of the mediating roles of green, digital, and transportation technological innovations. This study is organized as follows: Section 2 is a review of the literature on ULGUE, the impact of urbanization on ULGUE, mechanisms of technological innovation, and research framework; Section 3 presents the research methodology; Section 4 gives the empirical results; Section 5 discusses the mechanism of action of the three types of technological innovations to improve the impact of urbanization on ULGUE based on evidence from YRDUA, the relationship between ULGUE and demographic urbanization, and application and expansion of the technological innovations; and Section 6 provides conclusions and recommendations.

2. Literature Review

2.1. ULGUE

Although the focus of studies on ULGUE has now shifted from theoretical interpretation to empirical analysis, it is still necessary to investigate its nuances. ULGUE originated from green development [12], which coincides with the concept of sustainable development and green use proposed by the Chinese government. Existing research suggests that the core of urban land green use consists of emphasizing the region’s access to higher economic and social development while promoting conservation and use intensification [19], reducing energy loss [20], conserving land and resources and reducing negative environmental impacts [21], and producing less pollutant emissions [22]. ULGUE has been widely used to analyze the relationship between government planning, industrial agglomeration, urbanization strategies, land-use patterns, and spatial effects. ULGUE includes resources consumed through green or non-eco-friendly pathways as well as desired and undesired urban land-use outputs [23]. While requiring beneficial economic and social outputs, ULGUE focuses on the green benefits of land-use outputs, i.e., environmental protection during land use.
Past studies have considered these green factors, and most of them have considered undesired outputs, but few have considered green desired outputs. On the basis of these outputs, this study incorporates ecological factors into the desired outputs, thus contributing to the understanding of ULGUE. In summary, this study considers ULGUE for its social, economic, and ecological output capacity and levels of urban land use under the double constraints of energy input factors and environmental pollution.

2.2. Impact of Urbanization on ULGUE

Human economic and social activities affect land use, e.g., production, recreation, and consumption, and are direct determinants of land-use patterns [22]. The impact of urbanization on land use has been discussed and consists of the following three main aspects.
First, from the perspective of socio-economic activities, urbanization drives economic and social development while inevitably having a negative impact on ULGUE. Spatial economic activities driven by urbanization are the key factor in the rapid changes in land use [24]. Urbanization puts great pressure on land use and the protection of environmental resources such as water [25] and air quality [26]. The challenge facing land use is to address the relationship between meeting human needs and maintaining the long-term capacity of the biosphere to provide goods and services [27]. Large areas of green land, including parks, green buffers, square spaces, and attached green space, are being transformed into urban and industrial areas to cater to economic growth, housing, and production [28], which decreases green outputs and creates significant undesired outputs. The spatial interaction between economies that is brought about by urbanization has benefited from the development of transport infrastructure. However, urbanization increases the number of vehicle kilometers travelled [29], which leads to increased negative externalities, including air pollution [30].
Second, from the perspective of population migration, urban population growth increases the inputs as well as the desired and undesired outputs of ULGUE. On the one hand, urbanization brings a large labor force, which together with industrialization, urbanization, and economic reform measures affects ULGUE as a factor of production [31]. The demand for various types of products and services generated by urban population agglomeration due to survival and development needs is transformed into a demand for different types of land within the urban area. This triggers the rapid accumulation of demands for land resource utilization. On the other hand, population migration from the urban fringes to cities leads to the abandonment of cultivated land in the area, which poses a greater threat to food security. A large influx of people into urban areas creates challenges for the urban living and productive land use, which negatively impacts the environment and increases undesired outputs. More seriously, in large cities, large public facilities for supplying energy and handling waste are often crowded out by residential areas, which include a wide variety of facilities, such as power plants, industrial parks, highways, and waste incinerators, which are identified as NIMBY (not in my back yard) facilities or LULU (locally unwanted land use) facilities; LULU facilities involve secondary air, water, soil, and noise pollution, which have a negative impact on the regional ULGUE.
Third, different modes of urbanization affect ULGUE in different ways. Urban sprawl leads to negative externalities such as high energy consumption [32], which reduces land-use efficiency [33,34]. Since the end of the 20th century, increasing land intensification activities have become an important factor affecting sustainable global growth. The process of urbanization in China is generally accompanied by a lack of development awareness of resource saving [35], which has resulted in the expansion of built-up areas and transport infrastructure areas and the reduction in the marginal efficiency of land use. Urban compactness is a response to control urban sprawl, but it also leads to urban problems such as traffic congestion, increased cost of living [5], and the undesired outputs of ULGUE. It has been shown that the ecological efficacy of urbanization in terms of pollution reduction and resource intensification can be better exploited through regulation and intervention by government departments [36]. As present, over-exploitation and the uncontrolled utilization of land resources in China have posed great challenges to regional sustainable development.
Taken together, there is growing evidence that urbanization has an amplifying or accelerating effect on ULGUE. Urbanization raises inputs and desired outputs while generating undesired outputs, with complex and intertwined positive and negative paths of influence on ULGUE.

2.3. Mechanisms for the Impact of Technological Innovation

Existing studies have found that technological innovations can amplify the positive effects of urbanization on land use, the mechanisms of which have been tentatively elucidated. Classical IPAT theory identifies population size, affluence, and technology as key forces shaping land use, especially technological innovation, which can trigger rapid land-use change [37]. There is a tendency for urban centers to gather and form urban clusters [38]. Influenced by the learning, matching, and sharing mechanism of the agglomeration economy [39], urbanization is conducive to exchange among technicians, which helps the spilling over, diffusion, and incubation of knowledge and technology and prompts the continuous improvement of regional technological innovation in the virtuous circle of “innovation–spillover, diffusion-re–innovation”. The agglomeration economy brings technological innovation and externalities, and in turn, technological innovation promotes economic transformation, further amplifying the role of the population as a factor of production to promote economic growth and thus enhancing ULGUE. The inflow of different types of talents and emerging technologies improve the existing industrial structure, and the technologies have a positive effect on urban land use [40] and help to reduce environmental degradation [41], while technological externalities affect land intensification [42].
However, not all types of technological innovation have a facilitating effect; some have the potential to reduce ULGUE. It has been pointed out that technological innovation has a “rebound effect” [16]; i.e., technological innovation reduces the cost of production, which lowers the price of and expands the demand for products, leading producers to generate large quantities of products, which ultimately increases both energy consumption and carbon emissions. It has been pointed out that technological innovation increases pollution when the economic level is low [43]. Therefore, technological innovation has a facilitating or inhibiting effect on the efficiency of the green economy, and the ultimate impact of technological innovation on ULGUE is uncertain; its performance depends on the allocation of the elements of science and technology innovation and the specific type of innovation [44]. Therefore, specific types of technological innovations need to be further discussed. Combining existing studies on the impact of urbanization on ULGUE and urban land-use practices in China, this study argues that green, digital, and transportation technological innovations strengthen the contribution of urbanization to ULGUE.
First, advances in green technologies increase the efficiency of land use. Green technological innovation includes both energy-saving technological innovation and technological progress in emission reduction [45]. Energy-saving technological innovation is able to reduce energy loss in production, improve urban economic efficiency [46], and reduce the cost of reducing pollution [47]. Emission reduction technology can improve clean energy and reduce pollution emissions in production, which is a key approach to alleviate the pressure on the living condition, production, and environment brought about by population urbanization and to solve the contradiction between production and pollution [48].
Secondly, digital technological innovation is thought to provide agglomeration power, sustainable food production, access to clean and safe drinking water, and green energy production and use [49]. Increasing the proportion of non-fossil energy use and optimizing industrial structures are the two mechanisms by which digital technological innovation contributes to green use [50]. More importantly, digital technological innovation has produced subversive changes in geography, boundaries, space, and time [51], which breaks down administrative boundaries, shortens spatial distances, and promotes the integration of peripheral areas into the inner-core region [5], thus enhancing the overall efficiency of urban land use.
Thirdly, the interaction between land use, transportation, and the environment has been well researched [52]. Longer travelling distances due to urban sprawl as well as urban congestion prolongs vehicle driving and idling times, leading to air pollution from inadequate fuel combustion [53]. Traffic noise and the occupation of vehicle infrastructures such as car parks and roads are detrimental to sustainable and green urban development. Technological innovations in transportation reduce urban carbon emissions through improved accessibility and energy efficiency [54]. The electrification of transportation will improve air quality in the streets [55] and alleviate the congestion pressure on the roads, achieving both economic and environmental benefits [56] and thus reducing the negative impacts of urbanization on the environment [57]. Further, transportation technological innovation has a positive impact on land-use efficiency in opening up new urban spaces for efficient use, changing the urban pattern, reallocating resources, and reducing the need for new urban land by maintaining the marginal benefits of land use while urbanizing [58].
In theory, green, digital and transportation technological innovations contribute to resource conservation and utilization, emission reduction, regional management, transportation, and agricultural production and thus increase ULGUE; however, in specific regions, these effects still require empirical evidence. Based on the above analysis, this paper puts forward the following research hypotheses for empirical testing:
Hypothesis 1.
Urbanization can promote significant improvements in ULGUE.
Hypothesis 2.
Green technology innovation, digital technology innovation, and transportation technological innovations can amplify the positive impact of urbanization on ULGUE.

2.4. Research Framework

This article presents the research ideas from four aspects. Firstly, the concept, origin, meaning, and application of ULGUE and impacts from urbanization and technological innovation are reviewed. Secondly, the SBM-DEA model, referred to in the existing research, is used to measure ULGUE in YRDUA by the official statistical data from 2006 to 2019. Thirdly, considering the mathematical test method and mechanism explanation of mediation model, this paper analyzes the results of urbanization in ULGUE and the meditating mechanism of technological innovation. Finally, the particularity of the study area is discussed, and policy implications are given on the basis of summary. The research framework is shown in Figure 1.

3. Study Area, Data and Methodology
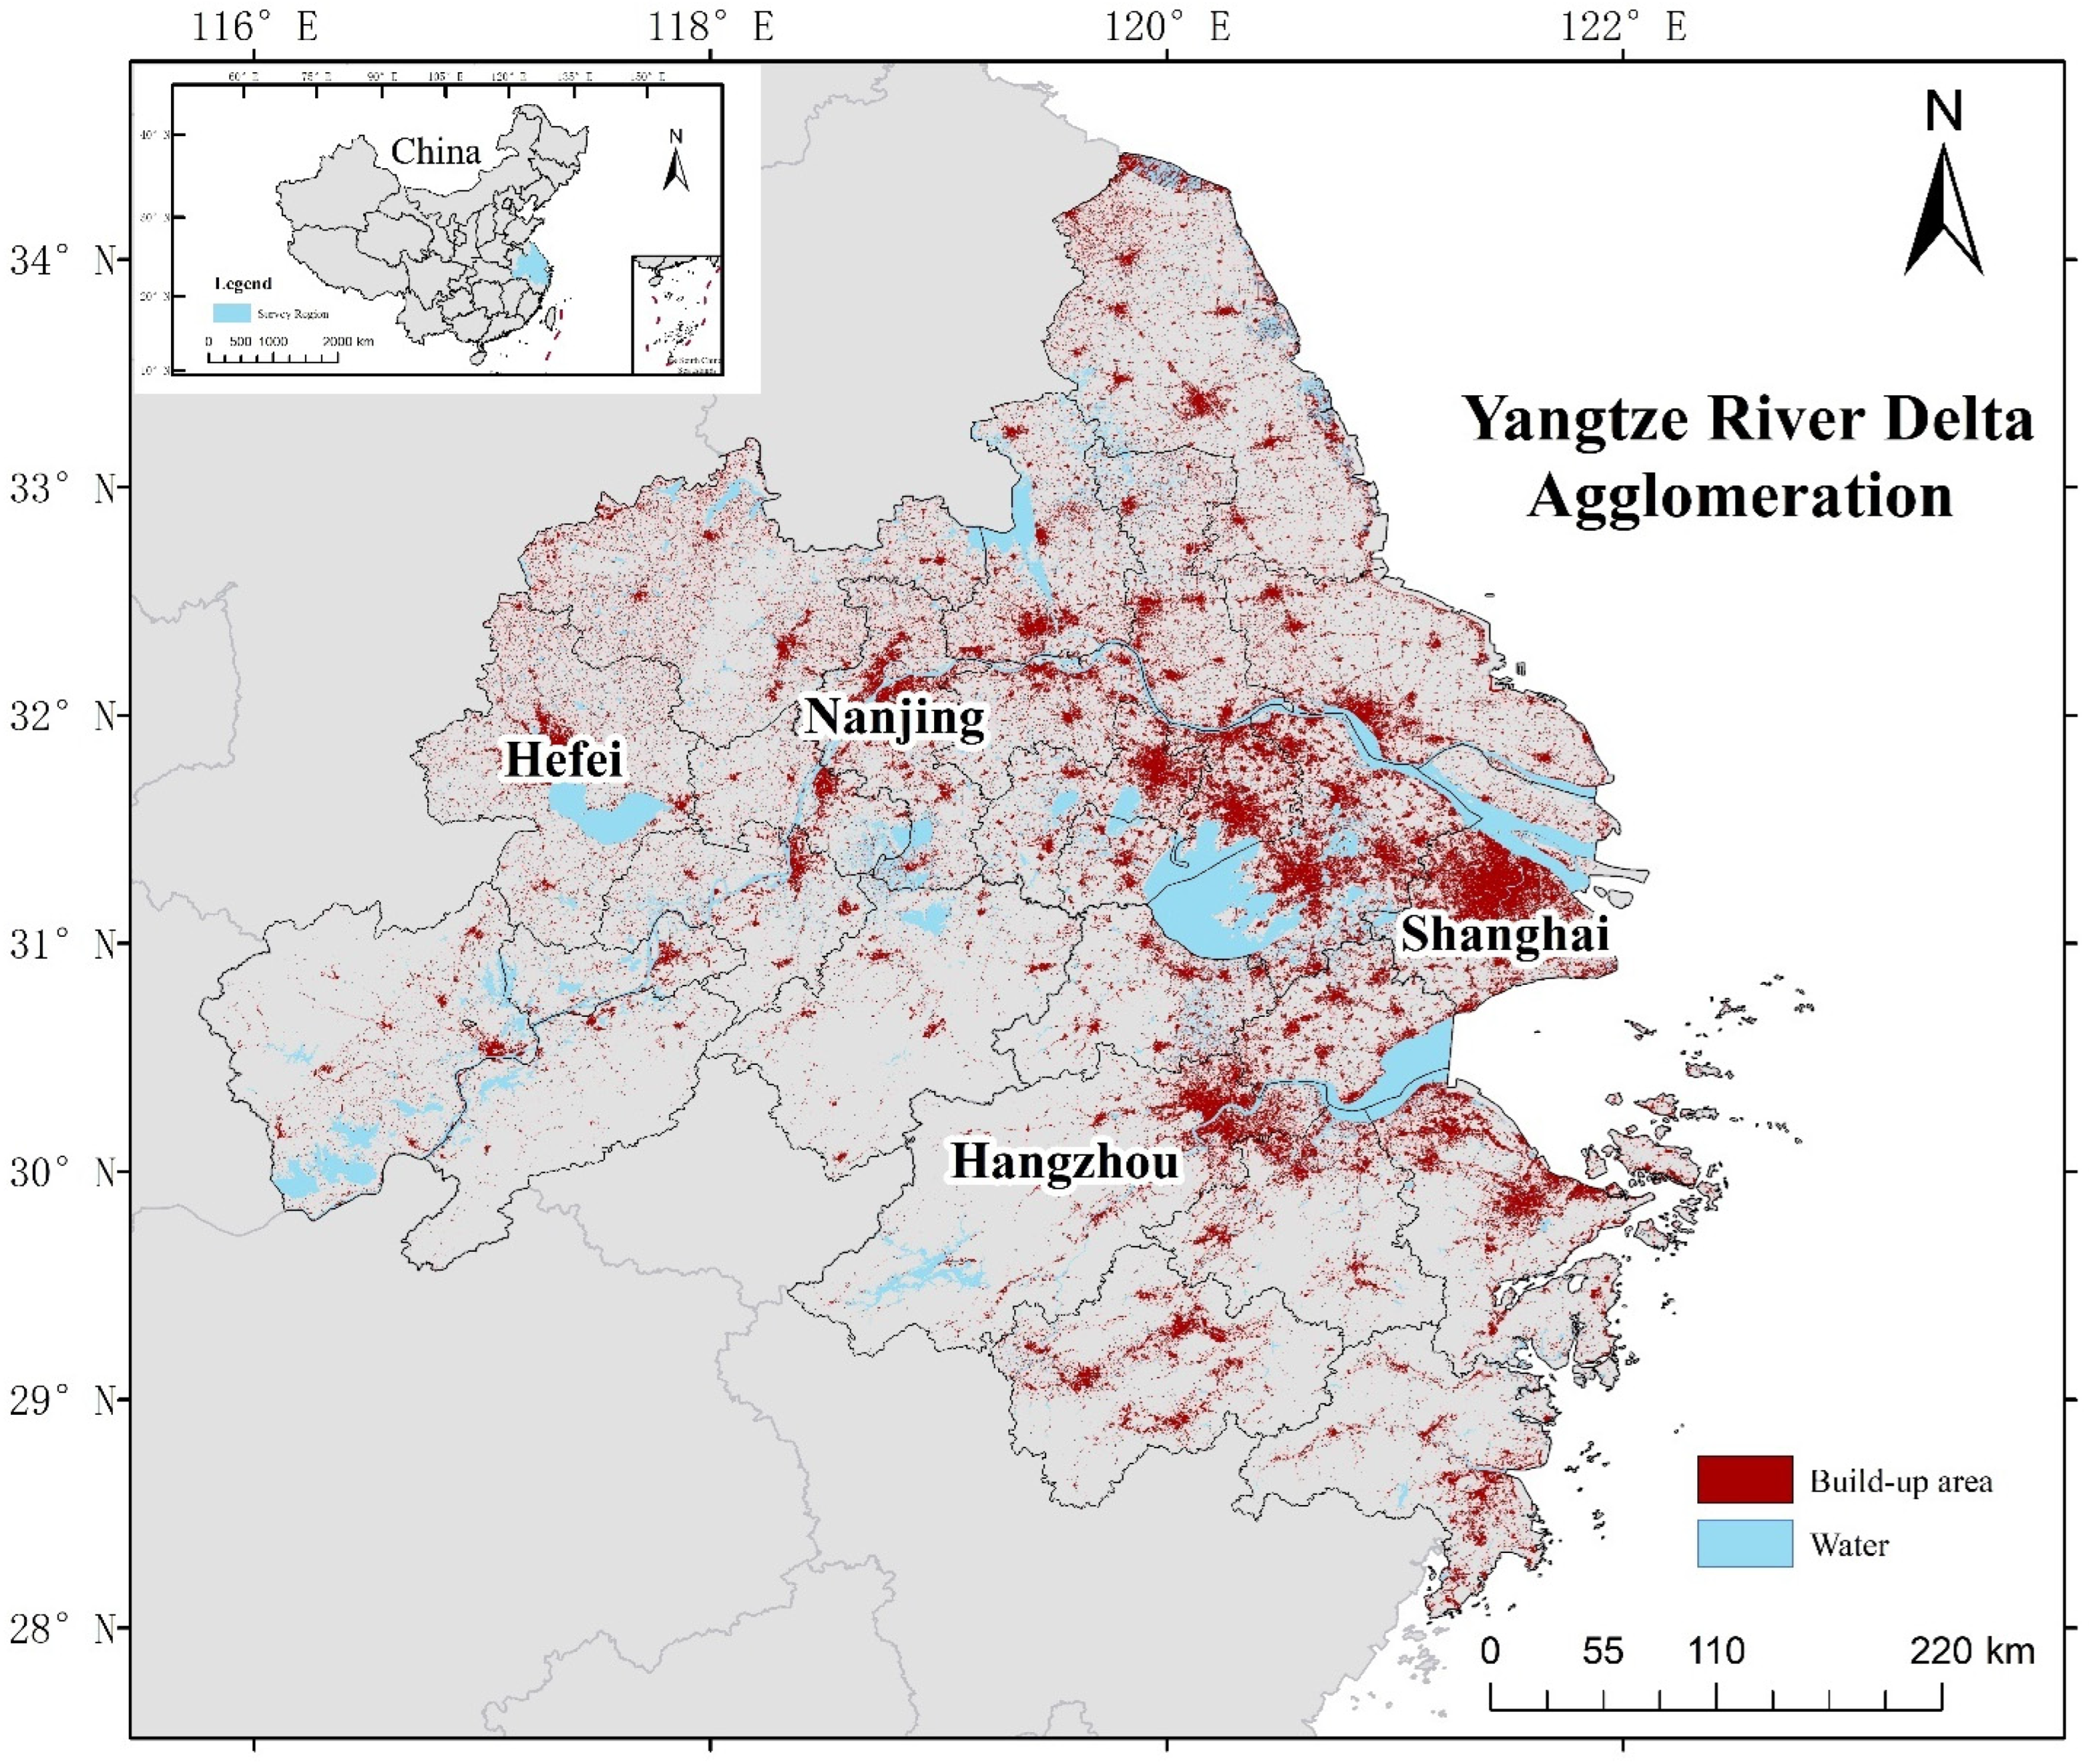
3.1. Study Area

YRDUA, located on the eastern coast of China, is a densely populated and developed region of China (Figure 2). It includes the city of Shanghai, south-central Jiangsu Province, northern Zhejiang Province, and south-central Anhui Province, with 26 cities at the prefecture level and above (Table 1). According to NBS, the population of YRDUA was 132.6 million in 2019, accounting for 9.47% of the country. The GDP accounted for 19.92% of the country’s wealth. YRDUA is one of the fastest-growing regions in terms of urbanization and industrialization, and one of the largest urban agglomerations in the world [59]. It is also a leading region in technology and innovation, with one of the largest numbers of universities, a highly educated population, and a dense concentration of tech companies, e.g., Huawei, Ali, and NetEase. The tension between massive land demand and limited land resources will become more acute, and the uncertain impacts of the urbanization of the population and technological innovation may become more complex in the future. Though this research focuses on YRDUA, it has more general theoretical significance and policy implications.

3.2. Data Source

The data were mainly obtained from the China Urban Statistical Yearbook (2007–2020), including GDP, resident population, public finance expenditure, population density, urban built-up land area, population employed in secondary and tertiary industries, capital investment, value added from secondary and tertiary industries, average wage of employees, urban green coverage rate, wastewater, industrial SO2, industrial fume and dust emissions, share of computer staff, and trams. In addition to the above, exchange rate data were obtained from the China Trade and Foreign Economic Statistics Yearbook (2007–2020), data on the share of green patent applications were taken from Chinese Research Data Services (CNRDS) Platform (https://www.cnrds.com (accessed on 23 July 2023)), and data on the population of households, road area, and consumer price index were obtained from the Jiangsu Statistical Yearbook (2007–2020), Zhejiang Statistical Yearbook (2007–2020), Anhui Statistical Yearbook (2007–2020), and Statistical Yearbook (2007–2020) of YRDUA cities.

3.3. Measure Model for ULGUE

With the in-depth study of land-use efficiency measurement, scholars have found that a single-factor measurement of land-use efficiency presents difficulties in responding to the complex process of land use, and the input–output model can help to analyze the economic and social inputs and desired outputs in the process of land use [10]. The DEA model has been widely used in studies of the environment and land use because of its advantages in dealing with multilevel inputs and outputs. Current studies have found that traditional DEA models commonly used in measuring land-use efficiency are radial or angular, ignoring the undesired outputs [60]. The SBM model, as a supplement of DEA, provides an accurate measure of the efficiency value under undesirable output constraints [23]. Therefore, some scholars have proposed the SBM-DEA model to consider undesired outputs such as environmental pollution and as a way to explore the green use of urban land and sustainable development [61].
Regarding the environmental pollution indicators in land-use efficiency, existing studies have adopted domestic sewage, industrial emissions, and smoke and dust emissions [62]. The practice of including undesired outputs in the measurement of ULGUE is well established, but the desired output of ecological improvement from land use has not yet been considered.
In this study, the input–output method was used in the SBM-DEA model as referred to in the existing selected research indicators [5], in which the input variables are urban construction land area, the population employed in secondary and tertiary industries, and capital input (perpetual inventory method). The output variables are value added from secondary and tertiary industries (deflated using the GDP index), wage level (average wage of employees), and urban green coverage rate as an indicator of the desired output variable considering positive environmental impact. For undesired outputs, the study follows the commonly used negative environmental impacts examined in existing studies, and the indicators are wastewater, industrial SO2, and industrial fume and dust emissions, and the entropy method is used to synthesize the three to obtain a composite value. Selection of ULGUE indicators is shown as Table 2.

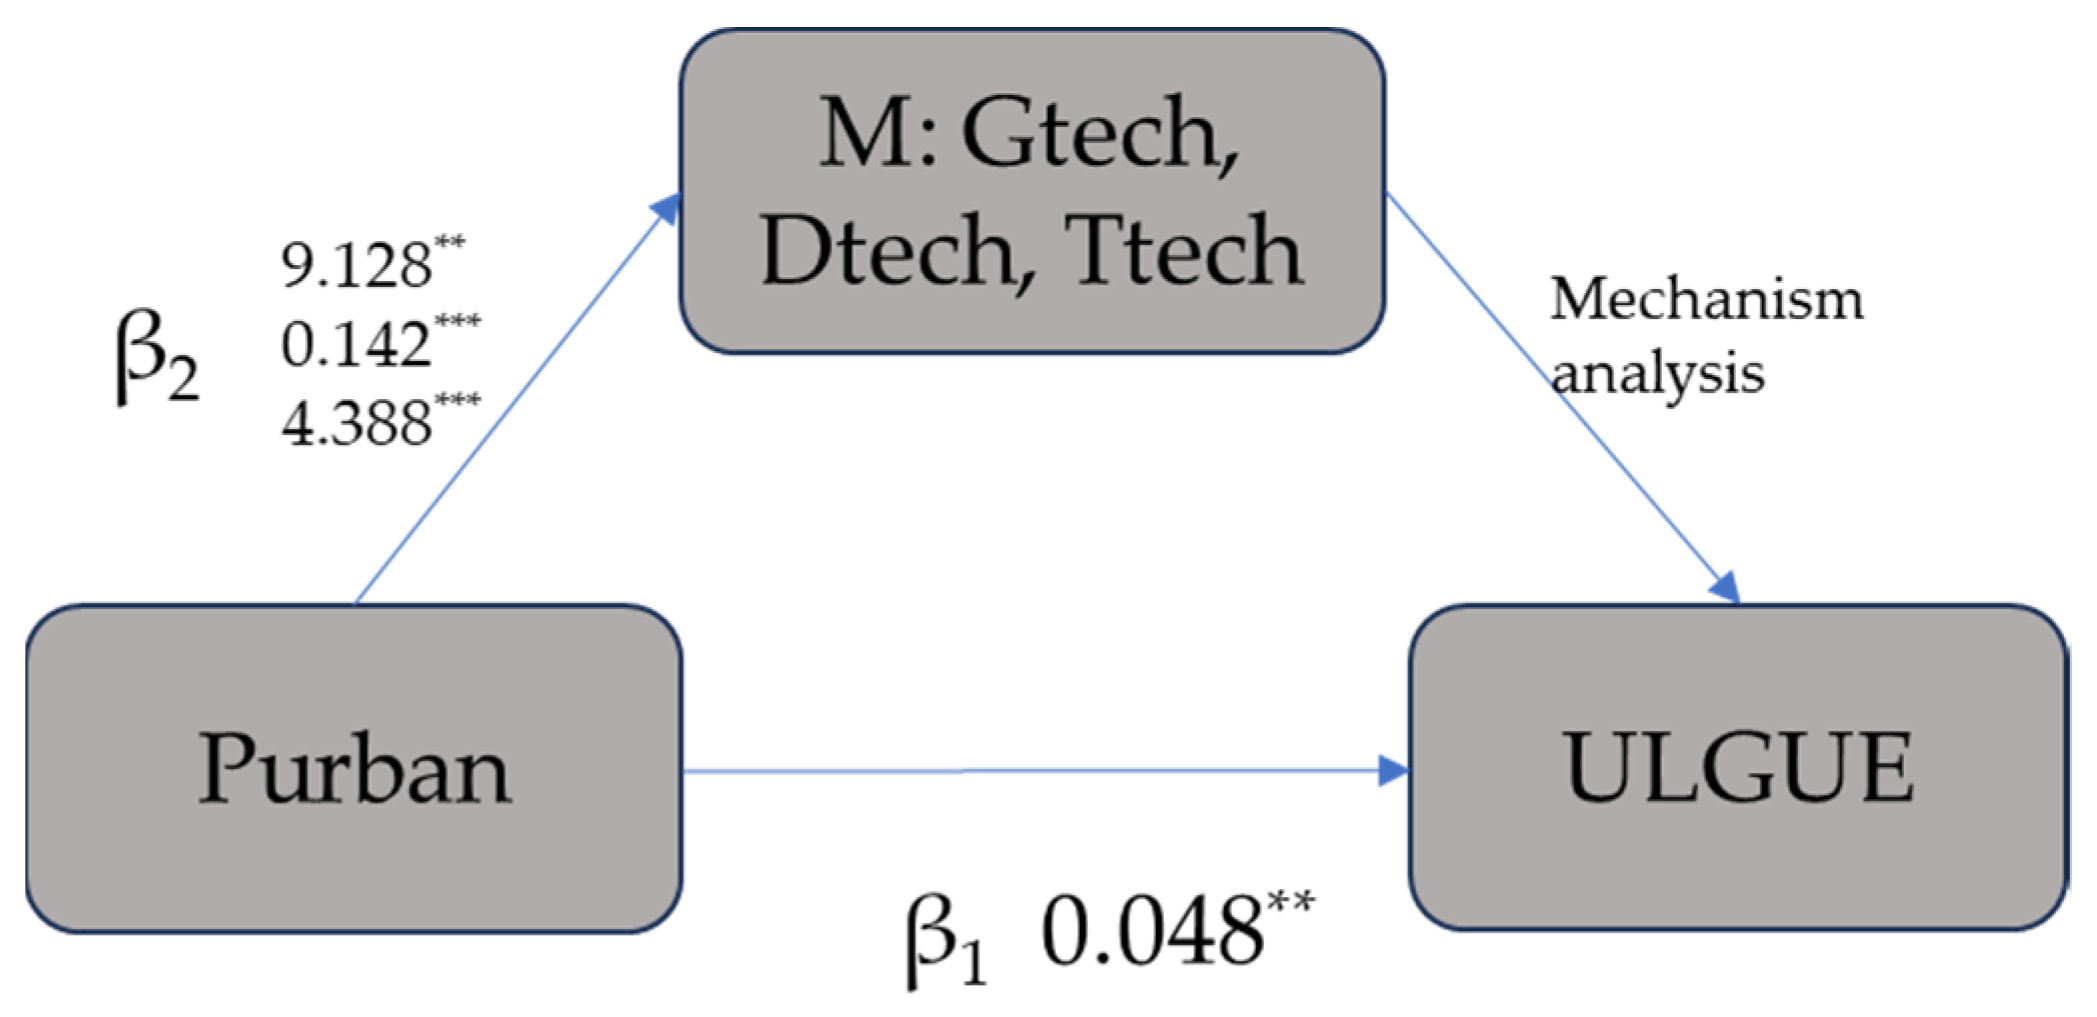
3.4. Mediation Model

As a form of causal analysis, mediation is the social structure that transmits the effect of one variable to another. Specifically, mediation analysis is performed by examining the independent explanatory variable X and the explained variable Y moderated by one or more mediating variables M. In any scientific study, the derivation of causal relationships in mediation models is based on theoretical analysis and evidence. In terms of concrete steps, given that it is sometimes not appropriate to test the effect of M-Y and that the appropriate approach is to report the mediating effect directly and provide a mechanistic explanation [63], this study therefore draws upon a common mathematical test method proposed by Baron and Kenny [64] and a mechanism analysis approach [65]. First (Equation (1)), this study tests the direct impact of urbanization on ULGUE; a potential mediating effect can only be indicated if β 1 is significant and is followed by the presence of a mediating effect. Second (Equation (2)), this study tests the impact of urbanization on each mediating variable ( M i j ), and if the β 2 is significant, this implies that there is an urbanization effect on the mediating variable of technological innovation. Third, there are theoretical analyses of the mechanistic effects of M on ULGUE. The typical mediation of Purban on ULGUE via M is illustrated in Figure 3, and the mediation model built in this paper is shown in the following equations:
U L G U E i j = α 1 + β 1 P u r b a n i j + γ 1 X i j + e 1
M i j = α 2 + β 2 P u r b a n i j + γ 2 X i j + e 2
where Purban is urbanization level, as a core explanatory variable using the urbanization rate of the resident population; M is a set of mediating variables: Gtech denotes green technological innovation using the share of green patent applications; Dtech is digital technological innovation using the share of computer employees; and Ttech is transport technological innovation using the number of trams per 1000 people. i and j denote cities and years.
X is a set of control variables, where (1) Density is the population density of the municipal district, which affects land use and expansion; (2) Fdi is the degree of openness using the ratio of the actual utilization of foreign business to the current year’s GDP; (3) Buarea is the city’s level of spatial agglomeration using the ratio of built-up area to the total area of the city; (4) Road is the level of road construction using the per capita area of the road; (5) Pubexp is the local government public service construction level using the ratio of public finance expenditure and GDP; and (6) Lansuse denotes land finance activities using the proportion of industrial land grant size, which has an important influence on industrial pollution such as industrial smoke and dust and a perceived positive impact on land-use efficiency and negative impact on ULGUE. It is often considered an important indicator for evaluating the efficiency of industrial land use [66]. All variables with nominal monetary values, such as Fdi and Pubexp, are converted to real values using the consumer price index (with 2006 as the base period) in order to exclude the effect of price factors. Table 3 presents a descriptive analysis. The number of observations as well as the mean, variance, maximum, and minimum values of the variables are included.

4. Results

4.1. Direct Impact of Urbanization on ULGUE

Table 4 presents the results of the three model regressions of urbanization on ULGUE. In the model regression results, the coefficients of Purban are positive at 0.045, 0.14, and 0.048, respectively, indicating that urbanization has a positive impact on ULGUE; and hypothesis 1 is thus tested. The Hausman specification test was not passed, supporting the original hypothesis with a random-effect model. The results of the random-effect model 3 show that the Purban coefficient passes 5% significance, and for every 1% population increase, ULGUE increases by 0.048% (Figure 3). Hypothesis 1 is thus proven. This relationship can be understood as an increase in the marginal desired outputs driven by an increase in the employed population and capital inputs brought about by urbanization; however, the accompanying expansion of land space brought about by urbanization, larger administrative areas, and longer job and residential distances leads to increased management costs and lower land-use efficiency, inhibiting the increase in desired output. At the same time, increased energy use for production, living, and traffic congestion enhance the undesired outputs such as waste gas and water emissions, further weakening the growth of land green efficiency and ultimately presenting a weak positive impact of urbanization on ULGUE.

4.2. Impact of Urbanization on Technological Innovation

Table 5 reports the estimation results based on Equation (2). In this study, population density, degree of openness, built-up area, level of road construction, public fiscal expenditure, and industrial land concessions were added as control variables in the regression. The results of the model regressions show that the regression coefficients of urbanization are all significantly positive, indicating that urbanization contributes significantly to technological innovation. All models were tested using the Hausman test, and the impact of urbanization on digital technology innovation supports the original hypothesis using a random-effect model, while the impact of urbanization on green technological innovation and transportation technological innovation rejects the original hypothesis and uses a fixed-effect model.
Models 5, 9, and 11 show that for every 1 percent increase in the size of population urbanization, the level of innovation increases by 9.128 percent in green technological innovation, by 4.388 percent in digital technological innovation, and by 0.142 percent in transportation technological innovation (Figure 3). Urbanization provides labor, infrastructure and market access for innovation [61] while sharing its costs and risks. The findings confirm that urbanization has a significant positive impact on green, digital, and transportation technological innovation, the types of technological innovation that are considered to contribute to ULGUE. Hypothesis 2 is thus proven.
In terms of control variables, the regression coefficient of Density is negative at the 1% significance level, which indicates that this is the level of human resources that really plays a role in innovation and that the labor force has a crowding-out effect on technological innovation. Too much congestion in the city has a negative impact on technology innovation. The coefficient of Fdi is significantly positive, which indicates that technological innovation in the YRDUA relies on the interaction with foreign enterprises. The regression coefficient of Buarea is positive at the 1% significance level, indicating that the urban spatial agglomeration effect has a positive impact on technological innovation.

4.3. Robustness Tests

The urbanization rate indicates the concentration of a city’s population. Given that the household urbanization rate is also an important measure of how well a local city attracts and retains its population, this paper replaces the resident urbanization rate indicator with the household urbanization rate, Hur, for estimation purposes. The estimation results reported in columns (1), (2), and (3) of Table 6 show that the household population urbanization rate significantly increases the ULGUE. More specifically, for every 1% increase in the urbanization rate of household population, the ULGUE increases by 0.146%. Meanwhile, considering the time lag of the urbanization scale affecting ULGUE, this paper changes the core explanatory variable to the lagged one-period resident urbanization rate (Lur) in columns (4), (5), and (6) of Table 6. The estimation results show that the lagged one-period resident urbanization rate has a significant positive effect on ULGUE. Specifically, for every 1% increase in the urbanization rate of the resident population in the lagged period, the ULGUE increases by 0.245%. The above results are consistent with the regression results in Table 3, indicating that the estimation results are robust.

4.4. Impact Mechanism of Technological Innovation

The three types of technology innovation amplify the positive impact of urbanization on ULGUE, and the facilitating mechanisms can be explained in two ways:
Restraining energy consumption. Urbanization produces economic and social benefits as well as huge energy consumption. General technological innovation magnifies two effects at the same time because of the “rebound effect”. Green technological innovation reduces energy consumption through energy saving. Digital technological innovation improves energy structure, increases energy utilization efficiency, and promotes public transport planning. Traffic facilities are the intermediary between productive and polluted land elements and cities. Transportation technological innovation represented by public transportation electrification can reduce the dependence and pollution of traffic facilities on fossil energy effectively. The comprehensive application of the innovations meets the energy demand in the process of urbanization, thus improving the energy structure of urbanization and avoiding the rebound effect to some extent;
Alleviating pollution. While the population size exceeds the land’s carrying capacity, the positive impact of population on ULGUE may be smaller than the negative impact of congestion and environmental degradation. Local governments tend to alleviate urban congestion by expanding the scale of urban areas and transferring highly polluting industries, which has not been effective for a long time. Green technological innovation reduces pollution through emission reduction and alleviates the negative impact of urbanization on the land’s carrying capacity and balance. Digital and transportation technological innovation enhances the agglomeration effect of elements and the diffusion of knowledge by improving the accessibility and liquidity among regions and shortening the spatial distance and gives full play to the spatial spillover of ULGUE.

5. Discussion

5.1. ULGUE in YRDUA

An examination of the effectiveness of YRDUA suggests that a certain level of economic development is the basis for promoting the mediating role of technological innovation. Theoretically, urbanization has an impact on technological innovation through agglomeration effects, but, in practice, this requires a certain regional economic level for sharing the costs of technological innovation research and application. The role of technological innovation is differentiated in different regions [17], and when the economy maintains a high level of growth, the inhibiting effect of technological innovation on environmental pollution is more obvious [18]. In this sense, China’s consistent development path of destroying first and governing later is justified. The economic ability to secure technological innovation is usually visualized in financial inputs; for example, Baoding City in central China had a large number of buses shut down for a period of time due to the lack of financial input to replace the battery packs of the new energy vehicles in a timely manner, which implies that the pathway of green and transportation technological innovations to promote land green use are hampered by the financial ability and the long-term planning ability of the city.
In contrast to this, YRDUA has the ability to promote green, digital, and transportation technological innovations such as the full adoption of new energy vehicles for YRDUA public transportation and the gradual replacement of these vehicles with greener hydrogen energy vehicles. New energy vehicles are considered to be the least environmentally polluting alternative to traditional fuel vehicles [67]. Vehicle electrification is a promising technology that helps to improve many environmental problems, including global climate change and oil demand as well as urban air quality and noise pollution [68]. YUDRA unifies inter-regional bus routes, which are interconnected with cities surrounding Shanghai, Hangzhou, and Nanjing, while bus connections and transfer routes have been optimized. These measures based on green, digital, and transportation technological innovations have increased the willingness of city dwellers to travel by public transport and increased the overall distance travelled. As a result, these technological innovations have enhanced the agglomeration effect of cities, while improving transportation accessibility, reducing spatial distances, and easing the pressure of land expansion and its negative impact on land use.

5.2. Relationship between ULGUE and Demographic Urbanization

An examination of the results shows that the logical relationships between the variables are in line with the research expectations and are basically consistent with the findings of existing studies. The degree of openness as indicated by Fdi is significantly positively correlated, which is in line with the findings of existing studies suggesting that the introduction of foreign investment and openness contribute to the realization of the ecological effects of urbanization [36]. However, unlike most of the existing literature, some studies have argued that population density can improve green land-use efficiency by increasing desired outputs such as economic development. The results show that population density has a significant negative effect on ULGUE, which is different from some studies that suggest that population density increases ULGUE through accelerating economic development [69]. This study argues that the rise in population density in urban areas brought about by urbanization increases energy consumption and household waste, which have a negative impact on land use. While an increase in population density promotes the intensive use of corresponding facilities, the actual effect of improving the environment is not satisfactory. For example, in the case of transport facilities, there is an inelasticity between population density and vehicle use [70]. An increase in population density leads to a decrease in the number of vehicles per capita but not a decrease in vehicle density; this ultimately also increases negative environmental impacts [71]. Particularly when the size of the city exceeds the carrying capacity of the land, increased population density has squeezed the green space per capita, and the negative impacts on urban problems such as congestion, environmental degradation, and longer commuting distances outweigh the positive impacts, which are ultimately detrimental to the promotion of ULGUE. Research on the analysis of the spatial effects of ULGUE suggests that positive effects exist, but negative impacts spill over into neighboring areas [8].
Considering the above views together, this study argues that the reason for this is that local governments tend to alleviate the urban pollution problem by transferring highly polluting industries and LULU facilities in order to increase the level of green land use in local urban areas, but this measure of transferring the problem has not been effective in the long run. Growth in population density and size requires more resources and diversion of pollution from surrounding cities [72]. LULU facilities, which are necessary supports for urban production and living, have been sidelined outside the urban core and forced to relocate, which has resulted in pollution data being recorded in the urban fringe or in surrounding cities. This local government practice shifts the negative impacts of increased population density, such as energy consumption and rubbish and waste emissions, to the urban periphery. While this appears to increase ULGUE in a smaller administrative units, the positive impacts are not significant at the urban agglomeration level.

5.3. Application and Expansion of the Technological Innovations

From the perspective of technological innovation, it is important to guard against cities relocating LULU facilities and polluting industries when pursuing technological innovation. While this creates the illusion of optimizing the regional industrial structure and greening land use, it in fact leads to greater inequalities in green use between regions. Technological innovation has been shown to play a moderating role in reducing the negative environmental impacts associated with natural resource depletion [73]. Exploiting the positive effects of technological innovation while circumventing its negative and unintended consequences will better leverage its mediating effect in the process of urbanization for ULGUE.
Urbanization requires the extended application and cross-fertilization of technologies. The foreseeable direction of synergistic development of urban and technological innovations is to prioritize the development of green technologies and to control the trend of environmental degradation. Green technologies need to be oriented towards innovation and application in urbanization through the use of digital technologies. Green space is a visual representation of the ecological output of a city, and a reduction in population density will not naturally lead to a return of green space [74]. This requires conscious re-planning based on population and land-use-change projections. Green and digital technologies can expand the spatial adaptability and multi-layered applications of green spaces. For example, the conversion of under-utilized facilities into green spaces enhances the adaptability and reuse of facilities [75]. At the same time, transportation and digital technologies are being used to more rationally deploy centralized treatment facilities to deal with decentralized sources of pollution generation.

6. Conclusions

Population and land use are two core topics in urban development. Land resources are the spatial carriers of urban socio-economic development, and urbanization is one of the main uses of land. Land-use change is the most direct manifestation of human activities affecting the environment. The higher the level of urbanization, the greater the demand for land. In the case of limited urban land stock, optimizing the allocation of urban land resources and improving their efficiency of use through technological innovation is an important means of promoting the rational use of urban land, achieving sustainable urban development, and improving the quality of the human environment. In this study, panel data from 26 prefecture-level cities in YRDUA were used to assess the process of urbanization and its influences on urban land green use efficiency as well as their mechanism of technological innovation. The main conclusions of this study are as follows:
  • Urbanization has a significant positive impact on the efficiency of urban green land use. Combined with the theoretical analysis of the influence of urbanization on UL-GUE, it can be inferred that the improvement of social and economic benefits brought by urbanization in the YRDUA is greater than its negative impact on land use. In this process, technological innovation restrains energy consumption and environmental pollution;
  • Urbanization has a significant and strong positive impact on three types of technological innovation. The introduction of foreign investment, the expansion of built-up areas, the granting of industrial land, and the increasing of transportation levels have a significant positive impact, while population density has a significant and larger negative impact on technological innovation;
  • Three kinds of technological innovation play a significant role in promoting the process of urbanization to increase the efficiency of urban land green use. The first mechanism of technological innovation is to alleviate the environmental pressure brought about by the increase in energy demand due to urbanization. Green technological innovation can reduce energy consumption and pollution per unit; digital technological innovation enhances the use of alternative energy; and transportation technological innovation eases the pollution caused by congestion. Secondly, it eases the urban problem caused by land expansion and improves the green efficiency of land in the surrounding areas. In this process, digital technological innovation promotes information integration and exchange, and transportation technological innovation improves the efficiency of transportation and eases the cost of expansion.

Policy Implications

Grasping the interaction between urbanization, technological innovation, and ULGUE is of great significance for achieving sustainable urban development. The mechanism of the above types of technological innovation is based on the current local government practice of expanding urban areas to alleviate the pressure of urban environmental pollution. The facts demonstrated in this study are not sufficient to provide a once-and-for-all solution for the promotion of green land use, and there should be more systematic urban planning and strategic layout of how to improve the efficiency of the existing green use of land in cities.
This study provides the following insights in weighing the advantages and disadvantages of urbanization on ULGUE. Firstly, it is necessary to promote urban land green use with technological innovation, to coordinate the planning of regional development tasks, and to enhance development foresight. It is also important to avoid false green use enhancement brought about by unsustainable governance methods, such as the transfer of polluting industries.
Secondly, the demographic and economic planning objectives of urbanization should be diluted, the negative impact of demographic urbanization and the false promotion of urban land use should be faced squarely, and the multiple connotations of urbanization and the concept of green development should be valued. Both the desired and undesired outputs of urban development should be taken into account, and a green development assessment mechanism should be established.
Thirdly, in the long term, the governments should promote interregional technology exchanges, enhance regional innovation factor agglomeration and application capacity, and incorporate the promotion of green use into the planning and incentives for technological innovation. It should take full account of the high up-front investment costs and lag effect of technological innovation in order to complete the development goal of green urban land use in stages.
This study has some limitations in the depth of index selection, and there is still room for improvement. First of all, the green desired outputs include the green area and lack other types of green desired output such as air quality. Secondly, although this study tries to express technological innovation with different levels of indicators, the specific indicators of technological innovation are still single. Future research should refine the air quality and enrich the evaluation index of technological innovation from the perspective of the proportion of excellent air days so as to reflect the role of ULGUE and technological innovation more comprehensively.

Author Contributions

Conceptualization, C.Y. and J.H.; Methodology, M.J.; Software, M.J.; Writing—original draft, C.Y.; Writing—review & editing, J.H.; Project administration, Q.Y.; Funding acquisition, Q.Y. All authors have read and agreed to the published version of the manuscript.

Funding

This research was funded by [General Project of Philosophy and Social Science Research in Jiangsu] grant number [2023SJYB2065]; [General Project of Philosophy and Social Science Research in Jiangsu] grant number [2022SJYB0119]; and [Social Science Foundation Subjects of Jiangsu] grant number [23SHC008].

Data Availability Statement

Data are contained within the article.

Conflicts of Interest

The authors declare no conflict of interest.

References

  1. UN Habitat. World Cities Report 2022: Envisaging the Future of Cities [EB/OL]. 2020. Available online: https://unhabitat.org/wcr/ (accessed on 23 July 2023).
  2. UN Habitat. World Cities Report 2022: Urban Planning for City Leaders [EB/OL]. 2020. Available online: https://urban-planning-for-city-leaders (accessed on 23 July 2023).
  3. Deng, X.; Huang, J.; Rozelle, S.; Zhang, J.; Li, Z. Impact of urbanization on cultivated land changes in China. Land Use Policy 2015, 45, 1–7. [Google Scholar] [CrossRef]
  4. Long, H. Land use policy in China: Introduction. Land Use Policy 2014, 40, 1–5. [Google Scholar] [CrossRef]
  5. Zhu, X.; Li, Y.; Zhang, P.; Wei, Y.; Zheng, X.; Xie, L. Temporal–spatial characteristics of urban land use efficiency of China’s 35mega cities based on DEA: Decomposing technology and scale efficiency. Land Use Policy 2019, 88, 104083. [Google Scholar] [CrossRef]
  6. Xinhua News Agency. Promote Green Development and Harmonious Coexistence between Man and Nature. 2021. Available online: https://www.mee.gov.cn/ywdt/szyw/202210/t20221017_996717.shtml (accessed on 13 March 2024).
  7. Hu, B.X.; Li, J.; Kuang, B. Evolution Characteristics and Influencing Factors of Urban Land Use Efficiency Difference under the Concept of Green Development. Econ. Geogr. 2018, 38, 183–189. [Google Scholar]
  8. Sun, Y.; Jia, Z.; Chen, Q.; Na, H. Spatial Pattern and Spillover Effects of the Urban Land Green Use Efficiency for the Lanzhou-Xining Urban Agglomeration of the Yellow River Basin. Land 2023, 12, 59. [Google Scholar] [CrossRef]
  9. Xu, B.; Sun, Y. The Impact of Industrial Agglomeration on Urban Land Green Use Efficiency and Its Spatio-Temporal Pattern: Evidence from 283 Cities in China. Land 2023, 12, 824. [Google Scholar] [CrossRef]
  10. Xie, H. Analyzing the green efficiency of arable land use in China. Technol. Forecast. Soc. Chang. 2018, 133, 15028. [Google Scholar] [CrossRef]
  11. Song, Y.; Yeung, G.; Zhu, D.; Xu, Y.; Zhang, L. Efficiency of urban land use in China’s resource-based cities, 2000–2018. Land Use Policy 2022, 115, 106009. [Google Scholar] [CrossRef]
  12. Liu, Z.; Lai, B.; Wu, S.; Liu, X.; Liu, Q.; Ge, K. Growth Targets Management, Regional Competition and Urban Land Green Use Efficiency According to Evidence from China. Int. J. Environ. Res. Public Health 2022, 19, 6250. [Google Scholar] [CrossRef] [PubMed]
  13. Su, H.; Yang, S. Spatio-Temporal Urban Land Green Use Efficiency under Carbon Emission Constraints in the Yellow River Basin, China. Int. J. Environ. Res. Public Health 2022, 19, 12700. [Google Scholar] [CrossRef]
  14. Bai, Y.; Deng, X.; Jiang, S.; Zhang, Q.; Wang, Z. Exploring the relationship between urbanization and urban eco-efficiency: Evidence from prefecture-level cities in China. J. Clean. Prod. 2018, 195, 1487–1496. [Google Scholar] [CrossRef]
  15. Zeng, L. The Driving Mechanism of Urban Land Green Use Efficiency in China Based on the EBM Model with Undesirable Outputs and the Spatial Dubin Model. Int. J. Environ. Res. Public Health 2022, 19, 10748. [Google Scholar] [CrossRef] [PubMed]
  16. Fisher-Vanden, K.; Jefferson, G.H.; Liu, H.; Tao, Q. What is driving China’s decline in energy intensity? Resour. Energy Econ. 2004, 26, 77–97. [Google Scholar] [CrossRef]
  17. Liu, F.; Liu, C. Regional disparity, spatial spillover effects of urbanisation and carbon emissions in China. J. Clean. Prod. 2019, 241, 118226. [Google Scholar] [CrossRef]
  18. Yang, Y.; Yu, D. Impact of technological innovation on CO2 emissions and emissions trend prediction on ‘New Normal’ economy in China. Atmos. Pollut. Res. 2018, 10, 152–161. [Google Scholar] [CrossRef]
  19. Xie, H.L.; Wang, W. Exploring the spatial-temporal disparities of urban land use economic efficiency in China and its influencing factors under environmental constraints based on a sequential slacks-based model. Sustainability 2015, 7, 10171–10190. [Google Scholar] [CrossRef]
  20. Jin, G.; Li, Z.H.; Deng, X.Z.; Yang, J.; Chen, D.D.; Li, W.Q. An analysis of spatiotemporal patterns in Chinese agricultural productivity between 2004 and 2014. Ecol. Indic. 2018, 105, 591–600. [Google Scholar] [CrossRef]
  21. Li, J.; Hu, B.; Kuang, B.; Chen, D. Measuring of urban land use efficiency and its dynamic development in China. Econ. Geogr. 2017, 37, 162–167. (In Chinese) [Google Scholar]
  22. William, G.A.; Dirgha, J. Social organization, population, and land use. Am. J. Sociol. 2011, 17, 209–258. [Google Scholar]
  23. Tan, S.; Hu, B.; Kuang, B.; Zhou, M. Regional differences and dynamic evolution of urban land green use efficiency within the Yangtze River Delta, China. Land Use Policy 2021, 106, 105449. [Google Scholar] [CrossRef]
  24. Müller, D.; Munroe, D.K. Current and future challenges in land-use science. J. Land Use Sci. 2014, 9, 133–142. [Google Scholar] [CrossRef]
  25. Larsen, T.A.; Hoffmann, S.; Luthi, C.; Truffer, B.; Maurer, M. Emerging solutions to the water challenges of an urbanizing world. Science 2016, 352, 928–933. [Google Scholar] [CrossRef] [PubMed]
  26. Sadorsky, P. The effect of urbanization on CO2 emissions in emerging economies. Energy Econ. 2014, 41, 147–153. [Google Scholar] [CrossRef]
  27. Foley, J.A.; DeFries, R.; Asner, G.P.; Barford, C. Global consequences of land use. Science 2005, 309, 570–574. [Google Scholar] [CrossRef]
  28. Xie, X.; Fang, B.; Xu, H.; He, S.; Li, X. Study on the coordinated relationship between urban land use efficiency and ecosystem health in China. Land Use Policy 2021, 102, 105235. [Google Scholar] [CrossRef]
  29. Glaeser, E.; Kahn, M. The greenness of cities: Carbon dioxide emissions and urban development. J. Urban Econ. 2010, 67, 404–418. [Google Scholar] [CrossRef]
  30. McCarty, J.; Kaza, N. Urban form and air quality in the United States. Landsc. Urban Plan. 2015, 139, 168–179. [Google Scholar] [CrossRef]
  31. Long, H.; Tang, G.; Li, X.; Heilig, G.K. Socio-economic driving forces of land-use change in Kunshan, the Yangtze River Delta economic area of China. J. Environ. Manag. 2007, 83, 351–364. [Google Scholar] [CrossRef]
  32. Liu, Y.S.; Li, J.T.; Yang, Y.Y. Strategic adjustment of land use policy under the economic transformation. Land Use Policy 2018, 74, 5–14. [Google Scholar] [CrossRef]
  33. Bagheri, B.; Tousi, S.N. An explanation of urban sprawl phenomenon in Shiraz Metropolitan Area (SMA). Cities 2017, 73, 71–90. [Google Scholar] [CrossRef]
  34. Liu, Y.S.; Zhang, Z.W.; Zhou, Y. Efficiency of construction land allocation in China: An econometric analysis of panel data. Land Use Policy 2018, 74, 261–272. [Google Scholar] [CrossRef]
  35. Lu, X.; Ke, S. Evaluating the effectiveness of sustainable urban land use in China from the perspective of sustainable urbanization. Habitat Int. 2018, 77, 90–98. [Google Scholar] [CrossRef]
  36. Rafiq, S.; Salim, R.; Nielsen, I. Urbanization, openness, emissions and energy intensity: A study of increasingly urbanized emerging economies. Energy Econ. 2016, 56, 20–28. [Google Scholar] [CrossRef]
  37. Hasselmann, F.; Csaplovics, E.; Falconer, I.; Bürgi, M.; Hersperger, A.M. Technological driving forces of LUCC: Conceptualization, quantification, and the example of urban power distribution networks. Land Use Policy 2010, 27, 628–637. [Google Scholar] [CrossRef]
  38. Cumbers, A.; MacKinnon, D. Introduction: Clusters in urban and regional development. Urban Stud. 2004, 41, 959–969. [Google Scholar] [CrossRef]
  39. Duranton, G.; Puga, D. Micro-foundations of urban agglomeration economies. In Handbook of Regional and Urban Economics; Elsevier: Amsterdam, The Netherlands, 2004; Volume 4. [Google Scholar]
  40. Yang, K.; Zhong, T.; Zhang, Y.; Wen, Q. Total factor productivity of urban land use in China. Growth Chang. 2020, 51, 1784–1803. [Google Scholar] [CrossRef]
  41. Mensah, C.N.; Long, X.; Boamah, K.B.; Bediako, I.A.; Dauda, L.; Salman, M. The effect of innovation on CO2 emissions of OCED countries from 1990 to 2014. Environ. Sci. Pollut. Res. 2018, 25, 29678–29698. [Google Scholar] [CrossRef] [PubMed]
  42. Peng, C.; Song, M.; Han, F. Urban economic structure, technological externalities, and intensive land use in China. J. Clean. Prod. 2017, 152, 47–62. [Google Scholar] [CrossRef]
  43. Lindmark, M. An EKC-pattern in historical perspective: Carbon dioxide emissions, technology, fuel prices and growth in Sweden 1870–1997. Ecol. Econ. 2002, 42, 333–347. [Google Scholar] [CrossRef]
  44. Acemoglu, D.; Restrepo, P. The race between man and machine: Implications of technology for growth, factor shares, and employment. Am. Econ. Rev. 2018, 108, 1488–1542. [Google Scholar] [CrossRef]
  45. Acemoglu, D.; Aghion, P.; Bursztyn, L.; Hemous, D. The environment and directed technical change. Am. Econ. Rev. 2012, 102, 131–166. [Google Scholar] [CrossRef] [PubMed]
  46. Lema, A.; Lema, R. Low-carbon innovation and technology transfer in latecomer countries: Insights from solar PV in the clean development mechanism. Technol. Forecast. Soc. Chang. 2016, 104, 223–236. [Google Scholar] [CrossRef]
  47. Cai, W.G.; Li, G.P. The drivers of eco-innovation and its impact on performance: Evidence from China. J. Clean. Prod. 2018, 176, 110–118. [Google Scholar] [CrossRef]
  48. Chen, J.; Gao, M.; Mangla, S.K.; Song, M.; Wen, J. Effects of technological changes on China’s carbon emissions. Technol. Forecast. Soc. Chang. 2020, 153, 119938. [Google Scholar] [CrossRef]
  49. Ghobakhloo, M. Industry 4.0, Digitization, and Opportunities for Sustainability. J. Clean. Prod. 2020, 252, 119869. [Google Scholar] [CrossRef]
  50. Wang, L.; Chen, Y.; Ramsey, T.S.; Hewings, G.J.D. Will researching digital technology really empower green development? Technol. Soc. 2021, 66, 101638. [Google Scholar] [CrossRef]
  51. Cairncross, F. The Death of Distance; Harvard Business Review Press: Cambridge, MA, USA, 1997. [Google Scholar]
  52. Kii, M.; Moeckel, R.; Thill, J.C. Land use, transport, and environment interactions: WCTR 2016 contributions and future research directions. Comput. Environ. Urban Syst. 2019, 77, 101335. [Google Scholar] [CrossRef]
  53. Zhao, P.; Hu, H. Geographical patterns of traffic congestion in growing megacities big data analytics from Beijing. Cities 2019, 92, 164–174. [Google Scholar] [CrossRef]
  54. Heinonen, J.; Junnila, S. Implications of urban structure on carbon consumption in metropolitan areas. Environ. Res. Lett. 2011, 6, 014018. [Google Scholar] [CrossRef]
  55. Yu, H.; Stuart, A.L. Impacts of compact growth and electric vehicles on future air quality and exposures may be mixed. Sci. Total Environ. 2017, 576, 148–158. [Google Scholar] [CrossRef]
  56. Rainald, B. Public transport and urban pollution. Reg. Sci. Urban Econ. 2019, 77, 356–366. [Google Scholar] [CrossRef]
  57. Lee, K.; Min, B. Green R&D for eco-innovation and its impact on carbon emissions and firm performance. J. Clean. Prod. 2015, 108, 534–542. [Google Scholar]
  58. Cheng, Y.; Loo BP, Y.; Vickerman, R. High-speed rail networks, economic integration and regional specialisation in China and Europe. Travel Behav. Soc. 2015, 2, 1–14. [Google Scholar] [CrossRef]
  59. Wang, Z.; Wang, X.; Liang, L. Green economic efficiency in the Yangtze River Delta: Spatiotemporal evolution and influencing factors. Evol. Influ. Factors 2019, 5, 20–35. [Google Scholar] [CrossRef]
  60. Aparicio, J.; Ortiz, L.; Pastor, J.T. Measuring and decomposing profit inefficiency through the Slacks-Based Measure. Eur. J. Oper. Res. 2017, 260, 650–654. [Google Scholar] [CrossRef]
  61. Fukuyama, H.; Weber, W.L. A directional slacks-based measure of technical inefficiency. Socio-Econ. Plan. Sci. 2009, 43, 274–287. [Google Scholar] [CrossRef]
  62. Zhao, Z.; Bai, Y.; Wang, G.; Chen, J.; Yu, J.; Liu, W. Land eco-efficiency for newtype urbanization in the Beijing-Tianjin-Hebei Region. Technol. Forecast. Soc. Chang. 2018, 137, 19–26. [Google Scholar] [CrossRef]
  63. Wen, Z.; Fang, J.; Xie, J.; Ouyang, J. Methodological research on mediation effects in China’s mainland. Adv. Psychol. Sci. 2022, 30, 1692–1702. [Google Scholar] [CrossRef]
  64. Baron, R.M.; Kenny, D.A. The moderator-mediator variable distinction in social psychological research: Conceptual, strategic, and statistical considerations. J. Personal. Soc. Psychol. 1986, 51, 1173–1182. [Google Scholar] [CrossRef] [PubMed]
  65. Wu, M.; Cao, J.; Mao, J. Local Public Debt and Enterprise Total Factor Productivity: Effect and Mechanism. J. Econ. Res. 2022, 01, 107–121. [Google Scholar]
  66. Ge, K.; Zou, S.; Ke, S.G.; Chen, D.L. Does Urban Agglomeration Promote Urban Land Green Use Efficiency? Take the Yangtze River Economic Zone of China as an Example. Sustainability 2021, 13, 10527. [Google Scholar] [CrossRef]
  67. Tzeng, G.H.; Lin, C.W.; Opricovic, S. Multi-criteria analysis of alternative-fuel buses for public transportation. Energy Policy 2005, 33, 1373–1383. [Google Scholar] [CrossRef]
  68. Steinhilber, S.; Wells, P.; Thankappan, S. Socio-technical inertia: Understanding the barriers to electric vehicles. Energy Policy 2013, 60, 531–539. [Google Scholar] [CrossRef]
  69. Yu, J.; Zhou, K.; Yang, S. Land use efficiency and influencing factors of urban agglomerations in China. Land Use Policy 2019, 88, 104143. [Google Scholar] [CrossRef]
  70. Melia, S.; Parkhurst, G.; Barton, H. The paradox of intensification. Transp. Policy 2011, 18, 46–52. [Google Scholar] [CrossRef]
  71. Namdeo, A.; Goodman, P.; Mitchell, G.; Hargreaves, A.; Echenique, M. Land-use, transport and vehicle technology futures: An air pollution assessment of policy combinations for the Cambridge Sub-Region of the UK. Cities 2019, 89, 296–307. [Google Scholar] [CrossRef]
  72. Srinivasan, V.; Seto, K.C.; Emerson, R.; Gorelick, S.M. Gorelick The impact of urbanization on water vulnerability: A coupled human– environment system approach for Chennai, India. Glob. Environ. Chang. 2013, 23, 229–239. [Google Scholar] [CrossRef]
  73. Jahanger, A.; Usman, M.; Murshed, M.; Mahmood, H.; Balsalobre-Lorente, D. The linkages between natural resources, human capital, globalization, economic growth, financial development, and ecological footprint: The moderating role of technological innovations. Resour. Policy 2022, 76, 102569. [Google Scholar] [CrossRef]
  74. Kabisch, N.; Haase, D. Green spaces of European cities revisited for 1990–2006. Landsc. Urban Plan. 2013, 110, 113–122. [Google Scholar] [CrossRef]
  75. Wolch, J.R.; Byrne, J.; Newell, J.P. Urban green space, public health, and environmental justice: The challenge of making cities ‘just green enough’. Landsc. Urban Plan. 2014, 125, 234–244. [Google Scholar] [CrossRef]
Figure 1. Research Framework.
Sustainability 16 02812 g001
Figure 2. Map of YRDUA.
Sustainability 16 02812 g002
Figure 3. Mediation model for independent explanatory variable Purban, mediating variable M, and explained variable ULGUE. Note: **, and *** indicate significance at the statistical level of 5%, and 1%, respectively.
Sustainability 16 02812 g003
Table 1. The 26 sample cities of YRDUA.
Province
(Municipality)
Cities
ShanghaiShanghai
JiangsuNanjing, Wuxi, Changzhou, Suzhou, Nantong, Yancheng, Yangzhou, Zhenjiang, and Taizhou
ZhejiangHangzhou, Ningbo, Jiaxing, Huzhou, Shaoxing, Jinhua, Zhoushan, and Taizhou
AnhuiHefei, Wuhu, Maanshan, Tongling, Anqing, Chuzhou, Chizhou, and Xuancheng
Table 2. Meaning selection of ULGUE indicators.
Meaning of the IndicatorContent of the IndicatorReferences
InputsLandUrban built-up land areaZhu et al. (2019) [5]
LaborPopulation employed in secondary and tertiary industries
CapitalCapital investment
OutputsDesired outputsEconomic benefitsValue added from secondary and tertiary industriesSu, H. and Yang, Shuo (2022) [13]
Social benefitsWage level
Environmental benefitsUrban green coverage rate
Undesired outputsNegative environmental impactWastewater, industrial SO2, and industrial fume and dust emissionsLiu et al. (2022) [12]
Table 3. Descriptive analysis of variables and panel data of 26 cities in YRDUA.
VariableObsMeanStd. Dev.MinMax
ULGUE3641.0170.0780.711.431
Purban3640.4260.2260.1131
Gtech3643.5194.1080.01221.259
Dtech3641.8231.34408.57
Ttech3640.9330.440.1092.507
Density3640.0110.0060.0030.037
Fdi3640.080.0630.0060.442
Buarea3640.1080.0760.0080.602
Road3640.0170.0120.0010.078
Pubexp36428.0619.5088.2997.835
Lansuse3640.5230.1320.1530.985
Table 4. Regression results of the influence of urbanization and ULGUE.
VariableULGUE
OLS(1)FE(2)RE(3)
Purban0.045 **0.140.048 **
(2.33)(1.53)(2.36)
Density−0.392−10.218 **−0.603
(−0.26)(−2.76)(−0.39)
Fdi0.0240.222 *0.026
(0.60)(1.76)(0.62)
Buarea−0.0370.587−0.017
(−0.26)(2.30)(−0.12)
Road0.771−0.40.722
(1.07)(−0.44)(1.03)
Pubexp000
(0.39)(0.81)(0.42)
Lansuse0.0380.074 *0.04
(1.48)(2.02)(1.55)
Constant0.969 ***0.944 **0.968 ***
(38.88)(15.92)(38.55)
R-squared0.0170.0330.017
F-test2.8521.626
*** p < 0.01; ** p < 0.05; * p < 0.1. t-values in parentheses. OLS, OLS mixed regression; FE, fixed effects; RE, random effects.
Table 5. Regression results of the influence of urbanization and types of technological innovation.
VariableGtechDtechTtech
OLS(4)FE(5)RE(6)OLS(7)FE(8)RE(9)OLS(10)FE(11)RE(12)
Purban3.048 *9.128 **5.518 **3.372 ***5.304 ***4.388 ***0.652 ***0.142 ***0.137 ***
(1.76)(2.50)(2.02)(2.81)(5.04)(2.76)(2.93)(6.56)(6.92)
Density−521.774 ***−1514.87 ***−784.662 ***−36.506−243.847 ***−158.778 ***−41.43 ***−23.552 ***−19.789 ***
(−2.80)(−10.24)(−3.37)(−0.89)(−5.72)(−3.37)(−2.83)(−6.84)(−6.96)
Fdi2.93710.334 **0.7142.783 *9.056 ***6.635 ***0.977 *0.1060.067
(0.52)(2.05)(0.09)(1.77)(6.25)(3.25)(1.84)(1.11)(0.75)
Buarea18.53568.31 ***32.41 ***1.19713.714 ***9.056 ***4.948 ***1.384 ***1.03 ***
(1.57)(6.7)(2.60)(0.40)(4.67)(2.94)(3.62)(6.00)(4.84)
Road167.243 ***135.068 ***164.151 ***19.841−1.1384.9070.6841.599 *1.73 **
(2.91)(3.70)(2.93)(1.01)(−0.11)(0.37)(0.10)(1.94)(2.13)
Pubexp−0.014−0.013−0.0180.028 ***0.016 ***0.017 ***−0.004 *00.001 *
(−0.78)(−0.82)(−1.11)(3.18)(3.37)(2.68)(−1.78)(0.61)(1.75)
Lansuse−3.585 **−1.129−2.84 *−1.908 **−0.956 **−1.184−0.569 ***−0.056 *−0.053
(−2.12)(−0.77)(−1.79)(−2.07)(−2.28)(−1.54)(−2.99)(−1.74)(−1.62)
Constant4.805 **6.201 ***5.299 **0.3050.0270.1790.888 ***0.167 ***0.158 ***
(2.43)(2.62)(2.57)(0.46)(0.04)(0.31)(2.98)(4.78)(4.42)
R-squared0.2430.3480.3130.2690.2060.1960.5030.4170.412
F-test14.46625.246 4.80812.264 17.01333.810
*** p < 0.01; ** p < 0.05; * p < 0.1. t-values in parentheses.
Table 6. Regression results of robustness tests.
VariableULGUE
OLS(13)FE(14)RE(15)OLS(16)FE(17)RE(18)
Hur0.0120.146 ***0.037
(0.65)(2.97)(1.35)
Lur 0.069 ***0.355 ***0.07 **
(3.04)(4.02)(3.02)
Density−3.199 *−10.463 ***−3.051 *−0.387−11.655 ***
(−1.92)(−2.68)(−1.87)(−0.26)(−2.89)
Fdi0.0010.23 *0.040.0620.444 ***0.059
(0.02)(1.92)(0.90)(1.36)(3.14)(1.18)
Buarea0.0460.528 **0.065−0.0530.614 **−0.07
(0.30)(2.01)(0.44)(−0.34)(2.23)(−0.71)
Road1.016−0.4461.0450.9−0.4530.841
(1.36)(−0.46)(1.46)(1.15)(−0.46)(1.12)
Pubexp000000
(−1.04)(1.09)(−0.42)(0.56)(1.18)(0.69)
Lansuse0.0390.087 **0.05 *0.071 **0.112 ***0.074 **
(1.12)(2.16)(1.91)(2.34)(2.59)(2.37)
Constant1.013 ***0.706 ***0.982 ***0.939 ***0.827 ***0.936 ***
(32.91)(6.55)(34.71)(30.57)(14.63)(29.92)
R-squared0.0150.060.0190.0310.0810.12
F-test6.3082.757 3.4723.828
*** p < 0.01; ** p < 0.05; * p < 0.1. t-values in parentheses.
Disclaimer/Publisher’s Note: The statements, opinions and data contained in all publications are solely those of the individual author(s) and contributor(s) and not of MDPI and/or the editor(s). MDPI and/or the editor(s) disclaim responsibility for any injury to people or property resulting from any ideas, methods, instructions or products referred to in the content.

