
Facile Preparation of Magnetic Chitosan Carbon Based on Recycling of Iron Sludge for Sb(III) Removal


Abstract
1. Introduction
2. Materials and Methods
2.1. Material
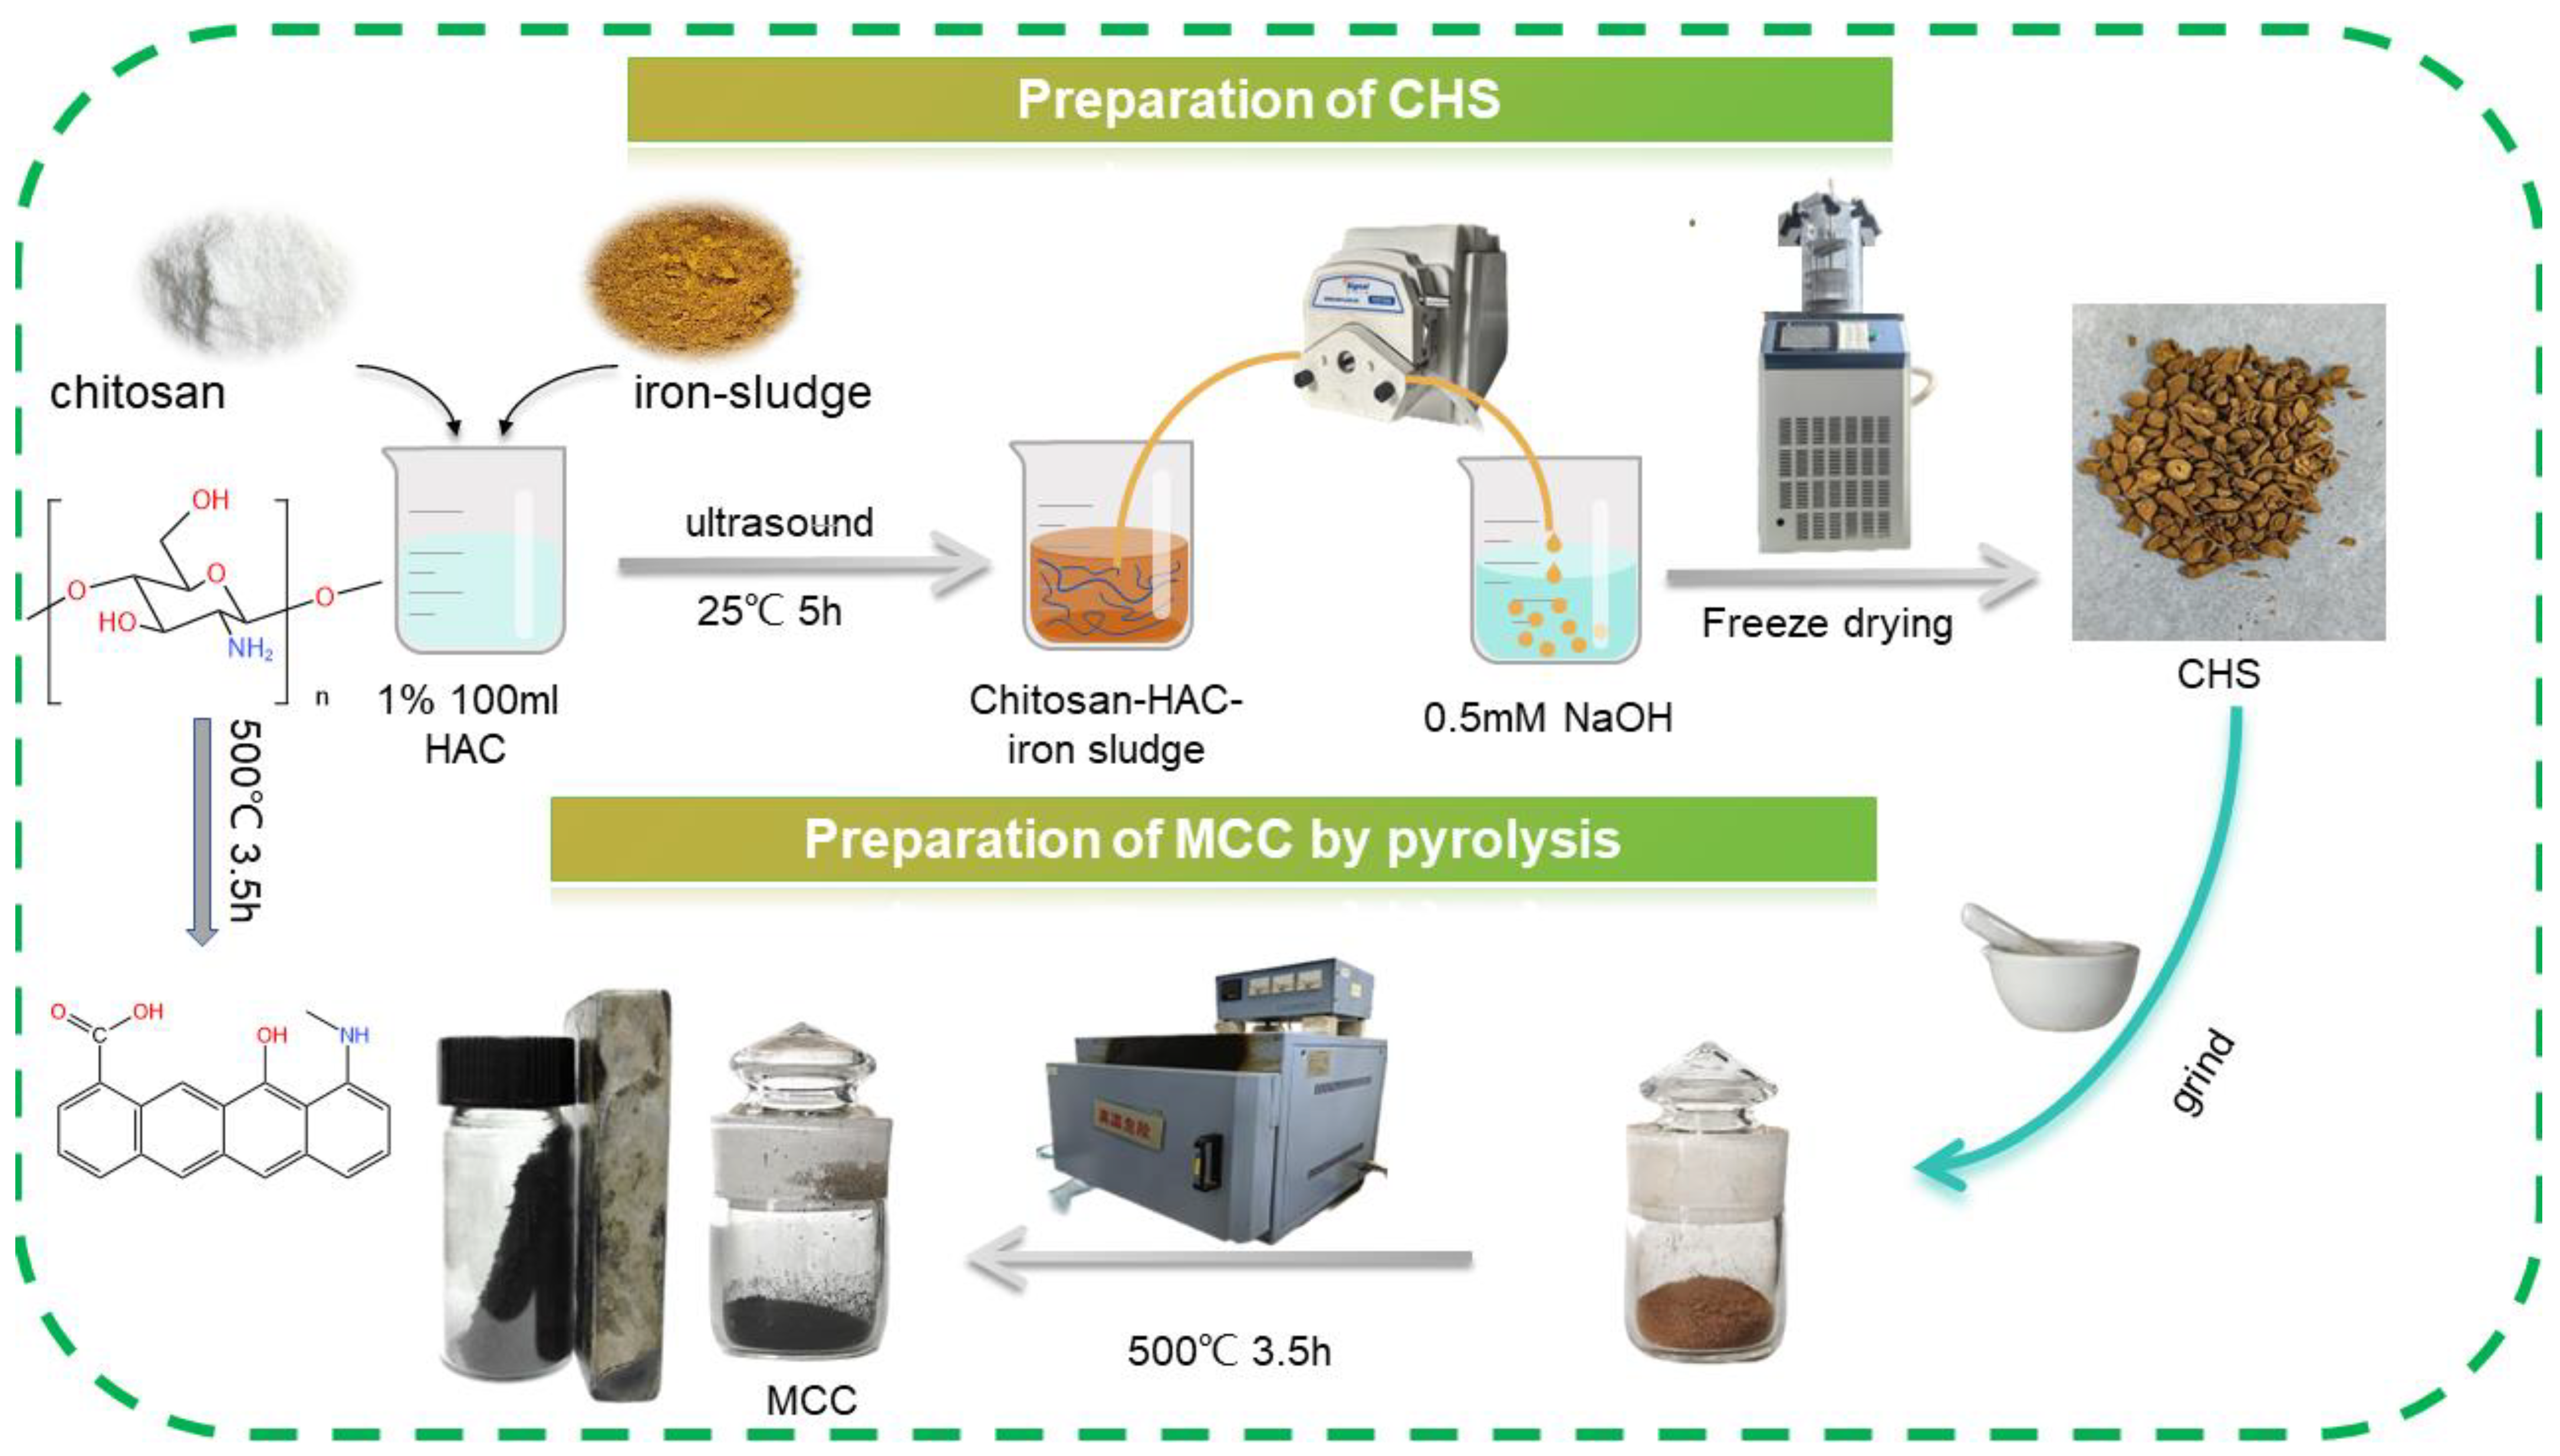
2.2. Adsorbent Preparation
2.3. Characterization
2.4. Batch Sorption Experiments
2.4.1. Influence Factors
2.4.2. Adsorption Kinetics
2.4.3. Adsorption Isotherms
2.4.4. Cycle Experiment
3. Results and Discussion
3.1. Characterization of the Adsorbents
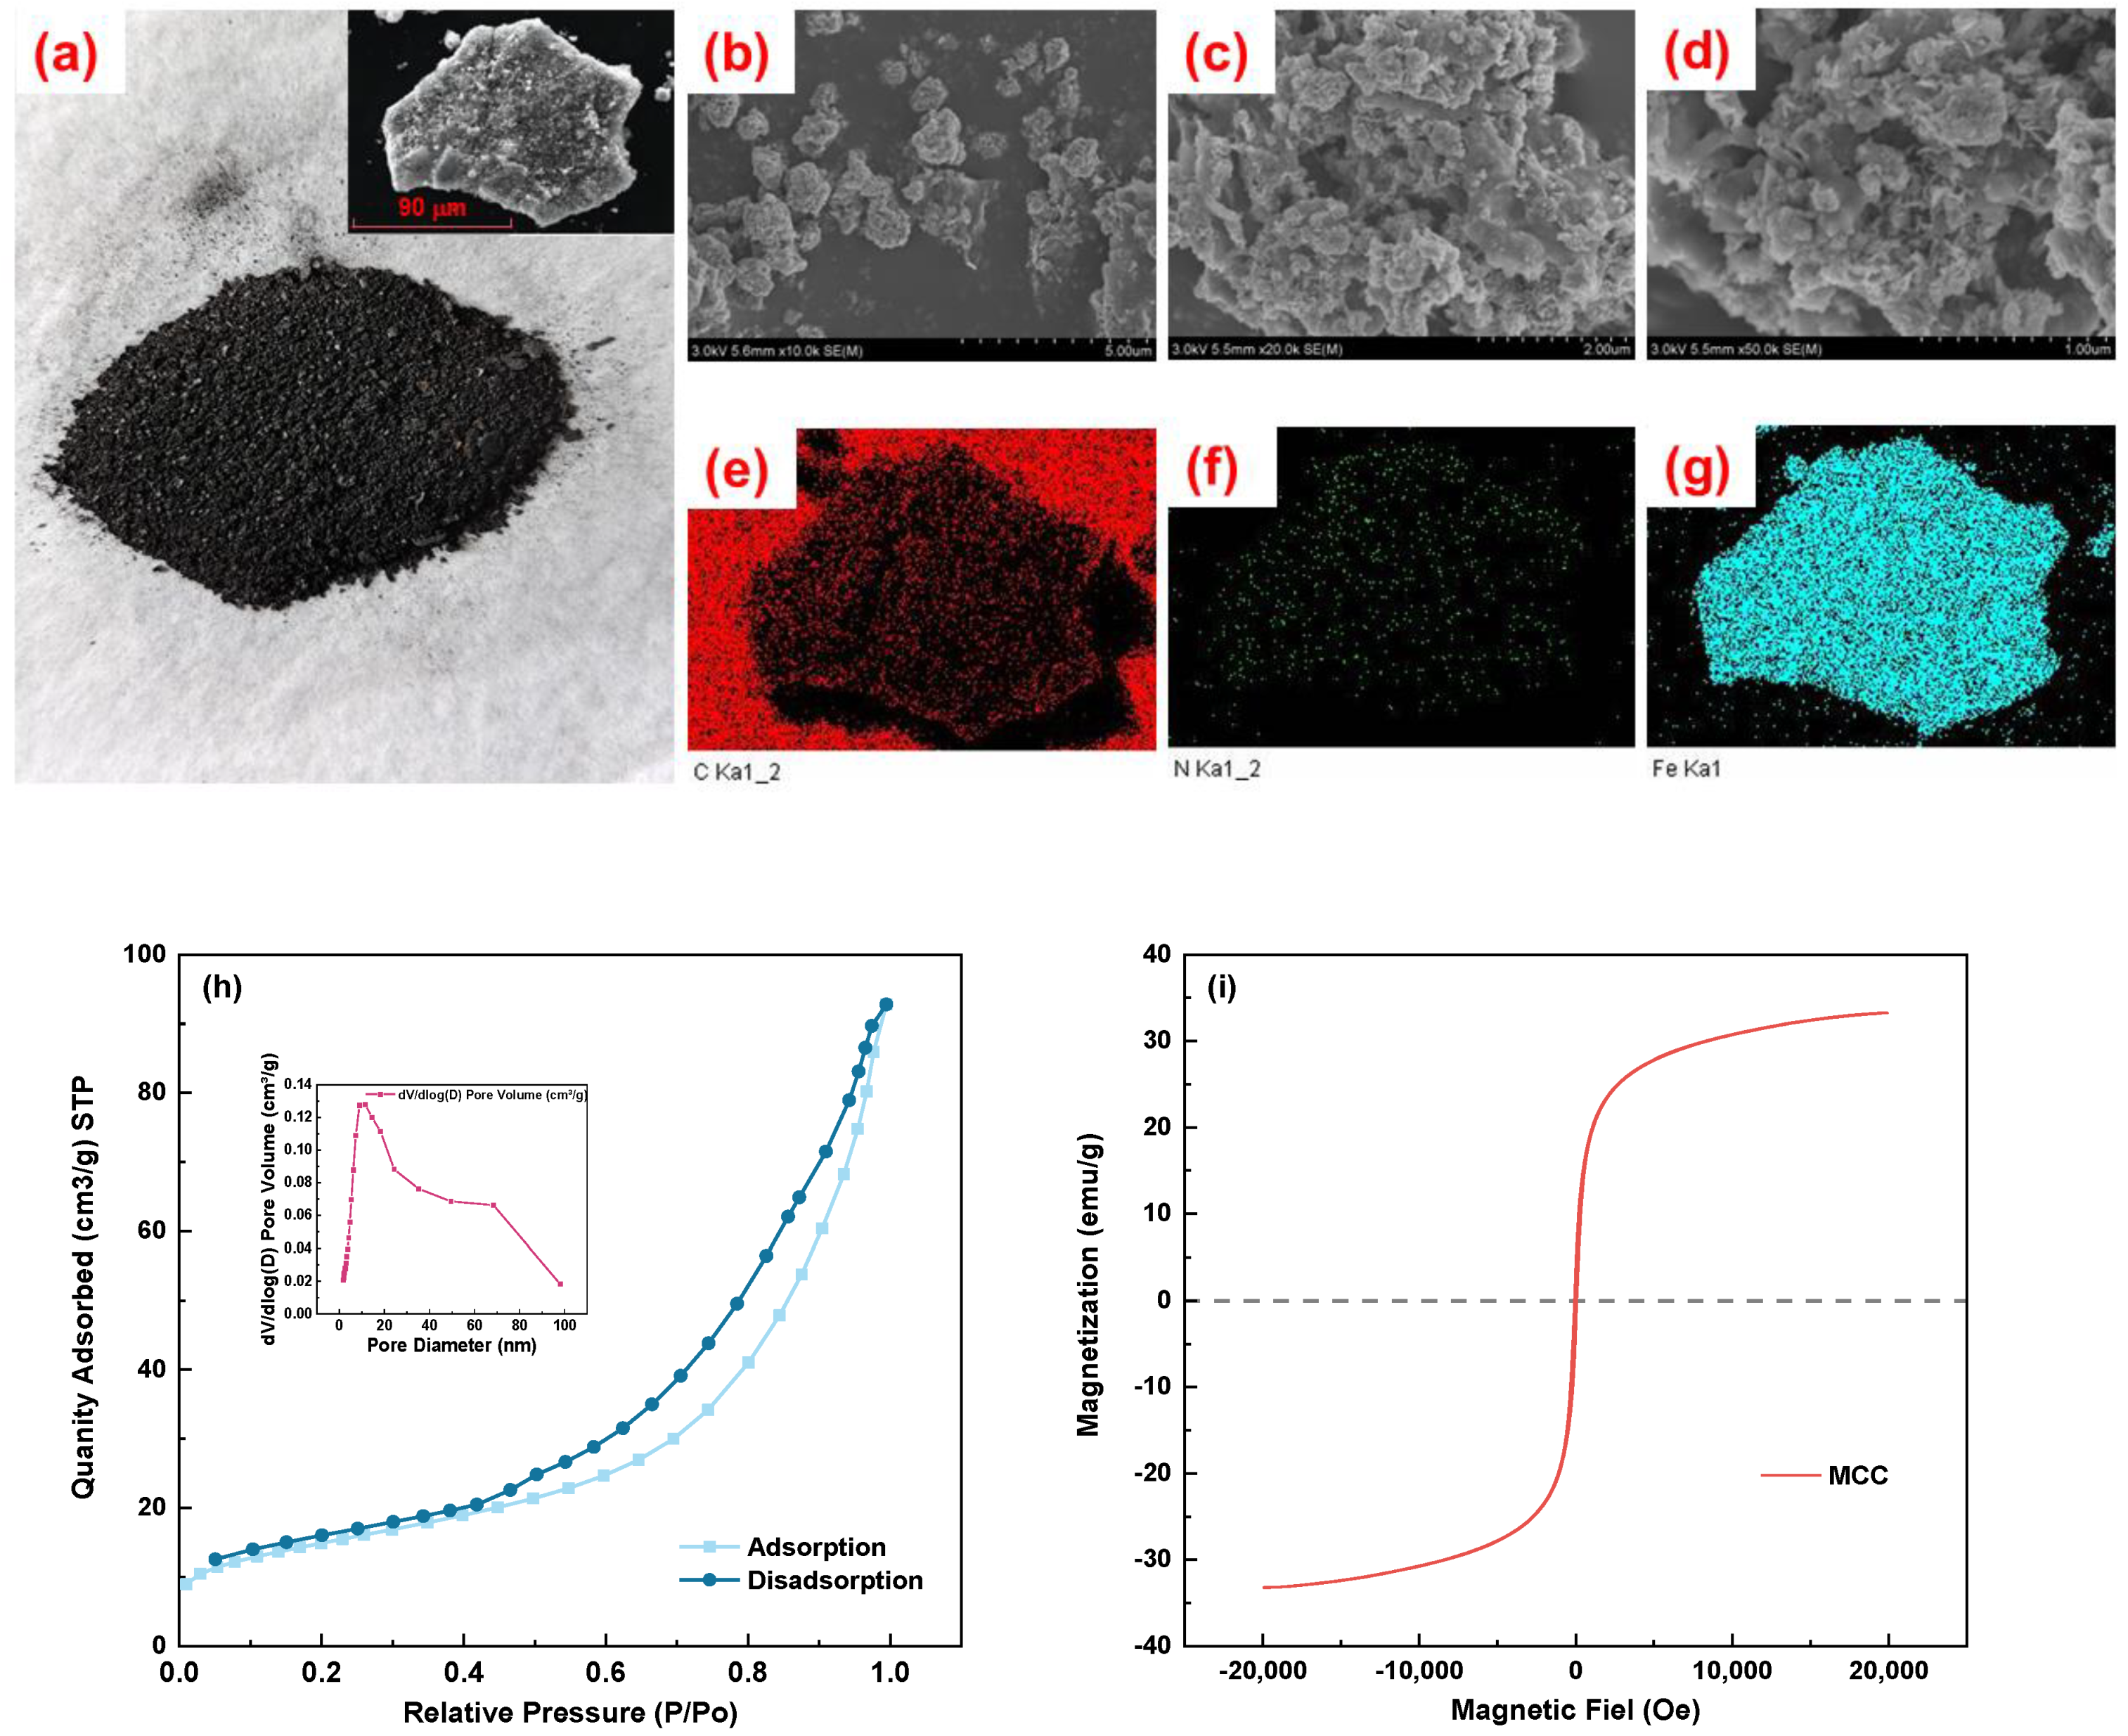
3.1.1. Surface Morphology of MCC
3.1.2. XRD
3.1.3. FTIR
3.1.4. XPS
3.2. Discussion of Adsorption Mechanism
3.2.1. FTIR
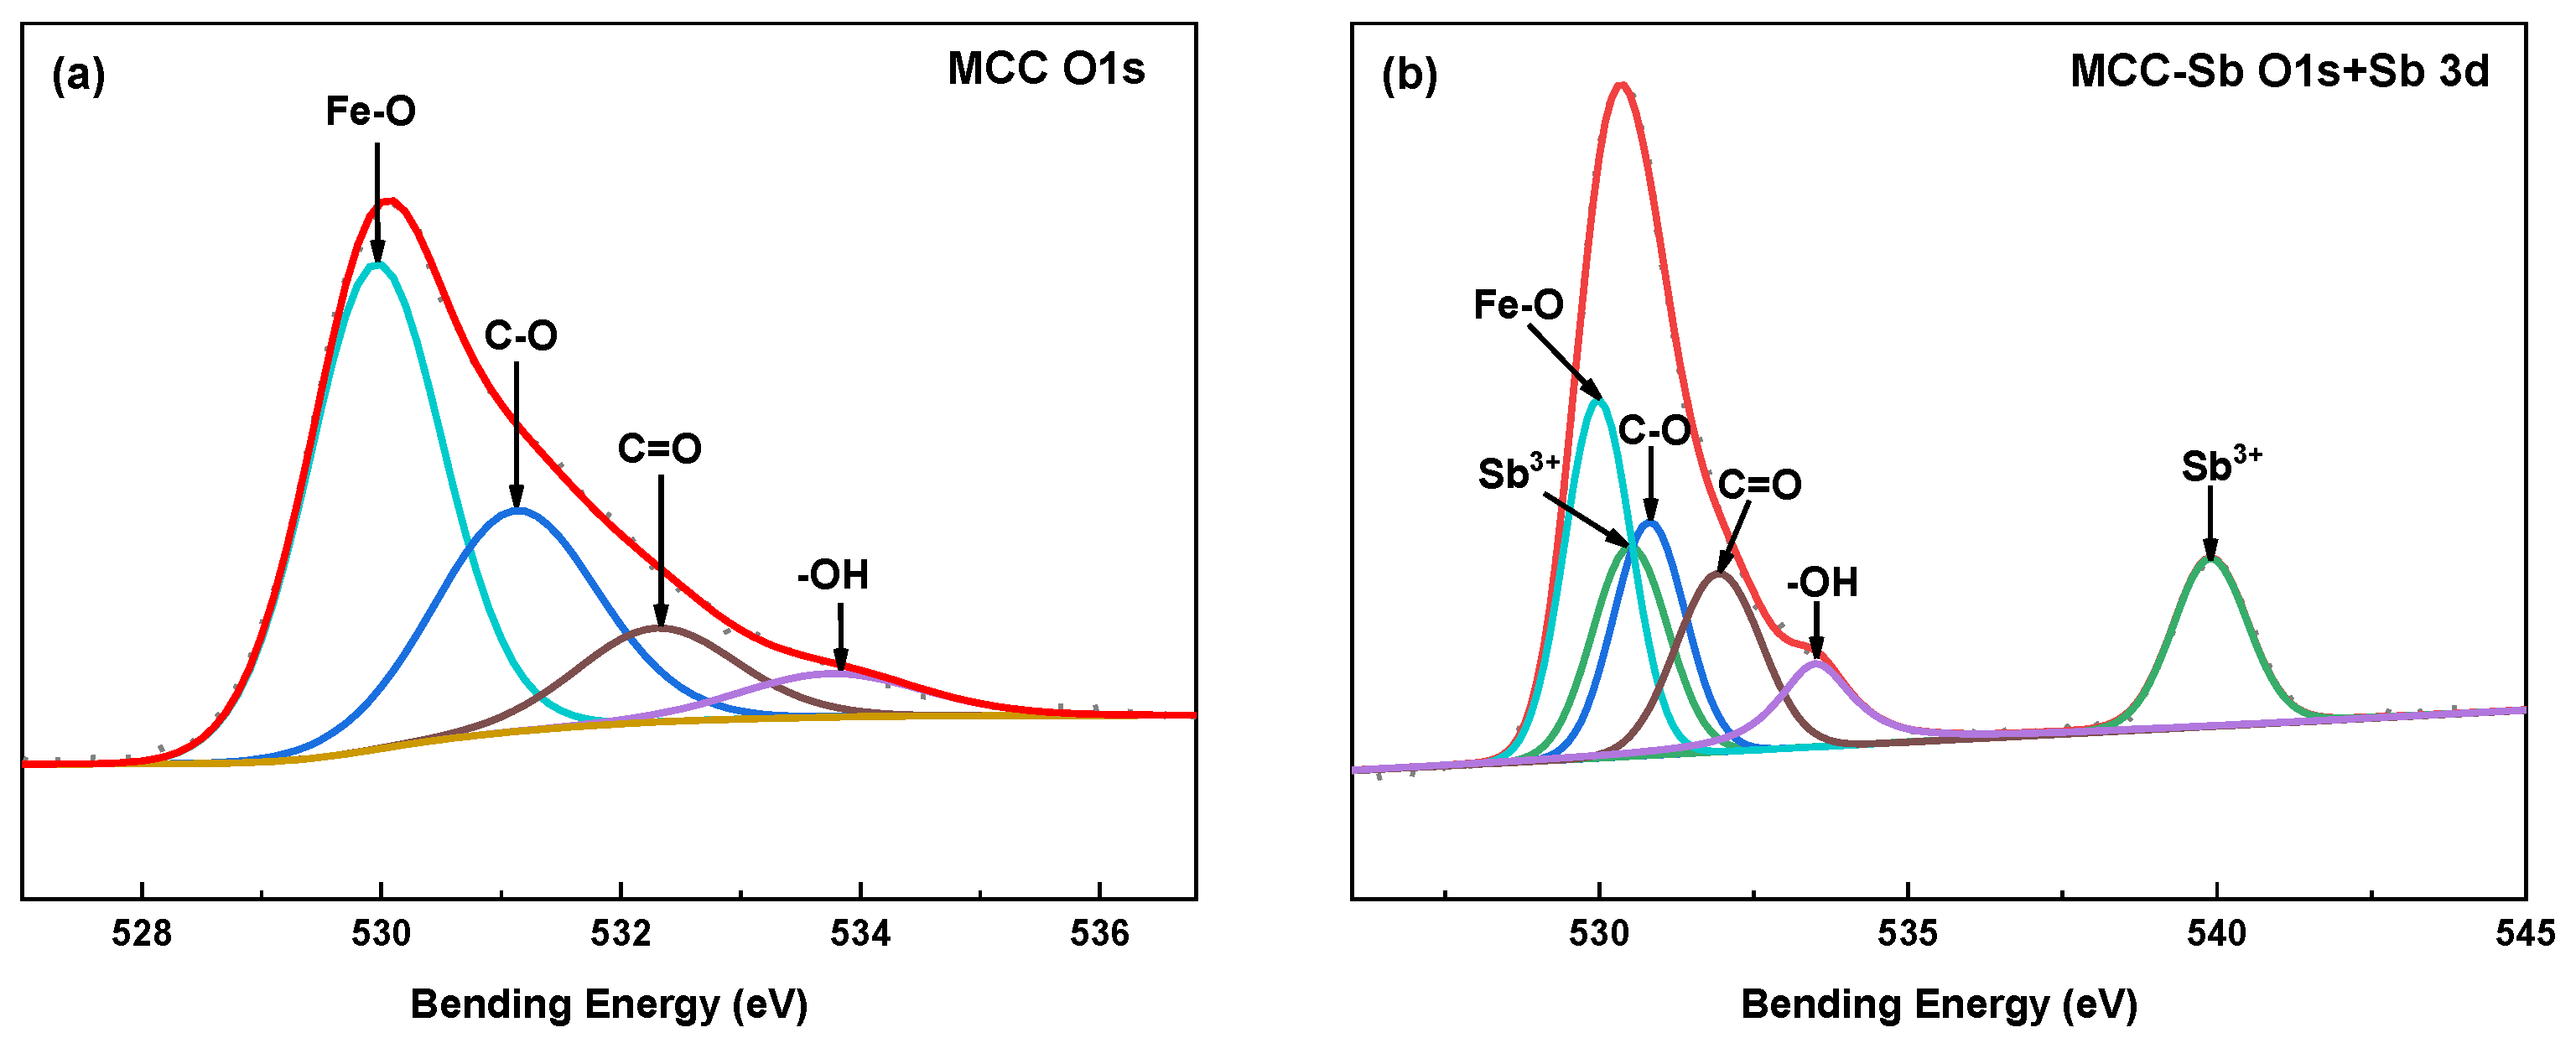
3.2.2. XPS
3.3. Batch Sorption Experiments
3.3.1. Effect of Adsorbent Dosage
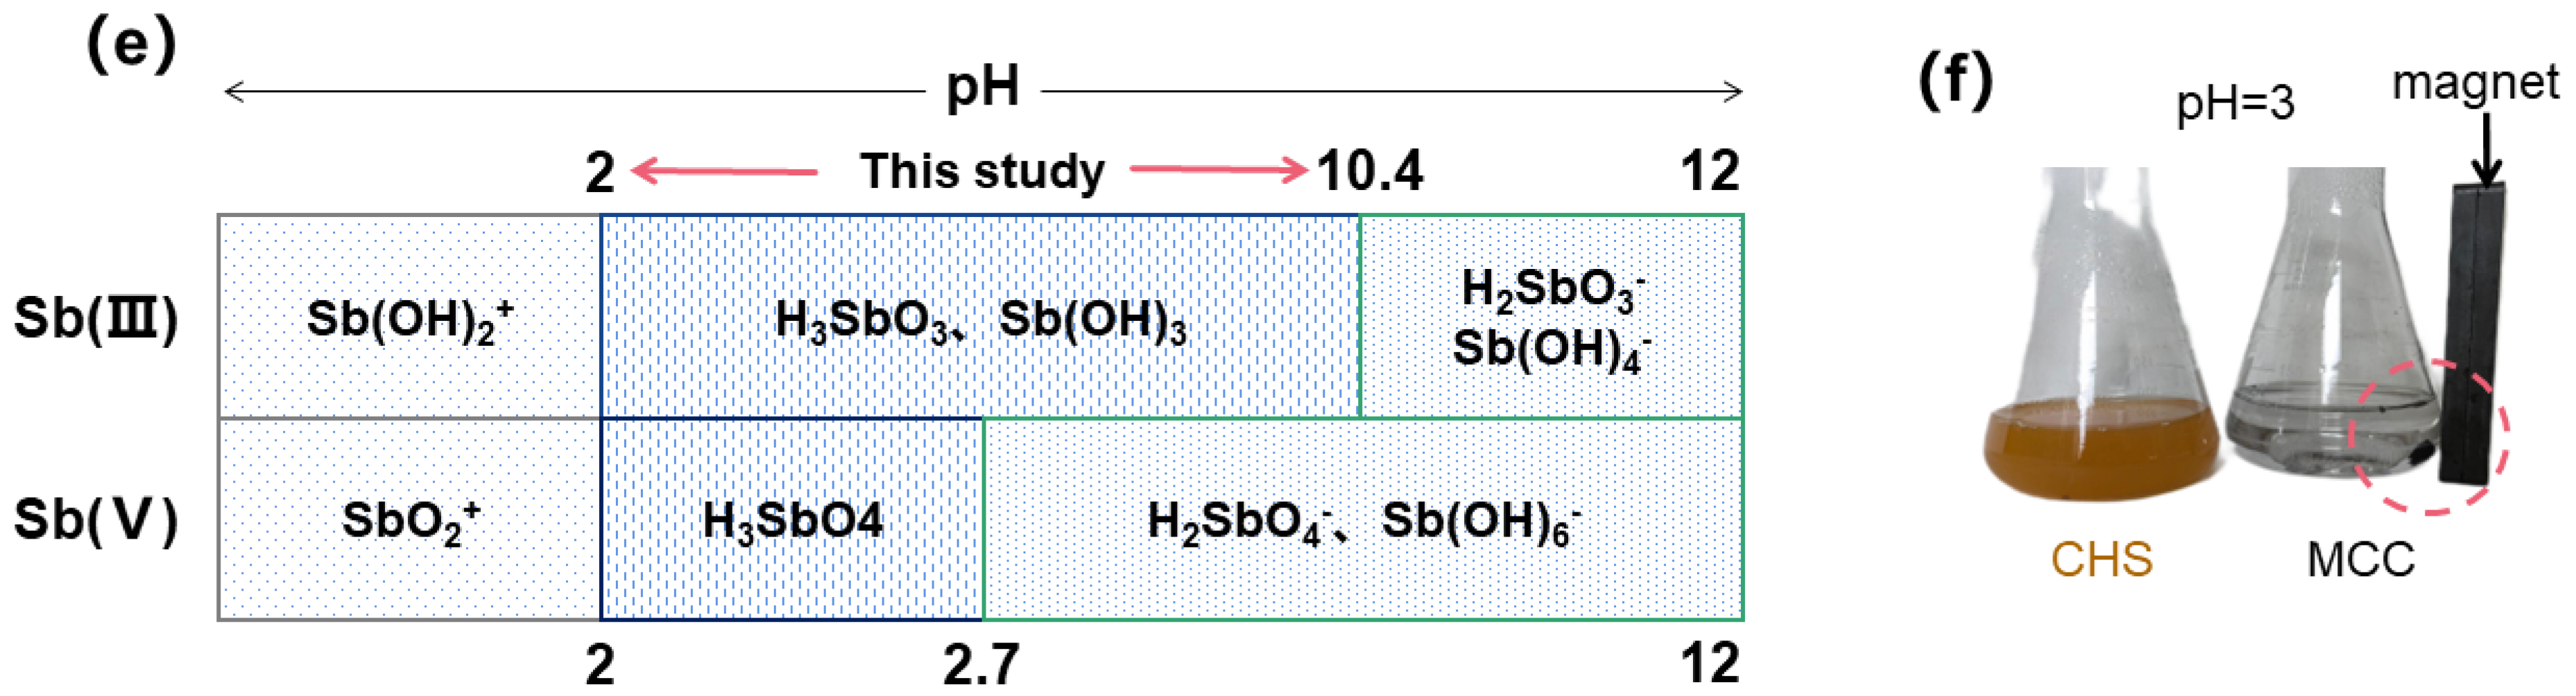
3.3.2. Effect of pH and Ionic Strength
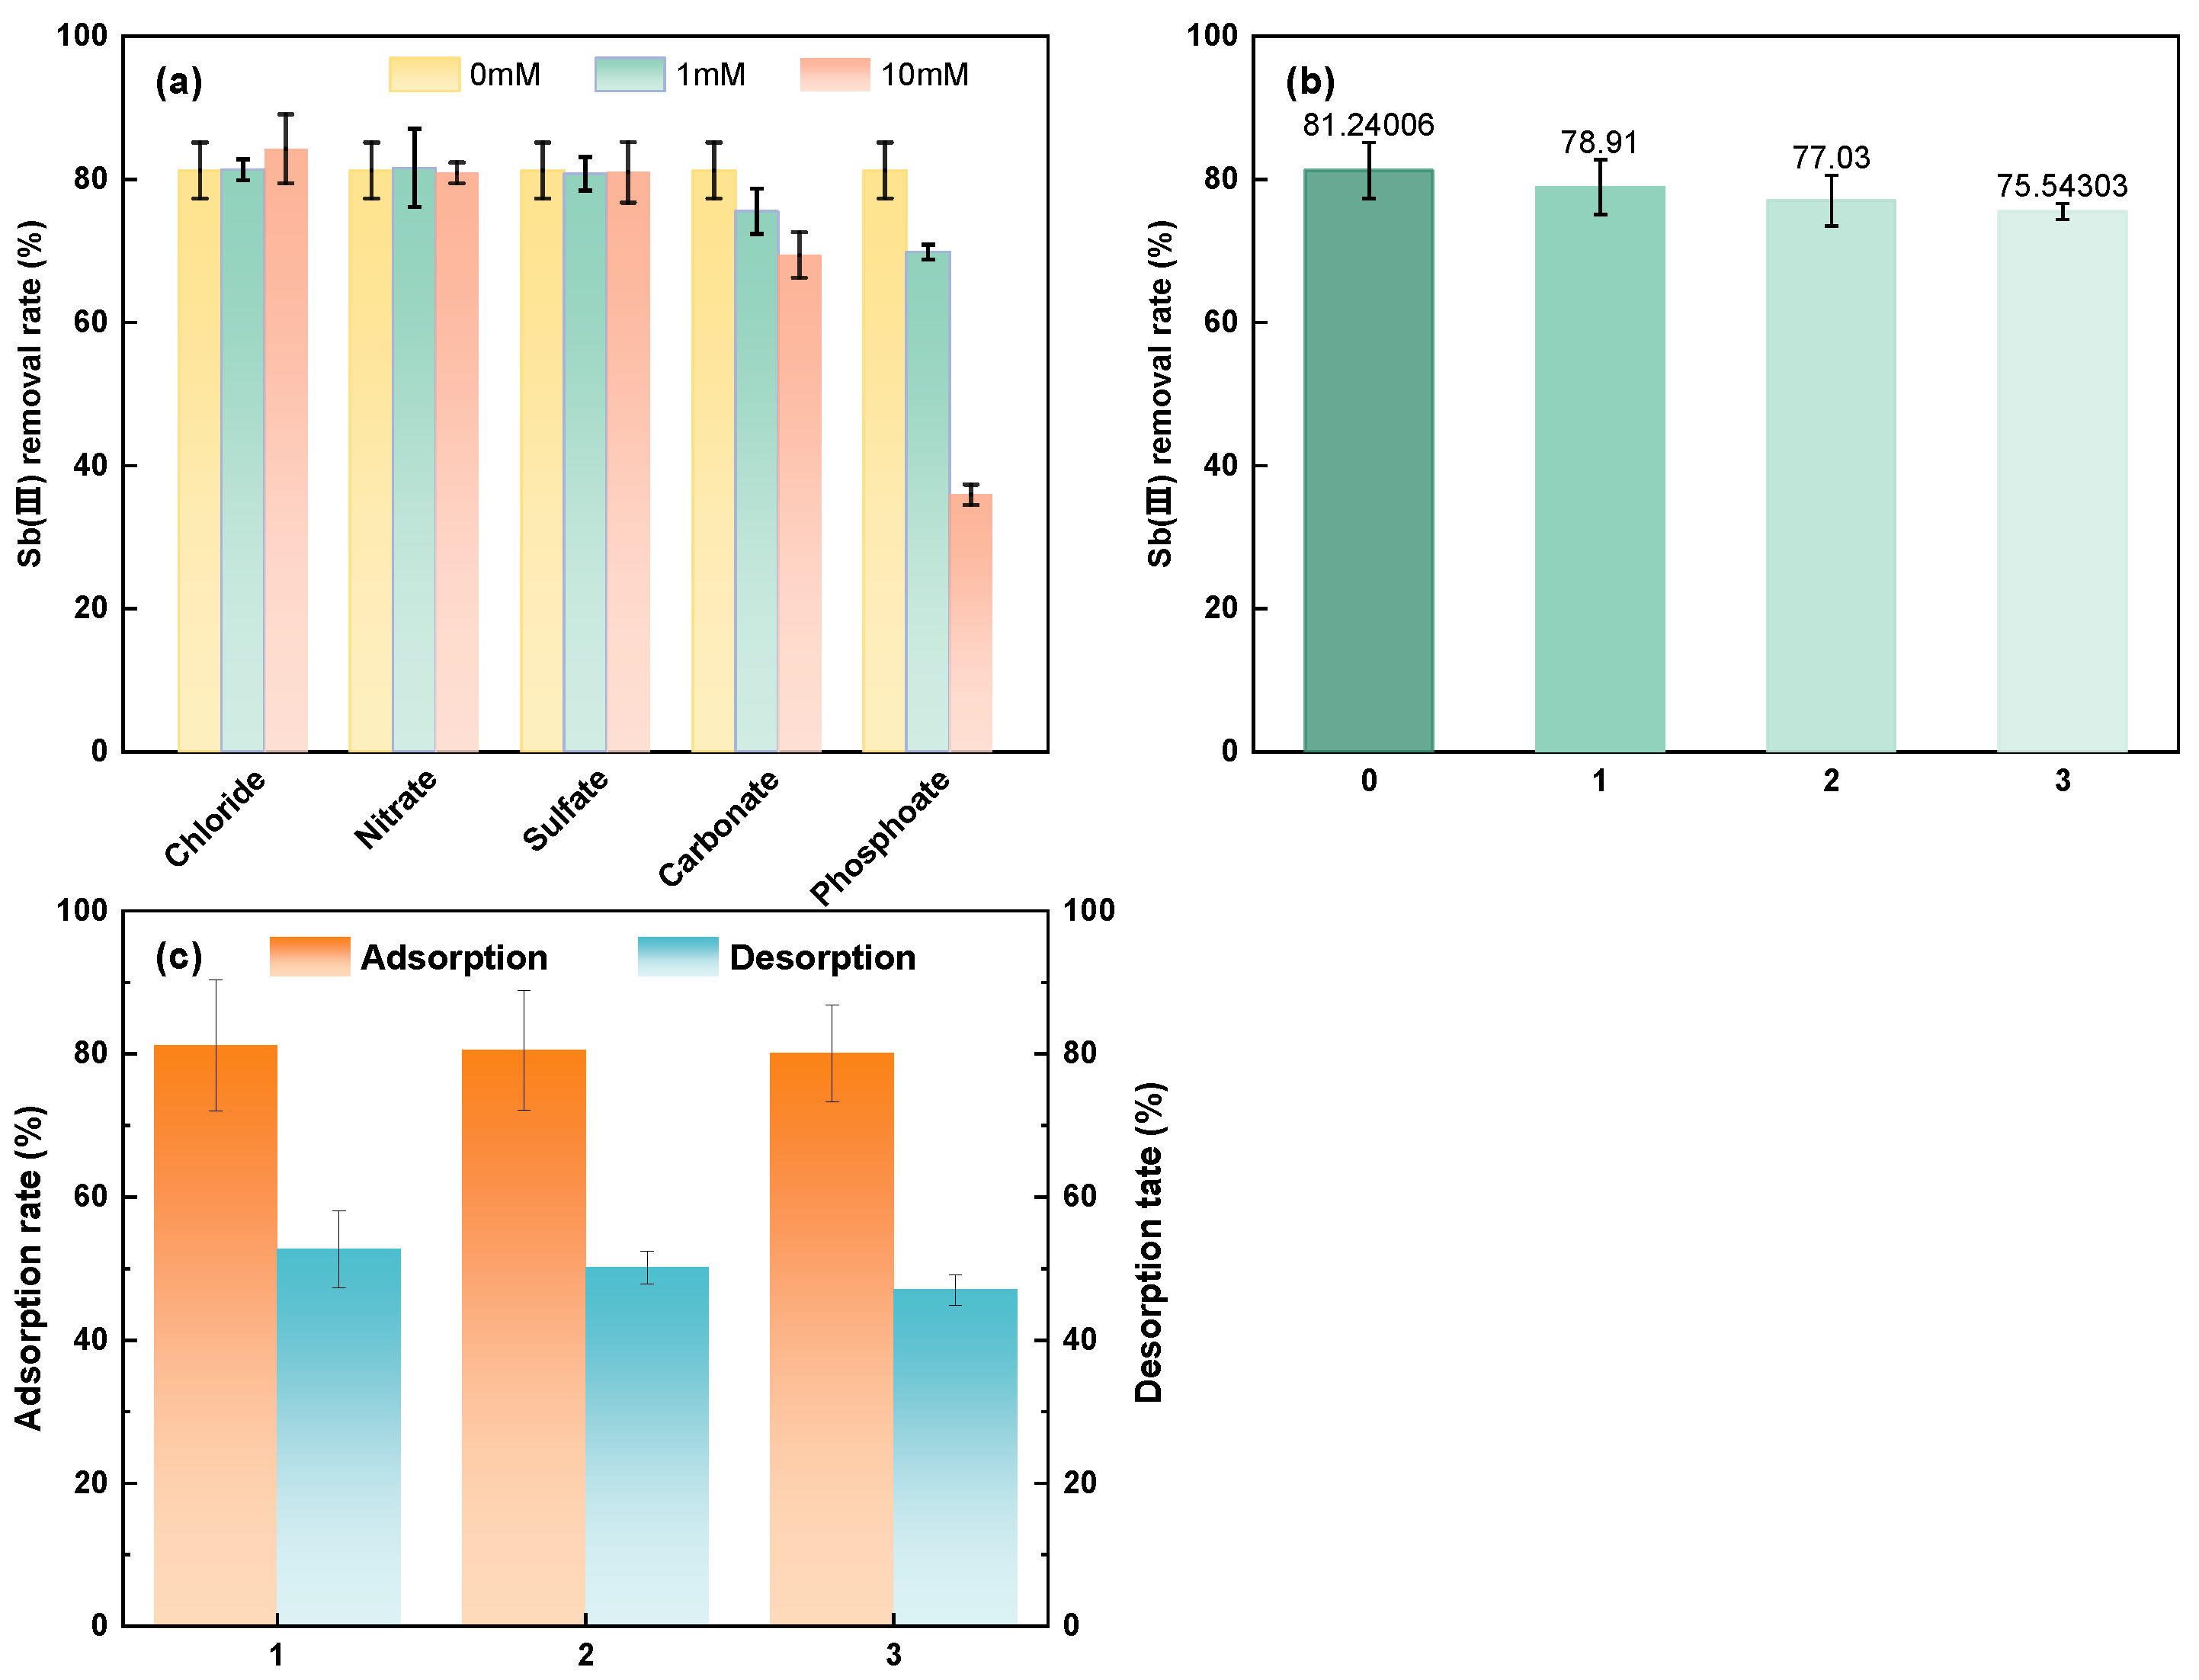
3.3.3. Effect of Coexisting Anions
3.3.4. Recycle Experiment
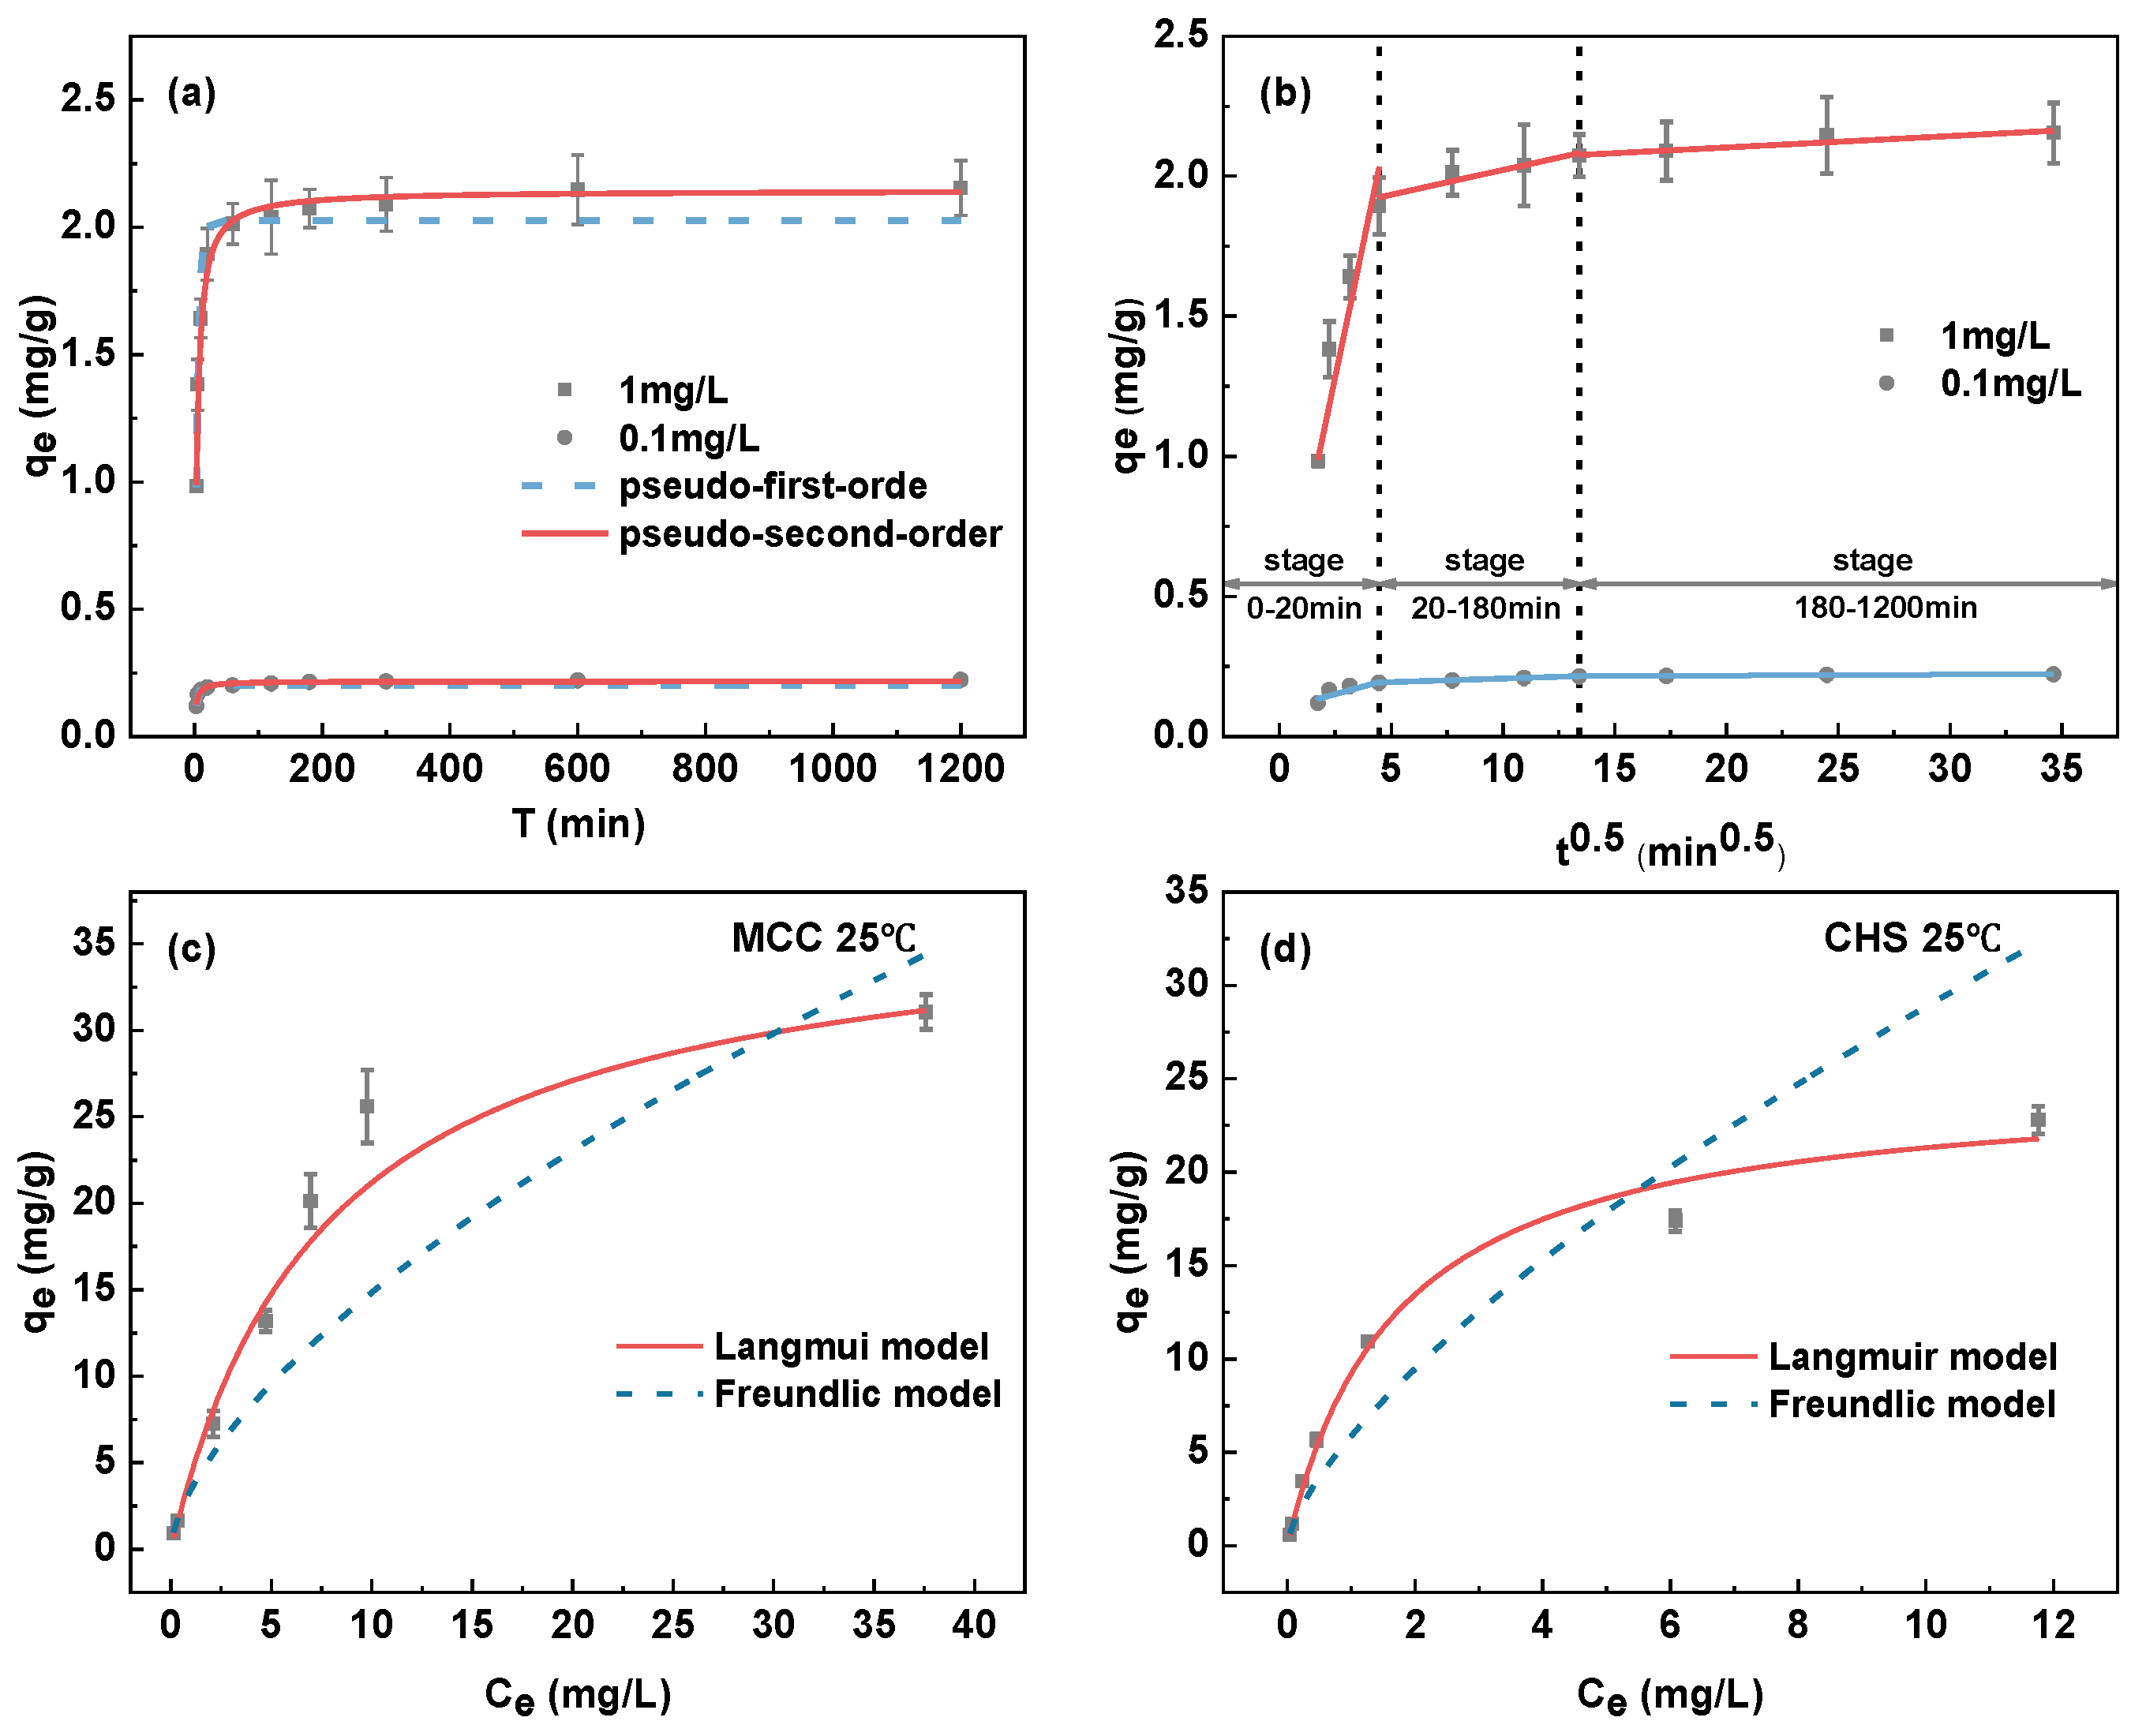
3.3.5. Adsorption Kinetics

| Initial Concentration | Pseudo-First-Order | Pseudo-Second-Order | |||||||||
|---|---|---|---|---|---|---|---|---|---|---|---|
| k1 | SD (k1) | qe | SD (qe) | R2 | k2 | SD (k2) | qe | SD (qe) | R2 | ||
| 0.1 mg/L | 0.278 | 0.031 | 0.209 | 0.004 | 0.878 | 2.231 | 0.261 | 0.216 | 0.003 | 0.949 | |
| 1 mg/L | 0.200 | 0.017 | 2.057 | 0.034 | 0.946 | 0.153 | 0.010 | 2.132 | 0.018 | 0.988 | |
| Adsorbent | Dose (g/L) | pH | te(h) | Model | |||||||
| Iron-coated cork granulates | 2.5 | 6 | 24 | Elovich | [54] | ||||||
| Fe3O4/Fe2O3/CNs | 1 | 5 | 3 | pseudo-second-orde | [44] | ||||||
| Fe3O4/BC | 2 | pseudo-second-order | [63] | ||||||||
| CNT-SH | 2.5 | 7 | 2.5 | pseudo-second-orde | [64] | ||||||
| CNT-I | 2.5 | 7 | 3 | pseudo-second-orde | [64] | ||||||
| MnFe2O4–biochar | 1 | 7 | 12 | pseudo-second-orde | [65] | ||||||
| Initial Concentration | Stage1 | Stage2 | Stage3 | |||
|---|---|---|---|---|---|---|
| kd1 | C1 | kd2 | C2 | kd3 | C3 | |
| 0.1 mg/L | 0.023 | 0.097 | 0.003 | 0.181 | 0.0003 | 0.211 |
| 1 mg/L | 0.308 | 0.581 | 0.019 | 1.831 | 0.004 | 2.026 |
3.3.6. Adsorption Isotherms
3.3.7. Summary of Sorption Mechanism
3.4. Environmental Impact and Sustainability
4. Conclusions
Author Contributions
Funding
Institutional Review Board Statement
Informed Consent Statement
Data Availability Statement
Conflicts of Interest
References
- Lai, Z.; He, M.; Lin, C.; Ouyang, W.; Liu, X. Interactions of antimony with biomolecules and its effects on human health. Ecotoxicol. Environ. Saf. 2022, 233, 113317. [Google Scholar] [CrossRef] [PubMed]
- Li, J.; Zheng, B.; He, Y.; Zhou, Y.; Chen, X.; Ruan, S.; Yang, Y.; Dai, C.; Tang, L. Antimony contamination, consequences and removal techniques: A review. Ecotoxicol. Environ. Saf. 2018, 156, 125–134. [Google Scholar] [CrossRef] [PubMed]
- He, M.; Wang, X.; Wu, F.; Fu, Z. Antimony pollution in China. Sci. Total Environ. 2012, 421–422, 41–50. [Google Scholar] [CrossRef] [PubMed]
- Filella, M.; Belzile, N.; Chen, Y. Antimony in the environment: A review focused on natural waters: I. Occur. Earth-Sci. Rev. 2002, 57, 125–176. [Google Scholar] [CrossRef]
- Fu, X.; Xie, X.; Charlet, L.; He, J. A review on distribution, biogeochemistry of antimony in water and its environmental risk. J. Hydrol. 2023, 625, 130043. [Google Scholar] [CrossRef]
- Gan, Y.; Ding, C.; Xu, B.; Liu, Z.; Zhang, S.; Cui, Y.; Wu, B.; Huang, W.; Song, X. Antimony (Sb) pollution control by coagulation and membrane filtration in water/wastewater treatment: A comprehensive review. J. Hazard. Mater. 2023, 442, 130072. [Google Scholar] [CrossRef] [PubMed]
- Deng, S.; Ren, B.; Hou, B.; Deng, R.; Cheng, S. Antimony-complexed heavy metal wastewater in antimony mining areas: Source, risk and treatment. Environ. Technol. Innov. 2023, 32, 103355. [Google Scholar] [CrossRef]
- Hu, X.; You, S.; Li, F.; Liu, Y. Recent advances in antimony removal using carbon-based nanomaterials: A review. Front. Environ. Sci. Eng. 2022, 16, 48. [Google Scholar] [CrossRef]
- Peng, L.; Wang, N.; Xiao, T.; Wang, J.; Quan, H.; Fu, C.; Kong, Q.; Zhang, X. A critical review on adsorptive removal of antimony from waters: Adsorbent species, interface behavior and interaction mechanism. Chemosphere 2023, 327, 138529. [Google Scholar] [CrossRef] [PubMed]
- Zhu, J.; Wu, F.; Pan, X.; Guo, J.; Wen, D. Removal of antimony from antimony mine flotation wastewater by electrocoagulation with aluminum electrodes. J. Environ. Sci. 2011, 23, 1066–1071. [Google Scholar] [CrossRef]
- Ozdemir, N.; Soylak, M.; Elci, L.; Dogan, M. Speciation analysis of inorganic Sb(III) and Sb(V) ions by using mini column filled with Amberlite XAD-8 resin. Anal. Chim. Acta 2004, 505, 37–41. [Google Scholar] [CrossRef]
- Mohan, K.; Rajan, D.K.; Rajarajeswaran, J.; Divya, D.; Ganesan, A.R. Recent trends on chitosan based hybrid materials for wastewater treatment: A review. Curr. Opin. Environ. Sci. Health 2023, 33, 100473. [Google Scholar] [CrossRef]
- Abdullah, N.H.; Borhan, A.; Saadon, S.Z.A.H. Biosorption of wastewater pollutants by chitosan-based porous carbons: A sustainable approach for advanced wastewater treatment. Bioresour. Technol. Rep. 2024, 25, 101705. [Google Scholar] [CrossRef]
- Saheed, I.O.; Oh, W.D.; Suah, F.B.M. Chitosan modifications for adsorption of pollutants—A review. J. Hazard. Mater. 2021, 408, 124889. [Google Scholar] [CrossRef] [PubMed]
- Kamran, U.; Park, S. Tuning ratios of KOH and NaOH on acetic acid-mediated chitosan-based porous carbons for improving their textural features and CO2 uptakes. J. CO2 Util. 2020, 40, 101212. [Google Scholar] [CrossRef]
- Wu, L.; Qi, S.; Zhang, T.; Jin, Y.; Xiao, H. One-step carbonization/activation synthesis of chitosan-based porous sheet-like carbon and studies of adsorptive removal for Rhodamine B. Carbohydr. Polym. 2024, 330, 121832. [Google Scholar] [CrossRef] [PubMed]
- Wu, Z.; Deng, W.; Tang, S.; Ruiz-Hitzky, E.; Luo, J.; Wang, X. Pod-inspired MXene/porous carbon microspheres with ultrahigh adsorption capacity towards crystal violet. Chem. Eng. J. 2021, 426, 130776. [Google Scholar] [CrossRef]
- Ramkumar, K.; Prabhu, S.M.; Farzana, M.H.; Kumar, R.; Jeon, B.; Meenakshi, S. Effective arsenite adsorption from aqueous solution using N- and S-functionalized tetragonal nano-zirconia on chitosan-derived carbon. Sep. Purif. Technol. 2023, 306, 122669. [Google Scholar] [CrossRef]
- Li, J.; Su, J.; Yang, Q.; Yang, Z. Hydrothermal synthesis of Zr-doped chitosan carbon-shell protected magnetic composites (Zr–Fe3O4@C) for stable removal of Cr(VI) from water: Enhanced adsorption and pH adaptability. Mater. Chem. Phys. 2023, 306, 128057. [Google Scholar] [CrossRef]
- Zhang, W.; Zhang, J.; Dong, X.; Li, M.; He, Q.; Zhao, S.; Xie, L. Fluorinated metal–organic frameworks for enhanced stability and iodine adsorption selectivity under humid conditions. Chem. Eng. J. 2023, 461, 142058. [Google Scholar] [CrossRef]
- Xiao, W.; Jiang, X.; Liu, X.; Zhou, W.; Garba, Z.N.; Lawan, I.; Wang, L.; Yuan, Z. Adsorption of organic dyes from wastewater by metal-doped porous carbon materials. J. Clean. Prod. 2021, 284, 124773. [Google Scholar] [CrossRef]
- Nithya, R.; Thirunavukkarasu, A.; Sathya, A.B.; Sivashankar, R. Magnetic materials and magnetic separation of dyes from aqueous solutions: A review. Environ. Chem. Lett. 2021, 19, 1275–1294. [Google Scholar] [CrossRef]
- Ambashta, R.D.; Sillanpää, M. Water purification using magnetic assistance: A review. J. Hazard. Mater. 2010, 180, 38–49. [Google Scholar] [CrossRef] [PubMed]
- Ahmed, M.J.K.; Ahmaruzzaman, M. A facile synthesis of Fe3O4–charcoal composite for the sorption of a hazardous dye from aquatic environment. J. Environ. Manag. 2015, 163, 163–173. [Google Scholar] [CrossRef] [PubMed]
- Dai, K.; Chen, P.; Wang, Z.; Yang, P.; Li, M.; Tang, C.; Zhuang, W.; Zhu, C.; Ying, H.; Wu, J. Magnetic composite Ca(OH)2/Fe3O4 for highly efficient flocculation in papermaking black liquor without pH neutralization. Adv. Powder Technol. 2021, 32, 2457–2468. [Google Scholar] [CrossRef]
- Xiao, B.; Jia, J.; Wang, W.; Zhang, B.; Ming, H.; Ma, S.; Kang, Y.; Zhao, M. A review on magnetic biochar for the removal of heavy metals from contaminated soils: Preparation, application, and microbial response. J. Hazard. Mater. Adv. 2023, 10, 100254. [Google Scholar] [CrossRef]
- Zeng, H.; Zhao, W.; Sun, S.; Sun, X.; Zeng, Y.; Hao, R.; Zhang, J.; Li, D. Facile preparation of maghemite based on iron sludge for arsenic removal from water. Sci. Total Environ. 2024, 906, 167575. [Google Scholar] [CrossRef] [PubMed]
- Yang, K.; Zhou, J.; Lv, D.; Sun, Y.; Lou, Z.; Xu, X. Preparation and Application of Iron-Based Composite Materials for the Removal of Antimony from Aqueous Solution. Prog. Chem. 2017, 29, 1407–1421. [Google Scholar] [CrossRef]
- Zeng, H.; Yu, Y.; Wang, F.; Zhang, J.; Li, D. Arsenic(V) removal by granular adsorbents made from water treatment residuals materials and chitosan. Colloids Surf. A Physicochem. Eng. Asp. 2020, 585, 124036. [Google Scholar] [CrossRef]
- Deng, S.; Ren, B.; Hou, B.; Deng, X.; Deng, R.; Zhu, G.; Cheng, S. Adsorption of Sb(III) and Pb(II) in wastewater by magnetic γ-Fe2O3-loaded sludge biochar: Performance and mechanisms. Chemosphere 2024, 349, 140914. [Google Scholar] [CrossRef] [PubMed]
- Sevilla, M.; Mokaya, R. Energy storage applications of activated carbons: Supercapacitors and hydrogen storage. Energy Environ. Sci. 2014, 7, 125–128. [Google Scholar] [CrossRef]
- Ma, Z.; Guan, Y.; Liu, H. Synthesis and characterization of micron-sized monodisperse superparamagnetic polymer particles with amino groups. J. Polym. Sci. Part A Polym. Chem. 2005, 43, 3433–3439. [Google Scholar] [CrossRef]
- Xu, X.; Yang, J.; Hao, G.; Tan, M.; Gao, L.; Yang, Z. Versatile dodecyl trimethyl ammonium bromide modified γ-FeOOH for simultaneous removal and determination of As(V). Anal. Chim. Acta 2023, 1264, 341310. [Google Scholar] [CrossRef] [PubMed]
- Sajomsang, W.; Ruktanonchai, U.R.; Gonil, P.; Nuchuchua, O. Mucoadhesive property and biocompatibility of methylated N-aryl chitosan derivatives. Carbohydr. Polym. 2009, 78, 945–952. [Google Scholar] [CrossRef]
- Tang, X.; Huang, J.; Liu, K.; Feng, Q.; Li, Z.; Ao, M. Synthesis of magnetically separable MnO2/Fe3O4/silica nanofiber composite with enhanced Fenton-like catalytic activity for degradation of Acid Red 73. Surf. Coat. Technol. 2018, 354, 18–27. [Google Scholar] [CrossRef]
- Yeamsuksawat, T.; Zhao, H.; Liang, J. Characterization and antimicrobial performance of magnetic Fe3O4@Chitosan@Ag nanoparticles synthesized via suspension technique. Mater. Today Commun. 2021, 28, 102481. [Google Scholar] [CrossRef]
- Li, H.; Wei, Y.; Wang, Y.; Zhao, Y.; Wang, L.; Feng, J.; Sun, F. Cooperative adsorption of Sb(V) in water by magnetic MgFe2O4-biochar composite beads. Colloids Surf. A Physicochem. Eng. Asp. 2024, 684, 133133. [Google Scholar] [CrossRef]
- Chen, H.; Gao, Y.; El-Naggar, A.; Niazi, N.K.; Sun, C.; Shaheen, S.M.; Hou, D.; Yang, X.; Tang, Z.; Liu, Z.; et al. Enhanced sorption of trivalent antimony by chitosan-loaded biochar in aqueous solutions: Characterization, performance and mechanisms. J. Hazard. Mater. 2022, 425, 127971. [Google Scholar] [CrossRef] [PubMed]
- Su, C.; Liu, Y.; Yang, Y.; Gao, T.; Qi, T.; Wang, Y. Evolution of aromatic structure and nanopores in shale kerogen by using in-situ HRTEM and in-situ FT-IR experiment. Fuel 2024, 359, 130479. [Google Scholar] [CrossRef]
- Philippou, K.; Anastopoulos, I.; Dosche, C.; Pashalidis, I. Synthesis and characterization of a novel Fe3O4-loaded oxidized biochar from pine needles and its application for uranium removal. Kinetic, thermodynamic, and mechanistic analysis. J. Environ. Manag. 2019, 252, 109677. [Google Scholar] [CrossRef] [PubMed]
- Xiong, N.; Wan, P.; Zhu, G.; Xie, F.; Xu, S.; Zhu, C.; Hursthouse, A.S. Sb(III) removal from aqueous solution by a novel nano-modified chitosan (NMCS). Sep. Purif. Technol. 2020, 236, 116266. [Google Scholar] [CrossRef]
- Meng, Z.; Wu, J.; Huang, S.; Xin, L.; Zhao, Q. Competitive adsorption behaviors and mechanisms of Cd, Ni, and Cu by biochar when coexisting with microplastics under single, binary, and ternary systems. Sci. Total Environ. 2024, 913, 169524. [Google Scholar] [CrossRef]
- Zhang, X.; Liu, Y.; Li, C.; Tian, L.; Yuan, F.; Zheng, S.; Sun, Z. Fast and lasting electron transfer between γ-FeOOH and g-C3N4/kaolinite containing N vacancies for enhanced visible-light-assisted peroxymonosulfate activation. Chem. Eng. J. 2022, 429, 132374. [Google Scholar] [CrossRef]
- Ren, S.; Ai, Y.; Zhang, X.; Ruan, M.; Hu, Z.; Liu, L.; Li, J.; Wang, Y.; Liang, J.; Jia, H.; et al. Recycling Antimony(III) by Magnetic Carbon Nanospheres: Turning Waste to Recoverable Catalytic for Synthesis of Esters and Triazoles. ACS Sustain. Chem. Eng. 2020, 8, 469–477. [Google Scholar] [CrossRef]
- Yu, G.; Fu, F. Exploration of different adsorption performance and mechanisms of core-shell Fe3O4@Ce-Zr oxide composites for Cr(VI) and Sb(III). J. Colloid Interface Sci. 2020, 576, 10–20. [Google Scholar] [CrossRef] [PubMed]
- Yamashita, T.; Hayes, P. Analysis of XPS spectra of Fe2+ and Fe3+ ions in oxide materials. Appl. Surf. Sci. 2008, 254, 2441–2449. [Google Scholar] [CrossRef]
- Zeng, J.; Qi, P.; Shi, J.; Pichler, T.; Wang, F.; Wang, Y.; Sui, K. Chitosan functionalized iron nanosheet for enhanced removal of As(III) and Sb(III): Synergistic effect and mechanism. Chem. Eng. J. 2020, 382, 122999. [Google Scholar] [CrossRef]
- Li, J.; Li, X.; Hayat, T.; Alsaedi, A.; Chen, C. Screening of Zirconium-Based Metal–Organic Frameworks for Efficient Simultaneous Removal of Antimonite (Sb(III)) and Antimonate (Sb(V)) from Aqueous Solution. ACS Sustain. Chem. Eng. 2017, 5, 11496–11503. [Google Scholar] [CrossRef]
- Cui, X.; Ni, Q.; Lin, Q.; Khan, K.Y.; Li, T.; Khan, M.B.; He, Z.; Yang, X. Simultaneous sorption and catalytic oxidation of trivalent antimony by Canna indica derived biochars. Environ. Pollut. 2017, 229, 394–402. [Google Scholar] [CrossRef] [PubMed]
- Gao, Y.; Chen, H.; Fang, Z.; Niazi, N.K.; Adusei-Fosu, K.; Li, J.; Yang, X.; Liu, Z.; Bolan, N.S.; Gao, B.; et al. Coupled sorptive and oxidative antimony(III) removal by iron-modified biochar: Mechanisms of electron-donating capacity and reactive Fe species. Environ. Pollut. 2023, 337, 122637. [Google Scholar] [CrossRef]
- Dang, A.; Liu, X.; Wang, Y.; Liu, Y.; Cheng, T.; Zada, A.; Ye, F.; Deng, W.; Sun, Y.; Zhao, T.; et al. High-efficient adsorption for versatile adsorbates by elastic reduced graphene oxide/Fe3O4 magnetic aerogels mediated by carbon nanotubes. J. Hazard. Mater. 2023, 457, 131846. [Google Scholar] [CrossRef] [PubMed]
- Tu, Y.; Wang, S.; Lu, Y.; Chan, T.; Johnston, C.T. New insight in adsorption of Sb(III)/Sb(V) from waters using magnetic nanoferrites: X-ray absorption spectroscopy investigation. J. Mol. Liq. 2021, 330, 115691. [Google Scholar] [CrossRef]
- Bian, P.; Gao, B.; Zhu, J.; Yang, H.; Li, Y.; Ding, E.; Liu, Y.; Liu, Y.; Wang, S.; Shen, W. Adsorption of chitosan combined with nicotinamide-modified eupatorium adenophorum biochar to Sb3+: Application of DFT calculation. Int. J. Biol. Macromol. 2023, 240, 124273. [Google Scholar] [CrossRef] [PubMed]
- Pintor, A.M.A.; Vieira, B.R.C.; Boaventura, R.A.R.; Botelho, C.M.S. Removal of antimony from water by iron-coated cork granulates. Sep. Purif. Technol. 2020, 233, 116020. [Google Scholar] [CrossRef]
- Shan, C.; Ma, Z.; Tong, M. Efficient removal of trace antimony(III) through adsorption by hematite modified magnetic nanoparticles. J. Hazard. Mater. 2014, 268, 229–236. [Google Scholar] [CrossRef] [PubMed]
- Wijnja, H.; Schulthess, C.P. Vibrational Spectroscopy Study of Selenate and Sulfate Adsorption Mechanisms on Fe and Al (Hydr)oxide Surfaces. J. Colloid Interface Sci. 2000, 229, 286–297. [Google Scholar] [CrossRef] [PubMed]
- Brechbühl, Y.; Christl, I.; Elzinga, E.J.; Kretzschmar, R. Competitive sorption of carbonate and arsenic to hematite: Combined ATR-FTIR and batch experiments. J. Colloid Interface Sci. 2012, 377, 313–321. [Google Scholar] [CrossRef] [PubMed]
- Wang, H.; Zhu, J.; Fu, Q.; Xiong, J.; Hong, C.; Hu, H.; Violante, A. Adsorption of Phosphate onto Ferrihydrite and Ferrihydrite-Humic Acid Complexes. Pedosphere 2015, 25, 405–414. [Google Scholar] [CrossRef]
- Khare, N.; Hesterberg, D.; Martin, J.D. XANES investigation of phosphate sorption in single and binary systems of iron and aluminum oxide minerals. Environ. Sci. Technol. 2005, 39, 2152–2160. [Google Scholar] [CrossRef] [PubMed]
- Liang, Y.; Wang, Z.; Xu, Z.; Li, S.; Luo, H.; Xu, C.; Cui, X. Highly-confined, micro-Sb/C@MXene 3D architectures with strengthened interfacial bonding for high volumetric sodium-ion storage. Appl. Surf. Sci. 2024, 651, 159234. [Google Scholar] [CrossRef]
- Zhai, K.; Huang, H.; Li, X.; Fu, C.; Long, H.; Wang, W.; Liu, C.; Xie, M.; Ma, D. 3D network and wrapping strategy derived loofah-like Sb@CNTs@C for high performance K+/Na+ storage. J. Alloys Compd. 2024, 976, 172953. [Google Scholar] [CrossRef]
- Zhao, Z.; Wang, X.; Zhao, C.; Zhu, X.; Du, S. Adsorption and desorption of antimony acetate on sodium montmorillonite. J. Colloid Interface Sci. 2010, 345, 154–159. [Google Scholar] [CrossRef] [PubMed]
- Liang, J.; Hu, Z.; Zhang, X.; Ai, Y.; Wang, Y.; Ding, K.; Gao, J.; Wang, J.; Niu, D.; Sun, H. Recovery of antimony using biological waste and stepwise resourcization as catalysts for both polyesterification and transfer hydrogenation. Colloids Surf. A Physicochem. Eng. Asp. 2022, 635, 128119. [Google Scholar] [CrossRef]
- Mishra, S.; Sankararamakrishnan, N. Characterization, evaluation, and mechanistic insights on the adsorption of antimonite using functionalized carbon nanotubes. Environ. Sci. Pollut. Res. Int. 2018, 25, 12686–12701. [Google Scholar] [CrossRef] [PubMed]
- Wang, Y.; Ji, H.; Lu, H.; Liu, Y.; Yang, R.; He, L.; Yang, S. Simultaneous removal of Sb(iii) and Cd(ii) in water by adsorption onto a MnFe2O4–biochar nanocomposite. RSC Adv. 2018, 8, 3264–3273. [Google Scholar] [CrossRef] [PubMed]
- Yang, X.; Shi, Z.; Yuan, M.; Liu, L. Adsorption of Trivalent Antimony from Aqueous Solution Using Graphene Oxide: Kinetic and Thermodynamic Studies. J. Chem. Eng. Data 2015, 60, 806–813. [Google Scholar] [CrossRef]
- Leng, Y.; Guo, W.; Su, S.; Yi, C.; Xing, L. Removal of antimony(III) from aqueous solution by graphene as an adsorbent. Chem. Eng. J. 2012, 211–212, 406–411. [Google Scholar] [CrossRef]


| Initial Concentration | Langmuir | Freundlich | ||||||||
|---|---|---|---|---|---|---|---|---|---|---|
| kL | SD (kL) | qmax | SD (qmax) | R2 | kF | SD (kF) | 1/n | SD (1/n) | R2 | |
| CHS | 0.584 | 0.053 | 24.956 | 1.651 | 0.992 | 5.863 | 0.875 | 0.440 | 0.059 | 0.822 |
| MCC | 0.144 | 0.014 | 38.234 | 2.751 | 0.969 | 7.607 | 0.400 | 0.413 | 0.044 | 0.878 |
| Adsorbent | SSA | The Medicine for Preparation Adsorbent | Qm (mg/g) | References |
|---|---|---|---|---|
| MCC | 52.63 | Chitosan, iron sludge | 38.234 | This study |
| Fe3O4/Fe2O3/CNs | 192.6 | FeCl3·6H2O, Fe3O4, carbon nanosphere | 234.3 | [44] |
| Fe2O3/CNs | 134.9 | FeCl3·6H2O, carbon nanosphere | 102.8 | [44] |
| CNT-I | 105.78 | CNT, KI | 200 | [64] |
| CNT-SH | 111.89 | CNT, HS(CH2)2OH | 140.85 | [64] |
| MnFe2O4–biochar | 30.38 | a tea branch, FeSO4·7H2O, KMnO4 | 237.53 | [65] |
| BC/Fe3O4 | Dried pomelo peel, FeCl3·6H2O FeSO4·7H2O | 246.19 | [63] | |
| BC-γFe2O3 | 77.924 | Sludge, FeCl3·6H2O | 45.25 | [30] |
| Fe3O4 | Fe3O4 | 19.9 | [55] | |
| GO | 315.6 | GO | 36.5 | [66] |
| graphene | 2630 | graphene | 8.056 | [67] |
Disclaimer/Publisher’s Note: The statements, opinions and data contained in all publications are solely those of the individual author(s) and contributor(s) and not of MDPI and/or the editor(s). MDPI and/or the editor(s) disclaim responsibility for any injury to people or property resulting from any ideas, methods, instructions or products referred to in the content. |
© 2024 by the authors. Licensee MDPI, Basel, Switzerland. This article is an open access article distributed under the terms and conditions of the Creative Commons Attribution (CC BY) license (https://creativecommons.org/licenses/by/4.0/).
Share and Cite
Zeng, H.; Xu, H.; Zeng, Y.; Sun, S.; Zhang, J.; Li, D. Facile Preparation of Magnetic Chitosan Carbon Based on Recycling of Iron Sludge for Sb(III) Removal. Sustainability 2024, 16, 2788. https://doi.org/10.3390/su16072788
Zeng H, Xu H, Zeng Y, Sun S, Zhang J, Li D. Facile Preparation of Magnetic Chitosan Carbon Based on Recycling of Iron Sludge for Sb(III) Removal. Sustainability. 2024; 16(7):2788. https://doi.org/10.3390/su16072788
Chicago/Turabian StyleZeng, Huiping, He Xu, Yuwei Zeng, Siqi Sun, Jie Zhang, and Dong Li. 2024. "Facile Preparation of Magnetic Chitosan Carbon Based on Recycling of Iron Sludge for Sb(III) Removal" Sustainability 16, no. 7: 2788. https://doi.org/10.3390/su16072788
APA StyleZeng, H., Xu, H., Zeng, Y., Sun, S., Zhang, J., & Li, D. (2024). Facile Preparation of Magnetic Chitosan Carbon Based on Recycling of Iron Sludge for Sb(III) Removal. Sustainability, 16(7), 2788. https://doi.org/10.3390/su16072788