Article

Travel Characteristics of Urban Residents Based on Taxi Trajectories in China: Beijing, Shanghai, Shenzhen, and Wuhan

1
School of Computer Science, Hubei University of Technology, Wuhan 430068, China
2
Aerospace Information Research Institute, Chinese Academy of Sciences, Beijing 100094, China
3
Zhejiang Academy of Agricultural Sciences, Hangzhou 310021, China
4
School of Remote Sensing and Information Engineering, Wuhan University, Wuhan 430072, China
*
Author to whom correspondence should be addressed.
Sustainability 2024, 16(7), 2694; https://doi.org/10.3390/su16072694
Submission received: 22 January 2024 / Revised: 5 March 2024 / Accepted: 22 March 2024 / Published: 25 March 2024

Abstract

:
With the advancement of urban modernization, more and more residents are flocking to large cities, leading to problems such as severe traffic congestion, uneven distribution of spatial resources, and deterioration of the urban environment. These challenges pose a serious threat to the coordinated development of cities. In order to better understand the travel behavior of metropolitan residents and provide valuable insights for urban planning, this study utilizes taxi trajectory data from the central areas of Beijing, Shanghai, Shenzhen, and Wuhan. First, the relationship between daytime taxi drop-off points and urban amenities is explored using Ordinary Least Squares (OLS). Subsequently, Geographically Weighted Regression (GWR) techniques were applied to identify spatial differences in these urban drivers. The results show that commonalities emerge across the four cities in the interaction between external transport stops and commercial areas. In addition, the average daily travel patterns of residents in these four cities show a trend of “three peaks and three valleys”, indicating the commonality of travel behavior. In summary, this study explores the travel characteristics of urban residents, which can help urban planners understand travel patterns more effectively. This is crucial for the strategic allocation of transport resources across regions, the promotion of sustainable urban transport, and the reduction in carbon emissions.

1. Introduction

Since China’s reform and opening up, the country has witnessed a new era of rapid social, cultural, and economic development, particularly in its key cities. These urban centers have rapidly evolved towards higher urbanization and modernization. People are continually moving to cities that offer better development opportunities and more concentrated resources [1]. This increase in urban population density has led to several urban contradictions, such as traffic congestion, uneven distribution of spatial resources, and environmental degradation [2,3,4]. Solving these urban conflicts is important for improving urban traffic conditions, rationalizing urban planning and construction, and promoting high-quality urban development, which is conducive to the construction of livable cities and achieving Sustainable Development Goals (SDGs) 11.
In recent years, taxis have become an integral part of the urban public transportation system and hold a significant position [5]. Compared to urban public rail transit and bus transport services, taxis offer unique flexibility and convenience, making them a widely used travel tool among urban residents. In recent years, as the population in large cities continues to grow, residents’ travel needs have become increasingly diverse, and traffic congestion has become more normalized [6,7]. There is an inseparable relationship between the emergence of urban traffic congestion and other problems and the travel behavior of urban residents [8]. In large cities, residents spend a significant amount of time commuting daily, posing a serious threat to social and economic development and human well-being, leading to severe economic losses and ecological environment deterioration [9]. Furthermore, the increased CO2 emissions caused by traffic congestion also pose challenges to the sustainable urban environment. Urban transportation planning, being a crucial part of urban planning, can significantly affect the development process of cities. Hence, studying residents’ travel characteristics is of far-reaching significance for improving urban traffic conditions, optimizing resource allocation, mitigating environmental pollution, and enhancing rational urban planning [10,11,12].
Some scholars have utilized taxi trajectory data for various purposes, such as recommending optimized navigation routes for drivers and studying urban population flow patterns and energy consumption distributions [13,14,15]. There are also a number of scholars who devote themselves to related model optimization research, which enhances the research speed and the stability and correctness of the algorithmic models. For example, Liu proposes a Privacy-Preserving Reputation Update based scheme (PPRU), which aims to solve the problems of high computation and communication overhead and insufficient privacy protection in existing schemes, and shows significant advantages in theoretical and simulation evaluations [16]. Guo proposes a trust assessment scheme for joint learning in Digital Twin for Mobile Networks (DTMNs). This scheme addresses limitations found in existing methods, particularly the reliance on single assessment factors and coarse-grained trust computation methods. Through comprehensive experiments, Guo demonstrates the effectiveness and superiority of the proposed scheme [17]. Meanwhile, taxi trajectory data are widely used in other applications. For example, in the area of urban environmental pollution, Zhao proposed using taxi trajectories to predict the future evolution of vehicle emissions [18]. In urban planning, Wang developed a fast-charging facility planning model based on taxi trajectory data to save investment and reduce the total waiting time for charging [19]. In healthcare, Su used taxi trajectory data to measure the accessibility of healthcare services [20]. In transportation planning, Kan proposed a method for detecting traffic congestion from the GPS trajectory of a cab at a turn, which can sense traffic congestion in a larger area at a much lower cost but does not take into account the urban morphology [21]. He used speed performance indicators to evaluate the congestion of the existing road network and then introduced road segment and road network congestion indicators to measure the congestion of urban road segments and road networks, respectively [22]. Zang proposed a time-varying TPI-based self-organizing mapping (SOM) algorithm for clustering traffic congestion into more detailed and accurate patterns, which is applicable to the clustering of TPIs in different years, and this method helps to make decisions based on the different congestion patterns to make decisions for traffic management [23]. He and Zang analyzed possible congested areas based on urban morphology but did not analyze them in conjunction with cab trajectories. Considering all these aspects, this study focuses on three key areas based on taxi trajectory data from four major cities: Beijing, Shanghai, Wuhan, and Shenzhen. Specifically, this study aims to (1) determine if travel volume varies between weekdays and weekends and assesses differences in travel volume across different times of the day; (2) examine significant variations in the frequency of vehicle boarding and deboarding activities at various locations; and (3) investigate how residents’ travel habits are influenced by urban morphology.

2. Materials and Methods
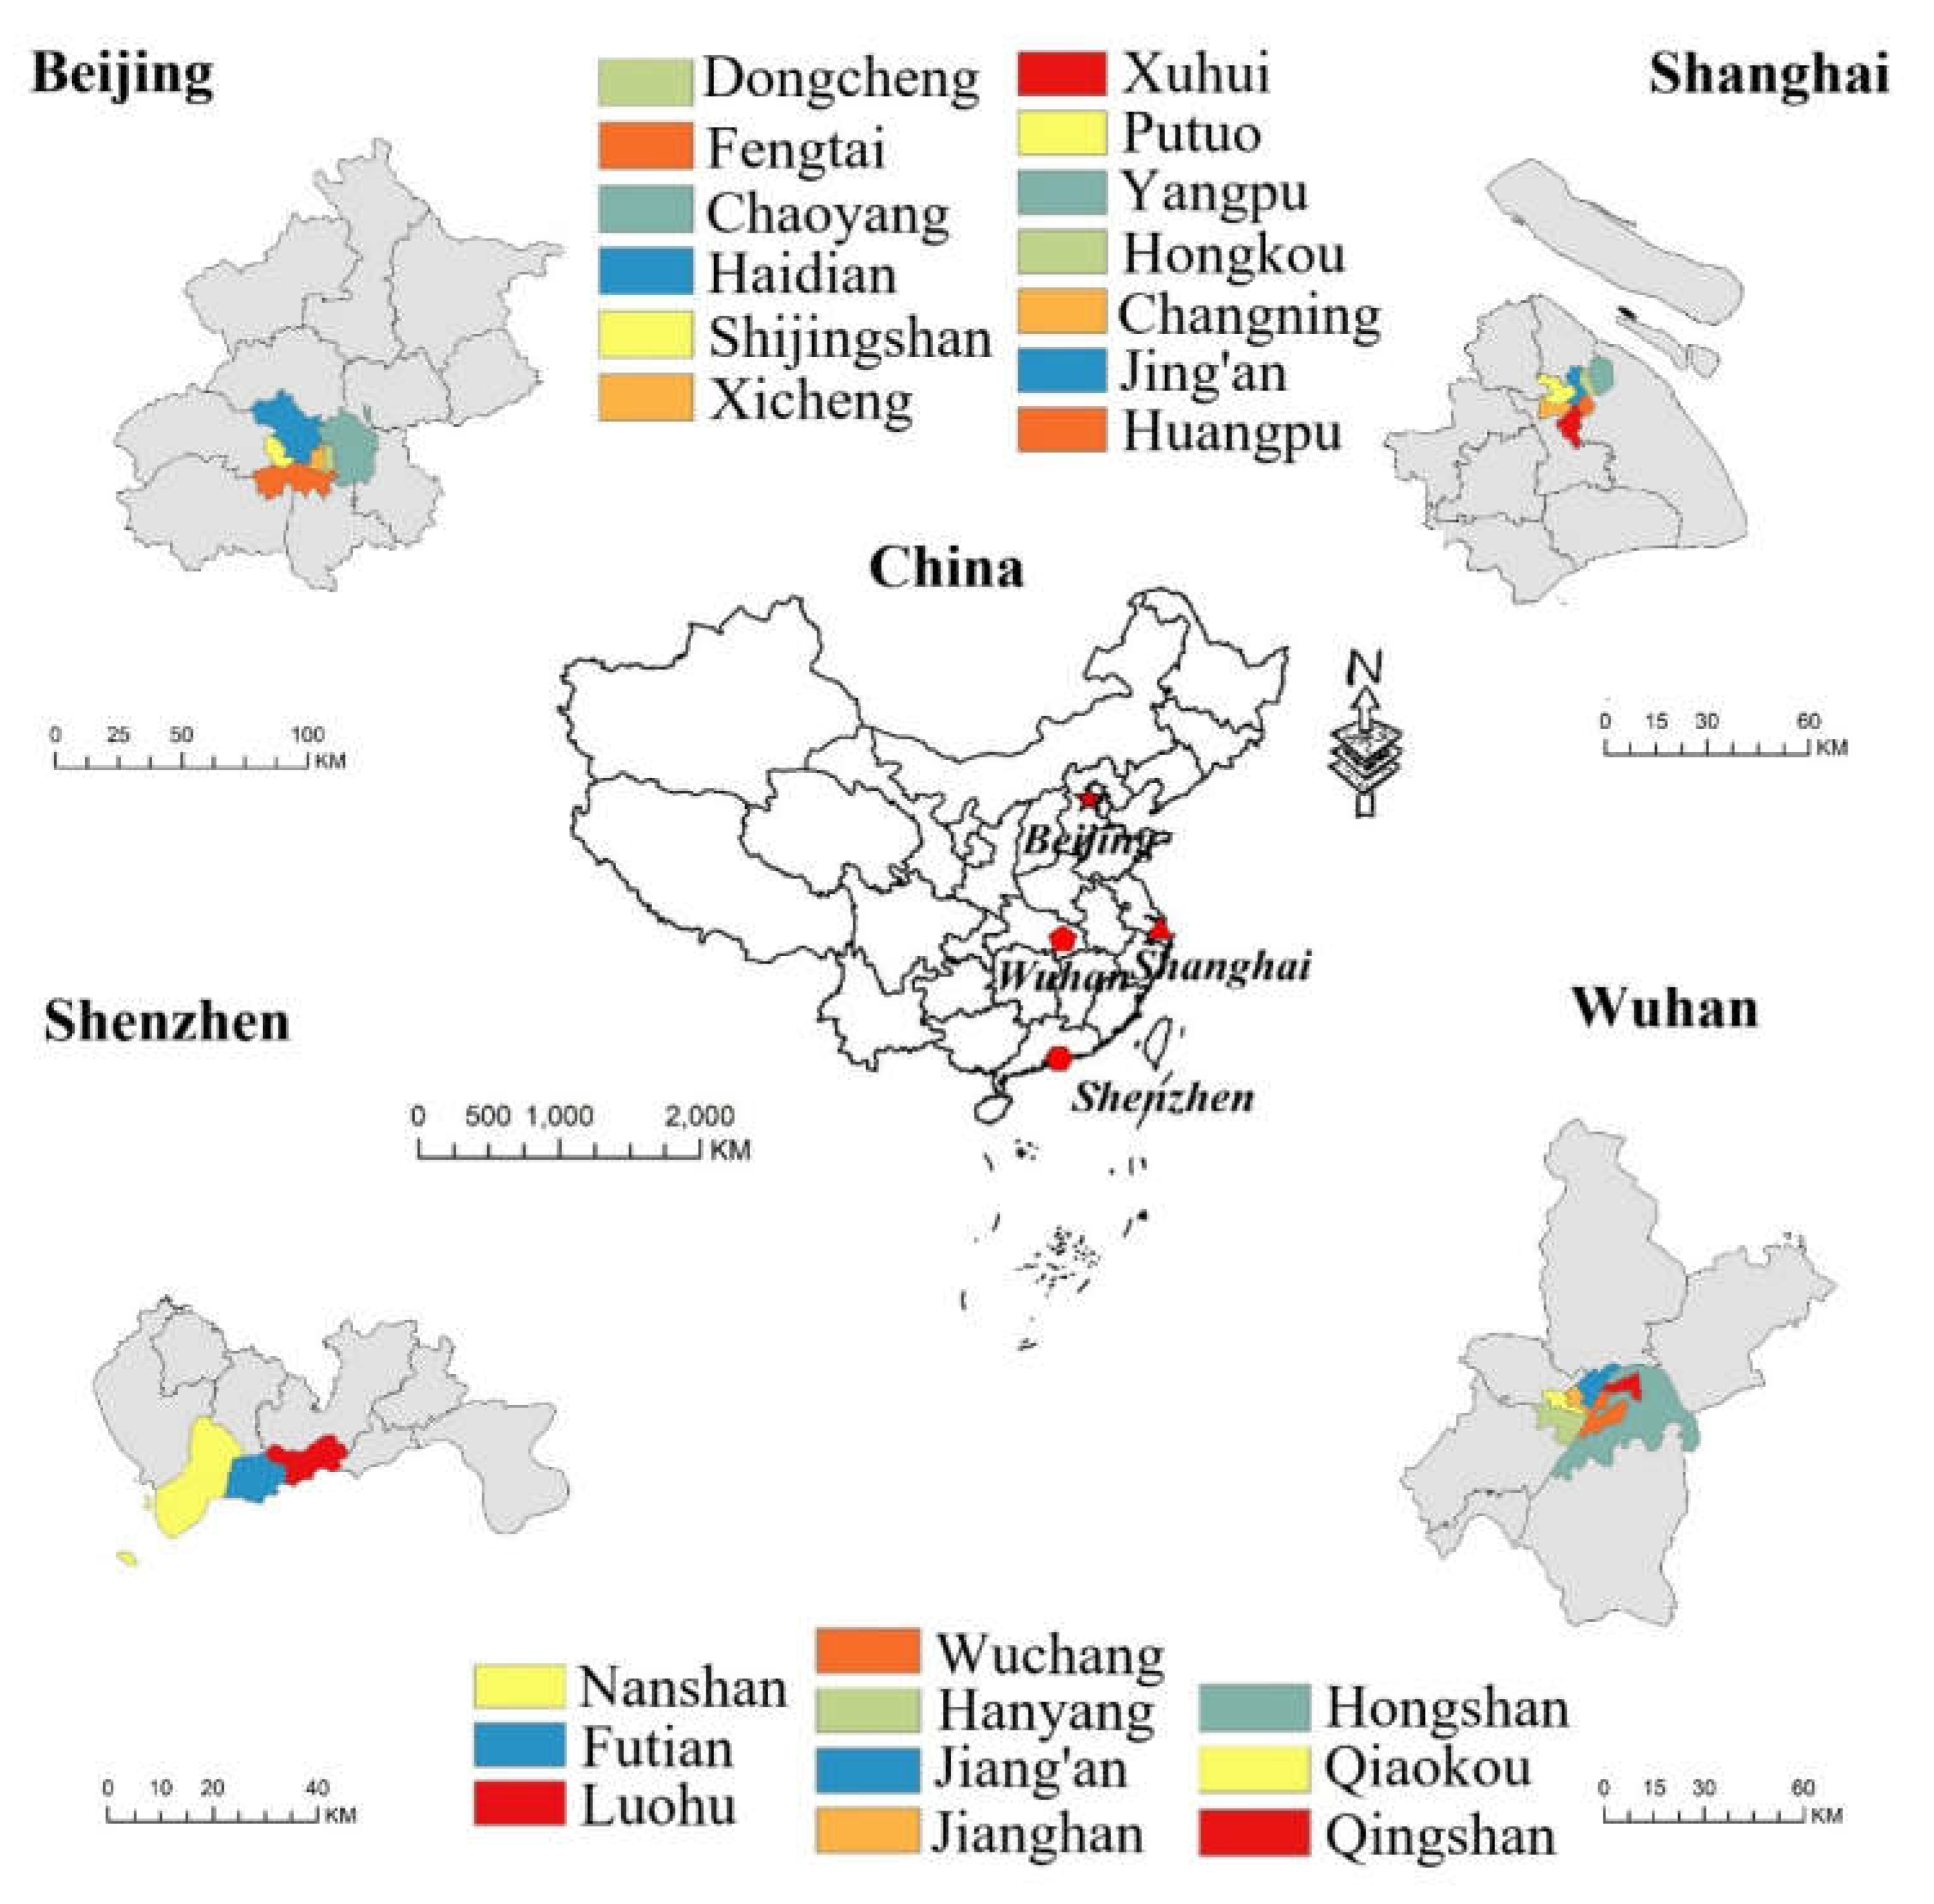
2.1. Study Area

This research examines urban travel behavior in four Chinese cities, each with distinct characteristics influencing transportation patterns. Beijing, the capital, is a political and financial center with a significant population and a dense network of rental cars. Shanghai, a coastal metropolis, is known for its large population and a substantial number of taxis, divided by the Huangpu River into two distinct areas. Shenzhen, a rapidly developing economic zone, combines a high population density with a robust taxi network. Finally, Wuhan, central China’s major transportation hub, is characterized by its strategic location and extensive taxi services, reflecting its role as a key inland transportation center.
This study selectively examines the central urban areas of Beijing, Shanghai, Shenzhen, and Wuhan, chosen based on their urban status, geographical significance, economic standing, population density, and traffic volume. The research area in Beijing includes Dongcheng, Xicheng, Chaoyang, Fengtai, Shijingshan, and Haidian districts. Shanghai’s focus encompasses Huangpu, Xuhui, Changning, Jing’an, Putuo, Hongkou, and Yangpu districts. In Shenzhen, the study targets the Futian, Luohu, and Nanshan districts. For Wuhan, the research is concentrated in Jiang’an, Jianghan, Qiaokou, Hanyang, Wuchang, Qingshan, and Hongshan districts. These study areas are shown in Figure 1.

2.2. Data

This research utilizes taxi GPS trajectory data from Beijing, Shanghai, Shenzhen, and Wuhan as the primary experimental dataset. This comprehensive dataset encompasses vehicle identifiers, timestamps of GPS data capture, real-time geographical coordinates (longitude and latitude), and passenger status. The Beijing dataset covers the period from 23 to 29 March 2015, distinguishing between weekdays (23–27 March) and weekends (28–29 March). The Shanghai dataset spans 1 to 7 May 2015, with the initial three days being holidays and the latter four as weekdays. The dataset for Shenzhen is from 1 to 7 December 2015, with 5–6 December as weekends. Wuhan’s data range from 1 to 8 May 2014, with an exception for 4–5 May; here, 1–3 May are holidays and 6–8 May are weekdays. These datasets, provided by the transportation departments of each city, varied in attributes and formats. To ensure consistency, they were standardized and cleansed to eliminate anomalies and accurately extract start and end point data for further analysis.

2.3. OLS

The Ordinary Least Squares (OLS) method is a commonly used regression analysis method for estimating parameters in a linear regression model. A linear regression model assumes a linear relationship between the dependent variable and one or more independent variables. The goal of OLS is to find a straight line or hyperplane that minimizes the sum of squares of the residuals between the actual observations and the model predictions. The model can be expressed as follows:
y = β 0 + i = 1 p β i x i + ε
where y is the dependent variable, x i is the independent variable, β 0 and β i are the parameters of the model, and ε is the error term, which represents the random error not explained by the model.
The goal of the multivariate least squares method is to find a set of parameters β 0 , β 1 , β 2 ,…, β p such that the sum of squares of the residuals between the observations and the predictions of the model is minimized. The residuals represent the difference between the observed values and the predicted values of the model. The objective function (sum of squared residuals) is as follows:
M i n i m i z e i = 1 n ε i 2
where ε i is the residual of the ith observation and n is the sample size.
By minimizing the objective function, an estimate of the parameters can be obtained. The formula for parameter estimation can be expressed in matrix form as follows:
β ^ = ( X T X ) 1 X T Y    
where β ^ is the vector of estimates of the parameters, X is the design matrix containing all the independent variables, and Y is the vector of observations of the dependent variable.
The OLS model was adopted to model and analyze daytime drop-off points and catering services (CS), financial and insurance services (FI), medical care services (MS), and external transportation facility services (ET) from a global perspective. CS has an important significance and role in modern society. It meets basic needs, contributes to economic development, transmits culture and traditions, facilitates socialization and communication, and promotes tourism, while also focusing on food safety and hygiene. The significance of FI is fourfold: Firstly, it is conducive to the prevention of financial risks and the stabilization of a country’s financial system; secondly, it is conducive to the protection of the interests of the vast number of depositors and the enhancement of bank credit in general; thirdly, it is conducive to the renovation of traditional concepts and the enhancement of the public’s awareness of risk; and fourthly, it is conducive to the enhancement of the supervision of the central bank and the alleviation of the burden on it. MS consider patients and certain social groups as the main service objects, use medical technology as the basic service means, and provide society with medical outputs and non-material forms of services that can satisfy people’s healthcare needs and bring practical benefits to people. With regard to ET, a more functional city generally has multiple modes of external transport; they are networked to serve the city according to their characteristics and adaptability.

2.4. GWR

Because of the spatial heterogeneity in variables, it is difficult to interpret certain coefficients of the OLS model from a global perspective [24]. To further explore the relationship between the independent variable and drop-off point during the day, we selected the Geographically Weighted Regression (GWR) model for experiments. The GWR model is a spatial regression model based on the idea of local smoothing and can effectively reflect the spatial heterogeneity in parameters. GWR is currently widely applied in the research fields of the urban ecological environment, mental health, and economy [25,26]. The model can be expressed by the following equation [27]:
y i = β 0 ( u i , v i ) + k = 1 p β k ( u i , v i ) x i k + ε i
where y i denotes the dependent variable, x i k denotes the independent variable, β 0 ( u i , v i ) is the intercept of sampling point i, k is the total number of grids, ( u i , v i ) denotes the geographic coordinates of sampling point i, ε i is the random error value, and β k ( u i , v i ) denotes the regression coefficient value for the k-th independent variable at sampling point i, which can be calculated with the following equation [28]:
β ( u i , v i ) = ( X T W ( u i , v i ) X ) 1 X T W ( u i , v i ) y
where W is the spatial weight, which is usually determined based on the kernel function and bandwidth. For example, the closer an observation feature is to a given feature, the higher the corresponding weight. Therefore, the choice of the kernel function and bandwidth can exert a certain impact on the accuracy of the GWR results. Kernel functions include fixed Gaussian, adaptive Gaussian, fixed quadratic kernel, and adaptive quadratic kernel functions. Bandwidth determination standards include the Akaike Information Criterion (AIC) and the Cross-Validation (CV) technique [29]. The advantage of the AIC method is that the degrees of freedom of different models are considered, and this method can therefore resolve problems more effectively than the CV method [30]. The expression is as follows:
A I C c ( b ) = 2 n ln σ ^ + n ln 2 π + n { n + tr ( S ) n 2 tr ( S ) }
where A I C C denotes the corrected AIC value (corrected AIC or AICc), σ ^ denotes the model standard deviation estimate, and t r ( S ) denotes the trace of hat matrix S.

2.5. Model Evaluation Metric

The evaluation metrics in this study contain R-squared (R2) and adjusted R-squared (adjusted R2).
R2 is a statistic used to measure how well a regression model fits the observed data. It indicates the proportion of the variance in the dependent variable that can be explained by the model and takes a value between 0 and 1. A high R2 value indicates that the model fits the data well, while a low R2 value indicates that the model fits poorly. The formula for R2 is as follows:
R 2 = 1 i = 1 n   ( Y i Y ^ i ) 2 i = 1 n   ( Y i Y ¯ ) 2
where Y i is the observed value of the dependent variable; Y ^ i is the value of the dependent variable predicted by the model; Y ¯ is the mean value of the dependent variable; and n is the sample size.
Adjusted R2 is the metric used in multiple linear regression to adjust the empirical coefficient of determination, R2. R2 indicates the proportion of the variance in the dependent variable that can be explained by the model; however, R2 tends to increase when more independent variables are added, even if the newly added independent variables do not actually contribute to the model explanation. Adjusted R2 was introduced to avoid overfitting and to more accurately reflect the degree of model fit.
Adjusted R2 corrects the empirical coefficient of determination by taking into account the number of independent variables and the sample size. Its calculation formula is as follows:
Adjusted   R 2 = 1 ( 1 R 2 ) ( n 1 ) n k 1
where k is the number of independent variables in the model. 1 R 2 represents the proportion of variance not explained by the model. Therefore, the correction for 1 R 2 can be viewed as the proportion of variance not explained by the model to the total variance. n 1 is the sample size minus 1, which indicates the degrees of freedom used to estimate the model parameters. n k 1 denotes the sample size minus the number of independent variables in the model and 1, which indicates the adjustment for the degrees of freedom.

3. Results

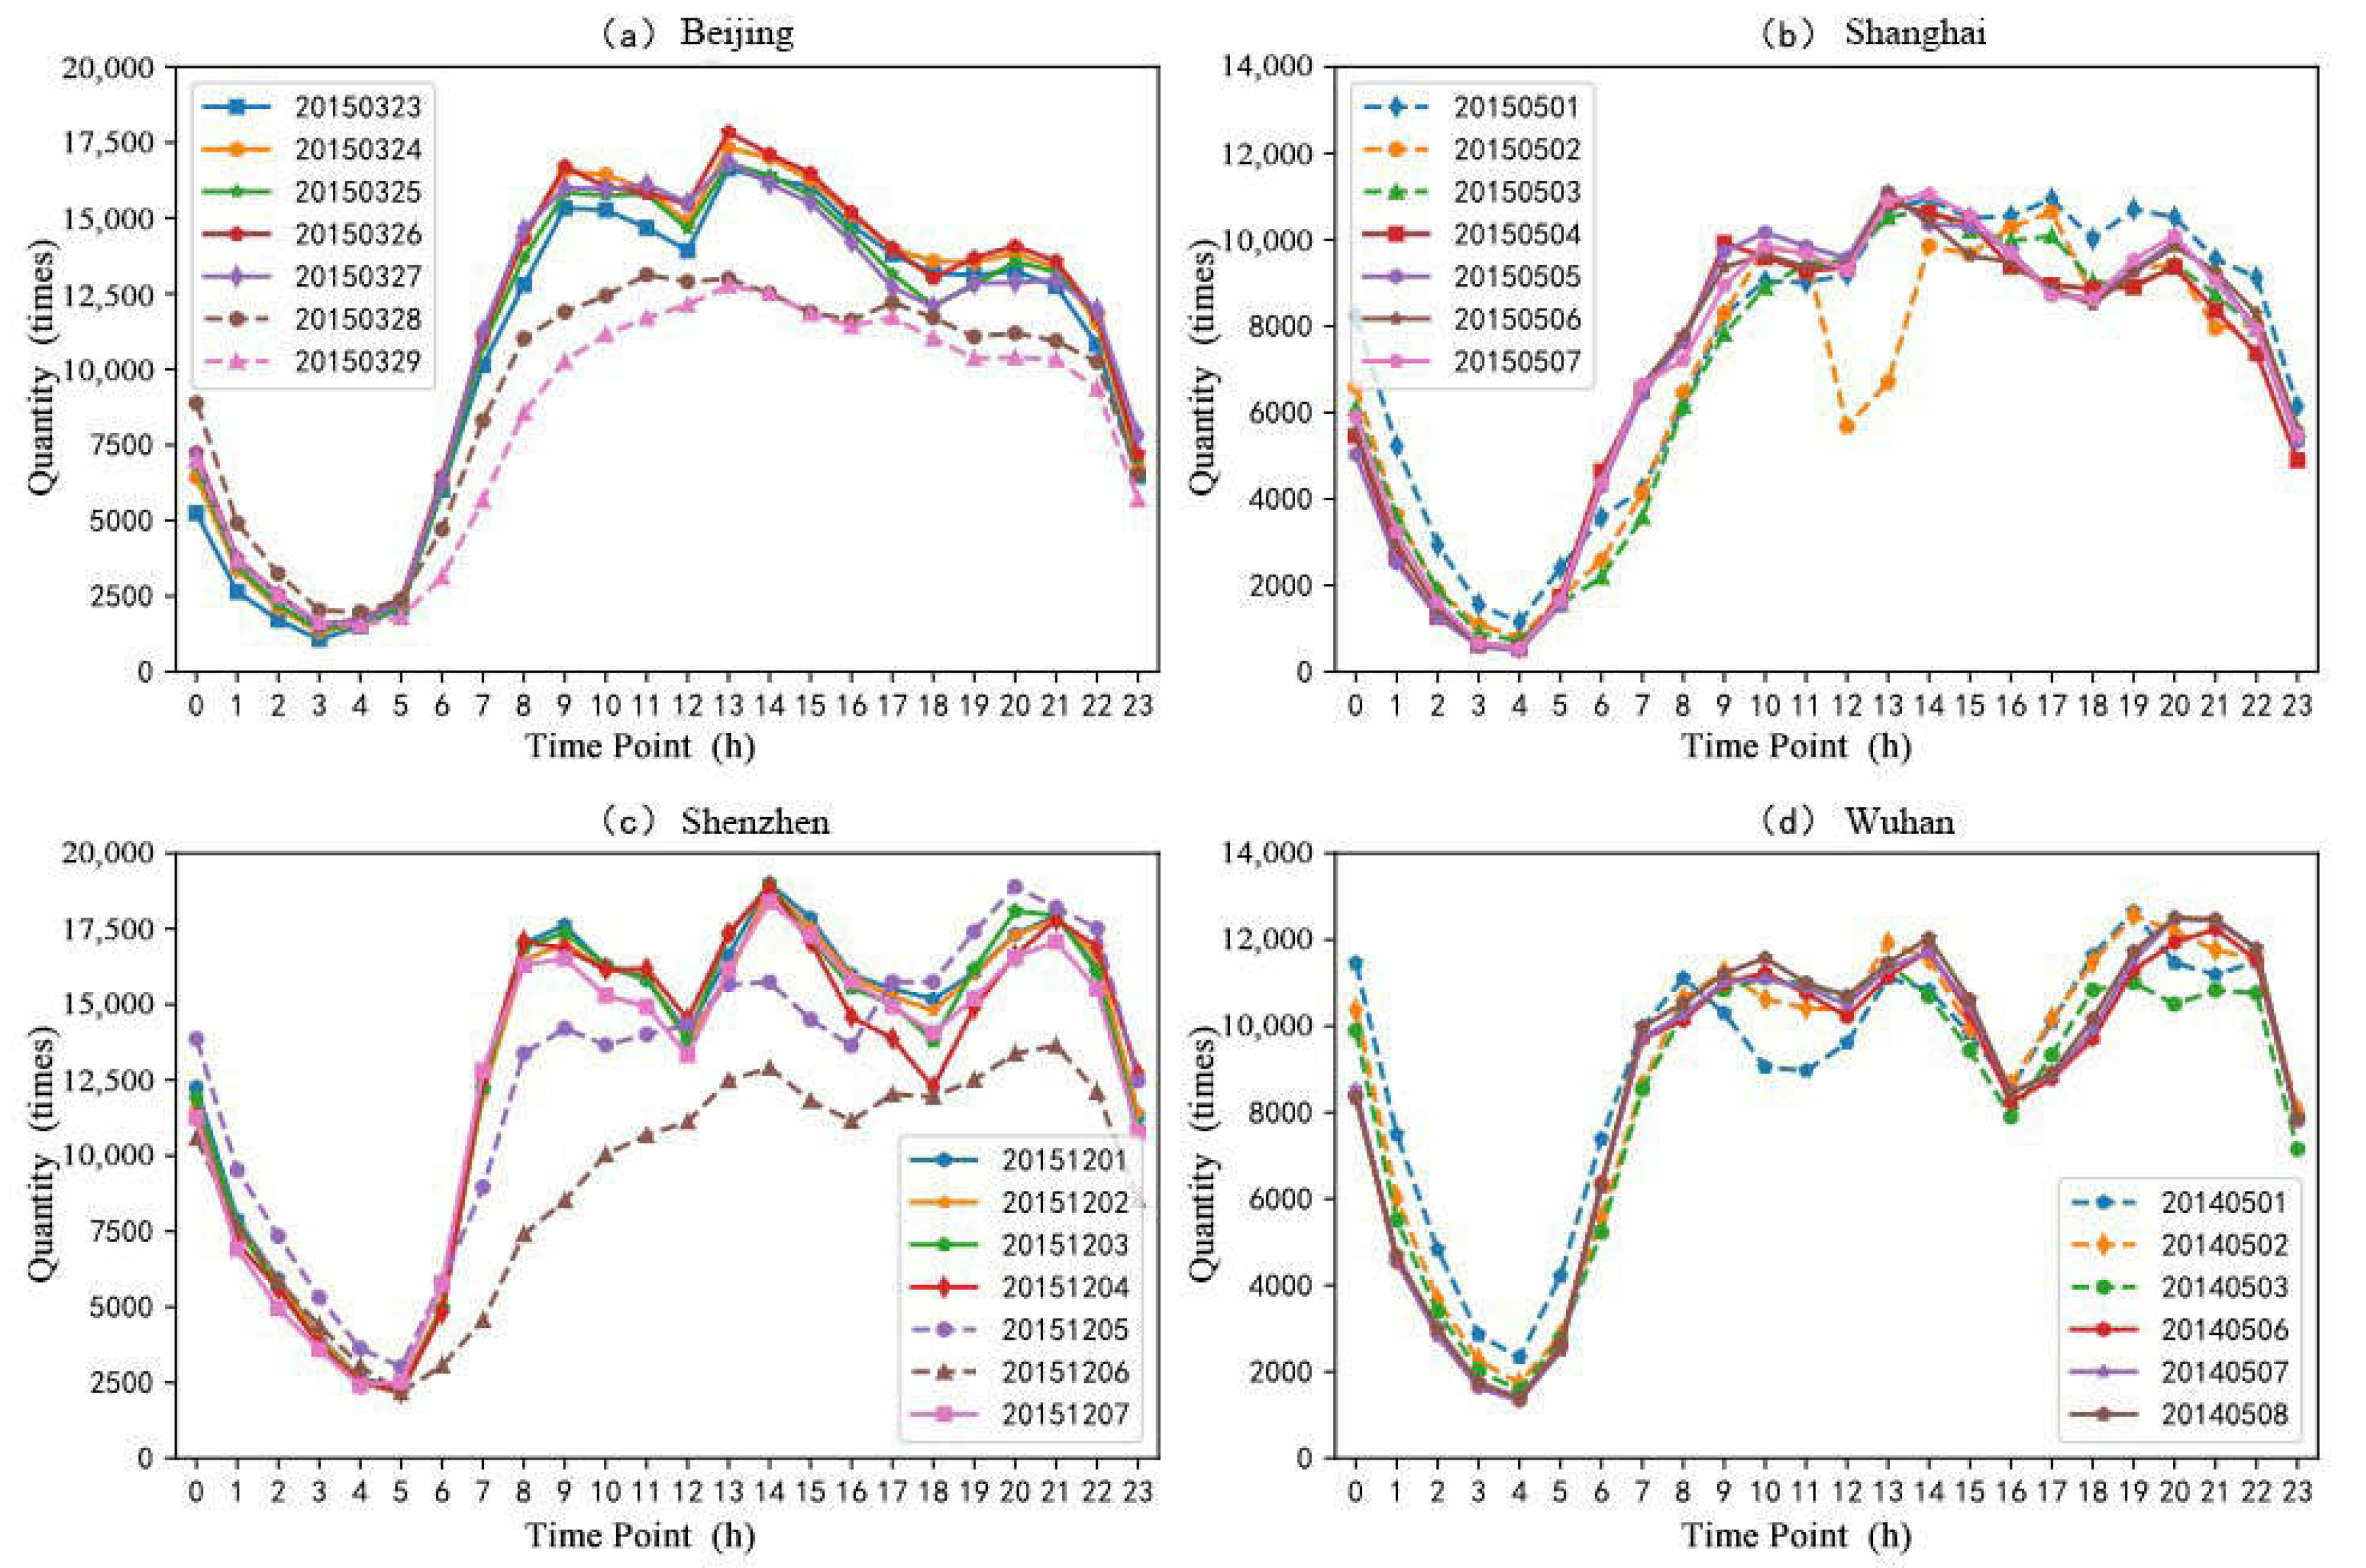
3.1. Temporal Trajectory Characteristics

This study analyzed hourly travel volumes in Beijing, Shanghai, Shenzhen, and Wuhan, with results depicted in Figure 2. The data show distinct patterns for weekdays (solid line) and other days (dotted line).
In Beijing, from 23 to 27 March 2015, the weekday travel pattern showed distinct fluctuations due to typical commuting behaviors. The rapid increase in traffic trips between 05:00 and 09:00 corresponds to the morning rush hour as people head to work or school. The subsequent decline until 12:00 indicates most individuals reaching their destinations. The surge between 12:00 and 13:00 likely reflects lunchtime errands, while the gradual decrease till 18:00 aligns with the end of the typical workday. The slight rebound in the evening, between 18:00 and 20:00, can be attributed to leisure activities or shopping, with the day’s activity winding down thereafter. Weekday travel generally surpasses Sunday traffic, which is expected as Sundays are typically rest days with less commuting activity.
Shanghai exhibited similar trends from 4 to 7 May 2015, especially during the weekdays. The more pronounced early morning traffic increase could be due to earlier starts for commutes. The stable traffic from 09:00 to 12:00 and the spike around lunchtime mirror the patterns observed in Beijing. The gradual decline post-lunch until 18:00 likely represents the workday’s close, with the evening peak possibly due to after-work activities. The holiday period from 1 to 3 May showed different patterns, with 1 and 3 May likely marking the start and end of the holiday, involving holiday-specific travel. 2 May, being in the middle of the holiday, displayed unique travel behaviors, possibly reflecting leisure activities distinct from typical weekends.
In Shenzhen, weekday traffic shows a morning peak from 5:00 to 8:00 due to early commutes, followed by stability until 9:00. A noticeable drop occurs from 9:00 to 12:00 as most people have reached their destinations. Lunchtime sees a rapid rise in trips, peaking between 12:00 and 14:00. Afternoon traffic declines swiftly until 18:00, aligning with the end of the typical workday. Evening hours from 18:00 to 20:00 experience a growth in travel, likely for leisure or errands, before a decrease after 21:00. Saturdays in Shenzhen surpass Sundays in travel, with similarities in weekend travel trends.
In Wuhan, there is a similar early morning traffic surge between 04:00 and 08:00 for commutes. Midday traffic from 08:00 to 14:00 changes slowly, followed by a faster decline from 14:00 to 16:00, possibly marking the end of the workday. The period from 16:00 to 19:00 sees an increase, likely for evening commutes, followed by a gradual slowdown and a sharp decrease after 22:00. Weekday and holiday patterns in Wuhan exhibit consistent fluctuations with clear peak and off-peak hours.
Overall, while weekday travel trends in the four cities show similarities, unique characteristics emerge on other days. Weekdays are influenced by work and show a high degree of regularity in the mode and purpose of commuting. There is a higher rate of increase in transport trips before and after work. Other days offer more personal time and allow an independent choice of travel time and destination, leading to a diversity of travel patterns and less regularity during holidays and sunrises [31]. In Beijing, non-working days are rest periods with relatively ample time, and a small number of residents will choose public transport for traveling without any significant peak commuting phenomenon. In Shanghai, there were significant differences in non-working day trips on 2 May compared to working days, and one of the main differences should be the significant drop in trips between 11:00 and 13:00, when most residents are enjoying a nice lunch and resting, and thus trips drop off sharply. In Shenzhen, most residents will rely more on public transportation when traveling on non-working days. In Wuhan, the fluctuation in traveling on non-working days is similar to that of traveling on working days, which means that Wuhan residents need to work overtime on non-working days.

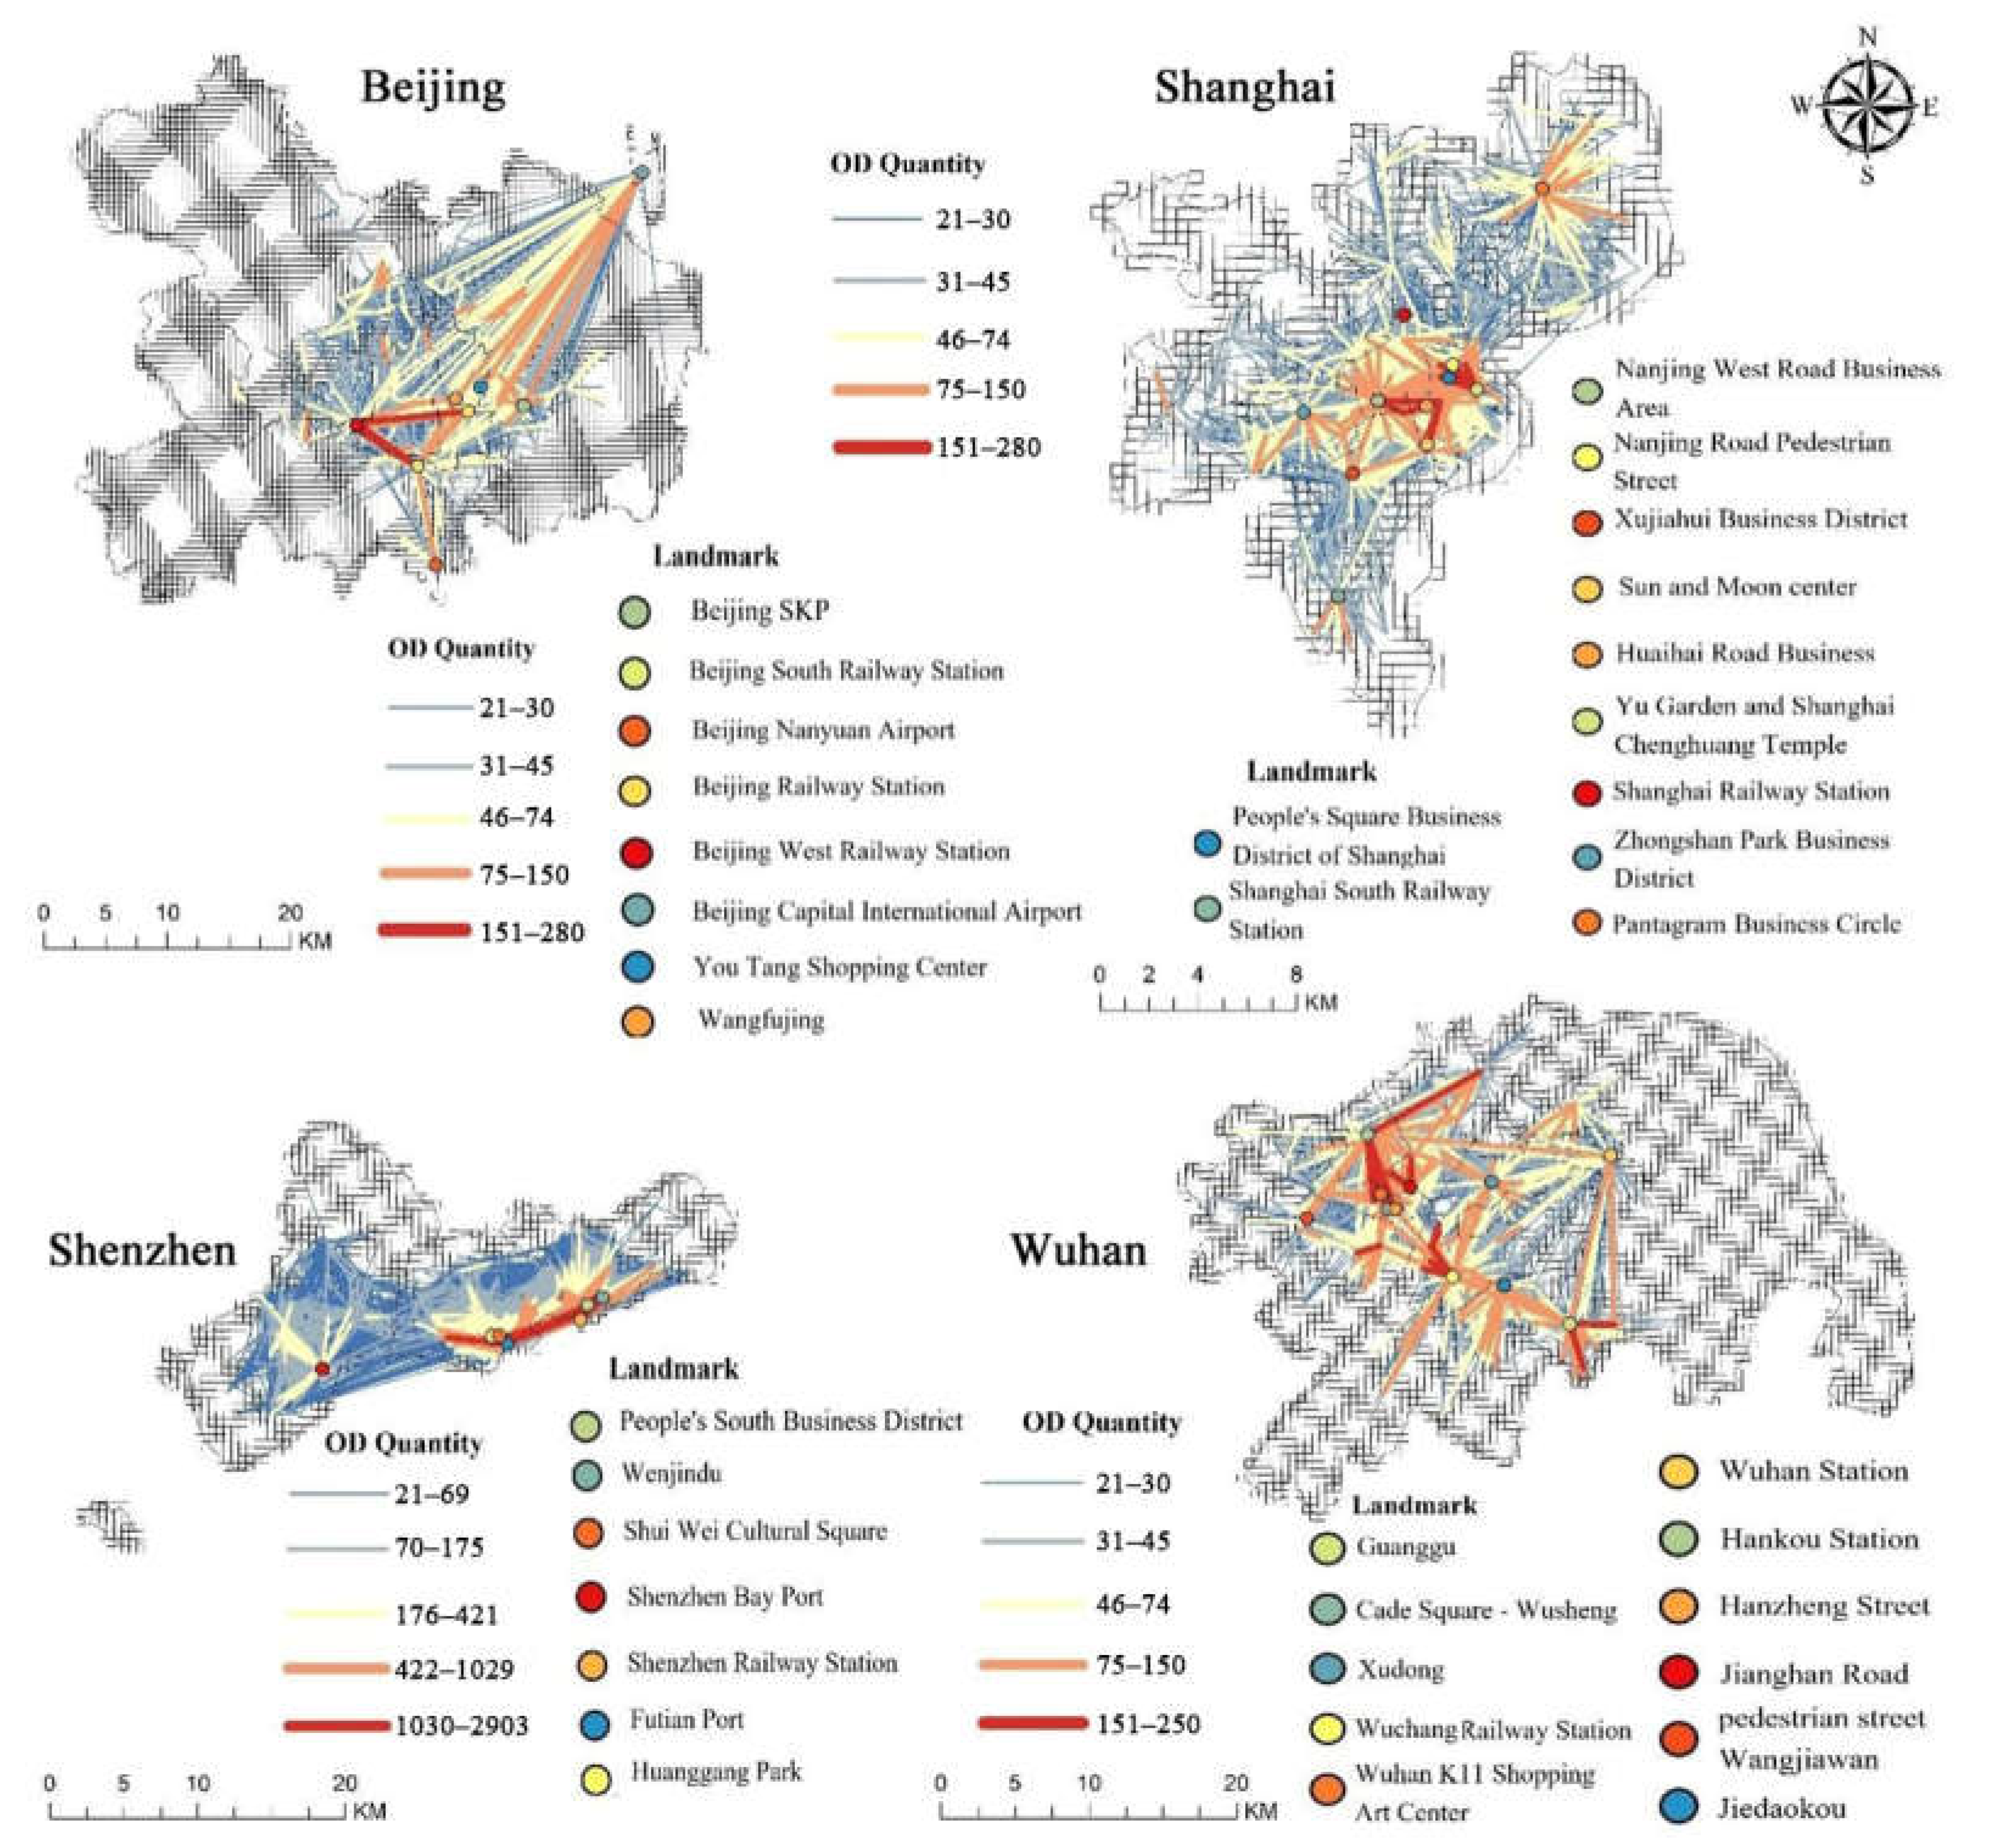
3.2. Spatial Trajectory Characteristics

Considering that the average distance between secondary arterial roads in Chinese urban planning is 500 m, a 500 m × 500 m grid was selected in the experiments. Origin-destination (OD) lines were drawn at the grid scale. To visualize the number of OD lines between the different grids, the color and line width were adjusted according to the number. Then, a base map was superimposed to identify any landmarks contained in the grid with numerous interactions between vehicle boarding and deboarding activities, as shown in Figure 3.
In Beijing, residential mobility occurs mainly between external transport stations and specific commercial areas [32]. The OD Quantity values between Beijing West Station, Beijing South Station, and Beijing Railway Station are over 151; between Wangfujing and Beijing West Station, Beijing South Station and Beijing Capital International Airport are between 75 and 150; between Beijing Capital International Airport and Yutang Shopping Centre and Beijing SKP are between 75 and 150; OD Quantity values between Beijing South Railway Station and Beijing Nanyuan Airport are also in the range of 75 to 150; OD Quantity values between all other points are below 75, and OD Quantity values between some areas are below 30. In general, there is frequent traffic between the railway stations and airports, and a lot of traffic between Beijing West Railway Station, Beijing South Railway Station, and Wangfujing Shopping Area. Beijing Capital International Airport also shows strong connectivity to various power grids, especially to large shopping centers such as Wangfujing.
The traveling pattern of residents in the central area of Shanghai shows that the main OD points are concentrated in and around Huangpu District [33]. The OD Quantity values between the Huaihai Road business district and the Sun and Moon Center and Nanjing West Road Business Area exceed 151; the OD Quantity values between Yu Garden and Shanghai Chenghuang Temple and the Nanjing Road Pedestrian Street and People’s Square Business Districts of Shanghai also exceed 151; there are also quite a number of points between which the OD Quantity values are in the range of 75 to 150; and most of the points between which the OD Quantity values are below 74. Overall, the city exhibits significant residential mobility between business districts regardless of distance, especially between neighboring business districts. The Pantagram Business Circle in Yangpu District is farther away from other business districts and has less interaction with them, but the flow in the neighboring areas is significant.
In Shenzhen, the OD Quantity values between Futian Port and Shui Wei Cultural Square and Shenzhen Railway Station, Wenjindu, and People’s South Business District are more than 1030; the OD Quantity values between the other points are all less than 422, except for a small number of them which are in the range of 422 to 1029. In general, most of the OD points are concentrated in the Futian and Luohu districts, with the Futian Port and Shenzhen Station as the center [34]. It has been observed that there is a high volume of traveling between these locations and the business districts. In addition, the Shenzhen port area located in the Nanshan District exhibits some degree of connectivity with its neighboring grid.
The study in Wuhan highlights the wide distribution of OD points in various areas [35]. The OD Quantity values between Hankou Station and Wuhan K11 Shopping Art Center, Hanzheng Street and CapitaLand exceed 151; the OD Quantity values between Jiedaokou and the points next to it are basically in the range of 46 to 150; and the OD Quantity values between the other commercial points and the nearby stations are also in the range of 46 to 150. Overall, there is a high level of foot traffic between external transport stations such as Hankou Station and commercial streets such as the nearby business districts such as Wuhan K11 Art Mall and CapitaLand. The connectivity between Hankou, Wuchang, and Wuhan stations is noteworthy, with particularly high mobility between Hankou and Wuhan stations.
While each city displays unique travel patterns, commonalities emerge in the interaction between external traffic stations and business districts. Beijing, Shenzhen, and Wuhan show significant flow between these points, indicating the influence of station proximity on travel behavior. Shanghai, on the other hand, primarily involves resident flow within and between its business districts.

3.3. Trajectory and Urban Morphology Model Analysis

The OLS model was applied to simulate and analyze daytime drop-off points and catering services (CS), financial and insurance services (FI), medical care services (MS), and external transportation facility services (ET) from a global perspective. The results are summarized in Table 1. The adjusted R2 values of the least squares regression model were 0.593, 0.706, 0.734, and 0.618, among which Shenzhen exhibited the best-fitting effect, followed by Shanghai, Wuhan, and Beijing. Overall, the model showed a moderately high level of data fitting effectiveness. The variance inflation factor (VIF) values for all variables varied between 1 and 5, indicating that there existed no multicollinearity among the selected variables. According to the coefficient values for the independent variables, the daytime drop-off activities in the Beijing study area were greatly affected by external transportation facilities and services, followed by financial insurance, medical care, and catering services. Financial and insurance services in the Shanghai study area contributed the most to enhancement in daytime drop-off activities, followed by external transportation facilities and services, medical and health care services, and catering services. External transportation facility services in the Shenzhen research area contributed the most to daytime drop-off activities, far greater than did financial and insurance services, medical health services, and catering services. In the Wuhan research area, daytime drop-off activities were the most affected by external transportation facility services, followed by financial and insurance services, medical care services, and catering services. In general, external transportation facility services and financial and insurance services ranked in the top two in terms of influence intensity, followed by healthcare services and catering services. Other studies have also demonstrated that these factors are key in influencing residents’ travel behavior [36,37,38].
Figure 4 presents the local R2 values of the Geographically Weighted Regression (GWR) model fits for Beijing, Shanghai, Shenzhen, and Wuhan, focusing on the lower quartile, median, and upper quartile for visualization. In Beijing, local grids with upper quartiles of R2 values above 0.80 were widely distributed in all administrative areas, and local grids with lower quartiles of R2 values below 0.44 were mainly distributed in urban fringe area locations. Local grids with R2 values higher than 0.81 in the Shanghai study area are centrally distributed in the upper quartile and are mainly divided into four major blocks, while local networks with R2 values lower than 0.62 in the lower quartile are more sporadically distributed, which include four major blocks and some sporadic blocks. In Shenzhen, local grids in the upper quartile with R2 values exceeding 0.94 are widely distributed, and local grids in the lower quartile with R2 values lower than 0.66 are basically distributed in the peripheral areas of the city. In Wuhan, local grids in the upper quartile with R2 values exceeding 0.852 are widely distributed, and local grids in the lower quartile with R2 values lower than 0.34 are concentrated and mainly divided into five main blocks.
The spatial distribution of local R2 values and the proportion of grids in each interval reveal similar patterns across Beijing, Shanghai, Shenzhen, and Wuhan. In Shanghai, a notable concentration of R2 values in the central city suggests better interpretability in this area, reflecting a focused urban dynamic. Conversely, the other three cities exhibit a more scattered distribution, indicative of multiple business centers and a wider spread in pedestrian traffic. Particularly in Shenzhen, the high proportion of grids with R2 values over 0.94 underscores its superior interpretability compared to the other cities.

3.4. Comparison between the OLS and GWR Models

Table 2 presents a comparative analysis of the least squares regression (OLS) and Geographically Weighted Regression (GWR) models for each city, highlighting the enhanced efficacy of the GWR model. In Beijing, the adjusted R2 value of the GWR model is 0.888, and the adjusted R2 value of the OLS model is 0.593, and the GWR model outperforms the OLS model by 0.295. In Shanghai, the adjusted R2 value of the GWR model is 0.861, the adjusted R2 value of the OLS model is 0.706, and the GWR model outperforms the OLS model by 0.155. In Shenzhen, the GWR model’s adjusted R2 is 0.957, and the adjusted R2 value of the OLS model is 0.734; the GWR model outperforms the OLS model by 0.223. In Wuhan, the adjusted R2 of the GWR model is 0.881, and the adjusted R2 value of the OLS model is 0.618; the GWR model outperforms the OLS model by 0.263. These results demonstrate the GWR model’s superior fit compared to the OLS model across all four cities, as also corroborated by the lower AICc values in the GWR diagnostics.
This research synthesizes the results from both the least squares regression (OLS) and Geographically Weighted Regression (GWR) models, along with the spatial distribution of independent variable coefficients. The diagnostic information confirms the GWR model’s superior fit over the OLS model, particularly in studies with spatial heterogeneity, where GWR outperforms due to its spatially sensitive approach.
The OLS model’s findings suggest that the impact of external transportation facility services and financial and insurance services is most pronounced in the studied cities, followed by medical care and catering services. The GWR results further illuminate this trend, showing high coefficient values for catering, financial and insurance, and medical care services predominantly in business districts. These areas typically include catering establishments, leisure and entertainment venues, shopping centers, medical facilities, and business offices. Additionally, high coefficients for external transportation services are often found in grids close to these facilities, aligning with the common practice of residents using taxis to reach nearby entrances and proceeding on foot.

4. Discussion

In the same type of study, Li analyzed taxi trajectory data from Chengdu and New York City [39], revealing a nonlinear relationship between network density and travel distance. Furthermore, it was discovered that the urban travel network in Chengdu exhibits more heterogeneity compared to that of New York City. By employing community detection techniques, the study identified key nodes and regions in the urban travel network. However, the selected cities lack representativeness, and there are significant differences between them. Using Shenzhen as a case study, he employed taxi trajectory data to uncover the spatial and temporal patterns of urban tourism travel, revealing that spatial interactions in urban tourism exhibit grouping and hierarchical characteristics. The study primarily focused on the directional characteristics of urban tourism travel, but the sample size is limited, and the research results are relatively simplistic [40]. Du utilized taxi trajectory data to uncover urban residents’ travel patterns, introducing a fusion clustering algorithm to improve the accuracy of trajectory data clustering. The study revealed a significant correlation between travel hotspots and path distributions. However, the analysis of influencing factors and conclusions in the study lacked depth, and there were limitations in the spatial dimension of the data, as it was collected within specific geographic coordinates [41]. This study analyzes taxi trajectory data from Beijing, Shanghai, Shenzhen, and Wuhan, focusing on residents’ spatiotemporal travel patterns and their influencing factors, and highlights the importance of adopting sustainable and efficient urban transport planning that is consistent with global sustainable development goals. In terms of temporal characteristics, Shenzhen has the highest average daily trips among the four cities, followed by Beijing and Wuhan; weekday trips in all four cities show obvious peaks and troughs, with greater fluctuations in non-workday trips in Beijing and Shenzhen than in Shanghai and Wuhan. In terms of spatial characteristics, the four cities show commonalities in the interaction between external transport stations and business districts. On the one hand, Beijing, Shenzhen, and Wuhan show significant footfalls between these points, indicating the influence of station distance on travel behavior. On the other hand, Shanghai mainly involves the movement of residents within and between business districts, suggesting that Shanghai’s urban business districts are well developed and more attractive to residents. In terms of travel characteristics and urban form, the GWR model provides a better fit than the OLS model, with external transport services and financial services having the greatest impact on travel patterns, followed by healthcare and food and beverage services. These areas typically include dining establishments, leisure and entertainment venues, shopping centers, healthcare facilities, and commercial offices. In addition, external transport service coefficients are typically higher in grids near these facilities, which is consistent with the common practice of residents taking taxis to reach nearby entrances and continuing on foot. In summary, the analysis using the GWR model demonstrates how urban amenities affect travel behavior in different ways in each city, suggesting the need for context-specific urban planning. These strategies should not only prioritize the uniqueness of each urban area but also focus on reducing carbon emissions and improving the quality of urban life. Addressing these different urban challenges through tailored transport solutions can significantly contribute to the creation of more livable, environmentally friendly, and efficient urban spaces, which are essential for the well-being of current and future urban populations.
Moreover, understanding these influential factors has substantial implications for developing transportation systems that are not only efficient but also environmentally friendly [42]. Strategic placement and enhancement of transportation infrastructure, particularly external transportation facilities, are essential for better serving residents’ daily travel needs [43]. This study found a commonality in the interaction between external transport stations and commercial districts in the four cities, where the two services, external transport stations and commercial districts, are the most attractive parts of the city, reflecting the high demand of city residents for traveling to other cities and going to commercial districts for leisure and shopping and also showing that the residents’ routes of action within the city are more regular, basically external transport stations and commercial districts. This finding helps the relevant government departments to carry out corresponding traffic scheduling for external transport stations and commercial district services in specific time periods to cope with possible traffic congestion phenomena and alleviate traffic congestion. This study identifies the “three peaks and three valleys” in residential traffic patterns, which provides valuable insights for optimizing transport services and managing traffic flows in these cities. To address the “three peaks and three valleys” phenomenon in urban travel due to the peak commuting hours, the relevant management authorities can formulate appropriate traffic management policies to manage certain specific road sections during commuting hours according to the road conditions and increase the road usage rate; in terms of infrastructure, the relevant governmental departments can expand the lanes in the corresponding routes or open new routes and alleviate traffic congestion due to the peak commuting hours. Overall, these models have informed the development of targeted traffic management and infrastructure improvement strategies, especially during peak traveling hours, to alleviate traffic congestion. By focusing on these patterns, we can better develop strategies to alleviate congestion during peak periods and contribute to the overall goal of a sustainable urban environment.
This paper summarizes the research results related to spatiotemporal travel patterns and their influencing factors, which can help relevant government departments to better plan urban transport, establish a sound knowledge system for urban traffic management, and contribute to the overall goal of a sustainable urban environment. However, there are some limitations of this study that should be addressed in future research. Although focusing on taxi trajectories provides valuable insights, this approach may not be able to cover all urban travel behaviors; the amount and timeliness of data cannot be guaranteed due to the difficulty of data acquisition; the timeliness of the model cannot be guaranteed due to the poor timeliness of the data; and the model chosen does not correspond to the time period, which leads to the limitations of this study. In future research, we hope to include more factors that affect residents’ traveling decisions, such as environmental impacts, carbon footprints, and the accessibility of sustainable transport modes; data updates and experimental validation will be carried out in subsequent studies in order to obtain more accurate research results. Expanding our analyses to take these aspects into account is essential for a comprehensive understanding of urban transport. This broader perspective is essential for the development of transport policies and planning strategies that not only address efficiency and accessibility but also prioritize sustainability and the creation of a high quality of life.

5. Conclusions

In this study, we analyzed taxi trajectory data from Beijing, Shanghai, Shenzhen, and Wuhan, focusing on the temporal and spatial travel patterns of residents and their influencing factors. Employing OLS and GWR models, we established a link between these travel patterns and urban morphology. Our findings are as follows:
  • Temporal Characteristics: Shenzhen had the highest average daily travel volume, with Beijing and Wuhan following. Beijing and Shenzhen experienced more significant travel fluctuations compared to Shanghai and Wuhan.
  • Spatial Characteristics: In all four cities, high interaction zones in vehicle boarding and deboarding were mostly found in commercial areas and near external transportation facilities, reflecting movement patterns between these locations.
  • Travel Characteristics and Urban Morphology: The GWR model showed a better fit than the OLS model. The most significant influences on travel patterns were external transportation services and financial services, followed by medical care and catering services.

Author Contributions

Conceptualization, X.C.; methodology, H.C.; software, H.X., J.L. and X.F.; validation, X.C. and R.X.; formal analysis, X.C.; investigation, H.C.; resources, H.X., J.L. and X.F.; data curation, X.C.; writing—original draft preparation, X.C. and H.C; writing—review and editing, X.C. and H.C; visualization, H.C.; supervision, R.X.; project administration, H.X., J.L. and X.F.; funding acquisition, X.C. All authors have read and agreed to the published version of the manuscript.

Funding

This research is partially supported by the Natural Science Foundation of Hubei Province (Grant No. 2022CFB447), the National Natural Science Foundation of China Major Program (Grant No. 42192580, 42192583), the National Natural Science Foundation of China (Grant No. 42371299) and the National Natural Science Foundation of China International Cooperation Program (Grant No. 42361144861).

Institutional Review Board Statement

Not applicable.

Informed Consent Statement

Not applicable.

Data Availability Statement

The data are not publicly available due to the privacy of the data.

Conflicts of Interest

The authors declare no conflicts of interest.

References

  1. Yin, H.; Zhang, Z.; Wan, Y.; Gao, Z.; Guo, Y.; Xiao, R. Sustainable network analysis and coordinated development simulation of urban agglomerations from multiple perspectives. J. Clean. Prod. 2023, 413, 137378. [Google Scholar] [CrossRef]
  2. Bock, F.; Di Martino, S.; Origlia, A. Smart parking: Using a crowd of taxis to sense on-street parking space availability. IEEE Trans. Intell. Transp. Syst. 2019, 21, 496–508. [Google Scholar] [CrossRef]
  3. Ge, W.; Shao, D.; Xue, M.; Zhu, H.; Cheng, J. Urban taxi ridership analysis in the emerging metropolis: Case study in Shanghai. Transp. Res. Procedia 2017, 25, 4916–4927. [Google Scholar] [CrossRef]
  4. Choi, K. The influence of the built environment on household vehicle travel by the urban typology in Calgary, Canada. Cities 2018, 75, 101–110. [Google Scholar] [CrossRef]
  5. Zhang, B.; Chen, S.; Ma, Y.; Li, T.; Tang, K. Analysis on spatiotemporal urban mobility based on online car-hailing data. J. Transp. Geogr. 2020, 82, 102568. [Google Scholar] [CrossRef]
  6. Delclòs-Alió, X.; Gutiérrez, A.; Miralles-Guasch, C. The urban vitality conditions of Jane Jacobs in Barcelona: Residential and smartphone-based tracking measurements of the built environment in a Mediterranean metropolis. Cities 2019, 86, 220–228. [Google Scholar] [CrossRef]
  7. Fu, X.; Xu, C.; Liu, Y.; Chen, C.H.; Hwang, F.J.; Wang, J. Spatial heterogeneity and migration characteristics of traffic congestion—A quantitative identification method based on taxi trajectory data. Phys. A Stat. Mech. Its Appl. 2022, 588, 126482. [Google Scholar] [CrossRef]
  8. Peng, Z.; Bai, G.; Wu, H.; Liu, L.; Yu, Y. Travel mode recognition of urban residents using mobile phone data and MapAPI. Environ. Plan. B Urban Anal. City Sci. 2021, 48, 2574–2589. [Google Scholar] [CrossRef]
  9. Yang, Z.; Franz, M.L.; Zhu, S.; Mahmoudi, J.; Nasri, A.; Zhang, L. Analysis of Washington, DC taxi demand using GPS and land-use data. J. Transp. Geogr. 2018, 66, 35–44. [Google Scholar] [CrossRef]
  10. Yan, L.; Sheng, B.; He, Y.; Lu, S.; Guo, J. Forecasting and Planning Method for Taxi Travel Combining Carbon Emission and Revenue Factors—A Case Study in China. Int. J. Environ. Res. Public Health 2022, 19, 11490. [Google Scholar] [CrossRef]
  11. Wu, Y.; Yao, Y.; Ren, S.; Zhang, S.; Guan, Q. How do urban services facilities affect social segregation among people of different economic levels? A case study of Shenzhen city. Environ. Plan. B Urban Anal. City Sci. 2023, 50, 1502–1517. [Google Scholar] [CrossRef]
  12. Gong, S.; Gao, Y.; Zhang, F.; Mu, L.; Kang, C.; Liu, Y. Evaluating healthcare resource inequality in Beijing, China based on an improved spatial accessibility measurement. Trans. GIS 2021, 25, 1504–1521. [Google Scholar] [CrossRef]
  13. Guo, P.; Sun, Y.; Chen, Q.; Li, J.; Liu, Z. The Impact of Rainfall on Urban Human Mobility from Taxi GPS Data. Sustainability 2022, 14, 9355. [Google Scholar] [CrossRef]
  14. Liu, Y.; Gao, X.; Yi, D.; Jiang, H.; Zhao, Y.; Xu, J.; Zhang, J. Investigating human travel patterns from an activity semantic flow perspective: A case study within the fifth ring road in beijing using taxi trajectory data. ISPRS Int. J. Geo-Inf. 2022, 11, 140. [Google Scholar] [CrossRef]
  15. Sun, M.; Xue, C.; Cheng, Y.; Zhao, L.; Long, Z. Analyzing spatiotemporal daily travel source carbon emissions based on taxi trajectory data. IEEE Access 2021, 9, 107012–107023. [Google Scholar] [CrossRef]
  16. Liu, Z.; Wan, L.; Guo, J.; Huang, F.; Feng, X.; Wang, L.; Ma, J. Ppru: A privacy-preserving reputation updating scheme for cloud-assisted vehicular networks. IEEE Trans. Veh. Technol. 2023, 1–16. [Google Scholar] [CrossRef]
  17. Guo, J.; Liu, Z.; Tian, S.; Huang, F.; Li, J.; Li, X.; Igorevich, K.K.; Ma, J. Tfl-dt: A trust evaluation scheme for federated learning in digital twin for mobile networks. IEEE J. Sel. Areas Commun. 2023, 41, 3548–3560. [Google Scholar] [CrossRef]
  18. Zhao, Z.Y.; Cao, Y.; Kang, Y.; Xu, Z.Y. Prediction of spatiotemporal evolution of urban traffic emissions based on taxi trajectories. Int. J. Autom. Comput. 2021, 18, 219–232. [Google Scholar] [CrossRef]
  19. Wang, H.; Zhao, D.; Cai, Y.; Meng, Q.; Ong, G.P. Taxi trajectory data based fast-charging facility planning for urban electric taxi systems. Appl. Energy 2021, 286, 116515. [Google Scholar] [CrossRef]
  20. Su, Y.; Liu, Z.; Chang, J.; Deng, Q.; Zhang, Y.; Liu, J.; Long, Y. Measuring accessibility to healthcare using taxi trajectories data: A case study of acute myocardial infarction cases in Beijing. Int. J. Health Policy Manag. 2023, 12, 6653. [Google Scholar] [CrossRef]
  21. Kan, Z.; Tang, L.; Kwan, M.P.; Ren, C.; Liu, D.; Li, Q. Traffic congestion analysis at the turn level using Taxis’ GPS trajectory data. Comput. Environ. Urban Syst. 2019, 74, 229–243. [Google Scholar] [CrossRef]
  22. He, F.; Yan, X.; Liu, Y.; Ma, L. A traffic congestion assessment method for urban road networks based on speed performance index. Procedia Eng. 2016, 137, 425–433. [Google Scholar] [CrossRef]
  23. Zang, J.; Jiao, P.; Liu, S.; Zhang, X.; Song, G.; Yu, L. Identifying Traffic Congestion Patterns of Urban Road Network Based on Traffic Performance Index. Sustainability 2023, 15, 948. [Google Scholar] [CrossRef]
  24. Hayes, A.F.; Cai, L. Using heteroskedasticity-consistent standard error estimators in OLS regression: An introduction and software implementation. Behav. Res. Methods 2007, 39, 709–722. [Google Scholar] [CrossRef] [PubMed]
  25. Wu, D. Spatially and temporally varying relationships between ecological footprint and influencing factors in China’s provinces Using Geographically Weighted Regression (GWR). J. Clean. Prod. 2020, 261, 121089. [Google Scholar] [CrossRef]
  26. Houlden, V.; de Albuquerque, J.P.; Weich, S.; Jarvis, S. A spatial analysis of proximate greenspace and mental wellbeing in London. Appl. Geogr. 2019, 109, 102036. [Google Scholar] [CrossRef]
  27. Mennis, J. Mapping the results of geographically weighted regression. Cartogr. J. 2006, 43, 171–179. [Google Scholar] [CrossRef]
  28. Brunsdon, C.; Fotheringham, A.S.; Charlton, M.E. Geographically weighted regression: A method for exploring spatial nonstationarity. Geogr. Anal. 1996, 28, 281–298. [Google Scholar] [CrossRef]
  29. Farber, S.; Páez, A. A systematic investigation of cross-validation in GWR model estimation: Empirical analysis and Monte Carlo simulations. J. Geogr. Syst. 2007, 9, 371–396. [Google Scholar] [CrossRef]
  30. Liu, C.; Wu, X.; Wang, L. Analysis on land ecological security change and affect factors using RS and GWR in the Danjiangkou Reservoir area, China. Appl. Geogr. 2019, 105, 1–14. [Google Scholar] [CrossRef]
  31. Tu, P.; Yao, W.; Zhao, Z.; Wang, P.; Wu, S.; Fang, Z. Interday Stability of Taxi Travel Flow in Urban Areas. ISPRS Int. J. Geo-Inf. 2022, 11, 590. [Google Scholar] [CrossRef]
  32. Wang, H.; Huang, H.; Ni, X.; Zeng, W. Revealing spatial-temporal characteristics and patterns of urban travel: A large-scale analysis and visualization study with taxi GPS data. ISPRS Int. J. Geo-Inf. 2019, 8, 257. [Google Scholar] [CrossRef]
  33. Zhang, Z.; Zhang, Y.; He, T.; Xiao, R. Urban vitality and its influencing factors: Comparative analysis based on taxi trajectory data. IEEE J. Sel. Top. Appl. Earth Obs. Remote Sens. 2022, 15, 5102–5114. [Google Scholar] [CrossRef]
  34. Yao, Y.; Wu, D.; Hong, Y.; Chen, D.; Liang, Z.; Guan, Q.; Liang, X.; Dai, L. Analyzing the effects of rainfall on urban traffic-congestion bottlenecks. IEEE J. Sel. Top. Appl. Earth Obs. Remote Sens. 2020, 13, 504–512. [Google Scholar] [CrossRef]
  35. Chen, X.J.; Wang, Y.; Xie, J.; Zhu, X.; Shan, J. Urban hotspots detection of taxi stops with local maximum density. Comput. Environ. Urban Syst. 2021, 89, 101661. [Google Scholar] [CrossRef]
  36. Mwale, M.; Luke, R.; Pisa, N. Factors that affect travel behaviour in developing cities: A methodological review. Transp. Res. Interdiscip. Perspect. 2022, 16, 100683. [Google Scholar] [CrossRef]
  37. Wu, W.; Yao, Y.; Wang, R. Green space exposure at subway stations, transportation mode choice and travel satisfaction. Transp. Res. Part D Transp. Environ. 2023, 122, 103862. [Google Scholar] [CrossRef]
  38. Zhang, F.; Wu, L.; Zhu, D.; Liu, Y. Social sensing from street-level imagery: A case study in learning spatio-temporal urban mobility patterns. ISPRS J. Photogramm. Remote Sens. 2019, 153, 48–58. [Google Scholar] [CrossRef]
  39. Li, Z.T.; Nie, W.P.; Cai, S.M.; Zhao, Z.D.; Zhou, T. Exploring the topological characteristics of urban trip networks based on taxi trajectory data. Phys. A Stat. Mech. Its Appl. 2023, 609, 128391. [Google Scholar] [CrossRef]
  40. He, B.; Liu, K.; Xue, Z.; Liu, J.; Yuan, D.; Yin, J.; Wu, G. Spatial and temporal characteristics of urban tourism travel by taxi—A case study of Shenzhen. ISPRS Int. J. Geo-Inf. 2021, 10, 445. [Google Scholar] [CrossRef]
  41. Du, J.; Meng, C.; Liu, X. Analysis of Urban Residents’ Travelling Characteristics and Hotspots Based on Taxi Trajectory Data. Appl. Sci. 2024, 14, 1279. [Google Scholar] [CrossRef]
  42. Li, B.; Cai, Z.; Jiang, L.; Su, S.; Huang, X. Exploring urban taxi ridership and local associated factors using GPS data and geographically weighted regression. Cities 2019, 87, 68–86. [Google Scholar] [CrossRef]
  43. Yin, H.; Xiao, R.; Fei, X.; Zhang, Z.; Gao, Z.; Wan, Y.; Tan, W.; Cao, W.; Guo, Y. Analyzing “Economy-Society-Environment” sustainability from the perspective of urban spatial structure: A case study of the Yangtze River Delta Urban Agglomeration. Sustain. Cities Soc. 2023, 96, 104691. [Google Scholar] [CrossRef]
Figure 1. Study area.
Sustainability 16 02694 g001
Figure 2. Distribution of the travel volume during the different time periods.
Sustainability 16 02694 g002
Figure 3. OD lines at the grid scale in the four selected cities.
Sustainability 16 02694 g003
Figure 4. Spatial distribution of the local R2 value.
Sustainability 16 02694 g004
Table 1. Relevant independent variable information obtained with the OLS model.
CSFIMSET
BeijingCoefficient2.11410.9375.89511.399
t test statistic (t-Stat)28.70932.64528.87438.650
VIF1.4381.4451.2251.005
Adjusted R2 value0.593
ShanghaiCoefficient2.2549.5784.0099.515
t test statistic (t-Stat)25.60912.577413.2888.443
VIF1.8921.8981.1381.002
Adjusted R2 value0.706
ShenzhenCoefficient4.46729.15315.951163.060
t test statistic (t-Stat)14.22518.96912.74336.050
VIF2.2231.7161.8681.006
Adjusted R2 value0.734
WuhanCoefficient2.22613.4647.51321.155
t test statistic (t-Stat)27.52420.17023.39128.524
VIF1.7611.6071.5641.001
Adjusted R2 value0.618
Abbreviations: CS, catering services; FI, financial and insurance services; MS, medical care services; ET, external transportation facility services.
Table 2. Comparison of the OLS and GWR diagnostic information.
BeijingShanghaiShenzhenWuhan
OLSGWROLSGWROLSGWROLSGWR
R20.5930.9160.7070.8840.7340.9740.6180.920
Adjusted R20.5930.8880.7060.8610.7340.9570.6180.881
AICc9010.8556051.8262105.3531400.5522479.490852.3027794.4575301.455
Bandwidth-605.210-917.480-427.260-468.330
Disclaimer/Publisher’s Note: The statements, opinions and data contained in all publications are solely those of the individual author(s) and contributor(s) and not of MDPI and/or the editor(s). MDPI and/or the editor(s) disclaim responsibility for any injury to people or property resulting from any ideas, methods, instructions or products referred to in the content.

