Abstract
To improve energy and environmental security in urban environments and in accordance with the requirements of the EU, the task of sustainable developing agriculture in urban agglomerations and monitoring it using satellite images becomes relevant. The aim of the work is the development of methods and means for determining stable islands of thermal energy to substantiate the optimal locations for plant growing practices in the metropolis. The research was conducted in Kyiv, the largest metropolis of Ukraine. Data from the Landsat 8 and 9 satellites were used because of the free data and they have better spatial resolution and an available archive of observation results. It was established that the temperature map of the city of Kyiv shows differences in temperature between different parts of the city, probably due to the presence of different sources of heat radiation. It is obvious that the standard deviation of the temperature in the plots depends on many factors, in particular, the season and the type of land use. It is necessary to find alternative solutions for the development of crop production in this area, taking into account the characteristics of thermal emissions. Based on software products from free satellite monitoring providers, EO Browser, a specialized software solution (web application) has been created for monitoring agricultural plantations in an urban environment. A collection of LANDSAT 8 satellite images was used. Areas with stable heat emissions were found, which are due to the operation of a modern shopping and entertainment center, and non-traditional crops for landscaping adapted to its design are proposed. As a result of research, strong heat emissions were recorded for some objects, for them the temperature exceeds the surrounding area by 4 °C, while the minimum standard deviation in January is 0.5 °C, the maximum in July is 2.8 °C, in April and October—1.7 °C and 1.2 °C, respectively.
1. Introduction
In recent decades, the problem of energy and environmental security problem has remained unsolved worldwide, including in urbanized environments. This problem determines the number of scientific and applied problems. It is relevant for European countries [1,2,3,4,5]. As a result of the European Green Deal (EGD), the requirements for the quality of raw materials from which energy is obtained, the quality of products, and the ecology of large- and medium-sized cities are being strengthened in the European Union.
In article [1], the authors assess and justify the level of agricultural production for all countries/exporters in the EU from the point of view of the EGD. The authors argue that the least developed and especially developing countries will have the opportunity to increase the production and export of agri-food products, which means rapid economic growth, increased incomes for poor farmers and improved human well-being.
Article [2] identifies the main factors influencing capacity-building for the implementation of the Green Deal in the countries of the central part of the EU. The development of national and regional implementation plans and regional cooperation will provide suitable solutions, supported by recovery and resilience funds.
The authors of the article [3] consider energy efficiency achievements by assessing different types of energy within the framework of the EGD. In particular, two different energy self-sufficient wastewater treatment systems are compared.
The article by Serena Sandri et al. [4] discusses the potential consequences of the EGD for the EU Southern Neighborhood countries located south of the Mediterranean Sea—northern Africa, the Middle East, etc. The authors believe that the EGD will lead to increased investment in renewable energy, reduced emissions and opportunities to finance green projects and green infrastructure. The EGD offers significant opportunities for improved cooperation on climate change and opportunities for job creation, green growth and sustainable development, leading to the supply of green resources and the creation of a market for environmentally friendly products in these countries.
Article [5] already concerns the problems of Ukraine regarding the EGD. Issues of energy efficiency, prevention of environmental pollution, rational use and reproduction of resources are priorities for the sustainable development of Ukraine. The authors believe that one of the most effective mechanisms for Ukraine to enter the European market is the transformation of economic mechanisms in accordance with the terms of the EGD transformation program for a carbon-neutral continent. The agricultural sector is the leading sector of the Ukrainian economy and, therefore, occupies a key place in the model for the implementation of the EGD.
One of the tasks associated with increasing the efficiency of energy and environmental resources is the development of agriculture in an urbanized environment and its monitoring using satellite data [6,7,8].
Agriculture within the urbanized environment (urban agglomerations) is an actual trend today. Many factors contribute to this, from efforts to improve urbanized areas’ ecology to partially providing the population with quality food. However, as shown by the example of Italy in C. Tapia (2021) in [9], aspects of the management and planning of these processes need to be more developed. The territory of modern megacities is entirely sufficient for industrial production, as the costs of logistics and delivery time from the producer and the consumer are fundamentally reduced, which is critically vital for berries and fruits, according to S. Ghosh (2021) in [10]. Compared with traditional crop production technologies regarding perishable products, GIS technologies still have enough reserves regarding the potential of use in urban agriculture. Traditional GIS applications in agricultural production are the analysis of the profitability of available lands based on their location and fertility potential, as shown in the example of Istanbul in the work of E. Ustaoglu (2021) in [11] and I.V. Hume (2021) in [12]. Despite the traditional use of GIS technology in urban agriculture, innovative approaches have been designed to consider the specifics of the urban environment. In the work of Till Weidner (2020) in [6], using GIS technologies, quantitative indicators of population centers in the city were calculated to calculate food residues, which can become a source of valuable organic fertilizers specifically for urban agriculture. The assessment of the impact of high-rise buildings on the level of illumination of potentially possible areas of the ground and roofs of buildings using satellites and UAVs with laser radars in Boston is shown in the work of M. Saha (2017) in [7]. In Vietnam, the work of Mathias Schaefer (2019) in [13] investigated the influence of heat islands of the city on the stress state of plants when choosing suitable plots for urban agriculture. Factors of human-made pollution inherent in the city were described in the work of Wenyou Hu (2018) in [14], where, based on GIS solutions, the identification of sources of soil pollution with heavy metals was carried out to determine the suitability of vacant areas for food production.
In the considered works, the researchers tried to adapt the city to the conditions of agriculture primarily to improve the population’s quality of life. An alternative to such an approach is the adaptation of crop production to the city’s conditions to use the city’s impact on the environment for the purpose of use in crop production practices. Thus, in the example of Australia and Kenya, in the work of Caleb Christian Amos (2018) in [15], the potential of the volume of rainwater from the roofs of buildings was considered for arid areas, the use of which is advisable when there is a lack of water for irrigation. In Barcelona, Angelica Mendoza Beltran (2022) [11] estimated N2O emissions according to the potential of its use in the vegetation practices of the metropolis.
Considering the rapid increase in the cost and availability of energy resources during 2021–2022, which may have a long-term trend, the issue of using non-traditional sources in general, particularly the thermal emissions of megacities of Ukraine for the needs of urban farming, is relevant.
The city of Kyiv was chosen for the research, which has several fundamental features of both an organizational nature in terms of urban planning and the topography of the area. The city is more than one and a half thousand years old, and as a result, industrial locations, high-rise buildings, historical quarters of the beginning of the 20th century and private low-rise buildings have been formed. Thanks to this character of the building, thermal skeletons of arbitrary configurations can be formed. In addition, the situation is complicated by the fact that the city is located on one side of the Dnieper on significant hills up to 100 m high and on the other side of the river is flat. Taking these features into account for the formation of heat islands in relation to increasing the growing season of plants in the practices of urban farming is innovative for Ukraine.
Ukraine, in comparison to the research areas discussed above, is a country with a cool climate and, accordingly, it would be appropriate for crop production to increase the period available for vegetation, that is, to use the heat emissions of megacities. According to Mohammad Karimi Firozjaei (2020) in [16], using the example of Amol city (Iran) and summarizing the results for the years 1985–2017, it was established that the temperature in a densely built-up city is 2.8 °C higher than in the surrounding countryside. Such results were confirmed in the experiments of Peter Kabano (2020) in [17] for the tropical climate in the city of Kampala (Uganda), where the temperature drop gradient from the city to the surrounding villages was calculated.
The aim of the work is to develop methods and means for determining stable islands of thermal energy to substantiate the energetically optimal locations for increasing the growing season in crop production practices in the metropolis of Ukraine.
According to the results of the literature search, the possibility of using the heat islands of the megacities of Ukraine for the needs of urban farming has practically not been investigated by scientists.
The issue of evaluating thermal spaces for the rational use of energy resources has traditionally been studied primarily for technologies of closed soil, where unevenness of thermal fields was also observed. Thus, in modern industrial greenhouses, the height can be 6 m, and the area is several hectares, due to which their thermal space is heterogeneous. Typical solutions to take this into account are the creation of a branched system as leading sensors by volume, shown in the work of O.V. Hudz (2021) in [18] and wireless sensors, shown in the work of Ee Ping Kho (2022) in [19]. However, despite the effort to make the sensor system as cheap as possible, taking into account the number of required sensors, the system turned out to be costly and complex (Bella Golub, 2019 [20]). In order to increase the reliability of the results in the work and Elad Levintal (2022) in [21], special self-propelled robots were proposed for experiments on the configuration of the temperature fields of the greenhouse.
Separately, the possibility of adaptation to environmental changes was built into the greenhouse heating control algorithms, and so in the work of A. Dudnyk (2018) in [22], the forecast was considered for choosing the optimal room heating tactics. Even for the volume of greenhouses, the thermal impact is uneven. At the same time, there are ready-made solutions for heating management in conditions of uncertainty caused by the influence of the environment.
It was impossible to discover in the literature the use of heat islands in the city in the aspect of an urbanized urban economy, which is probably explained by the relatively low cost of energy resources in the previous decades. However, such a question was investigated in city parks. In the review work of Sophie A. Nitoslawski (2019) in [23] devoted to trends in the development of city parks and squares, it was shown that green spaces are the most effective in reducing the negative impact of heat emissions by the city on the quality of life of its residents. That is, green areas can consume heat emissions from the city. Accordingly, it can be used for the production of plant products. Urban land resources are fundamentally different from rural areas, particularly the level of pollution caused by heavy metals, which was studied by S. Joimel (2016) in [24]. The pollution is not uniform, as it is caused both by the action of industrial enterprises and the concentration of automobile transport on internal combustion engines. Therefore, part of the territory of the metropolis is unsuitable for food production for environmental reasons. Although, such vegetable raw materials can be used for biogas production as an additional component for intensifying the fermentation of manure from cattle, according to V.M. Polishchuk (2021) in [25] and as pellets for fermentation together with bird droppings, according to V.M. Polishchuk (2021) in [26].
For urban forests, experiments were conducted on the modeling of heat islands depending on the features of the building and the topography of the area, according to J. Liu (2019) [27]. In addition to the total area of green spaces, the work of Qiu Kuanbiao (2019) in [28] shows the influence on the temperature reduction of the geometry of parks and the density of the total space of plants. All of that contradicts the data of A. Onishi (2010) testified in [29] that the decrease in temperature at the packaging sites of cars was approximately equally affected by landscaping purely with grass and combined with grass and trees. However, in his experiments, the number of trees was at most 30% of the total area. An alternative to grasses and trees in landscaping is vines, which have certain advantages in dense high-rise buildings. The prospects of green facades created using vines are shown in the work of A.M. Hunter (2014) in [30], where the possibility of their use, in particular, to reduce the temperature of building facades in the summer is proven. Similar results were obtained by H. Yin (2017) in [31], where the possibility of reducing the peak temperatures of urban heat islands during critical loads in the summer is shown.
It should be noted that the interest in greening cities using vines is explained by their better effect on air purification in cities compared to traditional trees, as shown in the review work of K.V. Abhijith (2017) in [32]. Methods for monitoring city heat islands have a more comprehensive range of tools than for greenhouse farms. Ground surveys with a thermal imaging camera are appropriate for the scale of a single street. The method developed by Esraa Elmarakby (2022) in [33] of measurements involves counter measurements from different ends of the street, which will ensure high accuracy and selectivity. However, it is challenging to implement for the scale of the city. Using UAVs with specialized thermal imaging cameras is effective for a particular area, as shown in the article by Garegin Tepanosyan (2021) in [34].
It is possible to create a map of thermal fields using a UAV, but in places with typical buildings, the formation of the plan is carried out thanks to means of GPS positioning, etc. In Ukraine, since 2014, in order to prevent terrorist attacks using cruise missiles or drones with explosives, GPS signal distortion systems have been used in megacities, thanks to which errors are introduced, the value of which is purposefully constantly changing. Thanks to this, the creation of a plan of significant areas of the metropolis with the help of UAVs can be difficult or impossible at all. In addition to organizational ones, there are purely technical limitations.
Therefore, in studying urban thermal fields using UAVs, they were primarily considered in critical seasons of the year concerning maximum temperatures. In urban agriculture, periods of minimum temperatures are more important, during which the operation of the most common small-sized battery-powered UAVs is limited.
Satellite technology is an alternative to UAVs for obtaining large-scale data, while indirect and direct measurement techniques are used to assess heat islands. The introduction of indirect methods was explained by the relatively small number of satellites equipped with specialized equipment and the impossibility of their operation in cloudy weather. Conditionally mediated methods can be divided into two groups: evaluation of the dynamics of changes in vegetation indices and fixation of lighting, which should correspond to the location of industrial facilities and places of compact residence of the urban population. Approaches to satellite monitoring of the dynamics of changes in the stress states of plantations for India are presented in the work of Bijay Halder (2021) in [35]. The estimation of the area of trees and lawns in the example of Kyiv (Ukraine) is presented in the work of N. Pasichnyk (2021) in [36]. The disadvantage of such methods is the difficulty of identifying plants in the shadow of high-rise buildings, which is inherent, especially in new areas of modern megacities. Regardless of the time of year, the use of night satellite images makes it possible to assess not only the location of stable heat emissions shown in the work of Yeran Sun (2020) in [37], but also, according to Di Yang (2020) in [38], the potential of CO2 emissions, which is particularly important for plant nutrition. Night satellite imaging requires satellites with high-resolution spectral sensor equipment in geostationary orbits, which as of 2021, are unavailable in most of Ukraine.
It should be noted that constant filming for monitoring heat islands of cities has a high potential for scientific and practical use, as shown in the work of Yue Chang (2021) in [39] on the research of Boston (USA), which established that part of the heat islands of the city has a fundamental daily specificity. Methods of indirect measurements can be used simultaneously and complement each other to increase accuracy and selectivity, as shown in the example of Hong Kong in the work of Yuanmao Zheng (2021) [40]. However, considering the regional specificity of winter in Ukraine, they are of limited use.
Direct measurements of surface thermal parameters can be carried out using such satellites as EOS (TERRA, AQUA), METOP, Suomi-NPP, and Landsat, the experience of using which in monitoring thermal fields is presented in Sorin Cheval (2022) in [41], T. Chakraborty (2021) in [42], and Terence Darlington Mushore (2017) in [43].
Compared to UAVs, satellite platforms have a fundamentally lower image resolution and are limited in use in the presence of clouds; however, it is with their use that it is easy to provide a series of experiments and, due to the large coverage area, to perform data calibration based on ground measurements. In satellite photography, as a rule, the shooting angle is constant and, accordingly, it is not possible to inspect the object from all sides, which is a drawback of the technique; however, when identifying promising areas, additional inspection from the ground or with the help of a UAV under manual control is possible.
The authors of this article, Pasichnyk et al. (2021), previously performed a spectral-spatial analysis of image data of plantings for identification of stresses of technological character [44].
Thus, based on the analysis of the literature for monitoring the temperature fields of the city because of the development of urban agriculture in relation to the increase of the available vegetation period in the spring and autumn periods, the following generalizations can be made:
- When using heat islands determined by the specifics of objects in urban areas, even with soil pollution, it is possible to grow industrial crops, in particular for biogas production;
- When choosing the optimal locations for the placement of green plantations for the production of biomass, the seasonal specificity of heat islands should be taken into account when excess surface heating is observed on a permanent basis precisely in the spring and autumn periods;
- To determine the stable locations of heat islands throughout the year in Ukraine, it is advisable to use data from specialized satellites with a thermal measurement channel for administrative and organizational reasons.
2. Materials and Methods
2.1. Methodology of the Experiment
The research was conducted in Kyiv, the largest metropolis in Ukraine. The list of publicly available satellites for this territory with an available thermal measurement channel as part of sensor equipment is given in Table 1.

Table 1.
Satellites to define LST (Land Surface Temperature).
The most outstanding value for scientific and practical research on a regional scale is the data on the temperature of the Earth’s surface on an average scale. In general, data on the temperature of the Earth’s surface can be obtained since 1982 (from the beginning of the Landsat-4 spacecraft). Landsat 8 and 9 satellite data are relevant for research, as they have acceptable spatial resolution and are currently relevant. In addition, the US Geological Survey recommends using Landsat 8 Band 10 data for quantitative analysis of thermal infrared sensor data for temperature estimation, and access to such data is possible using the specialized EO browser https://apps.sentinel-hub.com/eo-browser/ (accessed on 1 March 2024), the interface of which is presented in Figure 1.
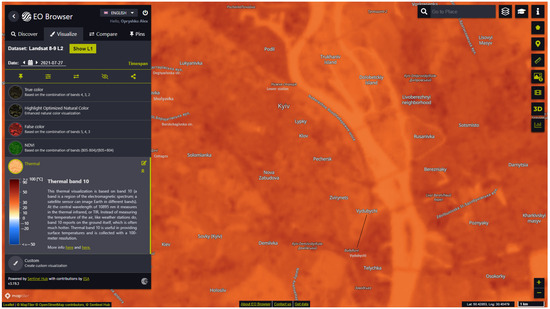
Figure 1.
EO Browser interface for the distribution map of thermal fields in Kyiv on 27 July 2021.
The site allows downloading satellite survey data for further processing in specialized GIS systems, such as QGIS, for which special plugins such as Q-LIP have been created for processing data from Landsat, proposed by Boutaina Sebbah (2021) in [45]. The specified interface provides a single scale for indicating the surface temperature from −50 to 100 °C, due to which it is challenging to distinguish thermal anomalies visually in the city conditions since the range of temperature distribution in the city, even in the summer months, does not exceed 25 °C. Using QGIS, a different color palette was introduced for the heat field distribution map, which was adjusted based on the maximum and minimum temperature.
Areas were selected that belonged to the entire spectrum of temperatures recorded on the thermal satellite image shown in Figure 2.
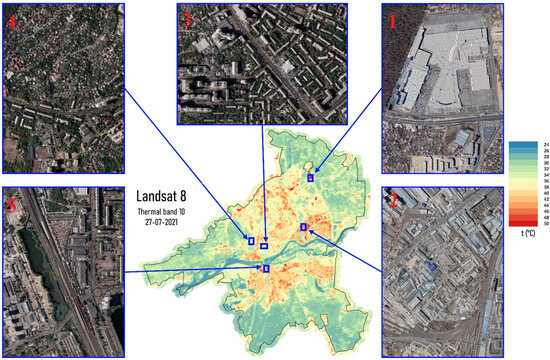
Figure 2.
Map of surface temperature distribution for the city of Kyiv on 27 July 2021.
- (1)
- Lavina. For research, five distinct city areas were selected concerning the heat islands identified in the summer of 2021. The dimensions of the experimental plots (50 × 70 pixels) were chosen based on the dimensions of the heat island caused by the functioning of the shopping and entertainment center “Lavina Mall”, which is the largest in Ukraine. The center was built in 2016 on the outskirts of Kyiv. Coordinates of the site center: 50.4952, 30.3600.
- (2)
- Podol. The plot is in the Podilsk district, characterized by a complex of production and warehouse premises. Coordinates of the site center: 50.4674, 30.5152.
- (3)
- Pechersk. The plot is near the “Furniture House” shopping center in the Pechersk district, which is characterized by Soviet-era buildings with modern shopping areas on the underground levels and the “Zvirinetska” metro station. Coordinates of the site center: 50.4165, 30.5431.
- (4)
- Tsimbal. The site in Holosiivskyi district is primarily the private sector with a low population concentration and large green areas of parks and homesteads. Coordinates of the site center: 50.3949, 30.5321.
- (5)
- Bereznyki. A plot of land in the Darnytskyi district is occupied by an array of metal garages for passenger cars, as well as a lake (Nizhny Telbin). Coordinates of the site center: 50.4258, 30.6071.
During previous studies, heat islands have been identified, but the random nature of these manifestations is quite possible, so serial experiments are needed to build a strategy for urban agriculture. If it is appropriate to use specialized software (QGIS 3.34.4 or its analogs) for one-off studies, then it is appropriate to develop specialized software for serial experiments. Since urban agriculture requires the involvement of specialists from various fields, namely agronomists, agrochemists, biologists, etc., who may have limited knowledge of the use of universal GIS systems, therefore, according to the authors, the use of web interfaces similar to EO Browser is promising.
2.2. Developing the Software for Studying Temperature Islands for Urban Agriculture Needs
The algorithm for the proposed web application is presented in Figure 3. In addition, in the description of the purpose of the program blocks, the main program codes are given (in italics):
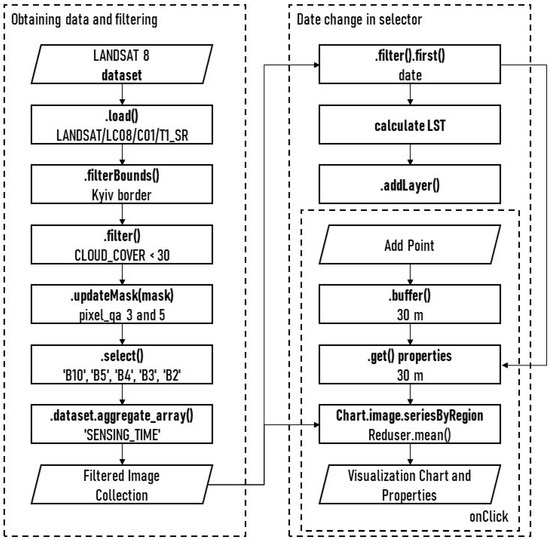
Figure 3.
Block diagram of the algorithm of the web application for the determination of stable thermal energy islands.
2.2.1. Data Preparation
Downloading the LANDSAT 8 set (load). Download the LANDSAT 8 collection, which includes atmospherically corrected data from the Landsat 8 OLI/TIRS sensors. Specifically, it contains three visible, two near-infrared (VNIR), and two short-wave infrared (SWIR) bands processed to orthorectified surface reflectance, in addition to two thermal infrared (TIR) bands processed to orthorectified brightness (Listing 1).
| Listing 1. Downloading the LANDSAT 8 set. |
 |
Filter the collection by area of interest (filterBounds). Applying a filter to a collection at an intersection with a given area of interest. Instances of the collection that do not cross the given territory are excluded from the collection (Listing 2).
| Listing 2. Filter the collection by area of interest. |
 |
Collection filter by cloudiness indicator (filter). Applying a filter to a collection by metadata. Smaller than the specified value of the selected indicator is excluded from the collection (Listing 3).
| Listing 3. Collection filter by cloudiness indicator (filter). |
 |
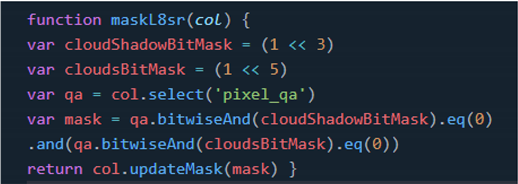
Masking of cloudiness and cloud shadows on all instances of the collection (updateMask), applying to the collection a masking function based on the pixel_qa channel of Landsat 8 data, in which bits 3 and 5 are cloud shadow and cloud, respectively. The 8-bit pixel_qa channel describes the quality of the pixels in the scene and allows us to determine their suitability for use (Listing 4).
| Listing 4. Masking of cloudiness and cloud shadows on all instances of the collection. |
 |
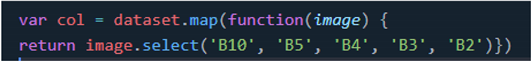
Selecting the required channels (select). Selection of channels is necessary for further calculations, namely B2 (blue, 0.452–0.512 μm), B3 (green, 0.533–0.590 μm), B4 (red, 0.636–0.673 μm), B5 (near infrared 0.851–0.879 μm) and B10 (thermal infrared, 10.60–11.19 μm) (Listing 5).
| Listing 5. Selecting the required channels (select). |
 |
Obtain a list of the date and time of shooting of available pictures (dataset.aggregate_array). Create an array with date and time elements of all available pictures in the area of interest for further transfer to the date selection selector (Listing 6).
| Listing 6. Obtain a list of the date and time of shooting of available pictures. |
 |
Changing the date in the selector. For identifying thermal islands in the city, it is advisable to study the changes in indicators for at least a year. However, only cloud-free areas of the images are suitable for measurements. The system automatically filters out images with cloudiness exceeding 30%. Since there is a particular scarcity of spectral data at this time, it is possible to expertly evaluate the suitability of thermal imaging when an additional layer is illuminated on the image in the visible range to identify cloud overlay.
Selection of an instance from the collection (filter().first). Applying a filter to the collection by date and time of shooting to obtain a specific instance (Listing 7).
| Listing 7. Selection of an instance from the collection. |
 |
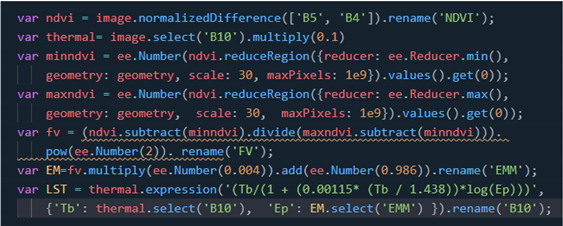
Calculation of LST (calculate LST). The approach for analyzing thermal infrared observations is based on using a single B10 Landsat 8 channel converted to LST. The Landsat 8 emissivity over the area of interest is estimated based on Landsat’s visible and near-infrared bands. Considering the vegetation cover, the vegetation-corrected Landsat emissivity is estimated from the bare ground emissivity and the vegetation emissivity (Listing 8).
| Listing 8. Calculation of LST. |
 |
2.2.2. Visualization of Layers (addLayer)
Land_Surface_Temperature_Landsat_8_band_10 displays the thermal radiation of the surface calculated for the selected instance of the collection, to which the default palette is applied (minimum value 10 °C, maximum value 30 °C);
True_Color_Landsat_8_bands_4_3_2 is a composite of the visible parts of the electromagnetic spectrum in the corresponding channels of red, green, and blue colors, resulting in a natural color display. Google Earth Engine services were used to visualize the locations of heat islands and expert assessment of the sources of heat emissions of the metropolis.
2.3. Selection of a Control Point on the Experimental Site (onClick)
During the preliminary testing of the program, methodological difficulties were revealed in determining the optimal temperature range for its further coding in the form of a color palette. For the summer months, the minimum temperature was determined based on archival data of water temperature observations in the river Dnipro in Kyiv. The maximum was determined in expert mode. For the winter months, this approach to determining the lower limit of the temperature range was unacceptable. An additional control point selection module (a circle with a radius of 30 m) was added to the program, which was set directly on the map using the mouse (Figure 4). When selecting a control point, the operator received its temperature value. The control point was changed at the next double-click of the left mouse button in the map field.
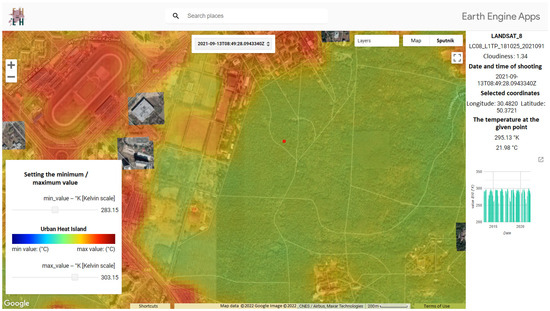
Figure 4.
The interface of the program for the study of thermal fields with the establishment of a control point (red circle) and its characteristics in terms of coordinates, temperature values, and a graph of temperature changes from the data of previous observations available in the archive (right part of the interface).
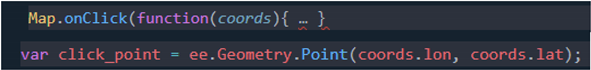
Obtaining the coordinates of a point (add point). By double-clicking the left mouse button, the operator indicates the experimental area, which is highlighted by a red circle (Listing 9).
| Listing 9. Obtaining the coordinates of a point. |
 |
Obtaining and outputting characteristics (.buffer). The average value of the temperature in °K and °C is calculated for the area of interest at a given point (Listing 10).
| Listing 10. Obtaining and outputting characteristics. |
 |
Building a plot ( .get() properties). On the section of the territory of interest, a given point shows the graph of the change of the indicator for the entire selected period. To calculate these statistics of image collections, the convolution operator reduce() is used (Listing 11).
| Listing 11. Building a plot. |
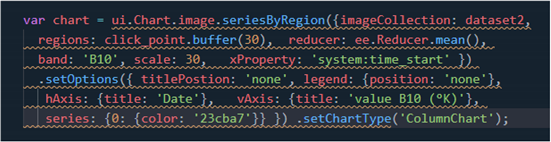 |
Formation of a series of images by region (Chart.image.seriesByRegion). Coding of information on surface temperature distribution in the form of a color palette
Formation of original graphic information (Visualization Chart and Properties). Data are ready, the result can be exported to other software products if needed.
2.4. Statistical Processing of Results for Experimental Plots
Since the surface temperature can vary significantly within the area, which consists of several hundred points, the distribution map encoded in the form of a color palette was processed in the MathCad mathematical package according to the method described by D. Komarchuk (2020) in [46] and N.A. Pasichnyk (2021) in [47]. The data decoding method was modified, and an alternative HSL color model was used instead of the RGB color model. Since the information coding system was considered in the form of a palette, one Hue parameter (a degree on the color wheel from 0 to 360), was considered for the HSL color model instead of 3 inherent in the RGB color model, which facilitated data processing.
3. Results
The temperature map of the city of Kyiv dated 23 January 2021 shows that the difference is about 5 °C within the city limits recorded with the help of the Landsat 8 satellite (Figure 5).
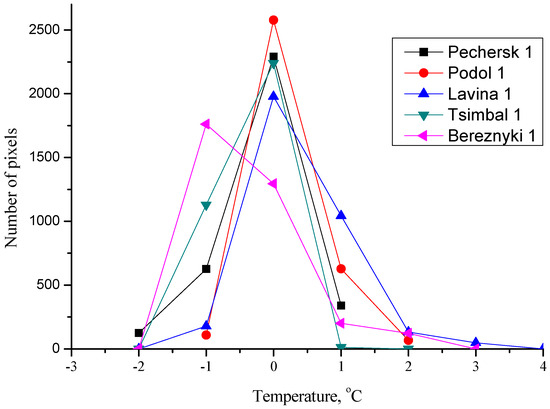
Figure 5.
Temperature distribution for research facilities in Kyiv as of 23 January 2021.
The Gaussian model with the corresponding Equation (1) was chosen to approximate the experimental data.
where: N—the number of pixels (minimum areas of the image);
A—amplitude;
t—temperature (°C),
tc—average temperature value (°C);
w—standard deviation (corresponds to the value of A/2).
During the calculations, it was established that the coefficient of determination R2 for such objects as Pechersk, Podol, Tsimbal was greater than 0.96, that is, the approximating equation was correct for them. For Lavina and Bereznyki plots, the situation of R2 was somewhat different. The increase in temperature in the spring and autumn periods leads to a significant increase in the growing season for vegetation, in particular in urban conditions, which was experimentally proven in the works of You-Ren Wang (2023) in [48] and Xueling Zhang (2024) in [49] for example the bridge of China.
In addition to the winter months, the spring-autumn periods for the development of vegetation processes, as well as the summer period for drought, are decisive for crop production. Based on the results of the January monitoring, the experimental sites were divided into two groups, namely Pechersk, Podol, Tsimbal (Figure 6) and Lavina, Bereznyki (Figure 7). Since the temperature range was 5–25 °C for monitoring in the spring-autumn period, and 30–50 °C in the summer, for the assessment of heat islands, the absolute temperature value was not considered, but rather the difference between the minimum and maximum temperature on the map. The minimum temperature during surface temperature monitoring from spring to autumn was recorded in the north of Kyiv in the Dnipro riverbed (coordinates 50.5250, 30.5359).
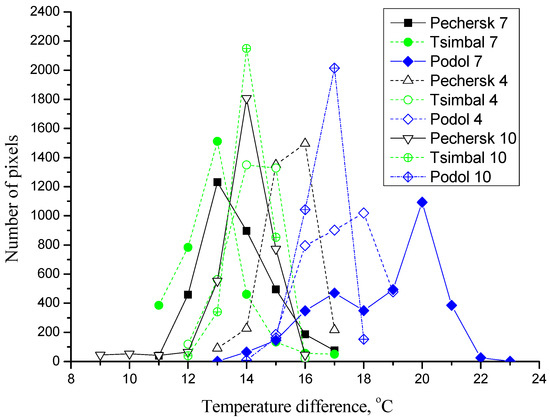
Figure 6.
Distribution of temperature difference for experimental objects in Kyiv for 6 April 2021, 15 October 2021 and 1 July 2021.
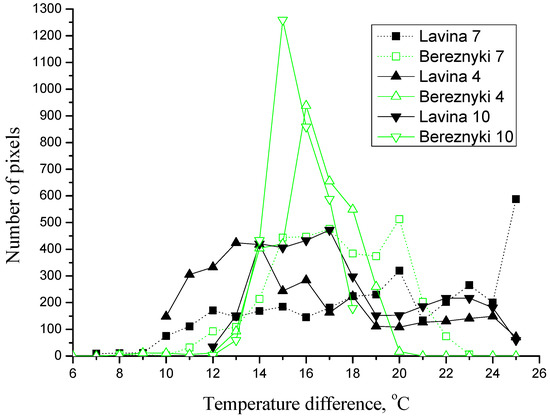
Figure 7.
Distribution of temperature difference for experimental objects in Kyiv for 6 April 2021, 15 October 2021 and 1 July 2021.
The obtained results for the first group of plots are shown in Figure 6.
During the statistical analysis, it was established that the nature of the distribution has not changed and the coefficient of determination R2 for the Pechersk and Tsimbal sites, regardless of the season, exceeds 0.98. For both sites, the minimum value of the standard deviation was recorded in January and was about 0.5 °C, and the maximum in July was about 1 °C. In contrast to the previous sites in the group, for the Podol site, the value of R2 was recorded at 0.51 in July, and 0.8 in April, while in January and October, by analogy with the previous sites, it was 0.98. For this area, the minimum standard deviation was recorded in January and October, 0.46 °C and 0.59 °C, respectively, but in April and July it increased to 1.4 °C and 1.9 °C, respectively.
A greater concentration of non-residential premises is characteristic of the second group, namely the Bereznyki and Lavina areas, the results of which are presented in Figure 7.
For the Bereznyki site, R2 values for January, April, October, and July were 0.97, 0.94, 0.88, and 0.88, respectively. The minimum standard deviation in January is 0.5 °C and the maximum in July is 2.8 °C, in April and October 1.7 °C and 1.2 °C, respectively.
For the Lavina site, the results were fundamentally different. The value of R2 for January, April, October and July was 0.99, 0.54, 0.38 and 0.57, respectively; that is, a normal distribution was observed only in January.
4. Discussion
For parts of the city, namely, Pechersk, Podol, Tsimbal, the normal nature of the distribution was stable throughout the year. For these areas, the appropriateness of choosing the Gaussian distribution is confirmed by the estimated value of the coefficient of determination greater than 0.98. Given the presence of vegetation, the established nature of the dependence coincides with the results obtained for spectral monitoring in the works of D. Komarchuk (2020) in [46], Xihan Mu (2017) in [50] and Lucie Kupková (2023) in [51]. The explanation of this phenomenon lies in the well-balanced architecture of the districts with a significant number of garden and park zones, in particular, and vegetation in general. Undoubtedly, there are sources of heat emissions in these areas of the city, but due to the diffusion of cool air from parks and squares and air from industrial and residential buildings, dangerous heat islands are not fixed.
The accompanying economic effects of the plant sector of urban farming, namely, the utilization of excess heat, the consumption of rainwater, etc., can be very significant. For the maximum effect, it is necessary that the plants receive the maximum phytomass in a timely manner, which would function as long as possible. In recent years, certain climate changes have been observed in Ukraine, in which the summer and winter periods increase in length and the spring and autumn periods decrease, which negatively affects the vegetation of plants. Such phenomena of climate change in Europe are described in the work of Marie Van Espen (2023) in [52], where it is shown that the most critical changes occur precisely in the southern countries of Europe. In addition, according to Markus Simbürger (2022) in [53], a characteristic feature of climate change during global warming is the high risk of frosts in the spring, which can have a critical effect on plants. Accordingly, it is not certain stable temperatures throughout the year that are important for urban farming, but the promotion of vegetation in the spring and, to a lesser extent, in the fall, in order to achieve the maximum ripening of the crop. Based on this, locations where heat emissions occur precisely in the spring and autumn periods are energetically optimal for plant growing practices of urban farming.
The situation is different for the Lavina and Bereznyki sites, which can probably be explained by the presence of objects on the site and fundamentally different thermal radiation. If the number of plots with the minimum and maximum temperature is approximately the same at the Lavina site, the situation is different for the Bereznyki location—the number of plots with the minimum temperature is several times higher. The reason for this, according to the authors, is the presence of a significant number of water bodies (low temperature) at the Bereznyki location, and the maximum temperatures are a consequence of the operation of commercial and office buildings with significant heat emissions. Similar phenomena were described in the works of X. Dai (2012) in [54] and X. Dai (2016) in [55] regarding satellite monitoring of thermal pollution from nuclear power plants. The second cooling circuit of the power units was carried out using sea water, and the temperature distribution was uniform in the coastal areas, but not on the shelf boundaries. Therefore, the situation with the fixation of pronounced heat islands in the Bereznyki area is probably explained by insufficient air diffusion caused by the relief created by high-rise buildings in this area. This statement is supported by the relatively flat landscape of buildings on the Lavina site, where, accordingly, such heat islands were less pronounced in the summer. Similar results using a UAV with thermal imaging sensor equipment were also obtained during monitoring of the city in the work of S. Stagakis (2019) in [56], and it was completed accordingly, a conclusion of the expediency of taking into account the terrain and the passage of air currents regarding the impact on heat islands. Unfortunately, the use of UAVs, despite the positives regarding the ultra-high resolution of monitoring tools, has certain limitations, in particular regarding the duration of flights, safety of operation, and in particular the possible presence of areas where flights are not allowed. In the future, IoT technologies, which are conceptually presented for tracking heat islands of urbanized areas in the work of Z. Zhao (2018) in [57], are able to provide accurate and operational information, but the possibility of identifying unexpected sources with their help is doubtful. Therefore, there is a need to implement special thermal monitoring satellites, the concept of which is described in the work of F. Mo (2018) in [58] with a resolution of 5 m. The field of use of such a tool in geostationary orbit may well be expanded for the needs of urban agriculture.
Considering the prospects of urban agriculture, a stable difference of 3–5 °C in winter is an important factor regarding the possibility of cultivating even non-frost-resistant plants in the specified locations. That is, if for the plots of the residential massif with park zones the growth of the standard deviation in the summer compared to the winter observation was three-fold, then for the Podol industrial zone the growth was four-fold, and in April there was a three-fold increase.
The probable explanation for this is the insufficient level of greening of industrial sites and the flat concrete and metal roofs of buildings, which are typical of industrial and warehouse buildings. It is possible to reduce the heating of such roofs either due to a special design of tiles, for example, as presented by H. Salem (2023) in [59], or by the introduction of “green roofs” made of lawns implemented in particular in Italy by M. La Gennusa (2018) in [60] or planned according to M. Palme (2022) in [61] in Chile.
An interesting situation regarding heat emissions was recorded for the Lavina facility, where a deviation from the normal nature of the heating distribution was recorded for the site. According to the authors, this situation can be explained only by the presence of several stable sources of man-made heat emissions. The construction of a modern shopping and entertainment center is characterized by the placement of high-powered ventilation and air conditioning systems on the roof, the effect of which was recorded during satellite monitoring. Even in January, the temperature difference in this area was 4 °C, which can be used for the needs of urban agriculture. That is, on the example of the Lavina complex, an area with stable man-made heat emissions throughout the year was discovered. The development of plant breeding practices on its basis can be fully justified both from energy and logistical issues and to improve the ecology of the environment. Since the area of heat emissions in winter is relatively small and the roof has a horizontal projection, the use of traditional vines aimed at vertical surfaces is limited. Alternative landscaping can be one-year prostrate crops such as pumpkins, melons, etc., which do not require a branched root system and have a large area of leaves, i.e., are capable of darkening the structure in case of critical overheating.
The materials of this study will be useful in gardens when treating plants with hot fog [62], magnetic-pulse processing of plants and seedlings [63,64,65], as well as in other sectors of the economy [66].
5. Conclusions
It was established that the temperature map of the city of Kyiv from 23 January 2021 shows the temperature difference between different parts of the city. Some areas of the city, such as Pechersk, Podol and Tsimbal, have a normal temperature distribution, while the Lavina and Bereznyki areas have different temperature distributions, possibly due to different sources of thermal radiation.
The results of measurements show that the standard deviation of the temperature in the plots depends on many factors, including the season and the type of land use. For plots with park zones in the residential massif, the growth of the standard deviation in summer compared to winter was twofold, while for the Podol industrial zone the growth was fourfold, which is not a consequence of insufficient greening.
It is shown that stable man-made heat emissions were detected at the Lavina site throughout the year, which can be used for the development of plant breeding practices in terms of energy and logistics, as well as for improving the ecology of the environment. However, due to the fact that the area of heat emissions in winter is relatively small and the roof has a horizontal projection, the use of traditional vines aimed at vertical surfaces is limited. Thus, it is necessary to find alternative solutions for the development of crop production in this area, taking into account the characteristics of heat emissions.
Author Contributions
Conceptualization, O.O. and T.H.; methodology, N.P., N.K. and T.H.; funding acquisition, K.M. and N.P.; resources, A.D. and V.K.; writing—original draft, P.Ł. and N.K.; writing—review and editing, A.D. and N.K.; Software, K.M. and A.D.; Validation, O.O.; Data curation, N.K. and P.H.; Formal analysis, A.D. and P.Ł.; supervision, T.H. All authors have read and agreed to the published version of the manuscript. All authors reviewed the manuscript.
Funding
Financed from the subsidy of the Ministry of Education and Science for the Hugo Kołłątaj Agricultural University in Kraków for the year 2024.
Institutional Review Board Statement
Not applicable.
Informed Consent Statement
Not applicable.
Data Availability Statement
Data are contained within the article.
Acknowledgments
Anonymous reviewers are gratefully acknowledged for their constructive review that significantly improved this manuscript and Ukrainian University in Europe (universityuue.com).
Conflicts of Interest
The authors declare no conflicts of interest.
References
- Faichuk, O.; Voliak, L.; Hutsol, T.; Glowacki, S.; Pantsyr, Y.; Slobodian, S.; Szeląg-Sikora, A.; Gródek-Szostak, Z. European Green Deal: Threats Assessment for Agri-Food Exporting Countries to the EU. Sustainability 2022, 14, 3712. [Google Scholar] [CrossRef]
- Ciot, M.-G. Implementation Perspectives for the European Green Deal in Central and Eastern Europe. Sustainability 2022, 14, 3947. [Google Scholar] [CrossRef]
- Vindel, J.M.; Trincado, E.; Sánchez-Bayón, A. European Union Green Deal and the Opportunity Cost of Wastewater Treatment Projects. Energies 2021, 14, 1994. [Google Scholar] [CrossRef]
- Sandri, S.; Hussein, H.; Alshyab, N.; Sagatowski, J. The European Green Deal: Challenges and opportunities for the Southern Mediterranean. Mediterr. Politics 2023, 1–12. [Google Scholar] [CrossRef]
- Labenko, O.; Sobchenko, T.; Hutsol, T.; Cupiał, M.; Mudryk, K.; Kocira, A.; Pavlenko-Didur, K.; Klymenko, O.; Neuberger, P. Project Environment and Outlook within the Scope of Technologically Integrated European Green Deal in EU and Ukraine. Sustainability 2022, 14, 8759. [Google Scholar] [CrossRef]
- Weidner, T.; Yang, A. The potential of urban agriculture in combination with organic waste valorization: Assessment of resource flows and emissions for two European cities. J. Clean. Prod. 2020, 244, 118490. [Google Scholar] [CrossRef]
- Saha, M.; Eckelman, M.J. Growing fresh fruits and vegetables in an urban landscape: A geospatial assessment of ground level and rooftop urban agriculture potential in Boston, USA. Landsc. Urban Plan. 2017, 165, 130–141. [Google Scholar] [CrossRef]
- Beltran, A.M.; Jepsen, K.; Rufí-Salís, M.; Ventura, S.; Lopez, C.M.; Villalba, G. Mapping direct N2O emissions from peri-urban agriculture: The case of the Metropolitan Area of Barcelona. Sci. Total Environ. 2022, 822, 153514. [Google Scholar] [CrossRef] [PubMed]
- Tapia, C.; Randall, L.; Wang, S.; Borges, L.A. Monitoring the contribution of urban agriculture to urban sustainability: An indicator-based framework. Sustain. Cities Soc. 2021, 74, 103130. [Google Scholar] [CrossRef]
- Ghosh, S. Urban agriculture potential of home gardens in residential land uses: A case study of regional City of Dubbo, Australia. Land Use Policy 2021, 109, 105686. [Google Scholar] [CrossRef]
- Ustaoglu, E.; Sisman, S.; Aydınoglu, A.C. Determining agricultural suitable land in peri-urban geography using GIS and Multi Criteria Decision Analysis (MCDA) techniques. Ecol. Model. 2021, 455, 109610. [Google Scholar] [CrossRef]
- Hume, I.V.; Summers, D.M.; Cavagnaro, T.R. Self-sufficiency through urban agriculture: Nice idea or plausible reality? Sustain. Cities Soc. 2021, 68, 102770. [Google Scholar] [CrossRef]
- Schaefer, M.; Thinh, N.X. Evaluation of Land Cover Change and Agricultural Protection Sites: A GIS and Remote Sensing Approach for Ho Chi Minh City, Vietnam. Heliyon 2019, 5, e01773. [Google Scholar] [CrossRef] [PubMed]
- Hu, W.; Wang, H.; Dong, L.; Huang, B.; Borggaard, O.K.; Hansen, H.C.B.; He, Y.; Holm, P.E. Source identification of heavy metals in peri-urban agricultural soils of southeast China: An integrated approach. Environ. Pollut. 2018, 237, 650–666. [Google Scholar] [CrossRef]
- Amos, C.C.; Rahman, A.; Karim, F.; Gathenya, J.M. A Scoping Review of Roof Harvested Rainwater Usage in Urban Agriculture: Australia and Kenya in Focus. J. Clean. Prod. 2018, 202, 174–190. [Google Scholar] [CrossRef]
- Firozjaei, M.K.; Fathololoumi, S.; Kiavarz, M.; Arsanjani, J.J.; Alavipanah, S.K. Modelling surface heat island intensity according to differences of biophysical characteristics: A case study of Amol city, Iran. Ecol. Indic. 2020, 109, 105816. [Google Scholar] [CrossRef]
- Kabano, P.; Lindley, S.; Harris, A. Evidence of urban heat island impacts on the vegetation growing season length in a tropical city. Landsc. Urban Plan. 2020, 206, 103989. [Google Scholar] [CrossRef]
- Bushma, A.V.; Hudz, O.V.; Kwrpiuk, A.D.; Holub, B.L.; Dudnyk, A.O. Optical sensor for the detection of mycotoxins. Semicond. Phys. Quantum Electron. Optoelectron. 2021, 24, 227–233. [Google Scholar] [CrossRef]
- Kho, E.P.; Chua, S.N.D.; Lim, S.F.; Lau, L.C.; Gani, M.C.N. Development of young sago palm environmental monitoring system with wireless sensor networks. Comput. Electron. Agric. 2022, 193, 106723. [Google Scholar] [CrossRef]
- Golub, B.; Hudz, A.; Dudnyk, A.; Bushma, A. Production of Biotechnological Objects using Business Intelligence. In Proceedings of the 2019 9th International Conference on Advanced Computer Information Technologies (ACIT), Ceske Budejovice, Czech Republic, 5–7 June 2019; pp. 200–204. [Google Scholar] [CrossRef]
- Levintal, E.; Kang, K.L.; Larson, L.; Winkelman, E.; Nackley, L.; Weisbrod, N.; Selker, J.S.; Udell, C.J. eGreenhouse: Robotically positioned, low-cost, open-source CO2 analyzer and sensor device for greenhouse applications. HardwareX 2021, 9, e00193. [Google Scholar] [CrossRef] [PubMed]
- Dudnyk, A.; Lysenko, V.; Zaets, N.; Komarchuk, D.; Lendiel, T.; Yakymenko, I. Intelligent Control System of Biotechnological Objects with Fuzzy Controller and Noise Filtration Unit. In Proceedings of the 2018 International Scientific-Practical Conference Problems of Infocommunications. Science and Technology (PIC S&T), Kharkiv, Ukraine, 9–12 October 2018; pp. 586–590. [Google Scholar] [CrossRef]
- Nitoslawski, S.A.; Galle, N.J.; Van Den Bosch, C.K.; Steenberg, J.W. Smarter ecosystems for smarter cities? A review of trends, technologies, and turning points for smart urban forestry. Sustain. Cities Soc. 2019, 51, 101770. [Google Scholar] [CrossRef]
- Joimel, S.; Cortet, J.; Jolivet, C.C.; Saby, N.P.A.; Chenot, E.D.; Branchu, P.; Consalès, J.N.; Lefort, C.; Morel, J.L.; Schwartz, C. Physico-chemical characteristics of topsoil for contrasted forest, agricultural, urban and industrial land uses in France. Sci. Total Environ. 2016, 545–546, 40–47. [Google Scholar] [CrossRef]
- Polishchuk, V.M.; Shvorov, S.A.; Flonts, I.V.; Davidenko, T.S.; Dvornyk, Y.O. Increasing the Yield of Biogas and Electricity during Manure Fermentation Cattle by Optimally Adding Lime to Extruded Straw. Probl. Energeticii Reg. 2021, 1, 73–85. [Google Scholar] [CrossRef]
- Polishchuk, V.; Shvorov, S.; Zablodskiy, M.; Kucheruk, P.P.; Davidenko, T.S.; Dvornyk, Y.O. Effectiveness of Adding Extruded Wheat Straw to Poultry Manure to Increase the Rate of Biogas Yield. Probl. Energ. Reg. 2021, 3, 111–124. [Google Scholar] [CrossRef]
- Liu, J.; Zhang, L.; Zhang, Q.; Zhang, G.; Teng, J. Predicting the surface urban heat island intensity of future urban green space development using a multi-scenario simulation. Sustain. Cities Soc. 2021, 66, 102698. [Google Scholar] [CrossRef]
- Qiu, K.; Jia, B. The roles of landscape both inside the park and the surroundings in park cooling effect. Sustain. Cities Soc. 2019, 52, 101864. [Google Scholar] [CrossRef]
- Onishi, A.; Cao, X.; Ito, T.; Shi, F.; Imura, H. Evaluating the potential for urban heat-island mitigation by greening parking lots. Urban For. Urban Green. 2010, 9, 323–332. [Google Scholar] [CrossRef]
- Hunter, A.M.; Williams, N.S.; Rayner, J.P.; Aye, L.; Hes, D.; Livesley, S.J. Quantifying the thermal performance of green façades: A critical review. Ecol. Eng. 2014, 63, 102–113. [Google Scholar] [CrossRef]
- Yin, H.; Kong, F.; Middel, A.; Dronova, I.; Xu, H.; James, P. Cooling effect of direct green façades during hot summer days: An observational study in Nanjing, China using TIR and 3DPC data. Build. Environ. 2017, 116, 195–206. [Google Scholar] [CrossRef]
- Abhijith, K.V.; Kumar, P.; Gallagher, J.; McNabola, A.; Baldauf, R.; Pilla, F.; Broderick, B.; Sabatino, S.D.; Pulvirenti, B. Air pollution abatement performances of green infrastructure in open road and built-up street canyon environments—A review. Atmos. Environ. 2017, 162, 71–86. [Google Scholar] [CrossRef]
- Elmarakby, E.; Khalifa, M.; Elshater, A.; Afifi, S. Tailored methods for mapping urban heat islands in Greater Cairo Region. Ain Shams Eng. J. 2022, 13, 101545. [Google Scholar] [CrossRef]
- Tepanosyan, G.; Muradyan, V.; Hovsepyan, A.; Pinigin, G.; Medvedev, A.; Asmaryan, S. Studying spatial-temporal changes and relationship of land cover and surface Urban Heat Island derived through remote sensing in Yerevan, Armenia. Build. Environ. 2021, 187, 107390. [Google Scholar] [CrossRef]
- Halder, B.; Bandyopadhyay, J.; Banik, P. Monitoring the effect of urban development on urban heat island based on remote sensing and geo-spatial approach in Kolkata and adjacent areas, India. Sustain. Cities Soc. 2021, 74, 103186. [Google Scholar] [CrossRef]
- Pasichnyk, N.; Komarchuk, D.; Opryshko, O.; Shvorov, S.; Reshetiuk, V.; Oksana, B. Technologies for Environmental Monitoring of the City. In Proceedings of the 2021 IEEE 16th International Conference on the Experience of Designing and Application of CAD Systems (CADSM), Lviv, Ukraine, 22–26 February 2021; pp. 40–43. [Google Scholar] [CrossRef]
- Sun, Y.; Wang, S.; Wang, Y. Estimating local-scale urban heat island intensity using nighttime light satellite imageries. Sci. Total Environ. 2020, 57, 102125. [Google Scholar] [CrossRef]
- Yang, D.; Luan, W.; Qiao, L.; Pratama, M. Modeling and spatio-temporal analysis of city-level carbon emissions based on nighttime light satellite imagery. Appl. Energy 2020, 268, 114696. [Google Scholar] [CrossRef]
- Chang, Y.; Xiao, J.; Li, X.; Frolking, S.; Zhou, D.; Schneider, A.; Weng, Q.; Yu, P.; Wang, X.; Li, X.; et al. Exploring diurnal cycles of surface urban heat island intensity in Boston with land surface temperature data derived from GOES-R geostationary satellites. Sci. Total Environ. 2021, 763, 144224. [Google Scholar] [CrossRef] [PubMed]
- Zheng, Y.; Tang, L.; Wang, H. An improved approach for monitoring urban built-up areas by combining NPP-VIIRS nighttime light, NDVI, NDWI, and NDBI. J. Clean. Prod. 2021, 328, 129488. [Google Scholar] [CrossRef]
- Cheval, S.; Dumitrescu, A.; Irașoc, A.; Paraschiv, M.-G.; Perry, M.; Ghent, D. MODIS-based climatology of the Surface Urban Heat Island at country scale (Romania). Urban Clim. 2022, 41, 101056. [Google Scholar] [CrossRef]
- Chakraborty, T.C.; Lee, X.; Ermida, S.; Zhan, W. On the land emissivity assumption and Landsat-derived surface urban heat islands: A global analysis. Remote Sens. Environ. 2021, 265, 112682. [Google Scholar] [CrossRef]
- Mushore, T.D.; Odindi, J.; Dube, T.; Matongera, T.N.; Mutanga, O. Remote sensingapplications in monitoring urban growth impacts on in-and-out door thermal con-ditions: A review. Remote Sens. Appl. Soc. Environ. 2017, 8, 83–93. [Google Scholar]
- Pasichnyk, N.; Komarchuk, D.; Opryshko, O.; Shvorov, S.; Kiktev, N. Methodology for Software Assessment of the Conformity of Atmospheric Correction from the UAV’s Zenith Sensor. In Proceedings of the 2021 IEEE 6th International Conference on Actual Problems of Unmanned Aerial Vehicles Development (APUAVD), Kyiv, Ukraine, 19–21 October 2021; pp. 1–5. [Google Scholar] [CrossRef]
- Sebbah, B.; Alaoui, O.Y.; Wahbi, M.; Maâtouk, M.; Achhab, N.B. QGIS-Landsat Indices plugin (Q-LIP): Tool for environmental indices computing using Landsat data. Environ. Model. Softw. 2021, 137, 104972. [Google Scholar] [CrossRef]
- Komarchuk, D.; Pasichnyk, N.; Lysenko, V.; Opryshko, O.; Shvorov, S.; Reshetiuk, V.; Udovenko, O.; Knizhka, T.; Kharinova, M. Algorithms and Software for UAV Flight Planning for Monitoring the Stress Conditions of Plantations. In Proceedings of the 2020 IEEE 6th International Conference on Methods and Systems of Navigation and Motion Control (MSNMC), Kyiv, Ukraine, 20–23 October 2020; pp. 146–149. [Google Scholar] [CrossRef]
- Pasichnyk, N.; Komarchuk, D.; Korenkova, H.; Shvorov, S.; Opryshko, O.; Kiktev, N. Spectral-spatial analysis of data of images of plantings for identification of stresses of technological character. In Proceedings of the 2nd International Conference on Intellectual Systems and Information Technologies (ISIT 2021) Co-Located with 1st International Forum “Digital Reality” (DRForum 2021). CEUR Workshop Proceedings, Odesa, Ukraine, 13–19 September 2021; Volume 3126, pp. 305–312. [Google Scholar]
- Wang, Y.R.; Samset, B.H.; Stordal, F.; Bryn, A.; Hessen, D.O. Past and future trends of diurnal temperature range and their correlation with vegetation assessed by MODIS and CMIP6. Sci. Total Environ. 2023, 904, 166727. [Google Scholar] [CrossRef] [PubMed]
- Zhang, X.; Kasimu, A.; Liang, H.; Wei, B.; Aizizi, Y.; Han, F. Mechanism analysis of vegetation phenology in an urban agglomeration in an arid zone driven by seasonal land surface temperatures. Urban Clim. 2024, 53, 101795. [Google Scholar] [CrossRef]
- Mu, X.; Hu, R.; Zeng, Y.; McVicar, T.R.; Ren, H.; Song, W.; Wang, Y.; Casa, R.; Qi, J.; Xie, D.; et al. Estimating structural parameters of agricultural crops from ground-based multi-angular digital images with a fractional model of sun and shade components. Agric. For. Meteorol. 2017, 246, 162–177. [Google Scholar] [CrossRef]
- Kupková, L.; Červená, L.; Potůčková, M.; Lysák, J.; Roubalová, M.; Hrázský, Z.; Březina, S.; Epstein, H.E.; Müllerová, J. Towards reliable monitoring of grass species in nature conservation: Evaluation of the potential of UAV and PlanetScope multi-temporal data in the Central European tundra. Remote Sens. Environ. 2023, 294, 113645. [Google Scholar] [CrossRef]
- Van Espen, M.; Williams, J.H.; Alves, F.; Hung, Y.; de Graaf, D.C.; Verbeke, W. Beekeeping in Europe facing climate change: A mixed methods study on perceived impacts and the need to adapt according to stakeholders and beekeepers. Sci. Total Environ. 2023, 888, 164255. [Google Scholar] [CrossRef]
- Simbürger, M.; Dreisiebner-Lanz, S.; Kernitzkyi, M.; Prettenthaler, F. Climate risk management with insurance or tax-exempted provisions? An empirical case study of hail and frost risk for wine and apple production in Styria. Int. J. Disaster Risk Reduct. 2022, 80, 103216. [Google Scholar] [CrossRef]
- Dai, X.; Guo, Z.; Lin, Y.; Wei, C.; Ye, S. Application of satellite remote sensing data for monitoring thermal discharge pollution from Tianwan nuclear power plant in eastern China. In Proceedings of the 2012 5th International Congress on Image and Signal Processing, Chongqing, China, 16–18 October 2012; pp. 1019–1023. [Google Scholar] [CrossRef]
- Dai, X.; Guo, Z.; Chen, Y.; Ma, P.; Chen, C. Monitoring of thermal plume discharged from thermal and nuclear power plants in eastern China using satellite images. In Proceedings of the 2016 IEEE International Geoscience and Remote Sensing Symposium (IGARSS), Beijing, China, 10–15 July 2016; pp. 7659–7662. [Google Scholar] [CrossRef]
- Stagakis, S.; Burud, I.; Thiis, T.; Gaitani, N.; Panagiotakis, E.; Lantzanakis, G.; Spyridakis, N.; Chrysoulakis, N. Spatiotemporal monitoring of surface temperature in an urban area using UAV imaging and tower-mounted radiometer measurements. In Proceedings of the 2019 Joint Urban Remote Sensing Event (JURSE), Vannes, France, 22–24 May 2019; pp. 1–4. [Google Scholar] [CrossRef]
- Zhao, Z.; Wang, J.; Fu, C.; Liu, D.; Li, B. Demo Abstract: Smart City: A Real-Time Environmental Monitoring System on Green Roof. In Proceedings of the 2018 IEEE/ACM Third International Conference on Internet-of-Things Design and Implementation (IoTDI), Orlando, FL, USA, 17–20 April 2018; pp. 300–301. [Google Scholar] [CrossRef]
- Mo, F.; Li, H.; Jing, Q.; Zhang, X.; Cao, B.; Liu, Q. Research on High Resolution Thermal Infrared Satellite Technology and Applications. In Proceedings of the IGARSS 2018—2018 IEEE International Geoscience and Remote Sensing Symposium, Valencia, Spain, 22–27 July 2018; pp. 5674–5677. [Google Scholar] [CrossRef]
- Salem, H.; Sedaghat, A.; Malayer, M.A. Passive Cooling with Finned Roof Tiles. In Proceedings of the 2023 7th International Conference on Green Energy and Applications (ICGEA), Singapore, 10–12 March 2023; pp. 204–208. [Google Scholar] [CrossRef]
- La Gennusa, M.; Peri, G.; Scaccianoce, G.; Sorrentino, G.; Aprile, S. A Case-Study of Green Roof Monitoring: The Building of Council for Agricultural Research and Economics in Bagheria, (Italy). In Proceedings of the 2018 IEEE International Conference on Environment and Electrical Engineering and 2018 IEEE Industrial and Commercial Power Systems Europe (EEEIC/I&CPS Europe), Palermo, Italy, 12–15 June 2018; pp. 1–5. [Google Scholar] [CrossRef]
- Palme, M.; Carrasco, C.; Valenzuela, J. Patterns evolution of Urban Heat Island phenomenon in Chilean cities and proposal of mitigation strategies by climatic emplacement. In Proceedings of the 2022 7th International Conference on Smart and Sustainable Technologies (SpliTech), Split/Bol, Croatia, 5–8 July 2022; pp. 1–4. [Google Scholar] [CrossRef]
- Khort, D.; Kutyrev, A.; Kiktev, N.; Hutsol, T.; Glowacki, S.; Kuboń, M.; Nurek, T.; Rud, A.; Gródek-Szostak, Z. Automated Mobile Hot Mist Generator: A Quest for Effectiveness in Fruit Horticulture. Sensors 2022, 22, 3164. [Google Scholar] [CrossRef]
- Smirnov, I.; Khort, D.; Filippov, R.; Kutyrev, A. Factor analysis of irradiation of the strawberries (fragaria × ananassa) seeds pulsed low-frequency magnetic field. Indian J. Agric. Sci. 2019, 89, 113–118. [Google Scholar] [CrossRef]
- Izmailov, A.; Smirnov, I.; Khort, D.; Filippov, R.; Kutyrev, A. Magnetic-pulse processing of seeds of berry crops. Res. Agric. Eng. 2018, 64, 181–186. [Google Scholar] [CrossRef]
- Zablodskiy, M.; Kozyrskyi, V.; Zhyltsov, A.; Savchenko, V.; Sinyavsky, O.; Spodoba, M.; Klendiy, P.; Klendiy, G. Electrochemical Characteristics of the Substrate based on Animal Excrement During Methanogenesis with the Influence of a Magnetic Field. In Proceedings of the 2020 IEEE 40th International Conference on Electronics and Nanotechnology (ELNANO), Kyiv, Ukraine, 22–24 April 2020; pp. 530–535. [Google Scholar] [CrossRef]
- Kalivoshko, O.; Kraevsky, V.; Burdeha, K.; Lyutyy, I.; Kiktev, N. The Role of Innovation in Economic Growth: Information and Analytical Aspect. In Proceedings of the 2021 IEEE 8th International Conference on Problems of Infocommunications, Science and Technology (PIC S&T), Kharkiv, Ukraine, 5–7 October 2021. [Google Scholar] [CrossRef]
Disclaimer/Publisher’s Note: The statements, opinions and data contained in all publications are solely those of the individual author(s) and contributor(s) and not of MDPI and/or the editor(s). MDPI and/or the editor(s) disclaim responsibility for any injury to people or property resulting from any ideas, methods, instructions or products referred to in the content. |
© 2024 by the authors. Licensee MDPI, Basel, Switzerland. This article is an open access article distributed under the terms and conditions of the Creative Commons Attribution (CC BY) license (https://creativecommons.org/licenses/by/4.0/).