Article

Soil Quality Evaluation in Mono and Mixed Eucalypt Plantation

by
Arthur P. A. Pereira
1,*,
Maurício R. Cherubin
2,*,
Ademir S. F. de Araujo
3,
Maiele C. Santana
2,
Erika V. de Medeiros
4,
Diogo P. da Costa
4,
Adijailton J. de Souza
2,
Antonio Y. V. Lima
1,
Danilo F. da Silva
2,
Paula A. C. Estrada
2,
Lucas W. Mendes
5,
Jay P. Verma
6,
Lydie S. Koutika
7 and
Elke J. B. N. Cardoso
2
1
Soil Science Department, Federal University of Ceará, Fortaleza 60451-970, Ceará, Brazil
2
Luiz de Queiroz College of Agriculture, São Paulo University, Piracicaba 13418-900, São Paulo, Brazil
3
Center of Agrarian Sciences, Federal University of Piauí, Teresina 64000-000, Piauí, Brazil
4
Federal University of Agreste Pernambuco, Garanhuns 55290-000, Pernambuco, Brazil
5
Center of Nuclear Energy in Agriculture, São Paulo University, Piracicaba 13418-900, São Paulo, Brazil
6
Plant Microbe Interaction Lab, Institute of Environment and Sustainable Development, Banaras Hindu University, Varanasi 221005, Uttar Pradesh, India
7
Research Center on Productivity and Sustainability of Industrial Plantations, Pointe-Noire P.O. Box 1291, Congo
*
Authors to whom correspondence should be addressed.
Sustainability 2024, 16(6), 2534; https://doi.org/10.3390/su16062534
Submission received: 21 December 2023 / Revised: 24 February 2024 / Accepted: 14 March 2024 / Published: 20 March 2024
(This article belongs to the Section Soil Conservation and Sustainability)

Abstract

:
Soil quality (SQ) pertains to the intricate and ongoing capacity of soil to function as a thriving ecosystem that supports the growth of plants and animals. However, there is a limited understanding of SQ assessment in mixed forest plantations. Therefore, we formulated and tested the hypothesis that the inclusion of a nitrogen-fixing tree species (such as Acacia mangium) improves SQ indicators in mixed treatments involving Eucalyptus trees. To evaluate the changes in SQ, we conducted a field experiment that employed the Soil Management Assessment Framework (SMAF) tool to analyze pure and mixed plantations of Eucalyptus grandis and A. mangium. Soil samples were collected at a depth of 0–20 cm from different treatments, including pure E. grandis without nitrogen fertilization (E), pure A. mangium (A), pure E. grandis with nitrogen fertilization (E + N), and mixed E. grandis and A. mangium (E + A). Sampling took place at 27 and 39 months after planting. We selected seven indicators of SQ: two biological indicators (soil microbial biomass carbon and β-glucosidase enzyme activity), four chemical indicators (soil organic carbon, pH, available phosphorus, and potassium), and one physical indicator (bulk density). By applying the SMAF tool, we determined the SQ scores for each indicator. The results revealed that E + A stands exhibited higher SMAF scores than pure stands, particularly in terms of pH (0.49 and 0.52 at 27 and 39 months, respectively) and phosphorus levels (0.84 and 0.82, at 27 and 39 months), respectively. Forest management practices and the sampling period had the most pronounced impact on biological and chemical indicators. Notably, significant positive correlations were observed between SMAF scores and pH, available phosphorus content, enzymes, soil organic carbon, and microbial biomass in both sampling periods. This study effectively provided novel information that introducing a nitrogen-fixing tree species in combination with eucalyptus trees enhances SQ, as indicated by the SMAF tool, which could reduce the need for external inputs (e.g., mineral fertilizers) by the farmers. Future studies should analyze the effects of A. mangium not only with other E. grandis varieties but also with other forestry essences.

1. Introduction

Eucalyptus grandis (W. Hill ex Maiden) is a member of the Myrtaceae family, which is a diverse botanical group comprising over 5000 species. This family includes significant timber trees, aromatic spices, essential oils, and cultivated ornamental plants. In Brazil, E. grandis plantations are economically important, as Brazil is the world’s largest eucalyptus producer [1]. This plant species is versatile to different climates, soil types, and water regimes [2]. However, E. grandis, under monocropping, may demand high rates of nutrient application, mainly N and P [3]. Importantly, when mixed with N2-fixing tree species, E. grandis can uptake N and P from soil organic matter mineralization [4,5], since the N2-fixing plant species have been suggested to increase soil fertility and microbiome diversity [5,6]. In a previous study [5], Acacia mangium was proposed as a viable nitrogen-fixing plant species for integration with E. grandis, aiming to enhance the soil microbiome responsible for nutrient cycling. However, the soil quality (SQ) assessment in mixed forest plantations is poorly documented.
Soil quality is the capacity of soil to perform critical functions that support not only plant growth but also other soil-related ecosystem services [7,8,9,10,11,12]. The number of studies evaluating SQ has increased rapidly around the world, including from conceptual e.g., [13,14,15,16,17,18], to applied studies in the most diverse soil management systems, such as annual and semi-perennial crops [3,15,19,20,21], agroforestry [22,23], and forestry systems [24,25].
The assessment of SQ involves a comprehensive evaluation of soil indicators encompassing chemical, physical, and biological aspects [13,26]. Particularly, these indicators should be selected for their sensitivity and responses to soil management and functioning [27]. In recent years, some methods and protocols have been developed worldwide to assess SQ [7,8,9,10]. The Soil Management Assessment Framework (SMAF) was originally introduced as a robust approach for assessing SQ in the United States of America [11], and more recently, it has been applied worldwide [8,12,13]. The SMAF presents great sensitivity and response to soil management, such as tillage systems or land use, and has been reported to be a useful tool for detecting changes in SQ of tropical soils [14].
Several field experiments have demonstrated positive results of acacia trees intercropped in eucalypt plantations [15]. However, no studies are using SMAF to assess SQ under monocropping and intercropping forest systems, such as E. grandis and A. mangium stands, mainly in tropical soils. Ref. [16] showed that mixed plantations increase C and N concentrations in the labile fractions of soil organic matter (SOM). Also, ref. [5] investigated the impact of mixed eucalypt and acacia plantations on fungal communities and demonstrated that mixed plantations significantly increased the number of fungal genera. Thus, the mixed plantation can be an effective strategy to improve SQ, enhancing microbial diversity and nutrient availability in the soil and promoting eucalypt growth and development.
This study aimed to assess soil quality in mixed and pure E. grandis and A. mangium plantations in Brazilian tropical soils. We utilized the Soil Management Assessment Framework (SMAF) tool to explore the hypothesis that intercropping E. grandis with A. mangium could enhance soil quality (SQ) compared to monocropping E. grandis. We conducted the assessment at two time points, 27 and 39 months after establishing the tree plantations. We compared two biological indicators (soil microbial biomass carbon and β-glucosidase enzyme activity), four chemical indicators (soil organic carbon, pH, available phosphorus, and potassium), and one physical indicator (bulk density) of SQ between monocropped E. grandis and intercropped E. grandis with A. mangium.

2. Material and Methods

2.1. Location Description and Soil Sampling Strategy

This research was conducted at the Forest Science Experimental Station, which is affiliated with the University of São Paulo, located in Itatinga, Brazil (latitude 23°03′00″ S, longitude 48°37′00″ W, altitude 840 m). According to the Köppen climate classification system, the study area falls within the Cfa climate category. The region experiences an average annual rainfall of around 1400 mm, with the majority (75%) occurring between March and October [17]. The soil in the area is classified as a Ferralsol (FAO/WRB) with a sandy texture, indicating good drainage and significant weathering. This type of soil is commonly utilized for eucalyptus plantations in Brazil. Additional information regarding the soil properties can be found in [16].
The experiment was initiated in December 2013 within an area previously occupied by a 50-year-old Eucalyptus grandis plantation. Following harvest, a randomized complete block design was implemented, consisting of four treatments: pure E. grandis without nitrogen fertilization (E), pure A. mangium (A), pure E. grandis with nitrogen fertilization (E + N), and mixed E. grandis and A. mangium (E + A). The experiment comprised four blocks (replicates), totaling 16 plots. Each plot measured 36 m × 36 m, with a net area of 24 m × 24 m to avoid edge effects. The trees were spaced 3 m × 3 m, and the mixed plantation (E + A) was established in double rows with a plant ratio of 1:1 (Figure 1). The A. mangium seedlings were inoculated with Rhizobium strains (BR3609T and BR6009), and nitrogen fertilizer (E + N—ammonium sulfate) was applied in December 2013 and 2014, with doses of 10 and 90 kg ha−1 of nitrogen, respectively [16]. The N-fertilized treatment followed standardized methods and utilized doses commonly used in commercial eucalyptus plantations in Brazil [18,19]. The lower dose of nitrogen applied in 2013 aimed to promote the initial growth of young trees while minimizing nitrogen losses. However, in 2014, a higher dose of nitrogen was applied to meet the increased nutrient requirements for plant development [3,15]. A comprehensive list of the nutrients applied to all treatments can be found in Table S1. The soil samples were collected at two different time points, corresponding to 27 and 39 months after the establishment of the forest plantation. These periods were chosen to capture the differences between the early stage (27 months) and the peak stage (39 months) of litterfall, allowing for the detection of contrasting SQ scores. The soil samples were collected at a depth of 0–20 cm using the Voronoi polygon strategy, a widely accepted sampling technique for forest systems [18,19]. This strategy involves measuring the half distance between each tree and its neighboring trees (refer to Figure 2). Soil and litter samples were collected from six trees within each plot, resulting in a total of six subsamples per plot. The samples were homogenized to create composite samples (Figure 2). In total, 32 samples were analyzed (4 treatments × 4 blocks × 2 periods). For biological analyses, a portion of the soil samples was sieved (2 mm) and stored at 4 °C until further analysis. For physical and chemical analyses, another portion of the soil samples was sieved (2 mm) and air dried to a constant weight (72 h).

2.2. Soil Quality Indicators and Assessment (SMAF Application)

A total of seven soil indicators were selected for this study based on their availability in the SMAF spreadsheet and the presence of scoring curves [11,20,21]. These indicators were chosen to form the minimum dataset and included three biological indicators: soil organic carbon (SOC), microbial biomass carbon (MBC), and β-glucosidase enzyme activity (BG); two chemical indicators: pH and the availability of phosphorus (P) and potassium (K); and one physical indicator: soil bulk density (BD). The selection of these indicators aligns with SMAF guidelines, which recommend including at least one indicator from each soil component (chemical, physical, and biological) [20]. Moreover, the importance of these SQ indicators has been consistently demonstrated in the literature [7,22]. Briefly, pH, P, and K are commonly used to assess soil acidity and nutrient levels, providing insights into the soil’s fertility status. Soil bulk density is a key indicator of various important physical properties and processes, such as aeration, water infiltration, and root dynamics. Soil organic carbon plays a fundamental role in multiple soil functions, including nutrient cycling, soil structure, and serving as a carbon source for soil organisms. Microbial biomass carbon (MBC) serves as a crucial indicator of microbial metabolic activities in the soil. β-glucosidase enzymatic activity is involved in the mineralization of cellobiose and the enzymatic breakdown of various polysaccharides [23]. Both MBC and BG are closely associated with the carbon cycle and soil biota, making them well-known indicators of SQ due to their relationship with organic matter, plant nutrition, and microbial processes [24].

2.3. Soil Characterization

Soil pH was determined using a water-to-soil ratio of 1:2.5, while phosphorus (P) and potassium (K) levels were assessed through ion exchange resin [25]. Total soil nitrogen was analyzed using the Kjeldahl method. Soil bulk density (BD) was analyzed using undisturbed soil samples collected with metallic cylinders (100 cm3). The results were obtained by dividing the dry mass of the soil by the volume of the cylinder. Soil organic carbon (SOC) was measured using dry combustion on an elemental analyzer (with a furnace operating at 1350 °C in pure O₂) (LECO CN-2000). Microbial biomass carbon (MBC) was estimated using the fumigation–extraction method [26,27].
The activity of β-glucosidase (EC 3.2.1.21), urease (EC 3.5.1.5), and acid phosphatase (EC 3.1.3.2) enzymes was determined according to the method described in [28]. These biological properties play a vital role in nutrient biogeochemical cycles, soil aggregation, and the availability of carbon sources for microbial metabolism. They have a significant impact on microbial activity and functions in the soil and are considered sensitive indicators for detecting changes in SQ [28].
The analysis of the functional gene related to N2-fixation (nifH) was conducted using the StepOne™ Real-Time PCR System machine. The SYBR Green PCR Master Mix (2×) fluorescent reagent (10 µL) (Applied BiosSystems®, Waltham, MA, USA), BSA (Bovine Serum Albumin) (0.5 µL, 20 mg mL−1), DNA template (1 µL), and the primers FGHP19/POLR (1.6 µM) were used [29,30]. Standard curves were generated by performing ten-fold serial dilutions of plasmids containing the target gene product (insert) following the guidelines of the pGEM-T Easy Kit (Promega®, Madison, WI, USA). The amplification efficiency (E) was calculated using the equation: E = [10(−1/slope) − 1]. The thermal cycle program consisted of an initial step at 95 °C for 10 min, followed by 39 cycles of 94 °C for 60 s, 55 °C for 2 s, and 72 °C for 60 s.
Total DNA was extracted from 0.4 g of soil using the MoBio Power Soil DNA Isolation Kit (MoBio Laboratories, Carlsbad, CA, USA), according to the manufacturer’s instructions. The DNA product was quantified using the Qubit dsDNA HS Assay Kit (Thermo Fisher Scientific®, Waltham, MA, USA). For the 16S rRNA library preparation, the 16S metagenomics sequencing library preparation procedures (Illumina®, San Diego, CA, USA) targeting the V4 region were followed. The KAPA 2x HiFi HotStart ReadyMix (KAPA Biosystems, Wilmington, MA, USA) and AM-Pure XP beads Kit were used for PCR reactions and purification, respectively. The first PCR reaction utilized the primers 515F/806R (5 µL) with Illumina® index and sequencing adapters [31]. Sequencing of the 16S rRNA was performed on the MiSeq sequencing platform (Illumina®, San Diego, CA, USA) using the V3 kit (600 cycles) and the paired-end sequencing strategy (2 × 250 bp).
The FASTQ reads were merged, and p”outred-end sequences underwent quality filtering, while chimeric sequences were identified and removed. High-quality sequences were utilized to construct operational taxonomic units outU) tables based on a 97% sequence similarity using the Sumaclust methodology. Bacterial diversity was calculated using the Shannon diversity index. The analyses were conducted using the Quantitative Insights into Microbial Ecology software (QIIME, v. 1.9) [32,33].

2.4. SMAF Application

The SQ indicators were scored by transforming the average values into a range between 0 and 1 (0 to 100%) using established algorithms [11,14,20,21]. These algorithms considered various factors such as soil organic carbon (SOC), soil texture, climate, slope (%), location, mineralogy, weathering class, forest system, sampling period, and the influence of analytical methodologies on different threshold values [11,14]. In this study, the organic matter class was assigned a value of 1, indicating high organic matter content, for all treatments. The texture factor was assigned a value of 1, indicating low clay content (sand or sandy loam texture) for all treatments, as the experimental area has a low clay content (<8–10%). The climate factor was assigned a value of 1, indicating a mean annual precipitation of ≥550 mm, which is the case for the Itatinga municipality where the study was conducted [17]. The sampling was carried out during the fall season, and thus the season factor was set to 3 (fall) for all treatments. The mineralogy factor was assigned a value of 3, indicating 1:1 clay, Fe2+, and Al3+ oxides, while the slope and weathering factors were assigned values of 1 (2–5% slope) and 2 (high weathering), respectively. The extractable phosphorus (P) was measured using the resin methodology (Class 5). New “crop” factors, which influence the P and pH scores, were incorporated into the SMAF spreadsheet to account for eucalyptus trees. Phosphorus and pH thresholds were set up according to [34] (pp. 427) and [35], of which the optimum P and pH values were 5 mg dm−3 and 5.5, respectively. We used the SMAF scoring curve for potassium (K) originally developed by [20] and adapted to be in line with K recommendation classes used in São Paulo state (Brazil), which is the location of the experiment [36]. The interpretation classes for nutrients (P and K) are based on extensive experimentation. Finally, the scores for the soils physical, chemical, and biological indicators were used to calculate a SQ index (SQI) using the weighted additive methodology (Equation (1)):
S Q I = i = 1 n S i W i
In Equation (1), Si represents the score of each soil indicator, and Wi represents the corresponding weighted value. The soil indicators were weighted based on their classification into chemical indicators (pH, P, and K), physical indicator (bulk density), and biological indicators (SOC, MBC, and BG). Each group of indicators (chemical, physical, and biological) was assigned an equal weight of 33.33% in the calculation of the final SQ index [14].

2.5. Statistical Analyses

The data were analyzed using a double factorial design, considering the factors of treatments and the sampling period, within a randomized block model. Raw data were subjected to Nemenyi multiple comparison test. A Principal Component Analysis (PCA) was conducted to explore the correlations between SQ scores and the analyzed soil properties across different treatments. Spearman’s correlation was employed to examine the relationships between SMAF-based SQ scores and the soils physical, chemical, and biological indicators. In addition to the SQ indicators included in SMAF, other soil properties such as the abundance of the nifH gene, urease and acid phosphatase enzyme activities, bacterial diversity, and total soil-nitrogen content were also considered for correlation analysis (see Supplementary Table S2). Analyses and graphs were prepared using R software (R 4.3.1) [37], using “agricolae (v. 1.3-5)” [38], “gplots (v. 3.1.1)” [39] and “RColorBrewer (v. 1.1-2)” [40] packages, and multivariate tests were performed on Canoco® software (v.4.5).

3. Results

3.1. Soil Quality Indicators in Pure and Intercropped Eucalyptus Plantations

The values of soil pH were acidic (nearly to 4–5) and showed no differences between treatments or sampling periods (27 or 39 months) (Table 1). SOC contents were lower in E + N (3.57 and 2.84%) than E + A (4.38 and 4.55%) at 27 and 39 months after plantation, respectively (p < 0.05). MBC was higher in A (815.97 mg kg−1) and E + A (839.83 mg kg−1), than pure treatments, specifically at 27 months after plantation (p < 0.05). Available P was higher in both A and E + A than pure eucalyptus, independently of the sampling period. Bulk soil density was lower in A (1.16 Mg m−3) and E + A (1.04 Mg m−3) than pure treatments, mainly at 39 months after plantation (p < 0.05). β-glucosidase showed generally no significant differences between treatments or sampling periods, except for A treatment, which presented higher BG activity at 27 months than other treatments. Available K were higher in E + A than E at 27 and 39 months after planting, respectively. In general, K contents were higher at 39 months after planting, independently of treatments (Table 1). Specifically, E + A showed a higher K content at 27 months (205.28 cmolc kg−1) after plantations, although this difference was not found at 39 months, when E showed the lowest K content.
The average of the additional SQ indicators (not contemplated by SMAF algorithms) are presented in Table S2. Briefly, the abundance of the nifH gene was higher in A (7.48 copies g soil−1) and E + A (7.34 copies g soil−1) treatment, mainly at 27 months after plantation (p < 0.05). At 39 months, treatment A showed a higher abundance of the nifH gene than E and E + A that did not significantly differ. Interestingly, E + N showed a lower nifH expression than E + A and A in both 27 and 39 months. The activity of urease, acid phosphatase, and bacterial diversity was higher in E and E + N at both 27 and 39 months after plantations. Total soil-nitrogen was lower in E + N at 27 months (1.60 g kg−1) after plantation than E + A at 39 months (1.31 g kg−1) (p < 0.05).

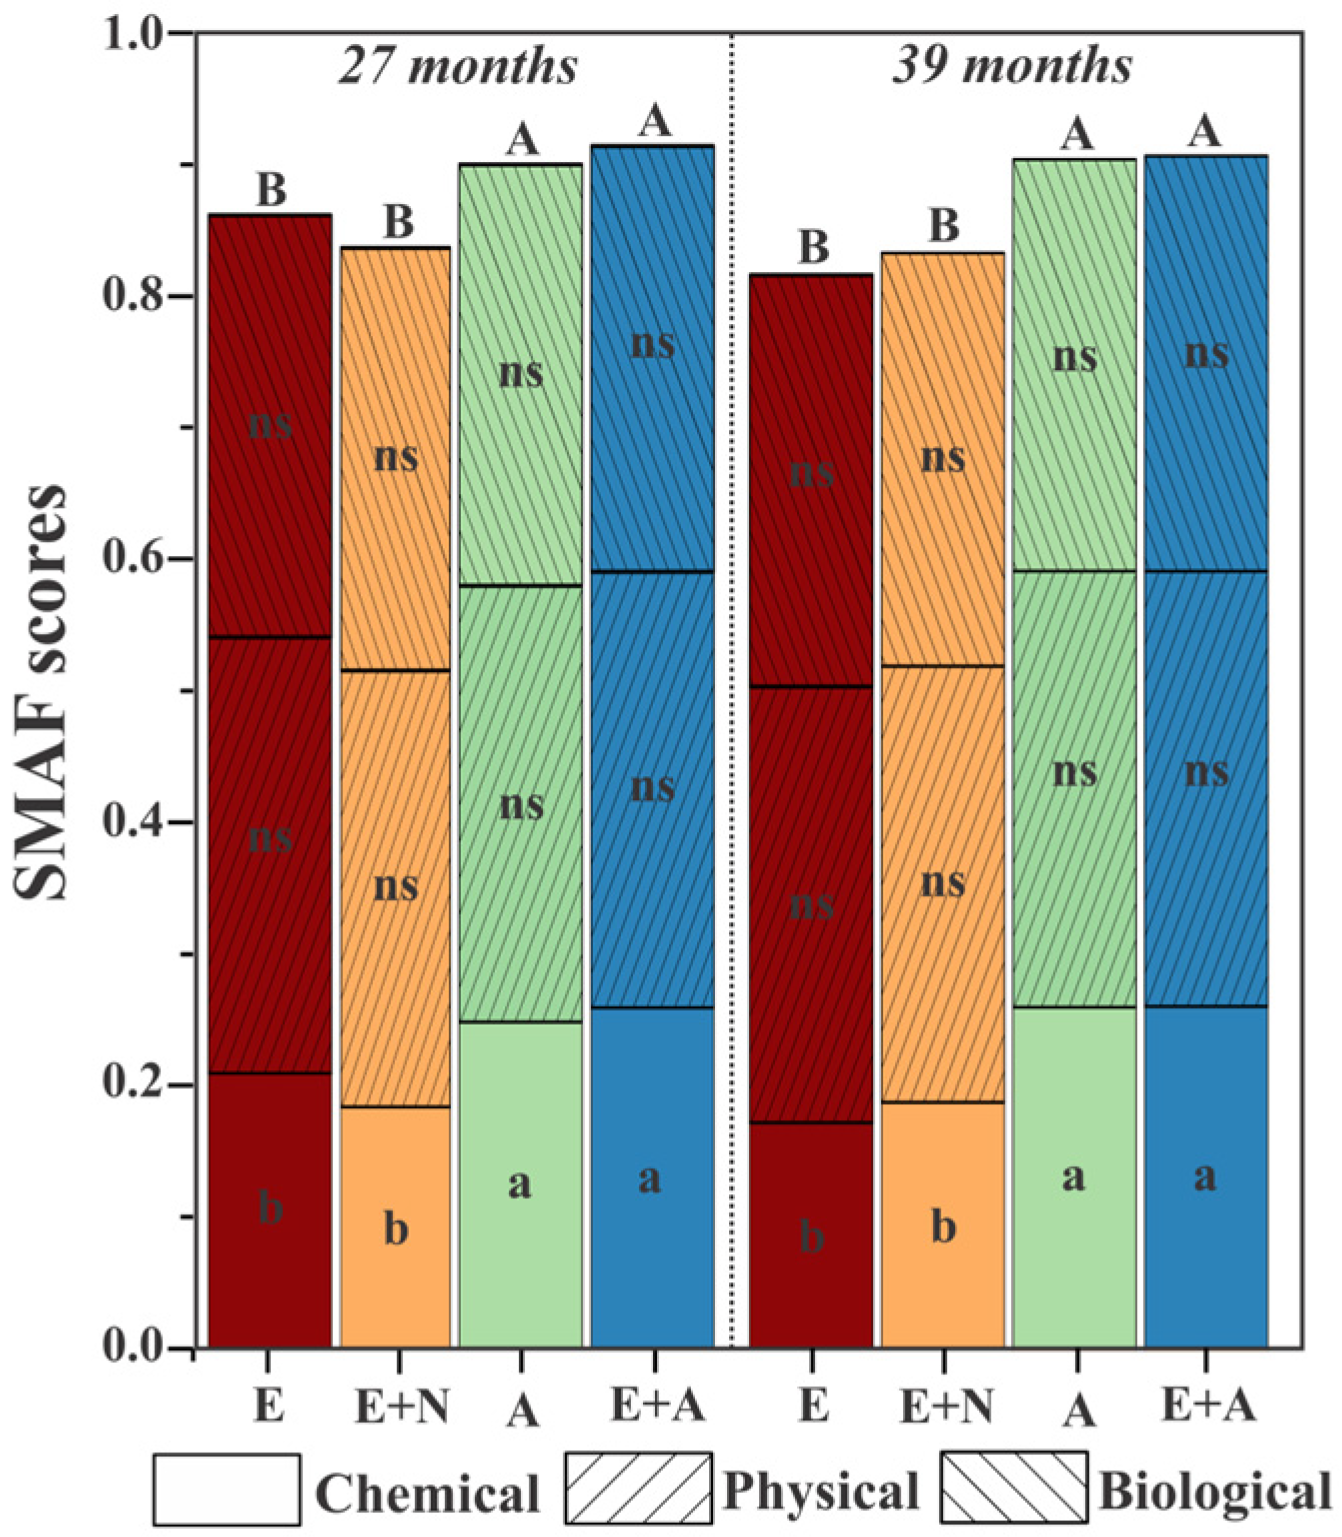
3.2. Soil Quality Indicators Scores

The pH, P, and BG scores were significantly influenced by the treatments (Table 2). Thus, the highest pH scores were found in E + A, at 27 months (0.49), and in A (0.46) and E + A (0.52) at 39 months (p < 0.05). The E + N treatment showed the lowest pH scores at 27 months but showed no differences between the E + N and E scores that were found at 39 months. Interestingly, A (0.85 and 0.88) and E + A (0.84 and 0.82) presented the highest P scores, in both periods, respectively (p < 0.05). Also, BG presented higher scores in E + A (0.93 and 0.88), independently of the sampling period (p < 0.05). In contrast, no differences were found SOC, MBC, BD, and K scores between treatments or sampling periods, with all treatments showing maximum SQ scores.

3.3. Soil Quality Indicators Indexes

Overall, the SQ scores were higher for A and E + A than E and E+N, at both periods, with values higher than 0.9 (p < 0.05). However, only chemical indicators presented significant differences in SQ scores. In this case, A and E + A treatments presented higher SQ scores for chemical attributes at both 27 and 39 months after plantation. In contrast, no changes were present in the physical and biological SQ scores of the treatments, independently of the sample period (Figure 3).

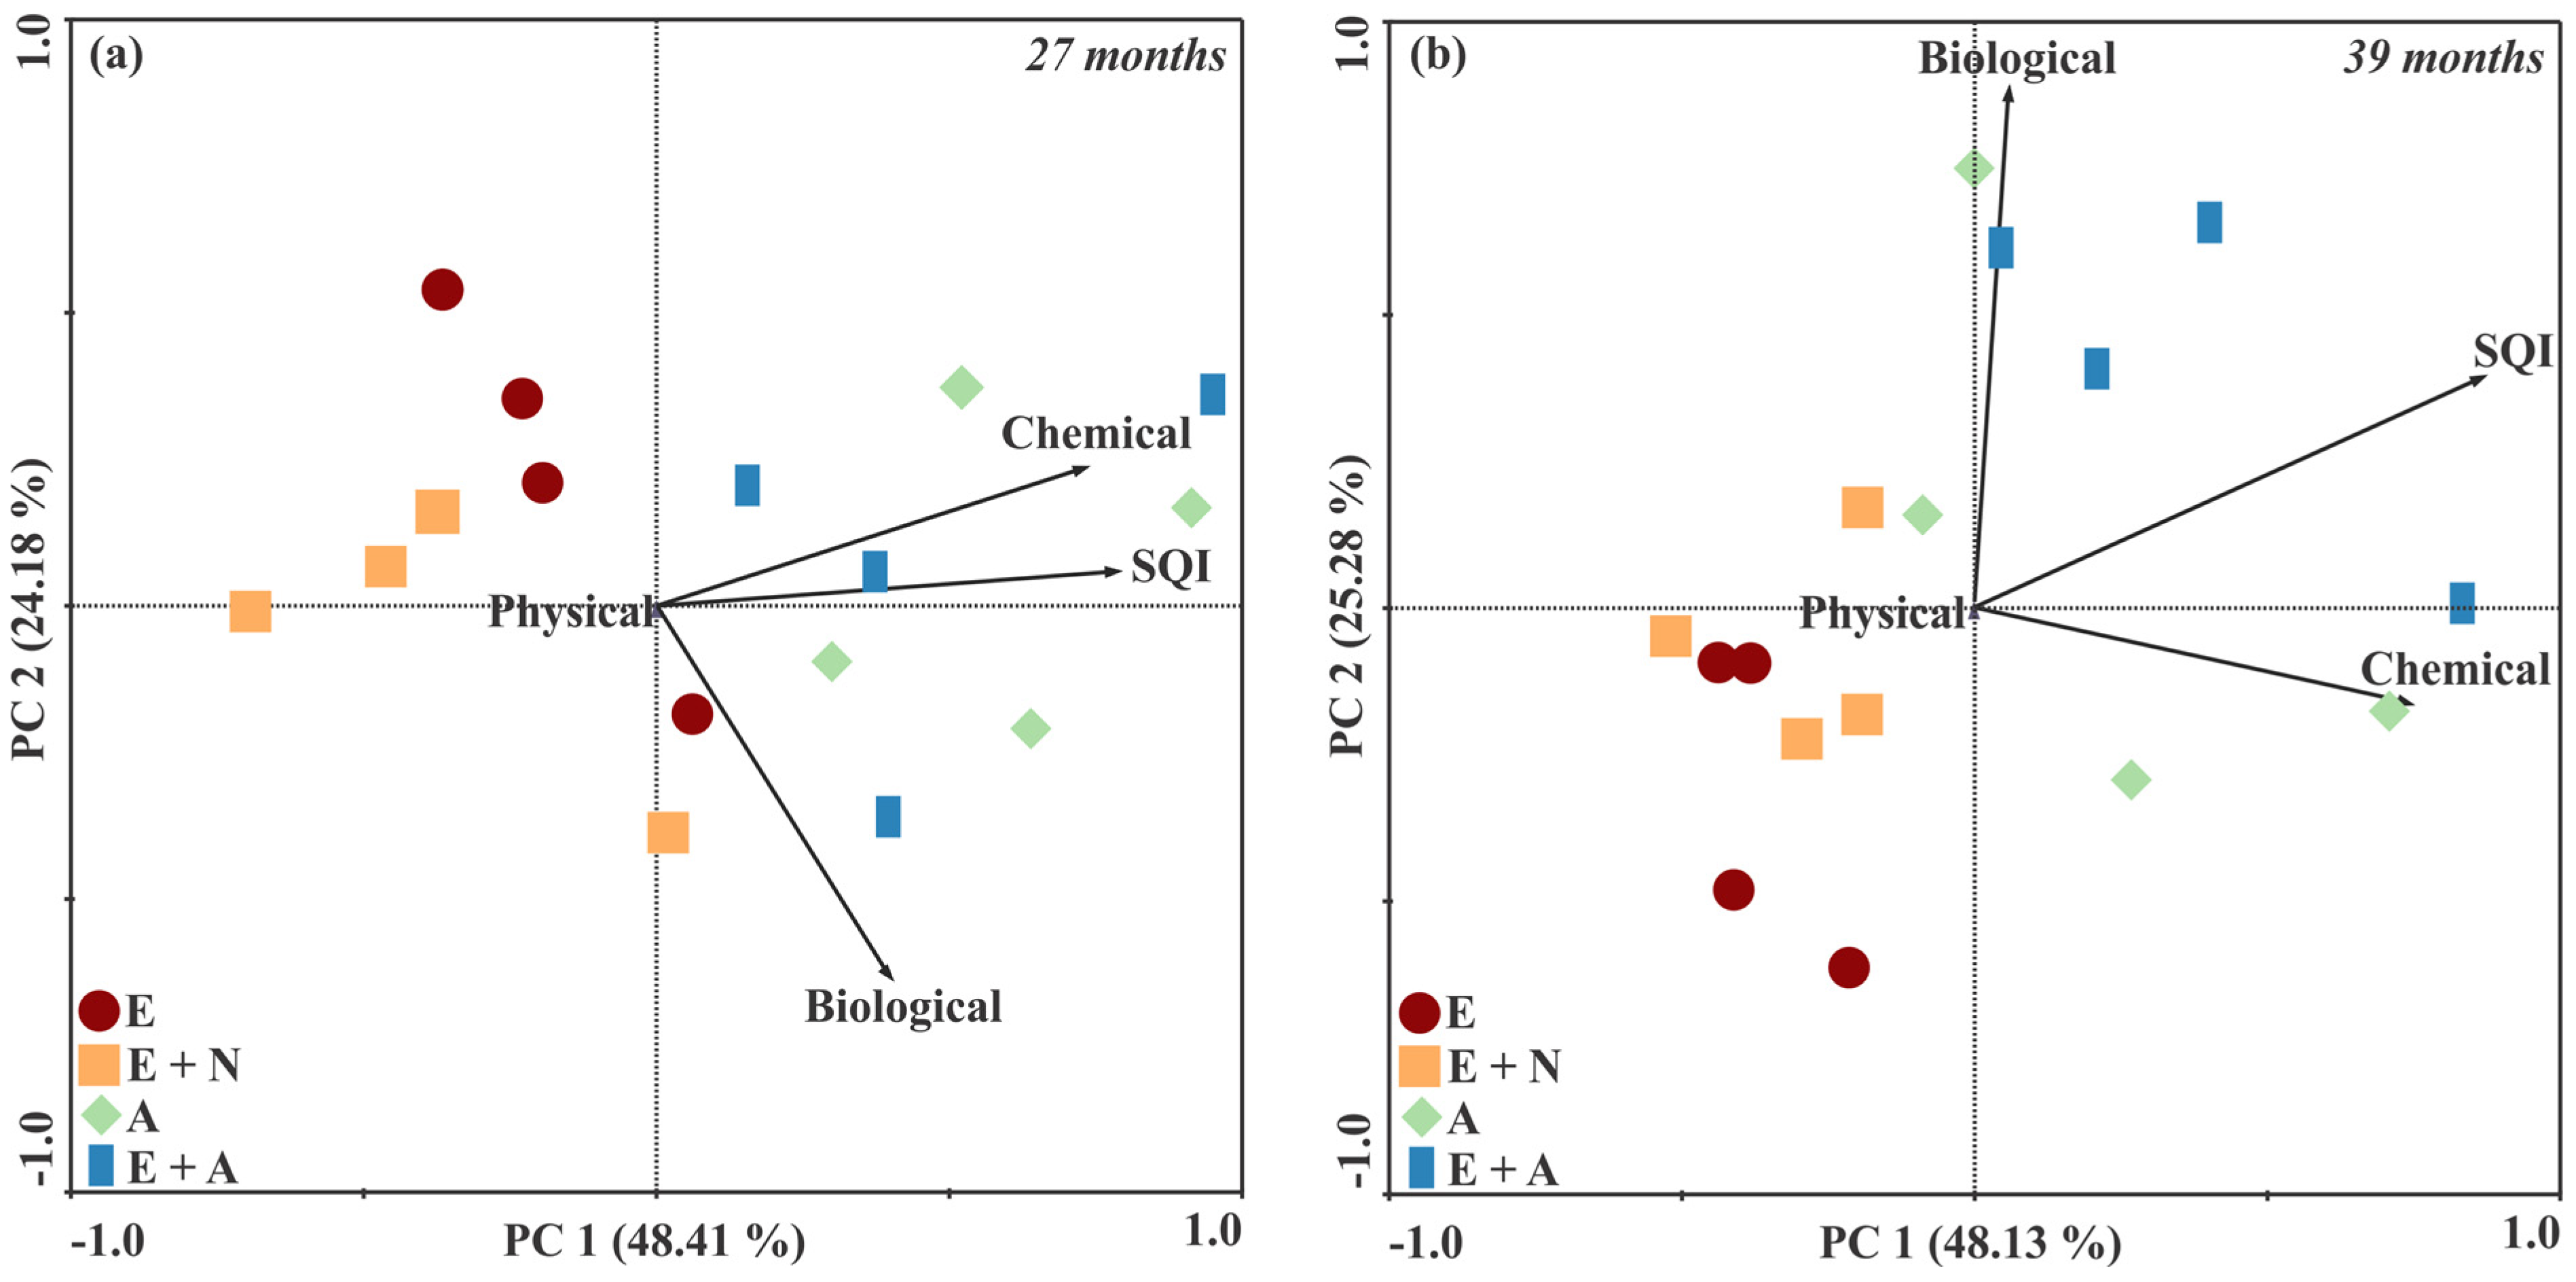
3.4. Principal Component Analysis and Spearman Ranking Correlation Tests

The PCA explained 72.59% and 73.41% of the total variation at 27 and 39 months, respectively. PCA demonstrated that during both periods (27 and 39 months after planting), data from A and E + A treatments were positively correlated with SMAF scores. However, the physical component of the SMAF scores presented no significant response to differentiate the treatments (Figure 4a,b).
The Spearman ranking correlation test showed the main soil indicators positively or negatively influencing the physical, chemical, biological, and SQI indexes (Figure 5). In general, the SQI score correlated positively with all soil indicators, except with bulk soil density and urease at both 27 and 39 months after plantation (p < 0.05). SOC, MBC, available P, pH, β-glucosidase, nifH abundance, acid phosphatase, bacterial diversity, and total soil-N contents showed a positive correlation with SQI scores in both 27 and 39 months (p < 0.05). BD and urease correlated negatively with the physical and chemical properties and SQI scores, mainly at 39 months (p < 0.05).

4. Discussion

This study contributes to the knowledge concerning the enhancement of soil quality (SQ) indicators in mixed eucalyptus plantations (E + A) through the application of Soil Management Assessment Framework (SMAF) scores, with a particular focus on the chemical components. The pH, BG, and P were the most important properties to improve SQ scores in E. grandis intercropped with A. mangium. P and pH are chemical attributes that significantly change soil microbial community in forest systems [5]. Also, BG could indicate a more efficient cycling of organic matter, a pivotal service in forest ecosystem to plant nutrition.
The contribution of P to Increase the SQ in A and E + A treatments is important since this element is essential to plants, mainly to Eucalyptus [41], being part of several key macromolecules (e.g., DNA, ATP among others) and necessary to plant growth [41]. Interestingly, P presents low availability in soils from tropical forests [5], which indicates the importance of intercropping E. grandis with A. mangium. In addition, a recent report demonstrated that P cycling is stimulated in mixed forest plantations and, more importantly, mainly due to the presence of active microbial communities that acts on litter layer and soil organic fractions [5]. In our study, bacterial diversity showed a positive correlation with SQ, biological, and chemical scores (Figure 4). Also, P content actively participates in the biological nitrogen fixation, mainly during N2 breakdown by the nitrogenase enzyme [5]. In addition to bacteria, another important microbial group in mixed eucalyptus plantations is the fungi community, which improves P availability to the associated tree [5]. Ref. [42] analyzed the dynamics of arbuscular mycorrhizal fungi (AMF) in these two tree species in both pure and mixed plantations during the first 20 months after planting in Itatinga, São Paulo state, Brazil. These authors reported an increase in AMF root colonization of E. grandis when intercropped with A. mangium as well as an increase in the activity of acid and alkaline phosphatase in the presence of the leguminous tree. More importantly, it could partially explain the increased P concentrations in mixed plantations, since phosphatases are closely related to the mineralization of P-organic compounds [42]. Thus, these findings reinforce the need for new SMAF algorithms to contemplate other biological indicators due to their fast responses and connection with many important ecosystem services [11].
Soil properties from A and E + A were positively related with SQ, biological, and chemical indicators, while E and E + N were positively related to physical components (Figure 4). These results were expected, since E and E + N treatments presented the lowest SMAF scores for chemical properties (Figure 1c). Also, as reported by [16], eucalyptus plantations generally present low-quality litter (high C/N ratio, ~60 a 70/1), which may contribute to lower nutrient contents, mainly when compared with mixed plantations [16]. However, urease was higher in pure eucalyptus plantations as compared to mixed systems. This increased enzyme activity may be linked to a low-quality litter with a high carbon-to-nitrogen ratio of eucalypt litter [16]. The presence of such litter might trigger a higher production of enzymes, promoting more efficient material cycling in the soil [16]. Thus, urease activity seems to be an important SQ indicator for eucalyptus plantations, which can be further studied, mainly relating their relationship with N-pools [16].
Spearman’s analysis showed the SQ presenting a positive correlation with important soil indicators, such as SOC and MBC. A. mangium is a known N2-fixing tree that is associated with bacterial communities in the rhizosphere which play an important role in biological nitrogen fixation [4], depositing nutrient-rich litter into the soil [16], and increasing soil organic matter [6]. Thus, increased soil organic matter and microbial biomass can boost SQ in mixed eucalypt and acacia plantations. SOC supports several ecosystem services, and mixed plantations represent a model of an efficient system to promote C sequestration [43].
Figure 5 illustrates the positive correlation between β-glucosidase (BG) activity and the biological and overall SQ scores at both sampling times. The E + A treatment exhibited the highest BG activity scores, indicating an enhanced cycling of organic matter [44,45]. BG activity is widely regarded as a valuable SQ indicator due to its ability to provide a rapid assessment of changes in organic matter dynamics [44,45]. The potential activity of BG is influenced not only by the availability of carbon substrates [46] but also by their quality, particularly in terms of plant carbon-to-nitrogen (C/N) ratios. The C/N ratio is a well-established indicator used to evaluate the extent of soil organic carbon (SOC) decomposition and serves as a sensitive measure for assessing SQ in forest ecosystems. The plant residues from Acacia mangium (e.g., detritus, rhizodeposition) have a lower C/N ratio (C/N~34) than eucalyptus (C/N~58), which favors BG activity [16]. It provides evidence of the advantage of E + A systems over the E. grandis monocropping system (E) in providing better SQ scores, since greater BG activity results in faster organic matter decomposition and nutrient releasing for microbial communities in the topsoil [47].
Soil bulk density showed only negative correlations, mainly after 39 months of planting (Figure 5). BD is an indicator of soil compaction, in which high values of BD are associated with reduced macroporosity that causes restrictions to root development, air diffusion, and water movement through the soil [48], thereby affecting microbial metabolism [27]. Although treatments including Acacia presented a reduced BD, the SMAF scores revealed that the soil was performing its physical function properly, regardless of tree species. Likely, the favorable physical soil conditions are associated with the absence of machinery traffic for harvesting, since it is the main driver of physical soil degradation in commercial forest plantations [49,50].
There are different reports demonstrating N increasing by Acacia through biological N2 fixation [4,51]. Our study showed a positive correlation between nifH gene abundance and biological score, and SQ score (Figure 3). The nifH gene encodes for the nitrogenase enzyme, a catalytic protein complex responsible for the reduction in atmospheric N2 into NH3 [52]. Thus, accessing the abundance of functional genes related to biological N2 fixation can be a sensitive parameter to identify changes in SQ under mixed forest plantations. We also found a close correlation between total soil N and bacterial diversity with biological and SQ scores in both 27 and 39 months after planting. Thus, increased nifH abundance may result in higher N content in the soil, as detected by [16,53] and, consequently, could explain the positive correlation between total N and SQ scores (Figure 5). Recently, a positive correlation between total soil-N with bacterial diversity and nifH in mixed eucalyptus and acacia plantations was found [53], reinforcing the importance of further studies to disentangle these relationships regarding SQ.
Acid phosphatase and P presented positive correlations with chemical, biological, and SQ scores in both 27 and 39 months (Figure 3). Acid phosphatase plays an important function in P mineralization since it hydrolyses organic P compounds into phosphomonoesters and mineralizes these compounds into orthophosphate, boosting P dynamics in the soil [54]. Thus, in addition to C-cycles enzymes (i.e., β-glucosidase), the P-acquiring enzyme can also indicate important changes in SQ under mixed forest plantations between eucalypts and acacia [47,55].
This study highlights several benefits of diversifying eucalypt forest plantations through the intercropping of A. mangium in Brazil. This approach is shown to enhance SQ, but the feasibility of implementing these strategies in real-world scenarios depends on various factors, including local soil and climate conditions, logistical challenges, and effective land management practices [56]. Further research and practical trials are needed to refine these strategies and develop best practices for their successful implementation in different contexts.

5. Conclusions

The diversification of eucalypt forest plantation (E. grandis) occurs by intercropping with Acacia mangium-enhanced SQ compared to eucalypt monocropping. The mixed Eucalyptus grandis and Acacia mangium plantations can be a strategy for tropical countries (such as Brazil) reconciling the reforestation of degraded areas to produce wood/energy with the provision of other ecosystem services (e.g., nutrient cycling, C sequestration, and biodiversity). Soil chemical indicators (pH and P) were the main factors of SQ amelioration detected by SMAF in this short-term assessment. Despite that, the SMAF-based SQ was well correlated with other key biological indicators (e.g., BG, MBC, nifH, bacterial diversity, and acid phosphatase). It suggests that SQ (calculated with more user-accessible indicators) can also reflect the changes in highly sensitive biological indicators, which are crucial to understanding specific processes and functions in the soil but are still less accessible in routine lab protocols. Nevertheless, we encourage further efforts to develop new scoring curves for other key soil indicators to be included in SMAF and refine current algorithms with data from tropical soils. This study provides insights into the initial stages of forestry development, spanning 27 and 39 months. Future research could explore whether a mature system (or multiple rotations in the same soil) would alter more SQ indicators and enhance the sensitivity of the SMAF tool.

Supplementary Materials

The following supporting information can be downloaded at: https://www.mdpi.com/article/10.3390/su16062534/s1, Table S1: Soil correctives used in the E. grandis pure treatments (E and E+N), (A) A. mangium and (E + A) mixed plantation between E. grandis and A. mangium. Table S2: Mean values of the additional soil properties for the 0–20 cm soil layer under pure and mixed eucalypt plantations at 27 and 39 months after planting.

Author Contributions

Conceptualization, A.P.A.P., M.R.C., A.J.d.S. and E.J.B.N.C.; methodology, A.P.A.P., M.C.S., A.Y.V.L. and M.R.C.; formal analysis, A.P.A.P. and M.R.C.; investigation, A.P.A.P., A.S.F.d.A., E.V.d.M., D.P.d.C., J.P.V., L.W.M. and L.S.K.; writing—original draft preparation, A.S.F.d.A., A.P.A.P. and M.R.C.; writing—review and editing, A.S.F.d.A., J.P.V., D.F.d.S. and P.A.C.E. All authors have read and agreed to the published version of the manuscript.

Funding

This study received financial support from FAPESP (São Paulo Research Foundation) through grants n° 10/16623-9, 16/01636-4, 16/18944-3, and 17/16610-3. Additionally, CNPq (Brazilian National Council for Scientific and Technological Development) provided support through productivity grants n° 305193/2016-3, 305069/2018-1, and 311787/2021-5 and Center for Carbon Research in Tropical Agriculture (CCARBON, grant n° 2021/10573-4).

Institutional Review Board Statement

Not applicable.

Informed Consent Statement

Not applicable.

Data Availability Statement

The data presented in this study are available on request from the corresponding author.

Acknowledgments

The authors would like to express their gratitude to the staff at the Itatinga Forest Sciences Experimental Station for their assistance. Special thanks are extended to José Leonardo de Moraes Gonçalves and Jean Pierre-Bouillet from CIRAD (Agricultural Research Centre for International Development), France, for their contributions and the provision of infrastructure.

Conflicts of Interest

The authors declare no conflicts of interest.

References

  1. ABRAF. Anuário Estatístico: Associação Brasileira de Produtores de Florestas Plantadas. Anuário Estatístico ABRAF 2019, 146, 10. [Google Scholar]
  2. Araújo, A.S.F.; Silva, E.F.L.; Nunes, L.A.P.L.; Carneiro, R.F.V. The Effect of Converting Tropical Native Savanna to Eucalyptus grandis Forest on Soil Microbial Biomass. Land Degrad. Dev. 2010, 21, 540–545. [Google Scholar] [CrossRef]
  3. Gonçalves, J.L.M.; Alvares, C.A.; Higa, A.R.; Silva, L.D.; Alfenas, A.C.; Stahl, J.; Ferraz, S.F.B.; Lima, W.P.; Brancalion, P.H.S.; Hubner, A.; et al. Integrating genetic and silvicultural strategies to minimize abiotic and biotic constraints in Brazilian eucalypt plantations. For. Ecol. Manag. 2013, 301, 6–27. [Google Scholar] [CrossRef]
  4. Paula, R.R.; Bouillet, J.P.; José, J.L.; Trivelin, P.C.O.; de C. Balieiro, F.; Nouvellon, Y.; de C. Oliveira, J.; de Deus Júnior, J.C.; Bordron, B.; Laclau, J.P. Nitrogen Fixation Rate of Acacia mangium Wild at Mid Rotation in Brazil Is Higher in Mixed Plantations with Eucalyptus grandis Hill Ex Maiden than in Monocultures. Ann. Sci. 2018, 75, 14. [Google Scholar] [CrossRef]
  5. Pereira, A.P.A.; Santana, M.C.; Zagatto, M.R.G.; Brandani, C.B.; Wang, J.T.; Verma, J.P.; Singh, B.K.; Cardoso, E.J.B.N. Nitrogen-Fixing Trees in Mixed Forest Systems Regulate the Ecology of Fungal Community and Phosphorus Cycling. Sci. Total Environ. 2021, 758, 143711. [Google Scholar] [CrossRef] [PubMed]
  6. Koutika, L.S.; Mareschal, L. Acacia and Eucalypt Change P, N and C Concentrations in POM of Arenosols in the Congolese Coastal Plains. Geoderma Reg. 2017, 11, 37–43. [Google Scholar] [CrossRef]
  7. Bünemann, E.K.; Bongiorno, G.; Bai, Z.; Creamer, R.E.; De Deyn, G.; de Goede, R.; Fleskens, L.; Geissen, V.; Kuyper, T.W.; Mäder, P.; et al. Soil Quality—A Critical Review. Soil Biol. Biochem. 2018, 120, 105–125. [Google Scholar] [CrossRef]
  8. Karlen, D.L.; Veum, K.S.; Sudduth, K.A.; Obrycki, J.F.; Nunes, M.R. Soil Health Assessment: Past Accomplishments, Current Activities, and Future Opportunities. Soil Tillage Res. 2019, 195, 104365. [Google Scholar] [CrossRef]
  9. Lehmann, J.; Bossio, D.A.; Kögel-Knabner, I.; Rillig, M.C. The concept and future prospects of soil health. Nat. Rev. Earth Environ. 2020, 1, 544–553. [Google Scholar] [CrossRef]
  10. Janzen, H.H.; Janzen, D.W.; Gregorich, E.G. The ‘Soil Health’ Metaphor: Illuminating or Illusory? Soil Biol. Biochem. 2021, 159, 108167. [Google Scholar] [CrossRef]
  11. Andrews, S.S.; Karlen, D.L.; Cambardella, C.A. The Soil Management Assessment Framework. Soil Sci. Soc. Am. J. 2004, 68, 1945–1962. [Google Scholar] [CrossRef]
  12. Gura, I.; Mnkeni, P.N.S. Crop Rotation and Residue Management Effects under No till on the Soil Quality of a Haplic Cambisol in Alice, Eastern Cape, South Africa. Geoderma 2019, 337, 927–934. [Google Scholar] [CrossRef]
  13. Çelik, İ.; Günal, H.; Acir, N.; Barut, Z.B.; Budak, M. Soil Quality Assessment to Compare Tillage Systems in Cukurova Plain, Turkey. Soil Tillage Res. 2021, 208, 104892. [Google Scholar] [CrossRef]
  14. Cherubin, M.R.; Karlen, D.L.; Franco, A.L.C.; Cerri, C.E.P.; Tormena, C.A.; Cerri, C.C. A Soil Management Assessment Framework (SMAF) Evaluation of Brazilian Sugarcane Expansion on Soil Quality. Soil Sci. Soc. Am. J. 2016, 80, 215–226. [Google Scholar] [CrossRef]
  15. Laclau, J.P.; Bouillet, J.P.; Gonçalves, J.L.M.; Silva, E.V.; Jourdan, C.; Cunha, M.C.S.; Moreira, M.R.; Saint-André, L.; Maquère, V.; Nouvellon, Y.; et al. Mixed-Species Plantations of Acacia mangium and Eucalyptus grandis in Brazil. 1. Growth Dynamics and Aboveground Net Primary Production. Ecol. Manag. 2008, 255, 3905–3917. [Google Scholar] [CrossRef]
  16. Pereira, A.P.A.; Zagatto, M.R.G.; Brandani, C.B.; Mescolotti, D.d.L.; Cotta, S.R.; Gonçalves, J.L.M.; Cardoso, E.J.B.N. Acacia Changes Microbial Indicators and Increases C and N in Soil Organic Fractions in Intercropped Eucalyptus Plantations. Front. Microbiol. 2018, 9, 337107. [Google Scholar] [CrossRef]
  17. Alvares, C.A.; Stape, J.L.; Sentelhas, P.C.; De Moraes Gonçalves, J.L.; Sparovek, G. Köppen’s climate classification map for Brazil. Meteorol. Z. 2013, 22, 711–728. [Google Scholar] [CrossRef]
  18. Honda, H. Description of Cellular Patterns by Diricblet Domains: The Two-Dimensional Case. J. Theor. Biol. 1978, 72, 523–530. [Google Scholar] [CrossRef] [PubMed]
  19. Saint-André, L.; M’Bou, A.T.; Mabiala, A.; Mouvondy, W.; Jourdan, C.; Roupsard, O.; Deleporte, P.; Hamel, O.; Nouvellon, Y. Age-Related Equations for above- and below-Ground Biomass of a Eucalyptus Hybrid in Congo. Ecol. Manag. 2005, 205, 199–214. [Google Scholar] [CrossRef]
  20. Wienhold, B.J.; Karlen, D.L.; Andrews, S.S.; Stott, D.E. Protocol for Indicator Scoring in the Soil Management Assessment Framework (SMAF). Renew. Agric. Food Syst. 2009, 24, 260–266. [Google Scholar] [CrossRef]
  21. Stott, D.E.; Andrews, S.S.; Liebig, M.A.; Wienhold, B.J.; Karlen, D.L. Evaluation of β-Glucosidase Activity as a Soil Quality Indicator for the Soil Management Assessment Framework. Soil Sci. Soc. Am. J. 2010, 74, 107–119. [Google Scholar] [CrossRef]
  22. Mendes, I.C.; Sousa, D.M.G.; Dantas, O.D.; Lopes, A.A.L.; Reis Junior, F.B.; Oliveira, M.I.; Chaer, G.M. Soil Quality and Grain Yield: A Win–Win Combination in Clayey Tropical Oxisols. Geoderma 2021, 388, 114880. [Google Scholar] [CrossRef]
  23. Jiménez, P.; Ortiz, O.; Tarrasón, D.; Ginovart, M.; Bonmatí, M. Effect of Differently Post-Treated Dewatered Sewage Sludge on β-Glucosidase Activity, Microbial Biomass Carbon, Basal Respiration and Carbohydrates Contents of Soils from Limestone Quarries. Biol. Fertil. Soils 2007, 44, 393–398. [Google Scholar] [CrossRef]
  24. Cardoso, E.J.B.N.; Vasconcellos, R.L.F.; Bini, D.; Miyauchi, M.Y.H.; Santos, C.A.; Alves, P.R.L.; de Paula, A.M.; Nakatani, A.S.; Pereira, J.M.; Nogueira, M.A. Soil quality: Looking for suitable indicators. What should be considered to assess the effects of use and management on soil quality? Sci. Agric. 2013, 70, 274–289. [Google Scholar] [CrossRef]
  25. Raij, B.V.; Andrade, J.C.; Cantarela, H.; Quaggio, J.A. Análise Química para a Avaliação da Fertilidade de Solos Tropicais; Instituto Agronômico: Campinas, Brazil, 2001; 285p. Available online: http://lab.iac.sp.gov.br/Publicacao/Raij_et_al_2001_Metod_Anal_IAC.pdf/ (accessed on 20 March 2023).
  26. Brookes, P.C.; Landman, A.; Pruden, G.; Jenkinson, D.S. Chloroform Fumigation and the Release of Soil Nitrogen: A Rapid Direct Extraction Method to Measure Microbial Biomass Nitrogen in Soil. Soil Biol. Biochem. 1985, 17, 837–842. [Google Scholar] [CrossRef]
  27. Vance, E.D.; Brggke, P.C.; Jenkinon, D.S. An Extraction Method for Measuring Soil Microbial Biomass C. Soil Biol. Biochem. 1987, 19, 703–707. [Google Scholar] [CrossRef]
  28. Tabatabai, M.A. Soil Enzymes. Methods Soil Anal. Part 2 Microbiol. Biochem. Prop. 1994, 5, 775–833. [Google Scholar] [CrossRef]
  29. Simonet, P.; Grosjean, M.C.; Misra, A.K.; Nazaret, S.; Cournoyer, B.; Normand, P. Frankia Genus-Specific Characterization by Polymerase Chain Reaction. Appl. Environ. Microbiol. 1991, 57, 3278–3286. [Google Scholar] [CrossRef]
  30. Poly, F.; Monrozier, L.J.; Bally, R. Improvement in the RFLP Procedure for Studying the Diversity of NifH Genes in Communities of Nitrogen Fixers in Soil. Res. Microbiol. 2001, 152, 95–103. [Google Scholar] [CrossRef] [PubMed]
  31. Caporaso, J.G.; Lauber, C.L.; Walters, W.A.; Berg-Lyons, D.; Lozupone, C.A.; Turnbaugh, P.J.; Fierer, N.; Knight, R. Global Patterns of 16S RRNA Diversity at a Depth of Millions of Sequences per Sample. Proc. Natl. Acad. Sci. USA 2011, 108, 4516–4522. [Google Scholar] [CrossRef] [PubMed]
  32. Caporaso, J.G.; Kuczynski, J.; Stombaugh, J.; Bittinger, K.; Bushman, F.D.; Costello, E.K.; Fierer, N.; Peña, A.G.; Goodrich, J.K.; Gordon, J.I.; et al. QIIME Allows Analysis of High—Throughput Community Sequencing Data. Nat. Methods 2010, 7, 335–336. [Google Scholar] [CrossRef]
  33. Lozupone, C.; Lladser, M.E.; Knights, D.; Stombaugh, J.; Knight, R. UniFrac: An Effective Distance Metric for Microbial Community Comparison. ISME J. 2011, 5, 169–172. [Google Scholar] [CrossRef] [PubMed]
  34. Gonçalves, J.L.M.; Benedetti, V. Nutrição e Fertilizacão Florestal; IPEF: Piracicaba, Brazil, 2000; 427p, Available online: https://www.bdpa.cnptia.embrapa.br/consulta/busca?b=ad&id=297693&biblioteca=vazio&busca=autoria:%22GON%C3%87ALVES,%20J.%20L.%22&qFacets=autoria:%22GON%C3%87AVES,%20J.%20L.%22&sort=&paginacao=t&paginaAtual=1/ (accessed on 17 April 2023).
  35. Bazani, J.H.; Gonçalves, J.L.M.; Rocha, J.H.T.; Melo, E.S.A.C.; Prieto, M. Nutrição fosfatada em plantações de eucalipto. Informações Agronômicas 2014, 148, 11. Available online: http://www.ipni.net/publication/ia-brasil.nsf/0/642B9B97BDFBC80C83257DB600698A31/$FILE/Page1-11-148.pdf/ (accessed on 23 April 2023).
  36. Lorenzi, J.O.; Monteiro, P.A.; Miranda Filho, H.S.; Van Raij, B. Raízes e tubérculos. In Recomendações de Adubação e Calagem para o Estado de São Paulo; IAC. Boletim Técnico, 100; Van Raij, B., Cantarella, H., Quaggio, J.A., Furlani, A.M.C., Eds.; Instituto Agronômico de Campinas: Campinas, Brazil, 1997; pp. 221–229. [Google Scholar]
  37. R Core Team. R: A Language and Environment for Statistical Computing; R Foundation for Statistical Computing: Vienna, Austria, 2021; Available online: https://www.R-project.org/ (accessed on 13 March 2020).
  38. Mendiburu, F. agricolae: Statistical Procedures for Agricultural Research, R Package, version 1.3-5; R Foundation for Statistical Computing: Vienna, Austria, 2021. Available online: https://CRAN.R-project.org/package=agricolae(accessed on 13 March 2020).
  39. Warnes, G.R.; Bolker, B.; Bonebakker, L.; Gentleman, R.; Huber, W.; Liaw, A.; Lumley, T.; Maechler, M.; Magnusson, A.; Moeller, S.; et al. gplots: Various R Programming Tools for Plotting Data, R Package, version 2.4; R Foundation for Statistical Computing: Vienna, Austria, 2009; Available online: https://cran.r-project.org/web/packages/gplots/index.html/ (accessed on 11 April 2023).
  40. Neuwirth, E. RColorBrewer: ColorBrewer Palettes. R Package, version 1.1-2; R Foundation for Statistical Computing: Vienna, Austria, 2014. Available online: https://CRAN.R-project.org/package=RColorBrewer/(accessed on 19 March 2023).
  41. Tng, D.Y.P.; Janos, D.P.; Jordan, G.J.; Weber, E.; Bowman, D.M.J.S. Phosphorus Limits Eucalyptus grandis Seedling Growth in an Unburnt Rain Forest Soil. Front. Plant Sci. 2014, 5, 98324. [Google Scholar] [CrossRef]
  42. Daniel, B.; Cardoso, E.J.B.N. Intercropping Acacia mangium stimulates AMF colonization and soil phosphatase activity in Eucalyptus grandis. Sci. Agric. 2018, 75, 102–110. [Google Scholar] [CrossRef]
  43. Hoffland, E.; Kuyper, T.W.; Comans, R.N.J.; Creamer, R.E. Eco-Functionality of Organic Matter in Soils. Plant Soil 2020, 455, 1–22. [Google Scholar] [CrossRef]
  44. Adetunji, A.T.; Lewu, F.B.; Mulidzi, R.; Ncube, B. The Biological Activities of β-Glucosidase, Phosphatase and Urease as Soil Quality Indicators: A Review. J. Soil Sci. Plant Nutr. 2017, 17, 794–807. [Google Scholar] [CrossRef]
  45. Lopes, A.C.A.; Gomes de Sousa, D.M.; Chaer, G.M.; Bueno dos Reis Junior, F.; Goedert, W.J.; de Carvalho Mendes, I. Interpretation of Microbial Soil Indicators as a Function of Crop Yield and Organic Carbon. Soil Sci. Soc. Am. J. 2013, 77, 461–472. [Google Scholar] [CrossRef]
  46. Stege, P.W.; Messina, G.A.; Bianchi, G.; Olsina, R.A.; Raba, J. Determination of β-Glucosidase Activity in Soils with a Bioanalytical Sensor Modified with Multiwalled Carbon Nanotubes. Anal. Bioanal. Chem. 2010, 397, 1347–1353. [Google Scholar] [CrossRef] [PubMed]
  47. Pereira, A.P.A.; Araujo, A.S.F.; Santana, M.C.; Lima, A.Y.V.; de Araujo, V.L.V.P.; Verma, J.P.; Cardoso, E.J.B.N. Enzymatic Stoichiometry in Tropical Soil under Pure and Mixed Plantations of Eucalyptus with N2-Fixing Trees. Sci. Agric. 2022, 80, e20210283. [Google Scholar] [CrossRef]
  48. Nawaz, M.F.; Bourrié, G.; Trolard, F. Soil compaction impact and modelling. A review. Agron. Sustain. Dev. 2013, 33, 291–309. [Google Scholar] [CrossRef]
  49. Greacen, E.L.; Sands, R. Compaction of forest soils. A review. Soil Res. 1980, 18, 163–189. [Google Scholar] [CrossRef]
  50. Labelle, E.R.; Hansson, L.; Högbom, L.; Jourgholami, M.; Laschi, A. Strategies to Mitigate the Effects of Soil Physical Disturbances Caused by Forest Machinery: A Comprehensive Review. Curr. For. Rep. 2022, 8, 20–37. [Google Scholar] [CrossRef]
  51. Bouillet, J.P.; Laclau, J.P.; Gonçalves, J.L.M.; Moreira, M.Z.; Trivelin, P.C.O.; Jourdan, C.; Silva, E.V.; Piccolo, M.C.; Tsai, S.M.; Galiana, A. Mixed-Species Plantations of Acacia mangium and Eucalyptus grandis in Brazil. 2: Nitrogen Accumulation in the Stands and Biological N2 Fixation. Ecol. Manag. 2008, 255, 3918–3930. [Google Scholar] [CrossRef]
  52. Santos, P.C.; Fang, Z.; Mason, S.W.; Setubal, J.C.; Dixon, R. Distribution of Nitrogen Fixation and Nitrogenase-like Sequences amongst Microbial Genomes. BMC Genom. 2012, 13, 162. [Google Scholar] [CrossRef]
  53. Pereira, A.P.A.; Durrer, A.; Gumiere, T.; Gonçalves, J.L.M.; Robin, A.; Bouillet, J.P.; Wang, J.; Verma, J.P.; Singh, B.K.; Cardoso, E.J.B.N. Mixed Eucalyptus Plantations Induce Changes in Microbial Communities and Increase Biological Functions in the Soil and Litter Layers. Ecol. Manag. 2019, 433, 332–342. [Google Scholar] [CrossRef]
  54. Cabugao, K.G.; Timm, C.M.; Carrell, A.A.; Childs, J.; Lu, T.Y.S.; Pelletier, D.A.; Weston, D.J.; Norby, R.J. Root and Rhizosphere Bacterial Phosphatase Activity Varies with Tree Species and Soil Phosphorus Availability in Puerto Rico Tropical Forest. Front. Plant Sci. 2017, 8, 293593. [Google Scholar] [CrossRef]
  55. Margalef, O.; Sardans, J.; Fernández-Martínez, M.; Molowny-Horas, R.; Janssens, I.A.; Ciais, P.; Goll, D.; Richter, A.; Obersteiner, M.; Asensio, D.; et al. Global Patterns of Phosphatase Activity in Natural Soils. Sci. Rep. 2017, 7, 1337. [Google Scholar] [CrossRef]
  56. Moraes, J.L.G.; Bouillet, J.P.; Guillemot, J.; Brancalion, P.H.S.; Teixeira, J.C.M.; Vicente, A.F.; Behling, M.; Laclau, J.P. Establishing mixed-species planted forests for restoration and production in Brazil. Unasylva 2023, 74, 55–59. [Google Scholar] [CrossRef]
Figure 1. At 27 and 39 months after planting, soil samples were collected from the mixed Eucalyptus grandis and Acacia mangium plantation, which had a spacing of 3 m × 3 m and a 1:1 proportion of the two tree species. (a) represents the 27-month sampling period, and (b) represents the 39-month sampling period. In (c), a visual representation is provided, showing both pure and intercropped plots, along with the sampling strategy utilizing the Voronoi polygon methodology. The numbers from 1 to 6 indicate the selected trees from which soil samples were obtained.
Sustainability 16 02534 g001
Figure 2. In (A), a schematic representation of the soil and litter grids used for sampling is presented. The total plot area measures 36 m × 36 m, with the usable plot area being 24 m × 24 m. The spacing between plants is 3 m × 3 m. The numbers from 1 to 6 indicate the selected trees from which soil samples were collected, while “X” represents the specific collection points within each tree. In (B), the “R” denotes the reference tree, and the six rectangles illustrate the dimensions of each sampled point.
Sustainability 16 02534 g002
Figure 3. The soil quality index (SQI) scores based on the Soil Management Assessment Framework (SMAF) for pure and mixed eucalypt plantations at 27 and 39 months (in the 0–20 cm layer). The treatments included pure eucalypt plantation without nitrogen fertilization (E), pure eucalypt plantation with nitrogen fertilization (E + N), pure acacia plantation (A), and mixed plantation of eucalypt and acacia (E + A). Upper-case letters compared SQI between treatments within each sampling periods (p < 0.05); lower-case letters compared treatments within each sampling periods (p < 0.05) for chemical component. Ns indicate groups with no significant differences.
Sustainability 16 02534 g003
Figure 4. Principal component analysis (PCA) with the relationship between SMAF scores (SQI and components) and pure and mixed eucalypt plantations at 27 (a) and 39 (b) months. Pure eucalypt plantation without (E) and with N-fertilization (E + N), pure acacia (A), and mixed plantation between eucalypt and acacia (E + A).
Sustainability 16 02534 g004
Figure 5. Spearman’s correlation test between SMAF-scores with soil chemical, physical e microbiological properties in pure and mixed eucalypt plantations at 27 (a) and 39 (b) months. * Significant effect (p < 0.05).
Sustainability 16 02534 g005
Table 1. Soil quality indicators (0–20 cm soil layer) under pure and mixed eucalypt plantations at 27 and 39 months. 1 Pure eucalypt plantation without (E) and with N-fertilization (E + N), pure acacia (A) and mixed plantation between eucalypt and acacia (E + A). 2 Soil organic carbon C (SOC (%)), microbial biomass C (MBC (mg kg−1)), soil pH, available phosphorus (P-resin (mg kg−1)), bulk soil density (BD (Mg m−3)), β-glucosidase activity (BG (mg PNF kg−1 h−1)), and potassium (K (cmolc kg−1)). * For a given parameter, upper-case letters compared treatments within each period and lower-case letters compared sampling periods within each treatment (p < 0.05). ns = non-significant effect.
Treatments 1Sampling PeriodSoil Quality Indicators (Mean Values) 2
SOCMBCpHPBDBGK
E27 months4.17 Aa*478 Ba4.0 ns3.44 Bb1.21 Aa81.93 Aa195 Bb
E + N3.57 Ba562 Ba3.6 ns3.40 Bb1.21 Aa83.73 Aa185 Bb
A4.46 Aa815 Aa4.1 ns5.70 Ab1.16 Ba87.31 Aa185 Bb
E + A4.38 Aa839 Aa4.3 ns5.90 Ab1.05 Ba92.66 Aa205 Ab
E39 months2.75 Bb475 Aa3.8 ns2.40 Bb1.21 Aa74.44 Aa312 Ba
E + N2.84 Bb477 Aa3.7 ns3.30 Bb1.21 Aa76.74 Aa351 Aa
A2.93 Bb617 Aa4.2 ns5.80 Aa1.16 Ba74.24 Ab351 Aa
E + A4.45 Aa667 Aa4.3 ns6.30 Aa1.04 Ba81.41 Aa351 Aa
Table 2. SMAF scores (0–20 cm soil layer) under pure and mixed eucalypt plantations at 27 and 39 months after planting. 1 Pure eucalypt plantation without (E) and with N-fertilization (E + N), pure acacia (A) and mixed plantation between eucalypt and acacia (E + A). 2 Soil organic carbon C (SOC), microbial biomass C (MBC), soil pH, available phosphorus (P-resin), bulk soil density (BD), β-glucosidase activity (BG), and potassium (K). * For a given parameter, upper-case letters compared treatments within each period and lower-case letters compared sampling periods within each treatment (p < 0.05). ns = non-significant effect.
Treatments 1Sampling PeriodSMAF Scores (Mean Values) 2
SOCMBCpHPBDBGK
E27 months1 ns*1 ns0.34 Ba0.55 Ba0.99 ns0.89 Ba1 ns
E + N1 ns1 ns0.17 Ca0.49 Ba0.99 ns0.90 Ba1 ns
A1 ns1 ns0.39 Bb0.85 Aa0.99 ns0.92 Aa1 ns
E + A1 ns1 ns0.49 Aa0.84 Aa0.99 ns0.93 Aa1 ns
E39 months1 ns1 ns0.23 Bb0.31 Bb0.99 ns0.82 Bb1 ns
E + N1 ns1 ns0.21 Ba0.48 Ba0.99 ns0.84 Bb1 ns
A1 ns1 ns0.46 Aa0.88 Aa0.99 ns0.80 Bb1 ns
E + A1 ns1 ns0.52 Aa0.82 Aa0.99 ns0.88 Ab1 ns
Disclaimer/Publisher’s Note: The statements, opinions and data contained in all publications are solely those of the individual author(s) and contributor(s) and not of MDPI and/or the editor(s). MDPI and/or the editor(s) disclaim responsibility for any injury to people or property resulting from any ideas, methods, instructions or products referred to in the content.

