
Energy Analysis for Global Berry Fruit Production


Abstract
1. Introduction
2. Materials and Methods
3. Results
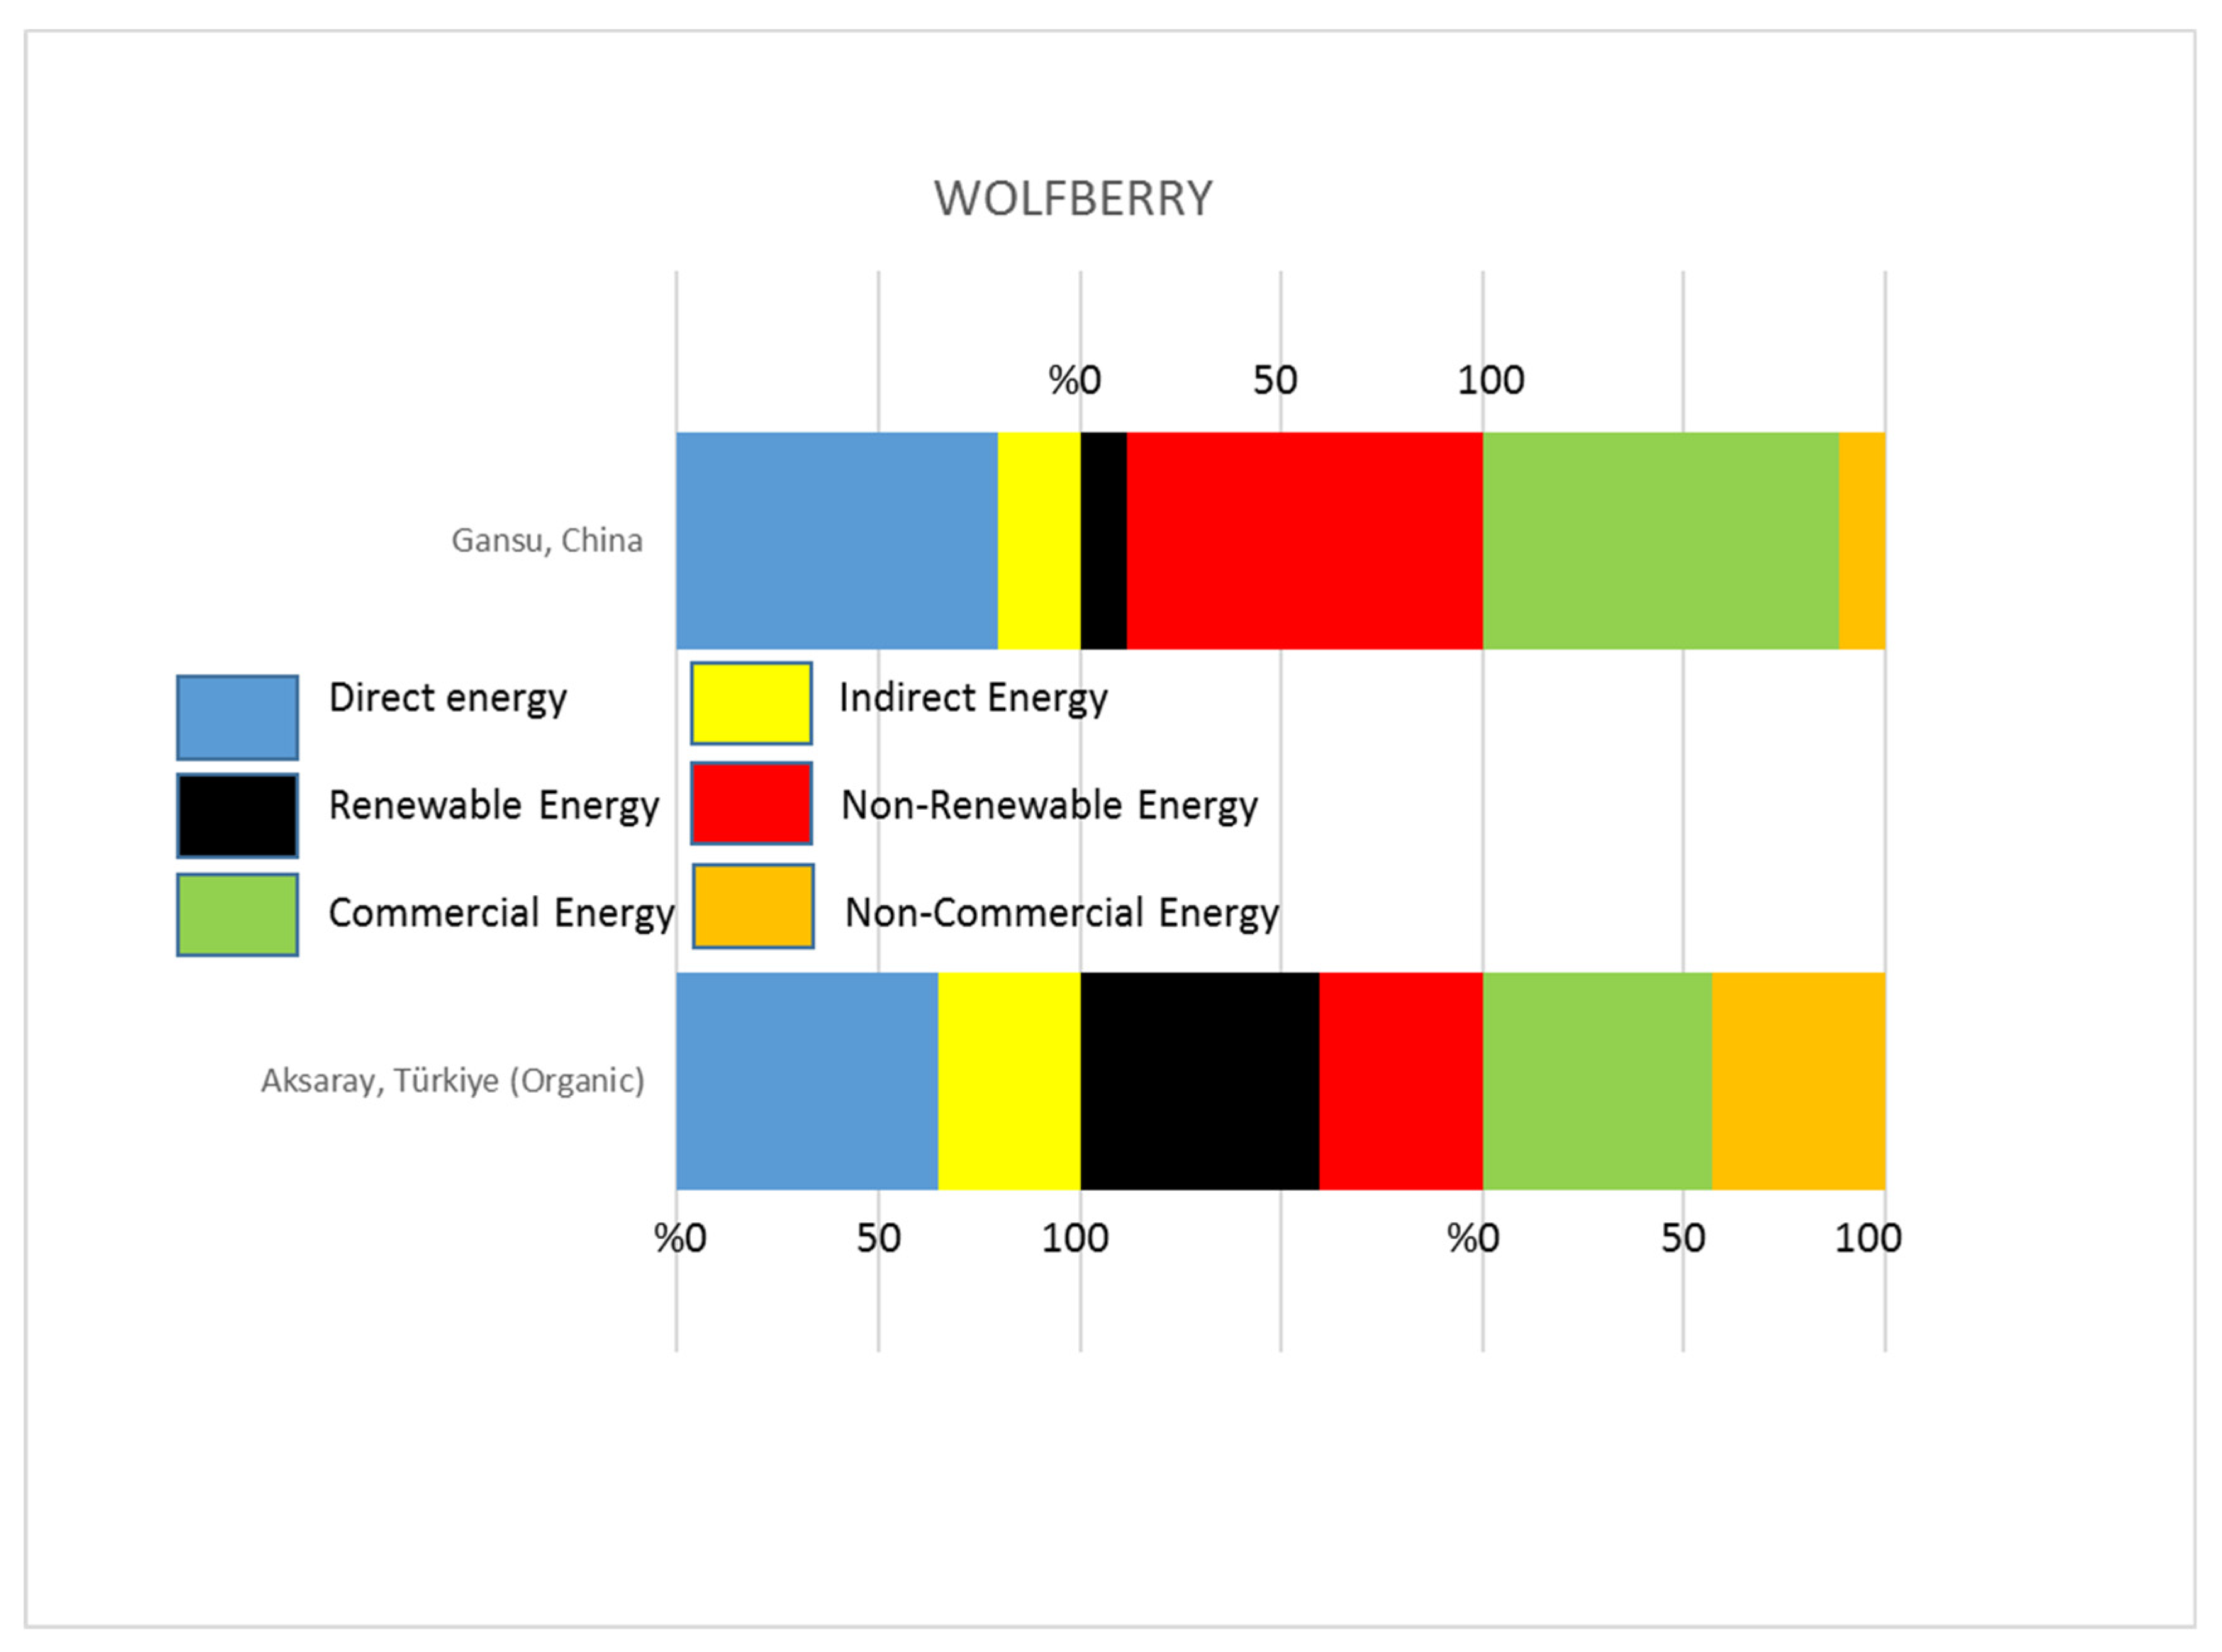
3.1. Wolfberry
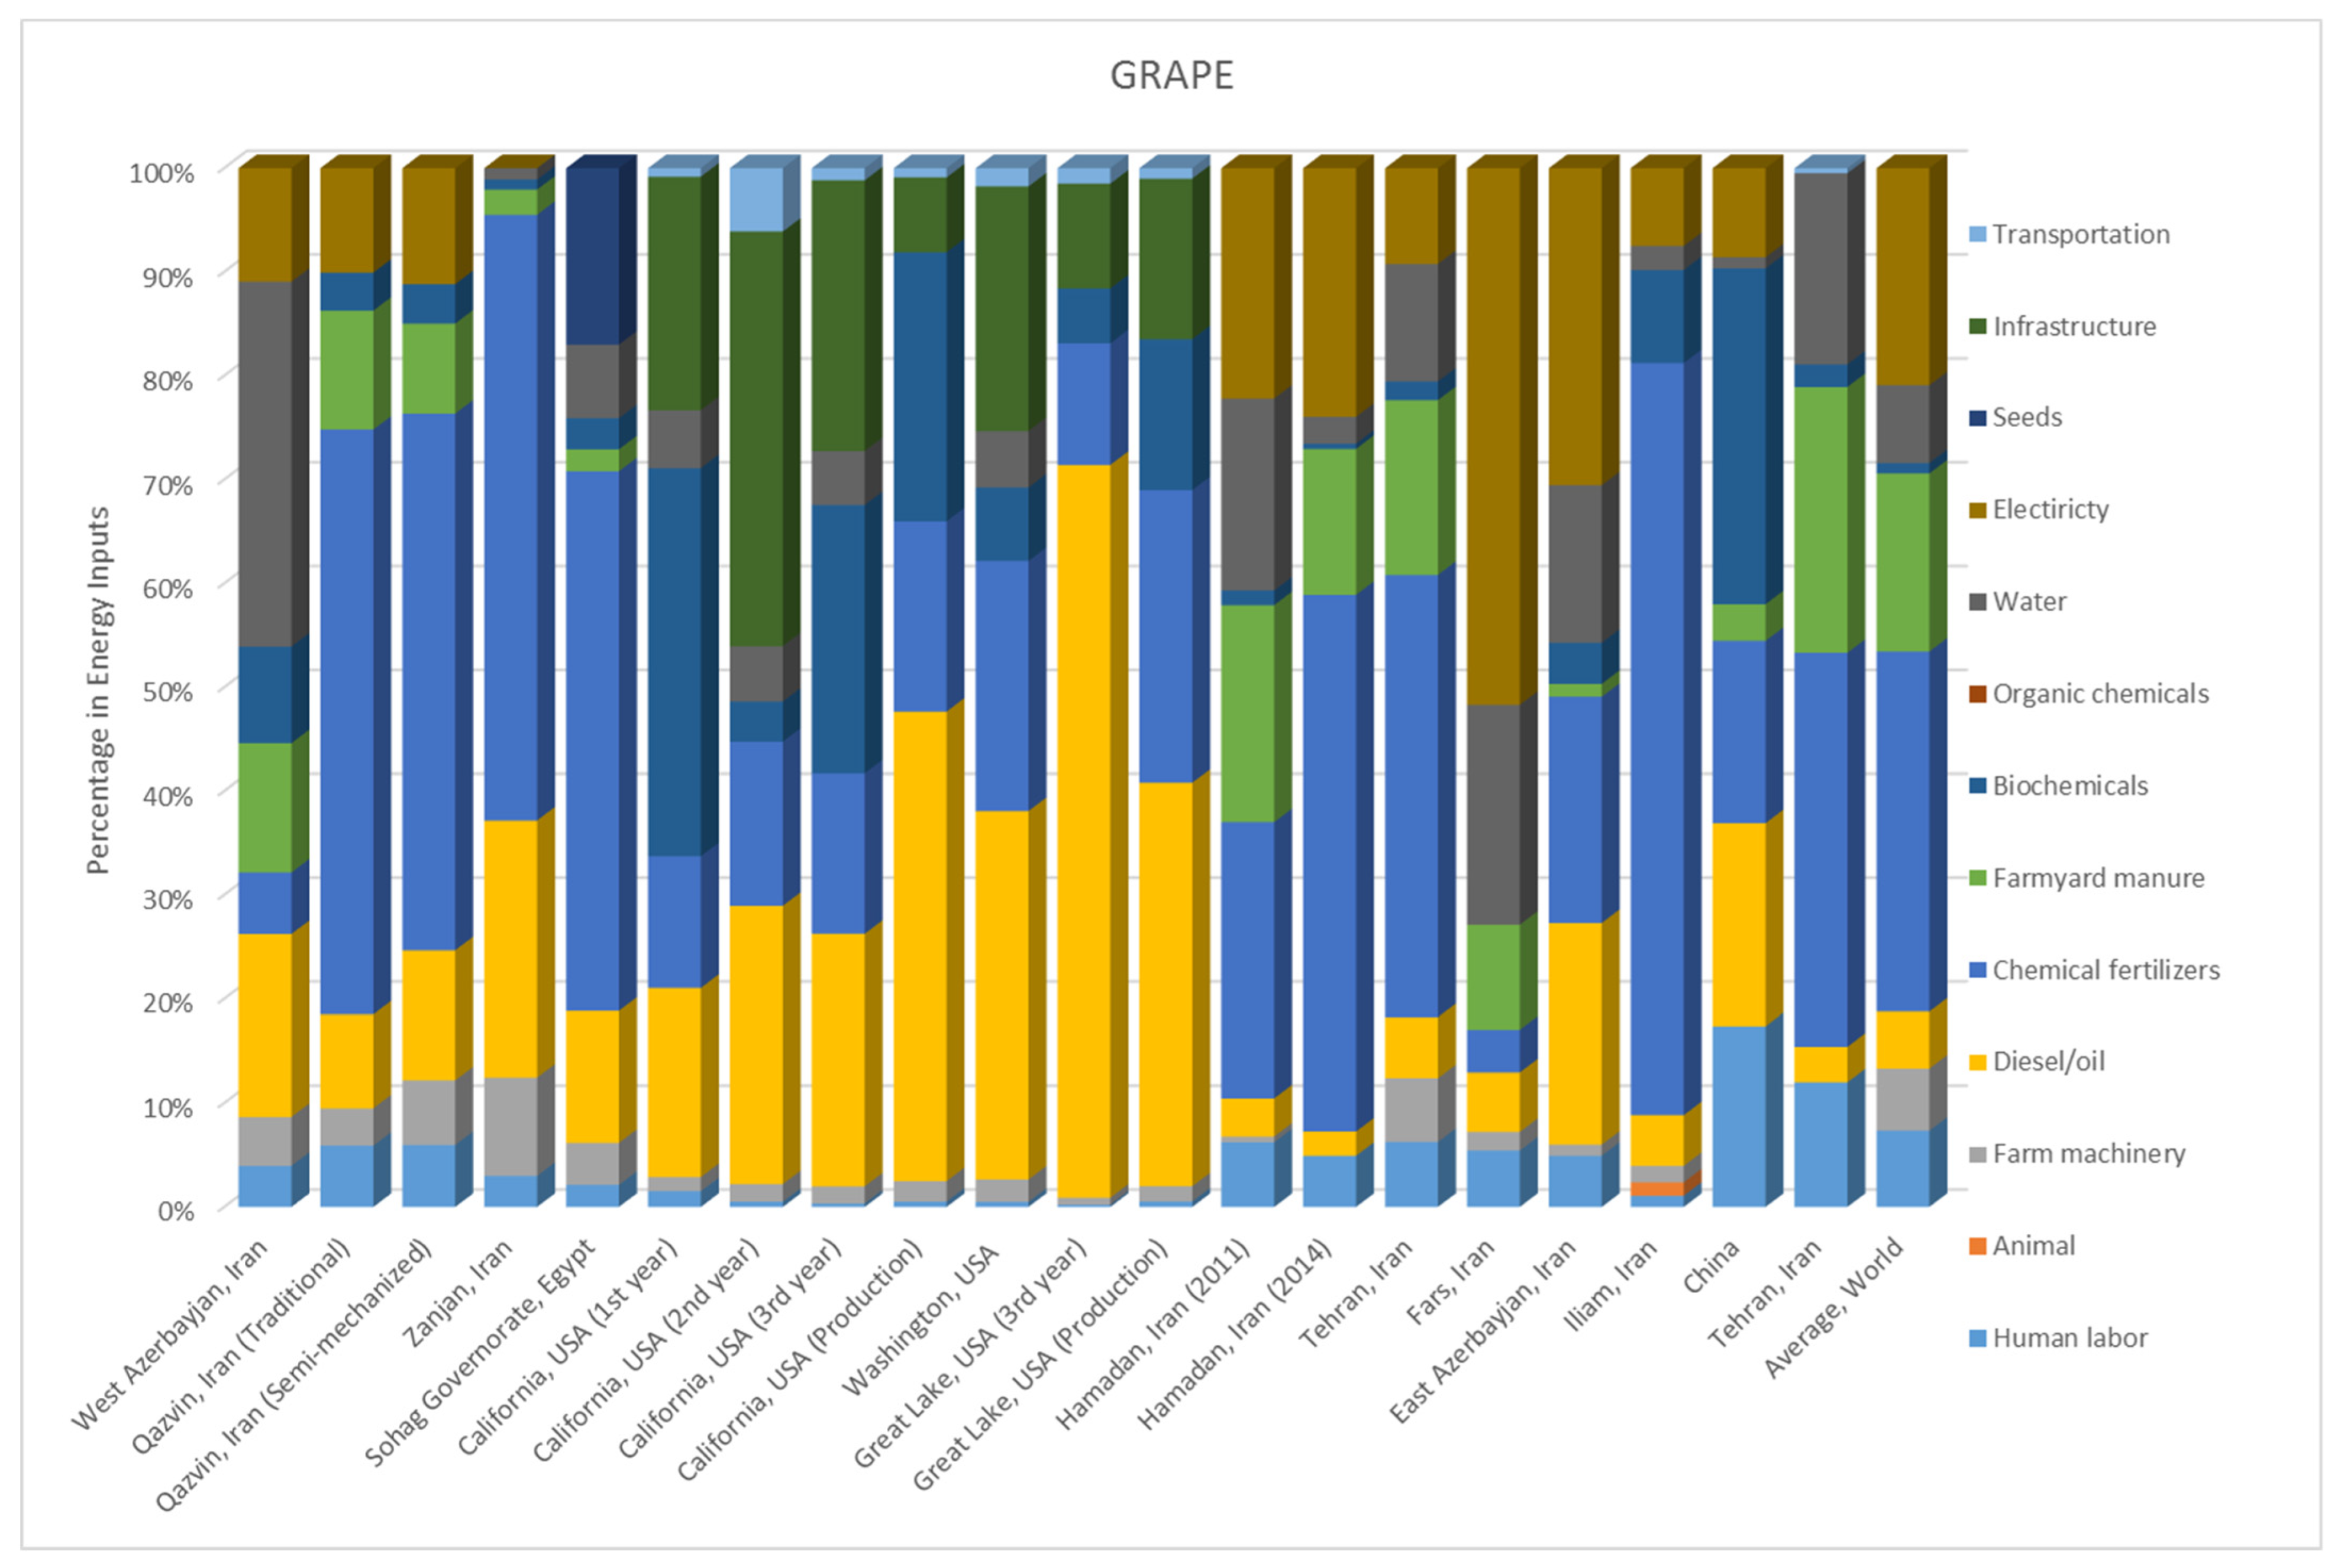
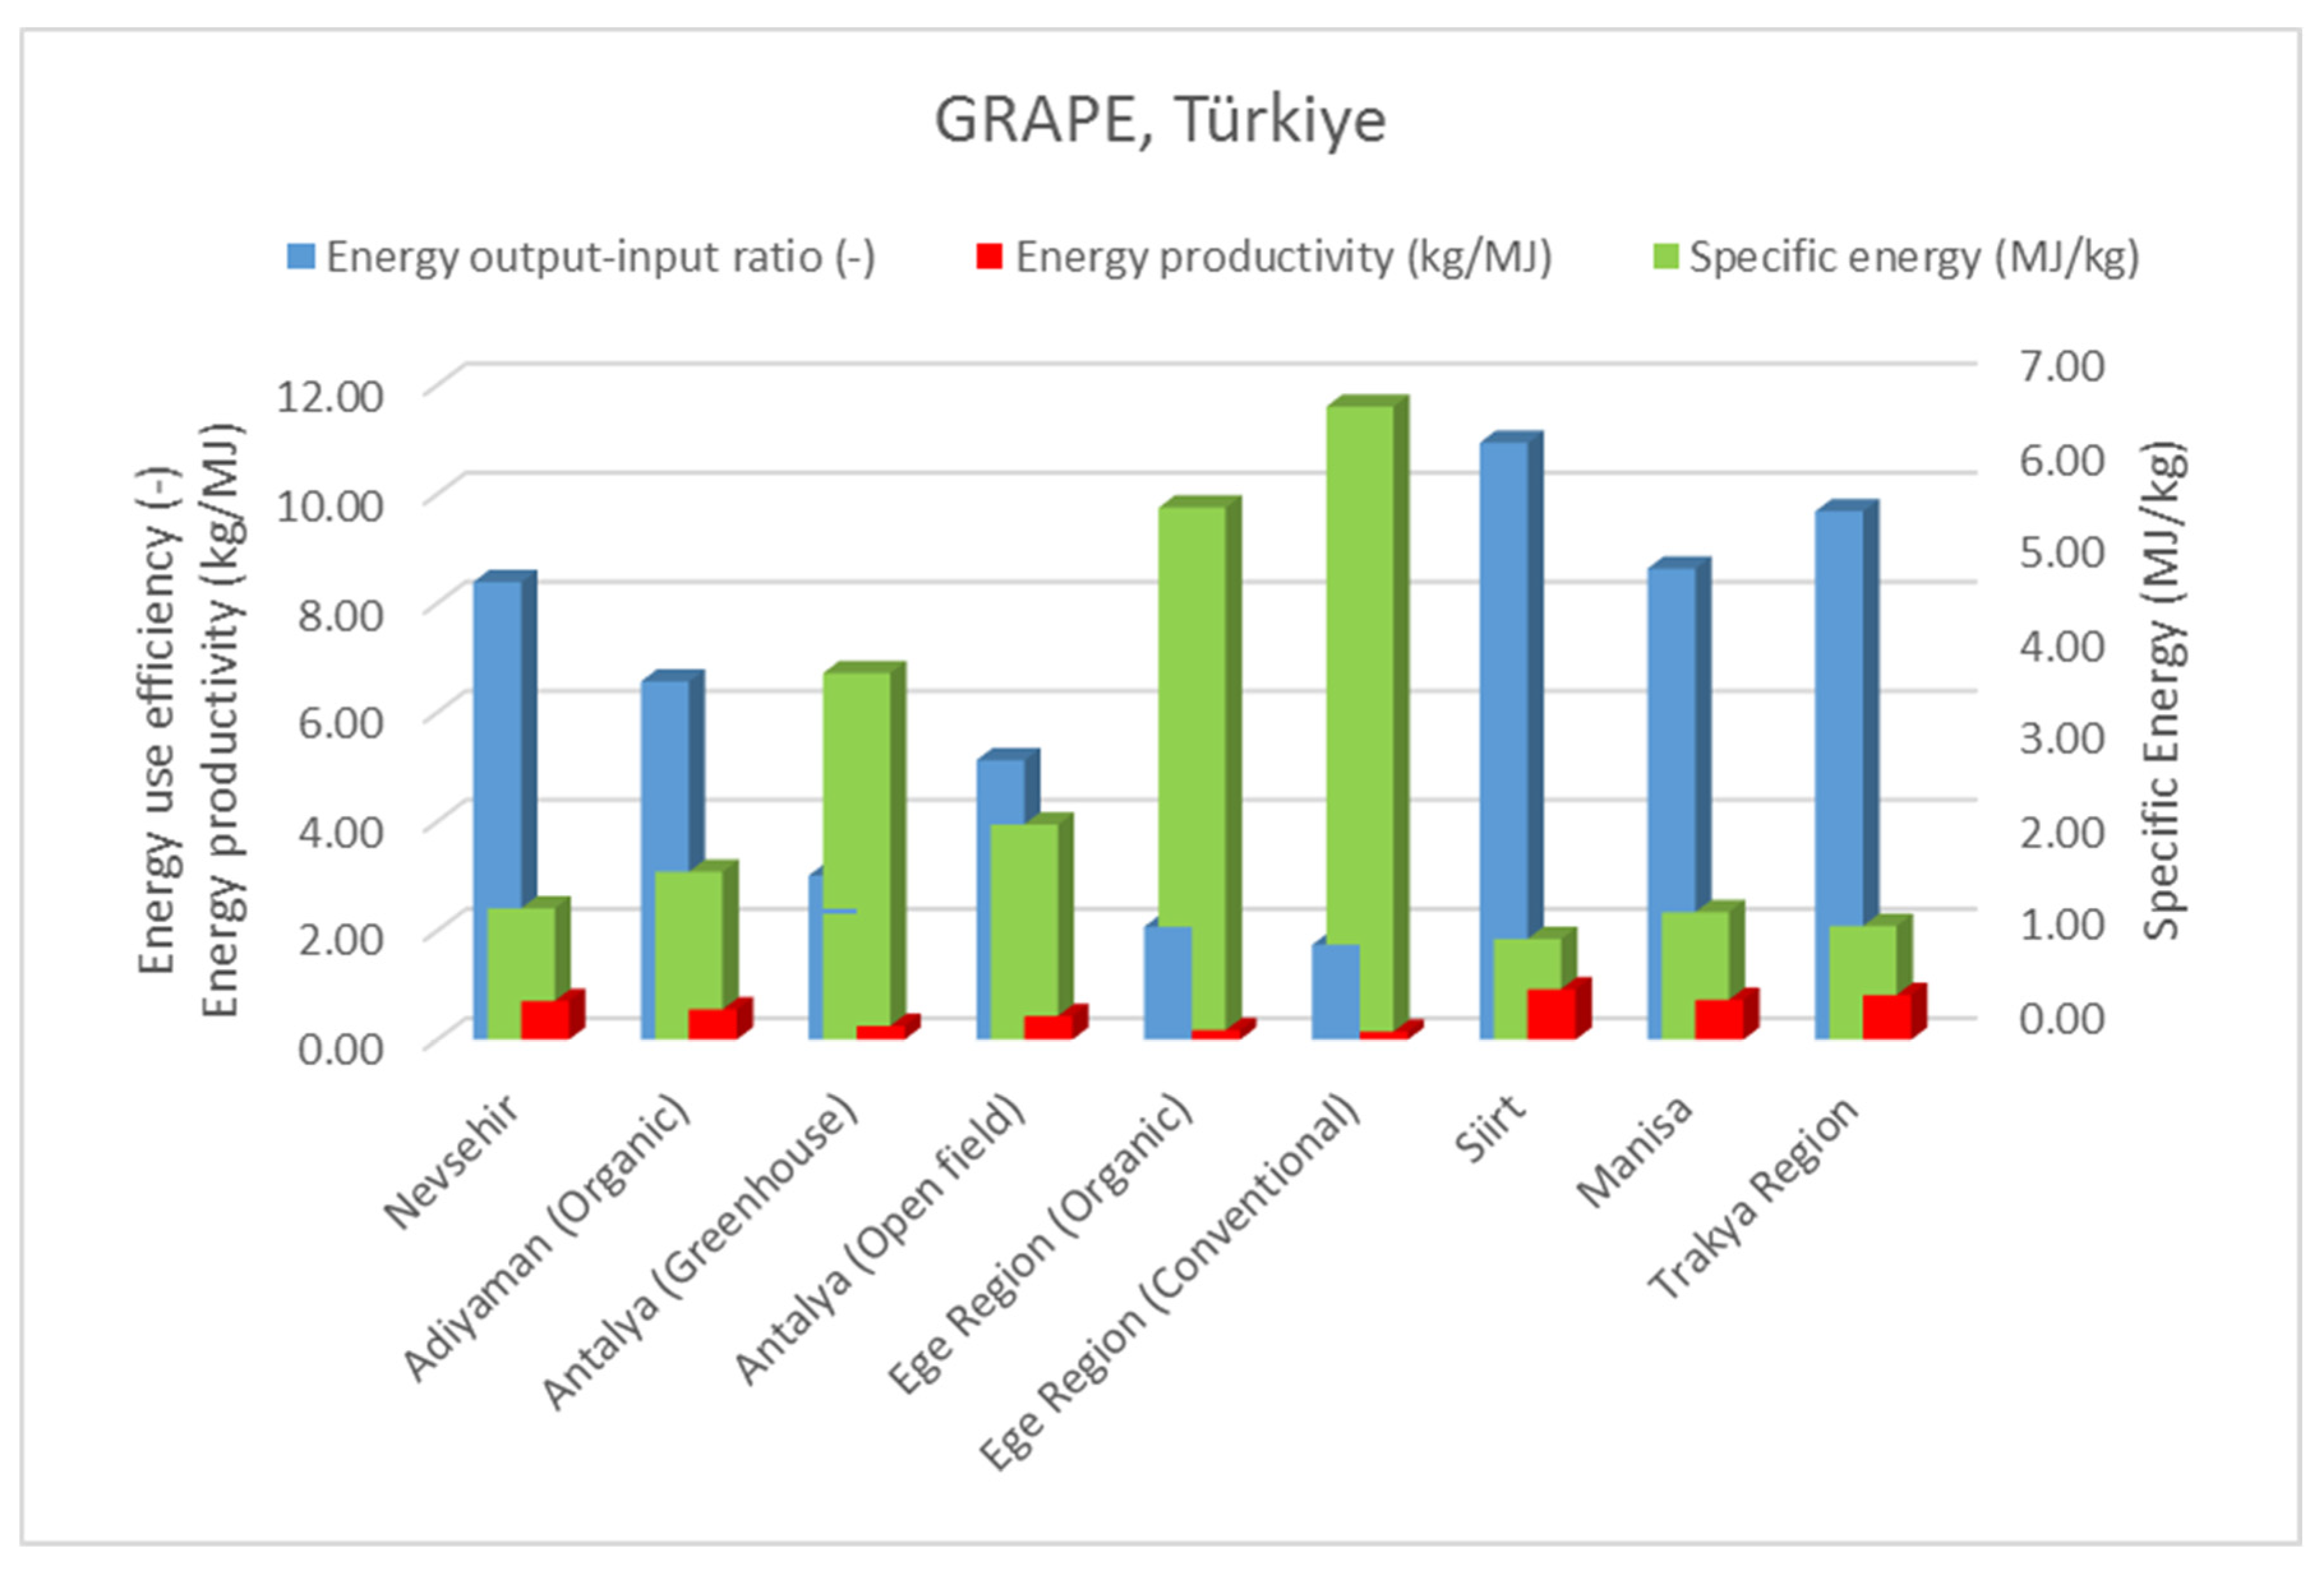
3.2. Grapes
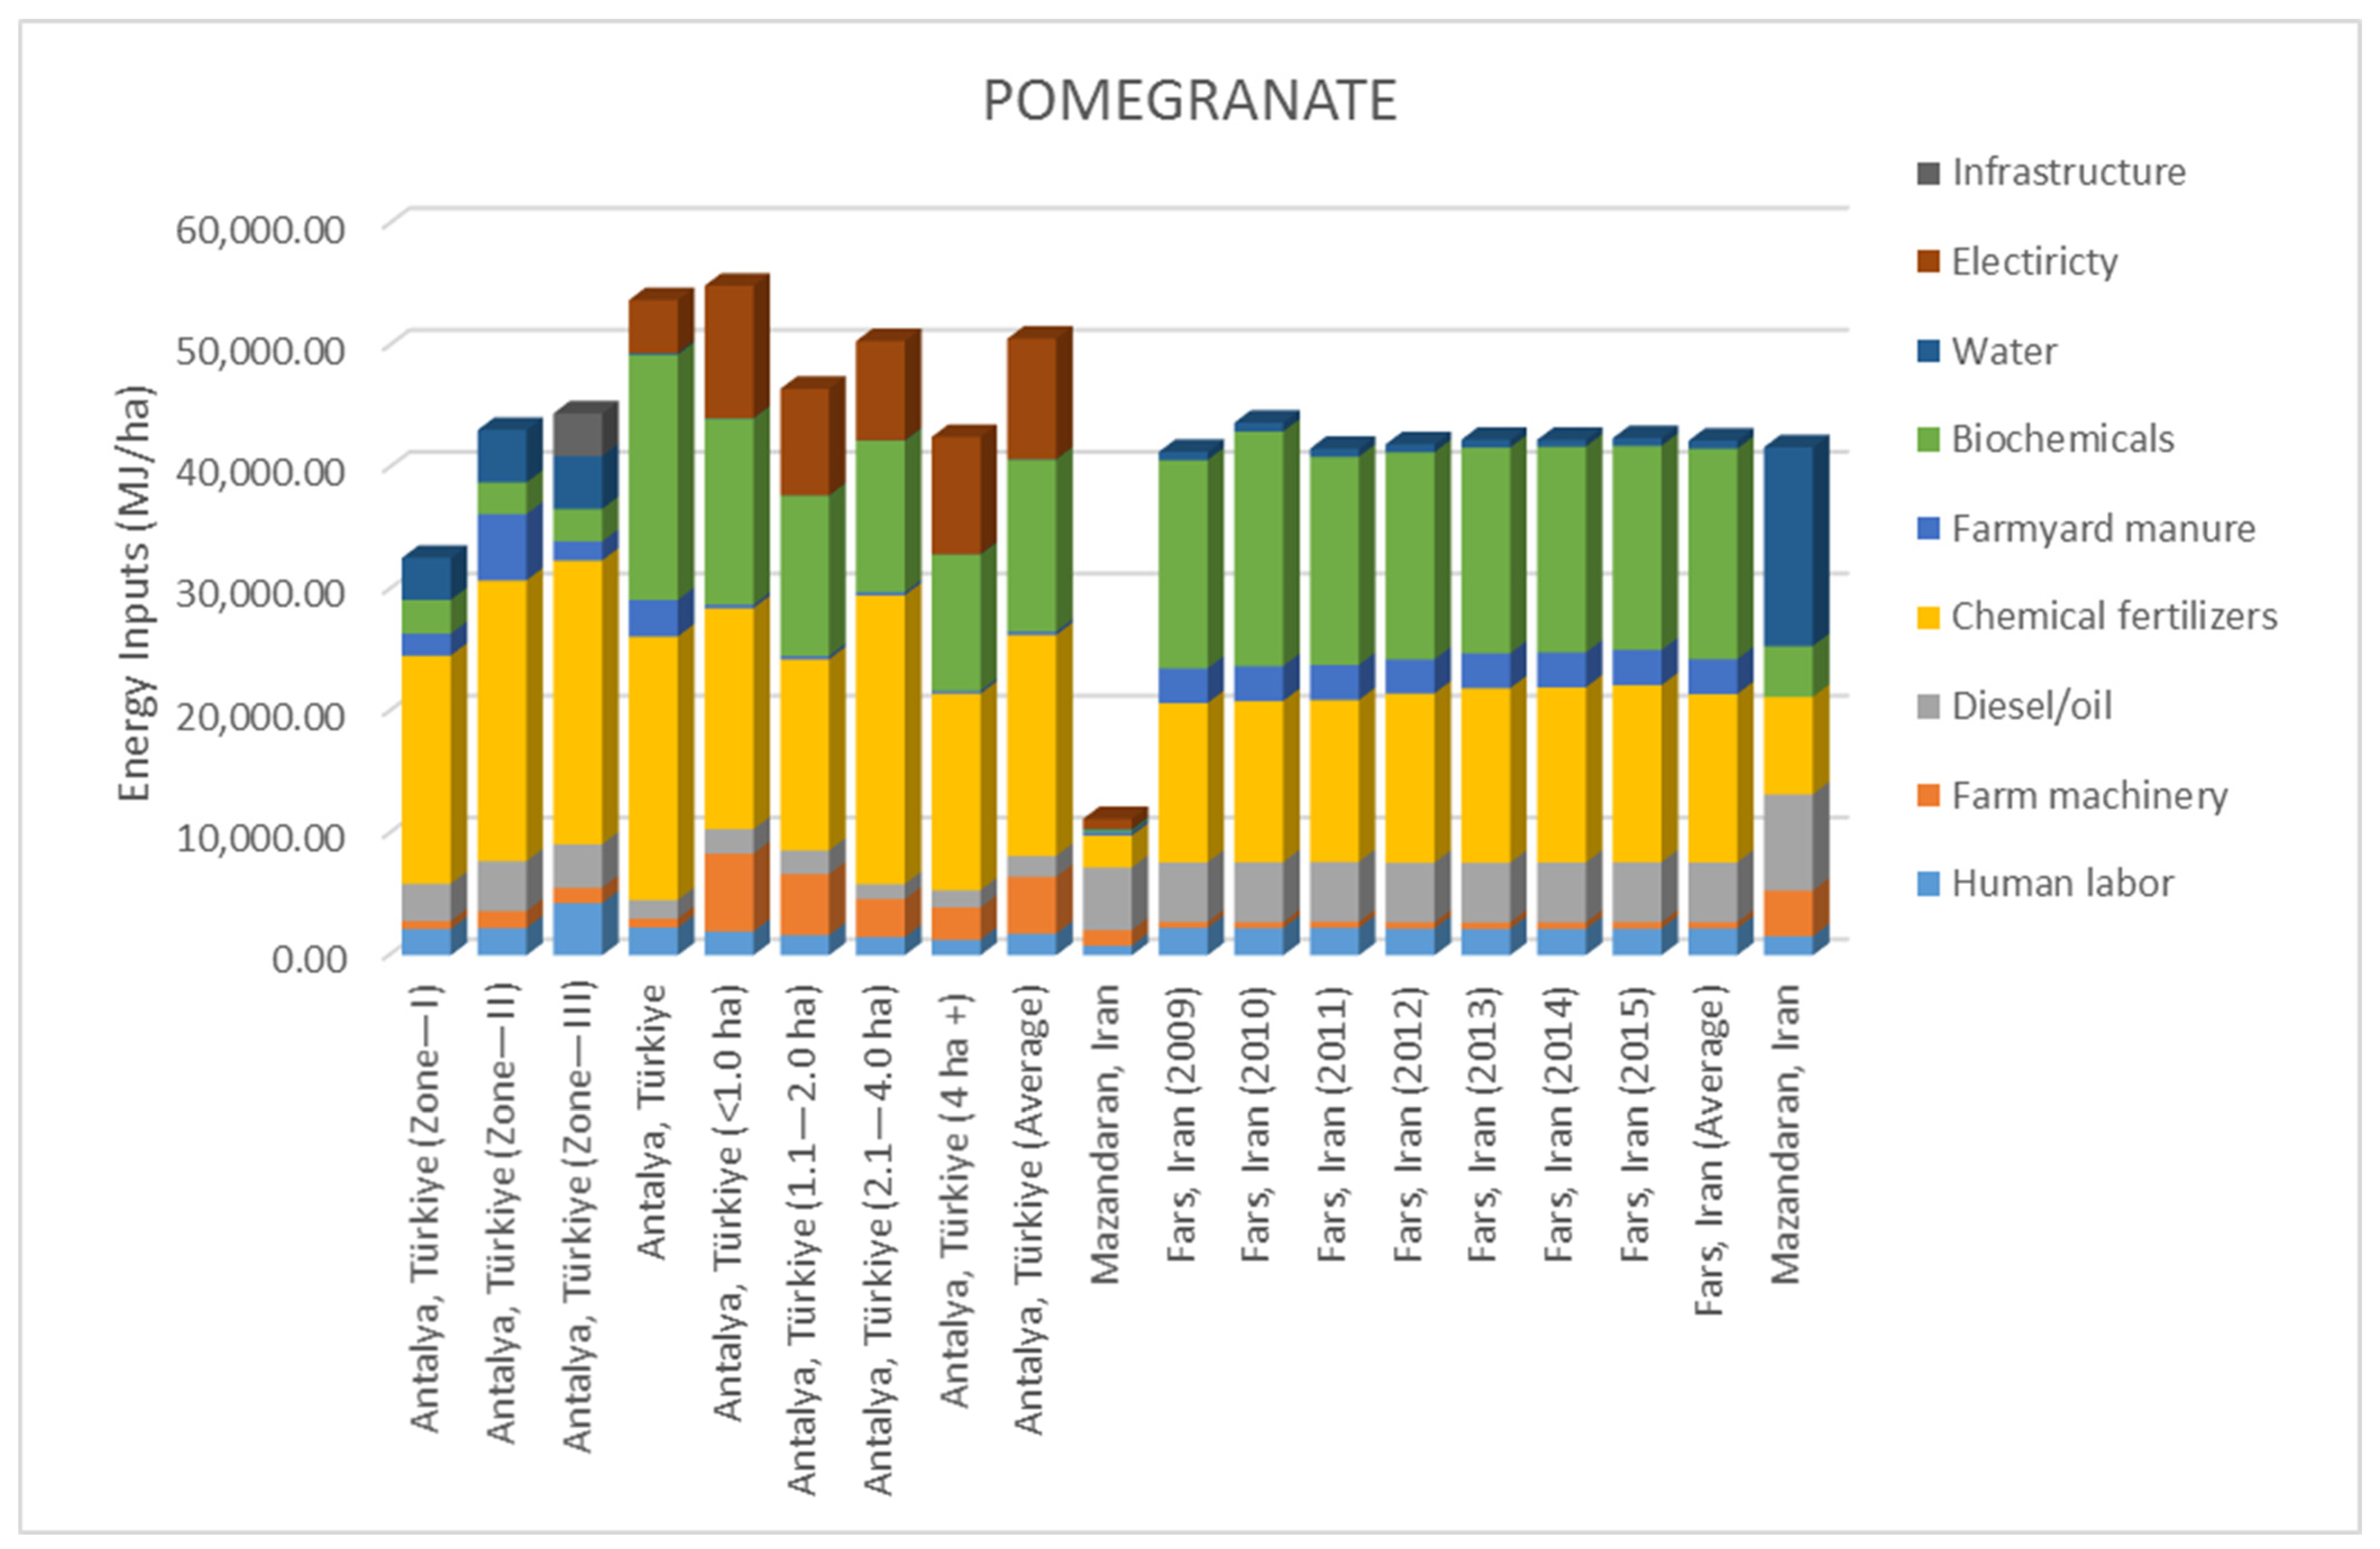
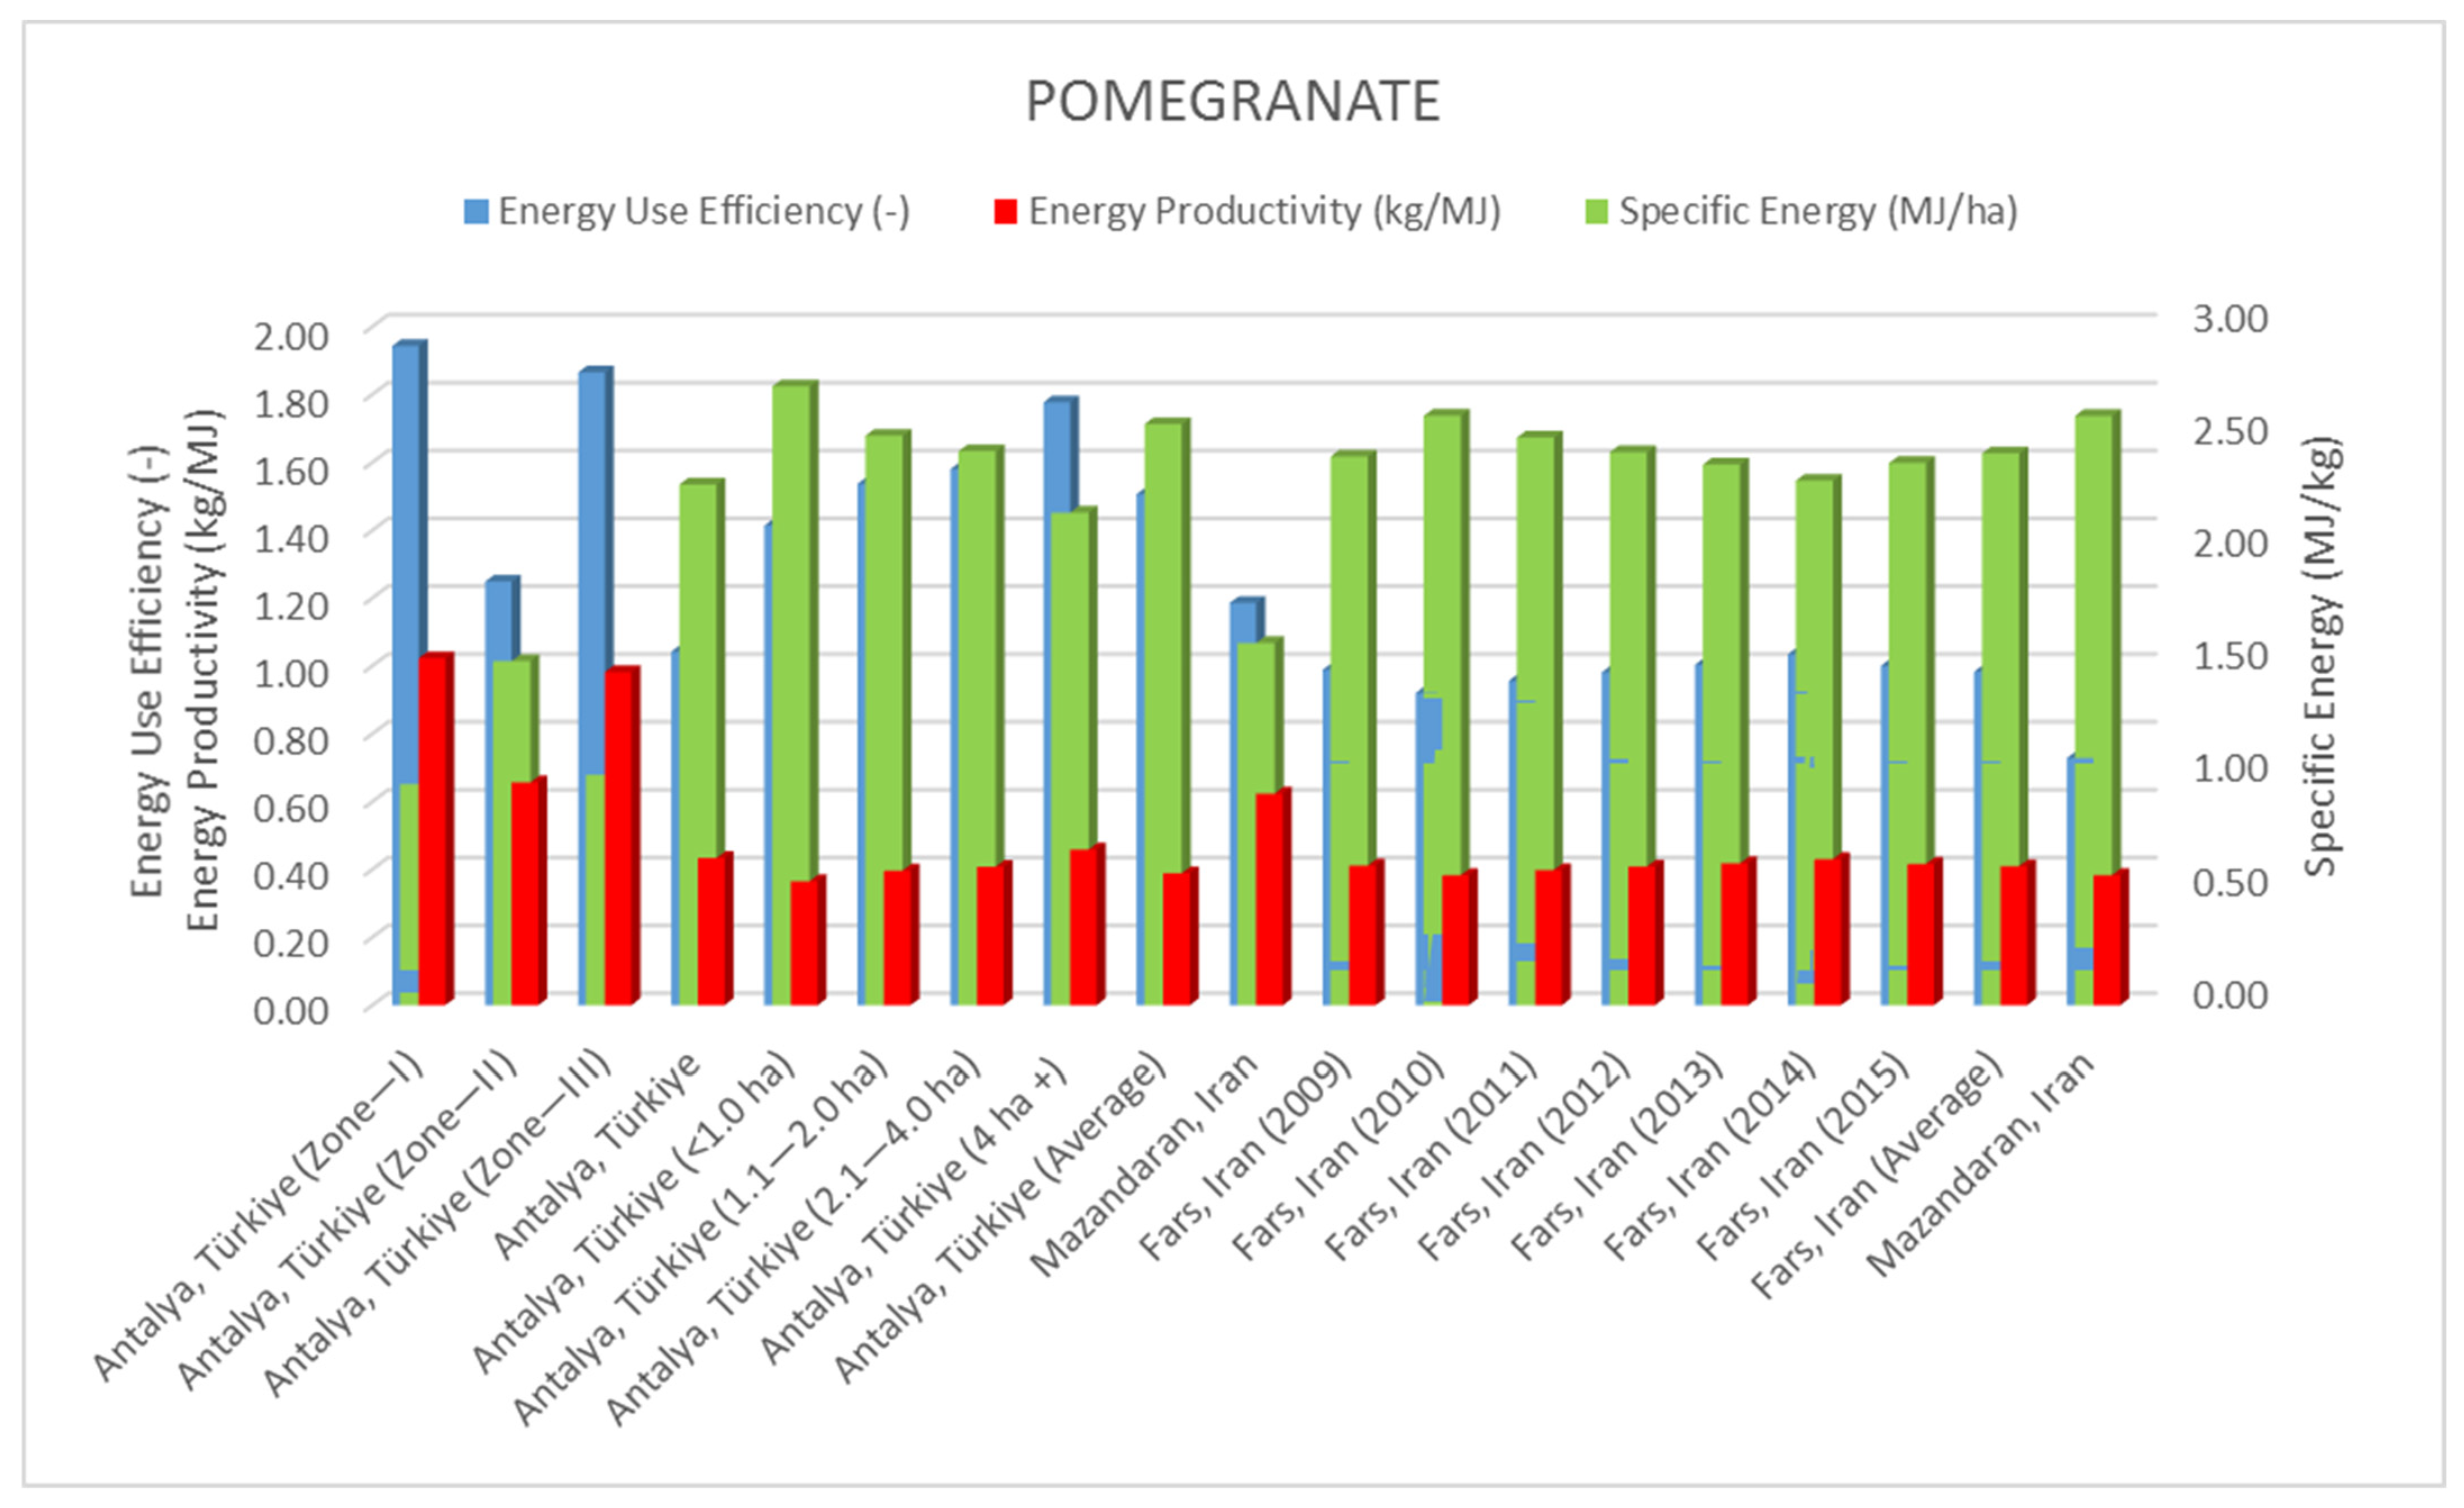
3.3. Pomegranates
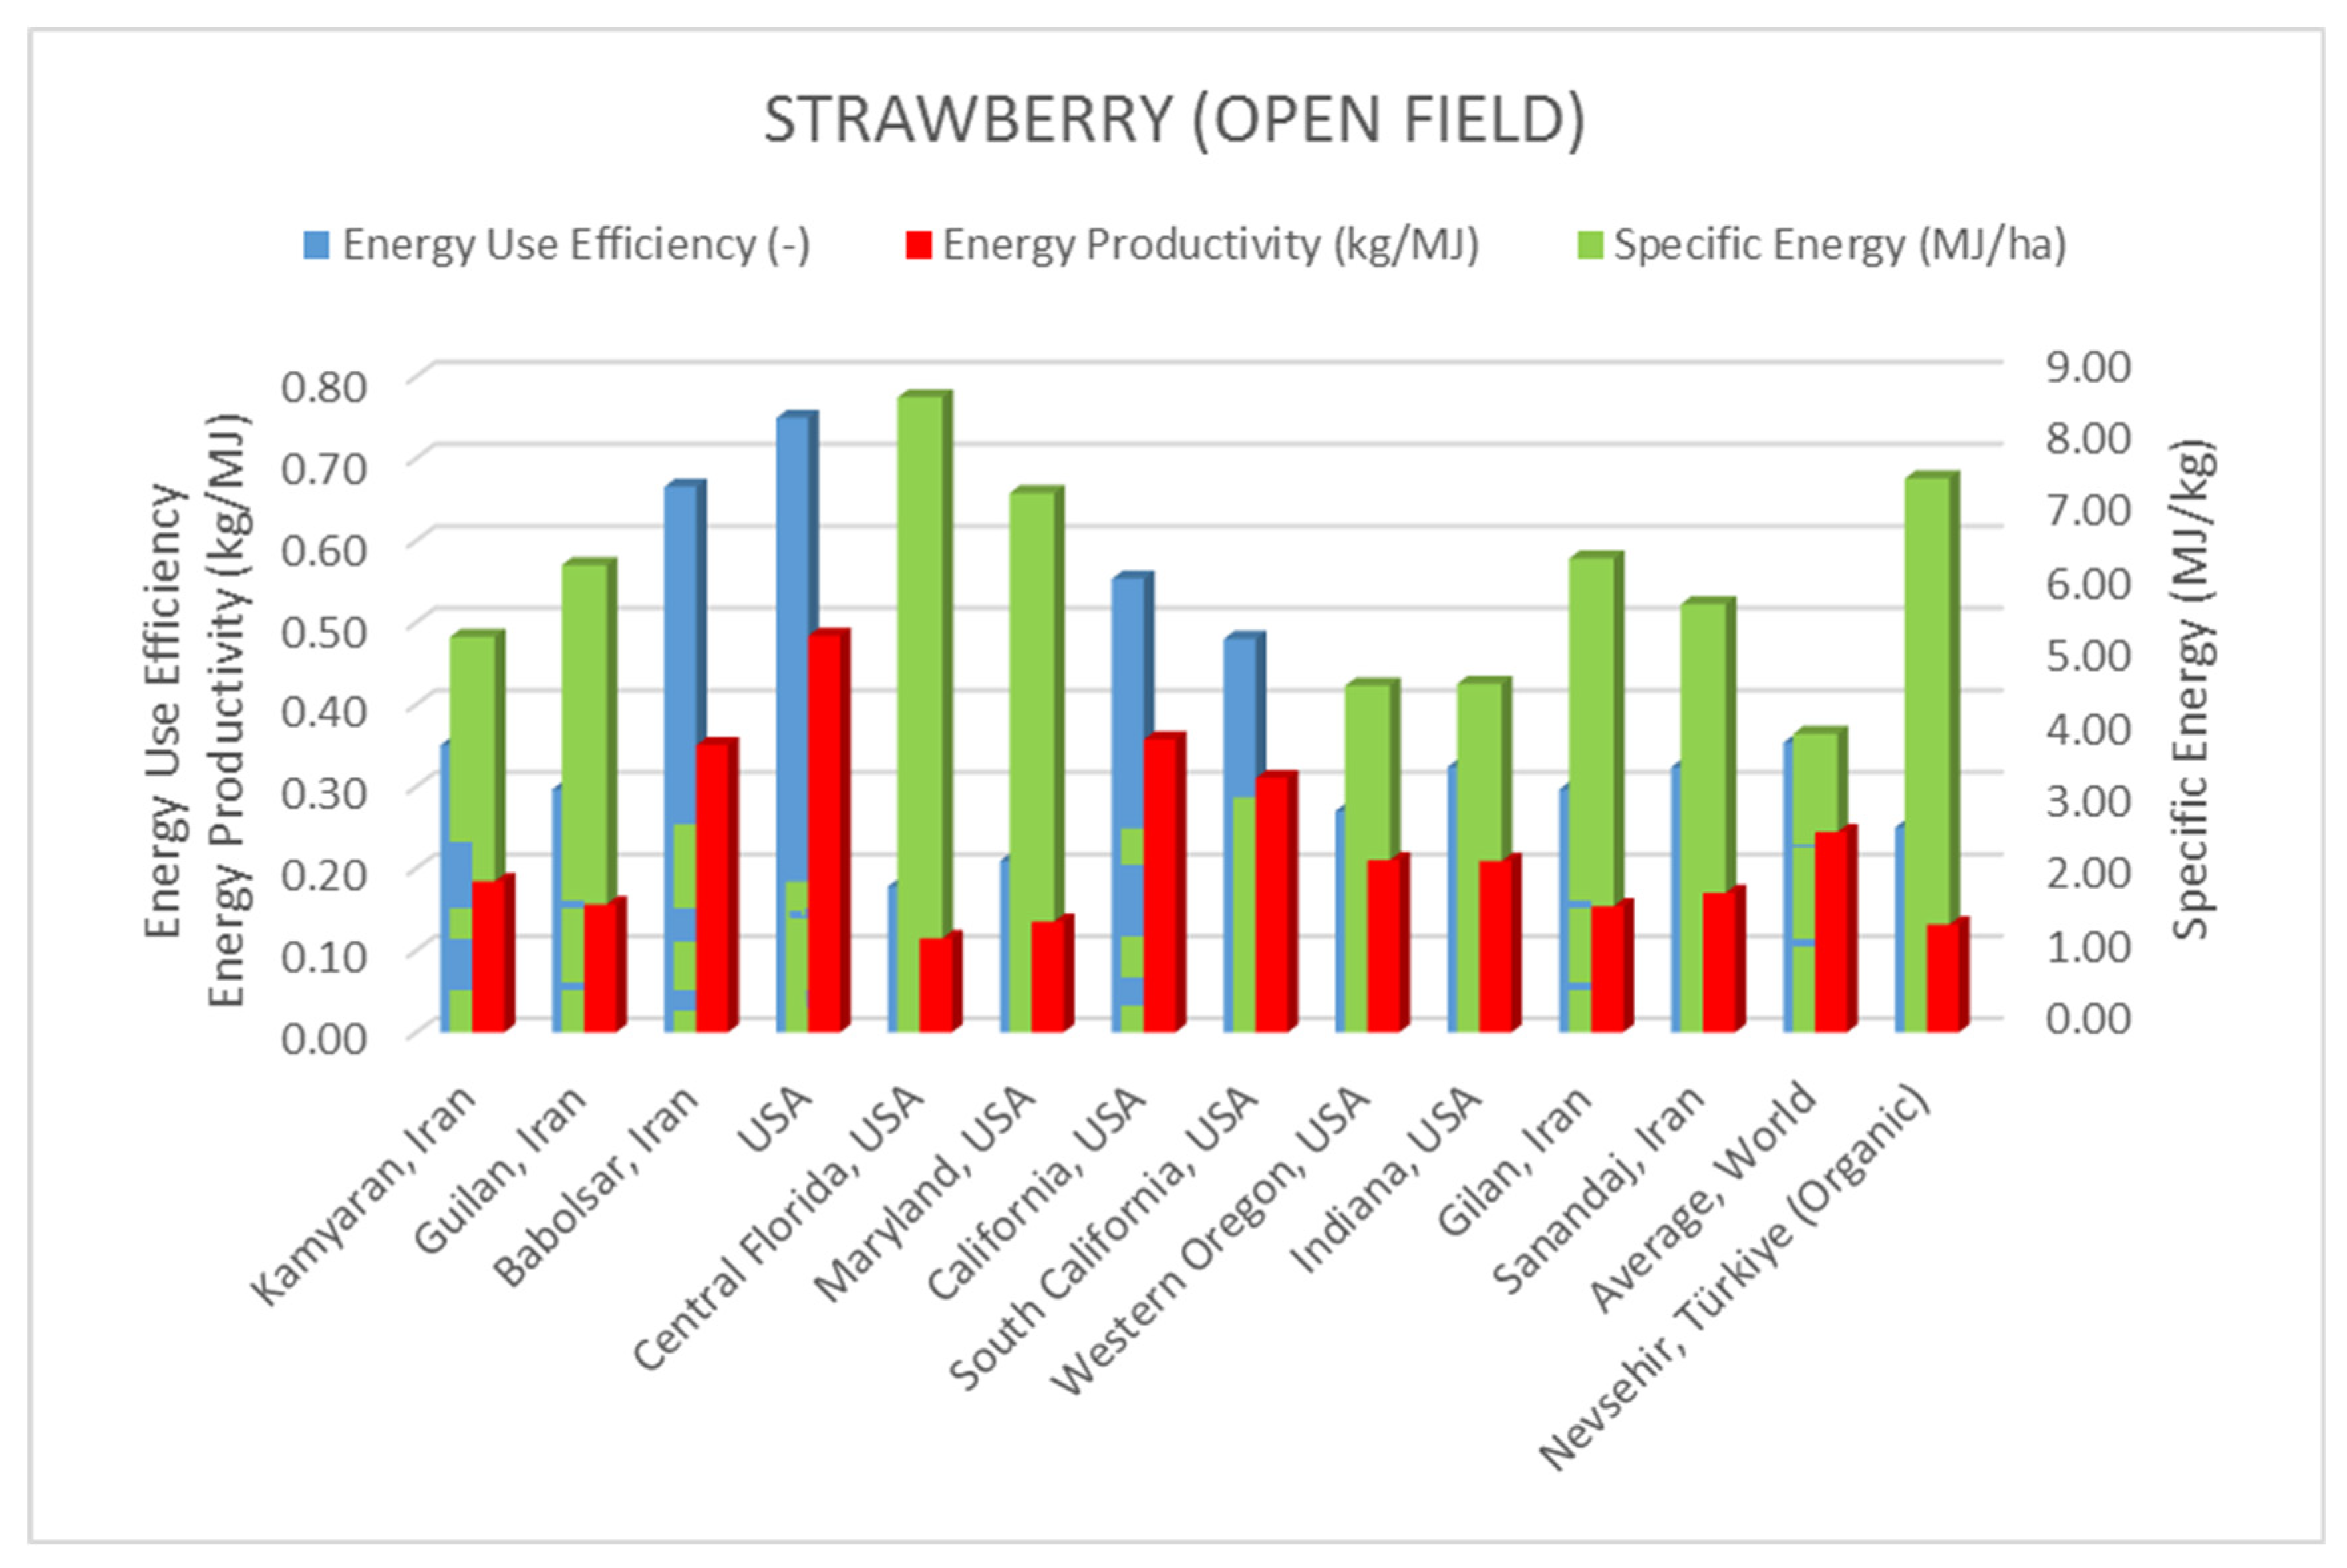
3.4. Strawberries
4. Conclusions
Author Contributions
Funding
Institutional Review Board Statement
Informed Consent Statement
Data Availability Statement
Conflicts of Interest
References
- Ağaoğlu, Y.S.; Çelik, H.; Çelik, M.; Fidan, Y.; Gülşen, Y.; Günay, A.; Halloran, N.; Köksal, A.İ.; Yanmaz, R. Genel Bahçe Bitkileri; T.C. A.Ü.Z.F. Eğitim, Araştırma ve Geliştirme Vakfı Yayınları No. 4: Ankara, Turkey, 1997. (In Turkish) [Google Scholar]
- Kılıç, O.; Eryılmaz, G.A.; Çakır, S. Konvansiyonel Meyve Yetiştiriciliği Yapan Üreticilerin Organik Tarım ve İyi Tarım Uygulamaları Konusundaki Görüşleri: Zonguldak İli Örneği, Türkiye. Türkiye Tarımsal Araştırmalar Derg. 2021, 8, 109–115. (In Turkish) [Google Scholar] [CrossRef]
- FAO. Dünyada ve Türkiye’de Narenciye Üretim Potansiyeli ve Verim Miktarları; Food and Agriculture Organization of the United Nations: Rome, Italy, 2022. (In Turkish) [Google Scholar]
- TUİK. 2023. Available online: https://www.tuik.gov.tr/ (accessed on 10 January 2024). (In Turkish)
- Öztürk, H.H. Bitkisel Üretimde Enerji Yönetimi; HASAD Yayıncılık: İstanbul, Turkey, 2021. (In Turkish) [Google Scholar]
- Ekinci, K.; Demircan, V.; Atasay, A.; Karamursel, D.; Sarica, D. Energy, economic and environmental analysis of organic and conventional apple production in Türkiye. Erwerbs-Obstbau 2020, 62, 1–12. [Google Scholar] [CrossRef]
- Akbolat, D.; Ekinci, K.; Demircan, V. Energy input-output and economic analysis of rose production in Türkiye. J. Agron. 2006, 5, 570–576. [Google Scholar]
- Pimentel, D. Handbook of Energy Utilization in Agriculture; CRC Press: Boca Raton, FL, USA, 1980; 487p, ISBN 9781315893419. [Google Scholar]
- Pervanchon, F.; Bockstaller, C.; Girardin, P. Assessment of energy use in arable farming systems by means of an agro-ecological indicator: The energy indicator. Agric. Syst. 2002, 72, 149–172. [Google Scholar] [CrossRef]
- Mandal, K.G.; Saha, K.P.; Ghosh, P.K.; Hati, K.M.; Bandyopadhyay, K.K. Bioenergy and economic analysis of soybean-based crop production systems in central India. Biomass Bioenergy 2002, 23, 337–345. [Google Scholar] [CrossRef]
- Taki, M.; Ajabshirchi, Y.; Ghasemi, H.M. Energy consumption input and eoutput relationship and cost analysis for greenhouse. Am. J. Exp. Agric. 2012, 2, 485–501. [Google Scholar]
- Taki, M.; Yildizhan, H. Evaluation the sustainable energy applications for fruit and vegetable productions processes; case study: Greenhouse cucumber production. J. Clean. Prod. 2018, 199, 164–172. [Google Scholar] [CrossRef]
- Barut, Z.B.; Ertekin, C.; Karaagac, H.A. Tillage effects on energy use for corn silage in Mediterranean Coastal of Türkiye. Energy 2011, 36, 5466–5475. [Google Scholar] [CrossRef]
- Demircan, V.; Ekinci, K.; Keener, H.M.; Akbolat, D.; Ekinci, C. Energy and economic analysis of sweet cherry production in Türkiye: A case study from Isparta province. Energy Convers. Manag. 2006, 47, 1761–1769. [Google Scholar] [CrossRef]
- Hatirli, S.A.; Ozkan, B.; Fert, C. An econometric analysis of energy input-output in Turkish agriculture. Renew. Sustain. Energy Rev. 2005, 9, 608–623. [Google Scholar] [CrossRef]
- Ertekin, C.; Canakci, M.; Kulcu, R.; Yaldız, O. Energy use pattern of some tuber plants cultivation over Turkey. In Proceedings of the XXXIV CIOSTA CIGR V Conference 2011, Efficient and Safe Production Processes in Sustainable Agriculture and Forestry, Vienna, Austria, 29 June–1 July 2011. [Google Scholar]
- Wang, Y.; Ma, Q.; Li, Y.; Sun, T.; Jin, H.; Zhao, C.; Milne, E.; Easter, M.; Paustian, K.; Yong, H.; et al. Energy Consumption, Carbon Emissions and Global Warming Potential of Wolfberry Production in Jingtai Oasis, Gansu Province, China. Environ. Manag. 2019, 64, 772–782. [Google Scholar] [CrossRef]
- Oguz, H.I.; Gokdogan, O.; Baran, M.F. Determination of energy balance in organic wolfberry (Lycium barbarum L.) production in Türkiye. Erwerbs-Obstbau 2019, 61, 61–66. [Google Scholar] [CrossRef]
- Gözener, B.; Kaya, Y.; Sayılı, M. Erzincan ili Üzümlü ilçesinde cimin üzümü üretimi ve pazarlama durumu. Gaziosmanpaşa Bilimsel Araştırma Derg. 2014, 9, 74–80. (In Turkish) [Google Scholar]
- Ataseven, Z.Y. Tarım Ürünleri Piyasaları: Üzüm; Tarımsal Ekonomi ve Politika Geliştirme Enstitüsü: Ankara, Turkey, 2021. (In Turkish) [Google Scholar]
- Ozkan, B.; Fert, C.; Karadeniz, C.F. Energy and cost analysis for greenhouse and open-field grape production. Energy 2007, 32, 1500–1504. [Google Scholar] [CrossRef]
- Simsek, E.; Oguz, H.I.; Gokdogan, O. Energy Use Efficiency of Grape Production in Vineyard Areas of Nevsehir Province in Türkiye. Erwerbs-Obstbau 2022, 64, 113–118. [Google Scholar] [CrossRef]
- Gundogmus, E.; Bayramoglu, Z. Energy Input Use on Organic Farming: A Comparative Analysis on Organic versus Conventional Farms in Türkiye. J. Agron. 2006, 5, 16–22. [Google Scholar] [CrossRef]
- Akdemir, S. Determination of Energy Balance in Grape Production for Wine in Thrace Region. Erwerbs-Obstbau 2022, 64, 103–111. [Google Scholar] [CrossRef]
- Kocturk, O.M.; Engindeniz, S. Energy and cost analysis of sultana grape growing: A case study of Manisa, west Türkiye. Afr. J. Agric. Res. 2009, 4, 938–943. [Google Scholar]
- Uzun, T.; Baran, M.F. Energy Input–Output Analysis of Grape (Vitis vinifera L.) Production in Türkiye, A Case Study from Siirt Province. Erwerbs-Obstbau 2022, 64, 95–102. [Google Scholar] [CrossRef]
- Baran, M.F.; Lule, F.; Gokdogan, O. Energy input-output analysis of organic grape production: A case study from Adiyaman Province. Erwerbs-Obstbau 2017, 59, 275–279. [Google Scholar] [CrossRef]
- Tian, D.; Wang, J.; Feng, J. Analysis of energy consumption for protected grape production system in China. Adv. Mater. Res. 2015, 1073–1076, 2468–2472. [Google Scholar] [CrossRef]
- Kamari, F.; Ghamary, B.; Azizpanah, A. Determination and Evaluation of energy consumption for grape production in Eyvan county (Ilam province). Agric. Eng. Int. CIGR J. 2021, 23, 173. [Google Scholar]
- Abdelkader, M.; Zargar, M.; Murtazova, K.M.S.; Nakhaev, M.R. Life Cycle Assessment of the Cultivation Processes for the Main Vegetable Crops in Southern Egypt. Agronomy 2022, 12, 1527. [Google Scholar] [CrossRef]
- Rasouli, M.; Namdari, M.; Mousavi-Avval, S.H. Modeling and analysis of energy efficiency in grape production of Iran. J. Agric. Technol. 2014, 10, 517–532. [Google Scholar]
- Khoshroo, A.R.; Emrouznejad, A.; Ghaffarizadeh, A.; Kasraei, M.; Omid, M. Sensitivity analysis of energy inputs in crop production using artificial neural networks. J. Clean. Prod. 2018, 197, 992–998. [Google Scholar] [CrossRef]
- Mohseni, P.; Borghei, A.M.; Khanali, M. Coupled life cycle assessment and data envelopment analysis for mitigation of environmental impacts and enhancement of energy efficiency in grape production. J. Clean. Prod. 2018, 197, 937–947. [Google Scholar] [CrossRef]
- Mardani, A.; Taghavifar, H. An overview on energy inputs and environmental emissions of grape production in West Azerbayjan of İran. Renew. Sustain. Energy Rev. 2016, 54, 918–924. [Google Scholar] [CrossRef]
- Rahmani, A.; Parashkoohi, M.G.; Zamani, D.M. Sustainability of environmental impacts and life cycle energy and economic analysis for different methods of grape and olive production. Energy Rep. 2022, 8, 2778–2792. [Google Scholar] [CrossRef]
- Alizadeh, H.H.A.; Taromi, K. An Investigation of Energy Use Efficiency and CO2 Emissions for Grape Production in Zanjan Province of Iran. Int. J. Adv. Biol. Biom. Res. 2014, 2, 2249–2258. [Google Scholar]
- Hamedani, S.R.; Keyhani, A.R.; Alimardani, R. Energy use patterns and econometric models of grape production in Hamadan province of Iran. Energy 2011, 36, 6345–6351. [Google Scholar] [CrossRef]
- Karimi, M.; Moghaddam, H. On-farm energy flow in grape orchards. J. Saudi Soc. Agric. Sci. 2018, 17, 191–194. [Google Scholar] [CrossRef]
- Sattari-Yuzbashkandi, S.; Khalilian, S.; Mortazavi, S.A. Energy efficiency for open-field grape production in Iran using Data Envelopment Analysis (DEA) approach. Int. J. Farming Allied Sci. 2014, 3–6, 637–646. [Google Scholar]
- Elsoragaby, S.; Yahya, A.; Mahadi, M.R.; Nawi, N.M.; Mairghany, M. Energy utilization in major crop cultivation. Energy 2019, 173, 1285–1303. [Google Scholar] [CrossRef]
- Şahin, A. Nar Yetiştiriciliği. T.C.; Tarım ve Orman Bakanlığı Tarımsal Araştırmalar ve Politikalar Genel Müdürlüğü Batı Akdeniz Tarımsal Araştırma Enstitüsü: Antalya, Turkey, 2020. Available online: https://arastirma.tarimorman.gov.tr/batem/Belgeler/Kutuphane/Teknik%20Bilgiler/Nar%20Yeti%C5%9Ftiricili%C4%9Fi.pdf (accessed on 10 January 2024). (In Turkish)
- Canakci, M. Energy use pattern and economic analyses of pomegranate cultivation in Türkiye. Afr. J. Agric. Res. 2010, 5, 491–499. [Google Scholar]
- Troujeni, M.E.; Khojastehpour, M.; Vahedi, A.; Emadi, B. Sensitivity analysis of energy inputs and economic evaluation of pomegranate production in Iran. Inf. Process. Agric. 2018, 5, 114–123. [Google Scholar] [CrossRef]
- Houshyar, E.; Mahmoodi-Eshkaftaki, M.; Azadi, H. Impacts of technological change on energy use efficiency and GHG mitigation of pomegranate: Application of dynamic data envelopment analysis models. J. Clean. Prod. 2017, 162, 1180–1191. [Google Scholar] [CrossRef]
- Nouri-Khjebelagh, R.; Sefidkouhi, M.A.G.; Khoshravesh, M. Evaluation of energy indices and greenhouse gas emissions in major horticultural crops and paddy crops in Tajan plain. Appl. Water Sci. 2023, 13, 39. [Google Scholar] [CrossRef]
- Ozalp, A.; Yilmaz, S.; Ertekin, C.; Yilmaz, I. Energy Analysis and Emissions of Greenhouse Gases of Pomegranate Production in Antalya Province of Türkiye. Erwerbs-Obstbau 2018, 60, 321–329. [Google Scholar] [CrossRef]
- Akcaoz, H.; Ozcatalbas, O.; Kizilay, H. Analysis of energy use for pomegranate production in Türkiye. J. Food Agric. Environ. 2009, 7, 475–480. [Google Scholar]
- Salami, P.; Ahmadi, H.; Keyhani, A. Estimating the Energy İndices and Profitability of Strawberry Production in Kamyaran Zone of İran. Energy Res. J. 2010, 1, 32–35. [Google Scholar] [CrossRef]
- Salami, P.; Ahmadi, H.; Keyhani, A.R. Energy use and economic analysis of strawberry production in Sanandaj zone of Iran. Biotechnol. Agron. Soc. Environ. 2010, 14, 653–658. [Google Scholar]
- Baran, M.F.; Oguz, H.I.; Gokdogan, O. Determination of energy input-output analysis in organic strawberry production. Fresenius Environ. Bull. 2017, 26, 2076–2081. [Google Scholar]
- Khoshnevisan, B.; Rafiee, S.; Omid, M.; Mousazadeh, H. Developing an Artificial Neural Networks Model for Predicting Output Energy and GHG Emission of Strawberry Production. İnt. J. Appl. Oper. Res. 2013, 3, 43–54. [Google Scholar]
- Loghmanpor, R.; Tabatabaekoloor, R.; Akram, A. Input-Output Energy and Economic Analysis of Strawberry Production in Iran. Am. J. Eng. Res. AJER 2013, 2, 173–177. [Google Scholar]
- Khoshnevisan, B.; Shariati, H.M.; Rafiee, S.; Mousazadeh, H. Comparison of energy consumption and GHG emissions of open field and greenhouse strawberry production. Renew. Sustain. Energy Rev. 2014, 29, 316–324. [Google Scholar] [CrossRef]


| Direct Energy | Indirect Energy | ||
| Human labor Animal Water | Diesel/oil Electricity | Biochemicals FYM Chemical fertilizers Organic chemicals Infrastructure | Organic fertilizers Farm machinery Seed Transportation |
| Renewable Energy | Non-Renewable Energy | ||
| Human Labor Animal Water FYM | Seed Organic fertilizers Organic chemicals | Diesel/oil Electricity Farm machinery Infrastructure | Biochemicals Chemical fertilizers Transportation |
| Commercial Energy | Non-Commercial Energy | ||
| Diesel/oil Electricity Biochemicals Farm machinery Transportation | Seed Chemical fertilizers Organic fertilizers Organic chemicals Infrastructure | Human labor Animal | FYM Water |
Disclaimer/Publisher’s Note: The statements, opinions and data contained in all publications are solely those of the individual author(s) and contributor(s) and not of MDPI and/or the editor(s). MDPI and/or the editor(s) disclaim responsibility for any injury to people or property resulting from any ideas, methods, instructions or products referred to in the content. |
© 2024 by the authors. Licensee MDPI, Basel, Switzerland. This article is an open access article distributed under the terms and conditions of the Creative Commons Attribution (CC BY) license (https://creativecommons.org/licenses/by/4.0/).
Share and Cite
Ertekin, C.; Comart, A.; Ekinci, K. Energy Analysis for Global Berry Fruit Production. Sustainability 2024, 16, 2520. https://doi.org/10.3390/su16062520
Ertekin C, Comart A, Ekinci K. Energy Analysis for Global Berry Fruit Production. Sustainability. 2024; 16(6):2520. https://doi.org/10.3390/su16062520
Chicago/Turabian StyleErtekin, Can, Adem Comart, and Kamil Ekinci. 2024. "Energy Analysis for Global Berry Fruit Production" Sustainability 16, no. 6: 2520. https://doi.org/10.3390/su16062520
APA StyleErtekin, C., Comart, A., & Ekinci, K. (2024). Energy Analysis for Global Berry Fruit Production. Sustainability, 16(6), 2520. https://doi.org/10.3390/su16062520