

Zero-Energy Purification of Ambient Particulate Matter Using a Novel Double-Skin Façade System Integrated with Porous Materials


Abstract
1. Introduction
2. Methodology
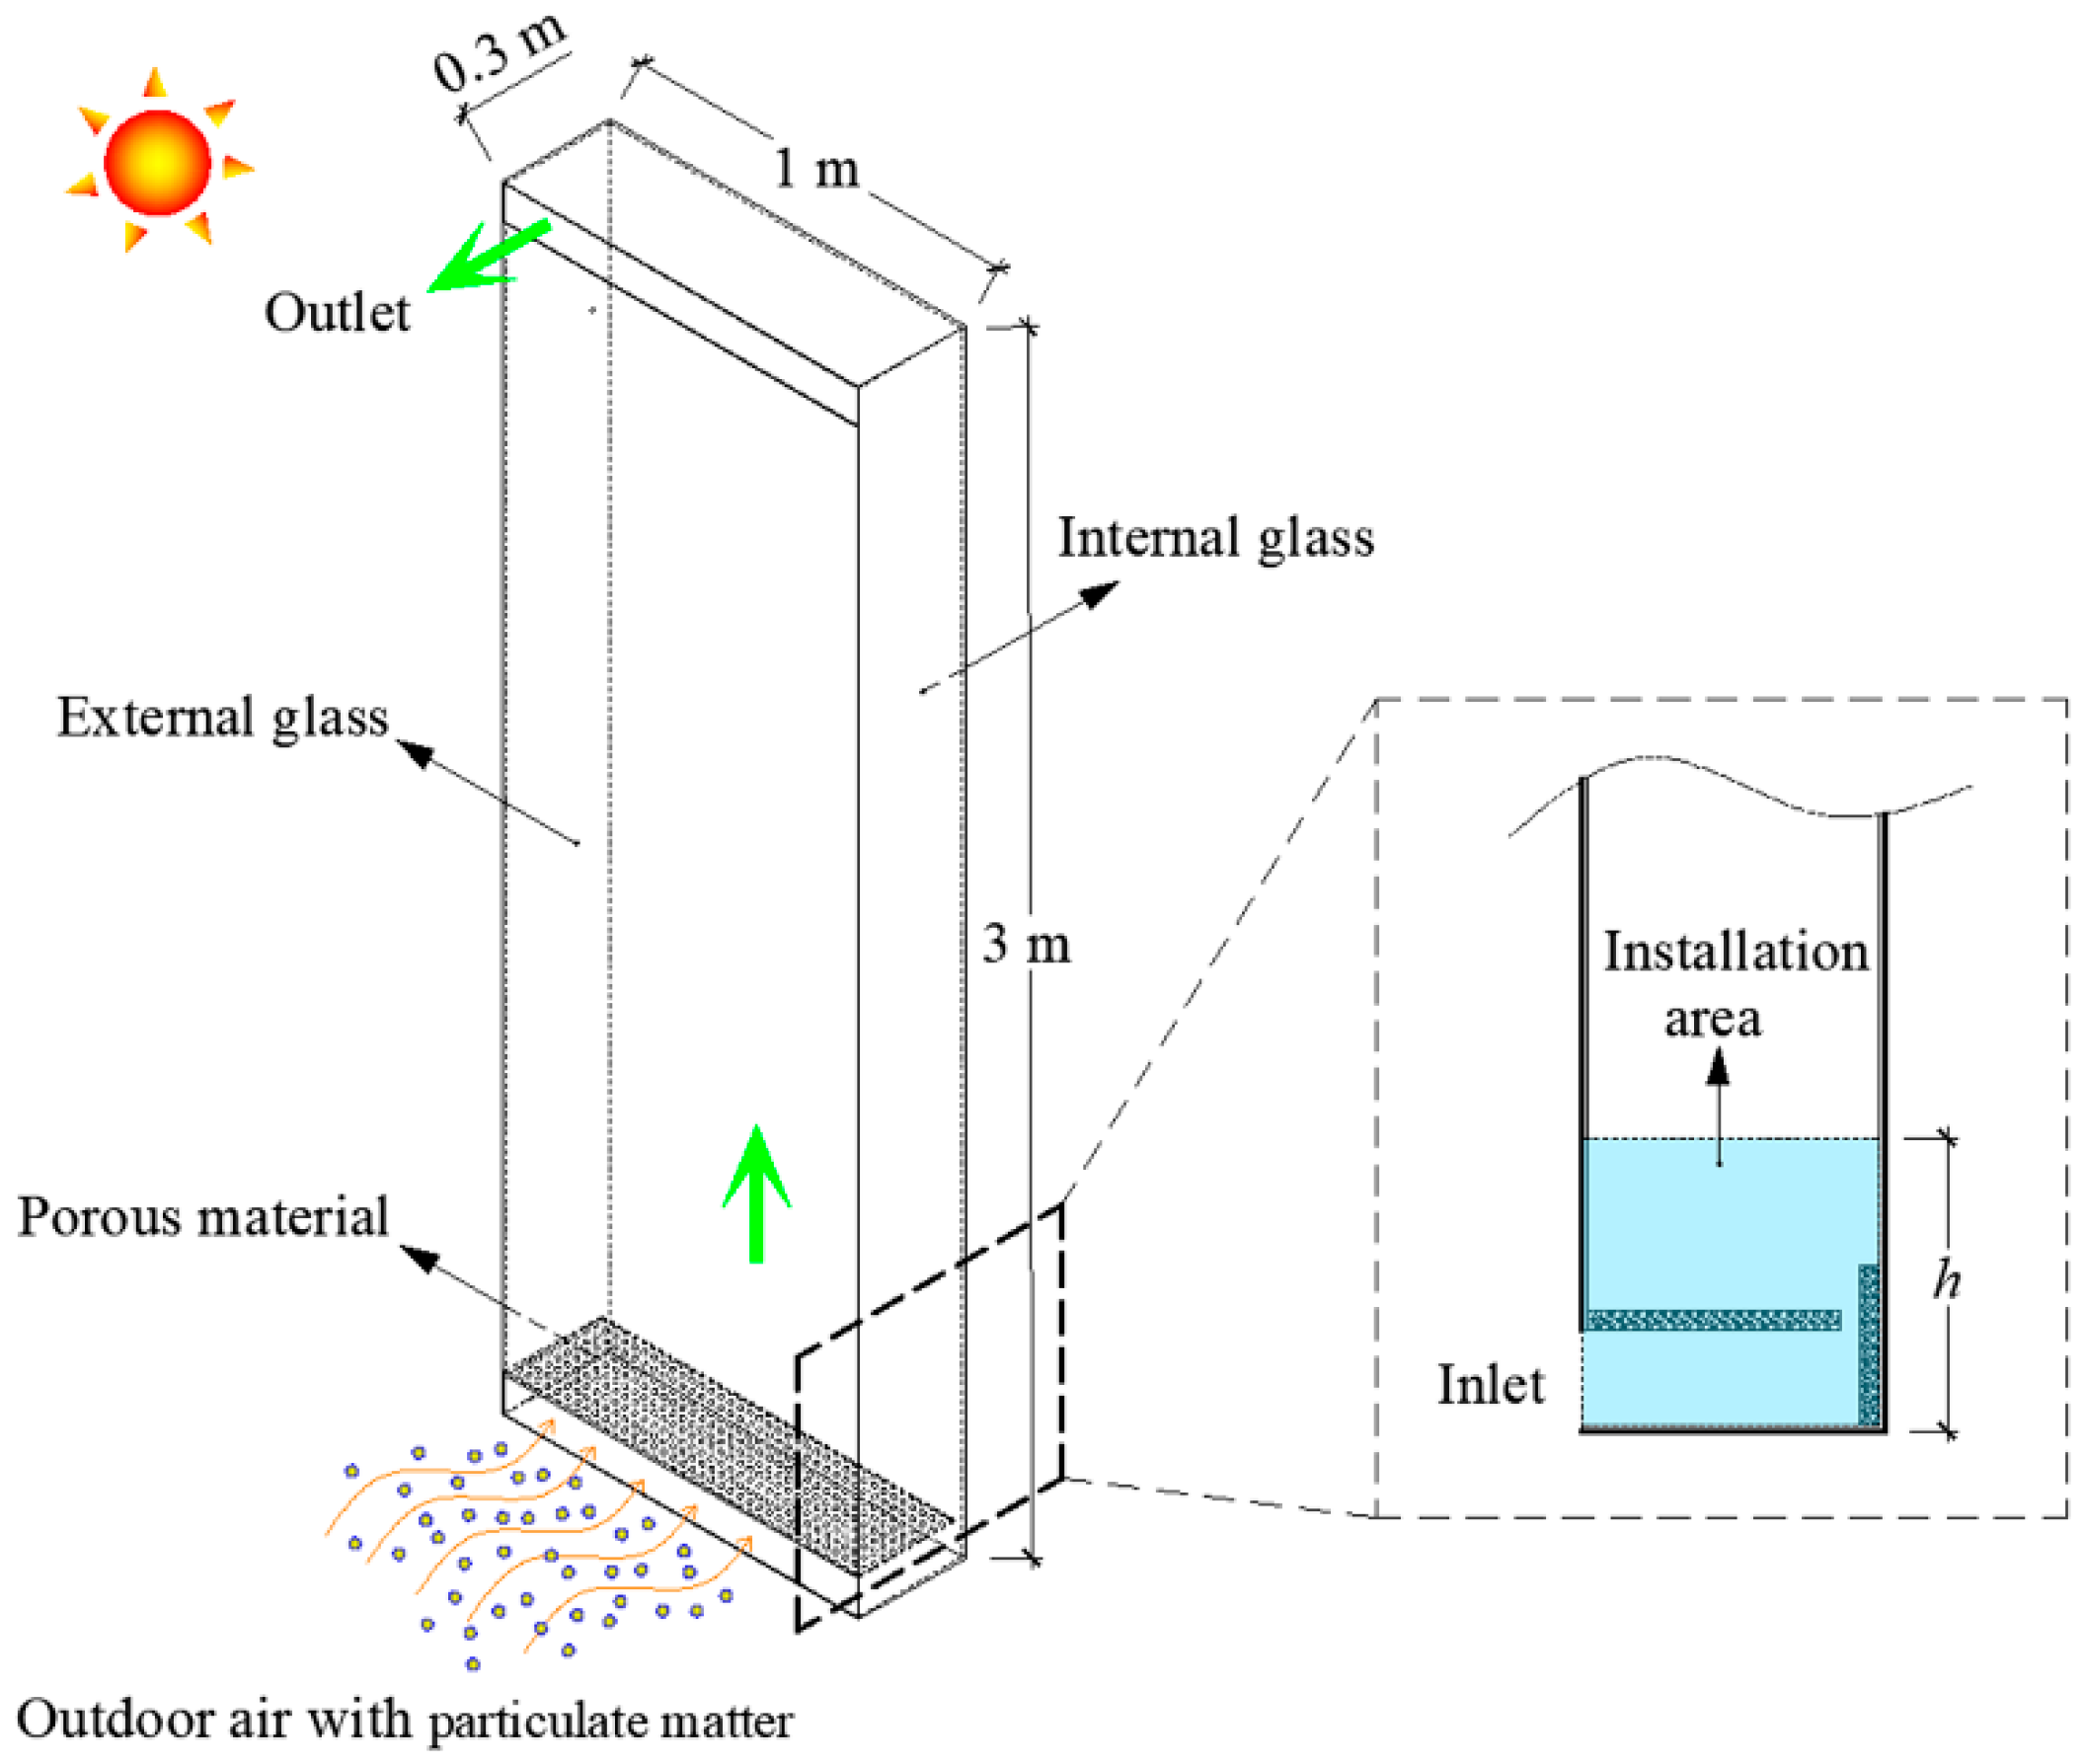
2.1. Physical Model
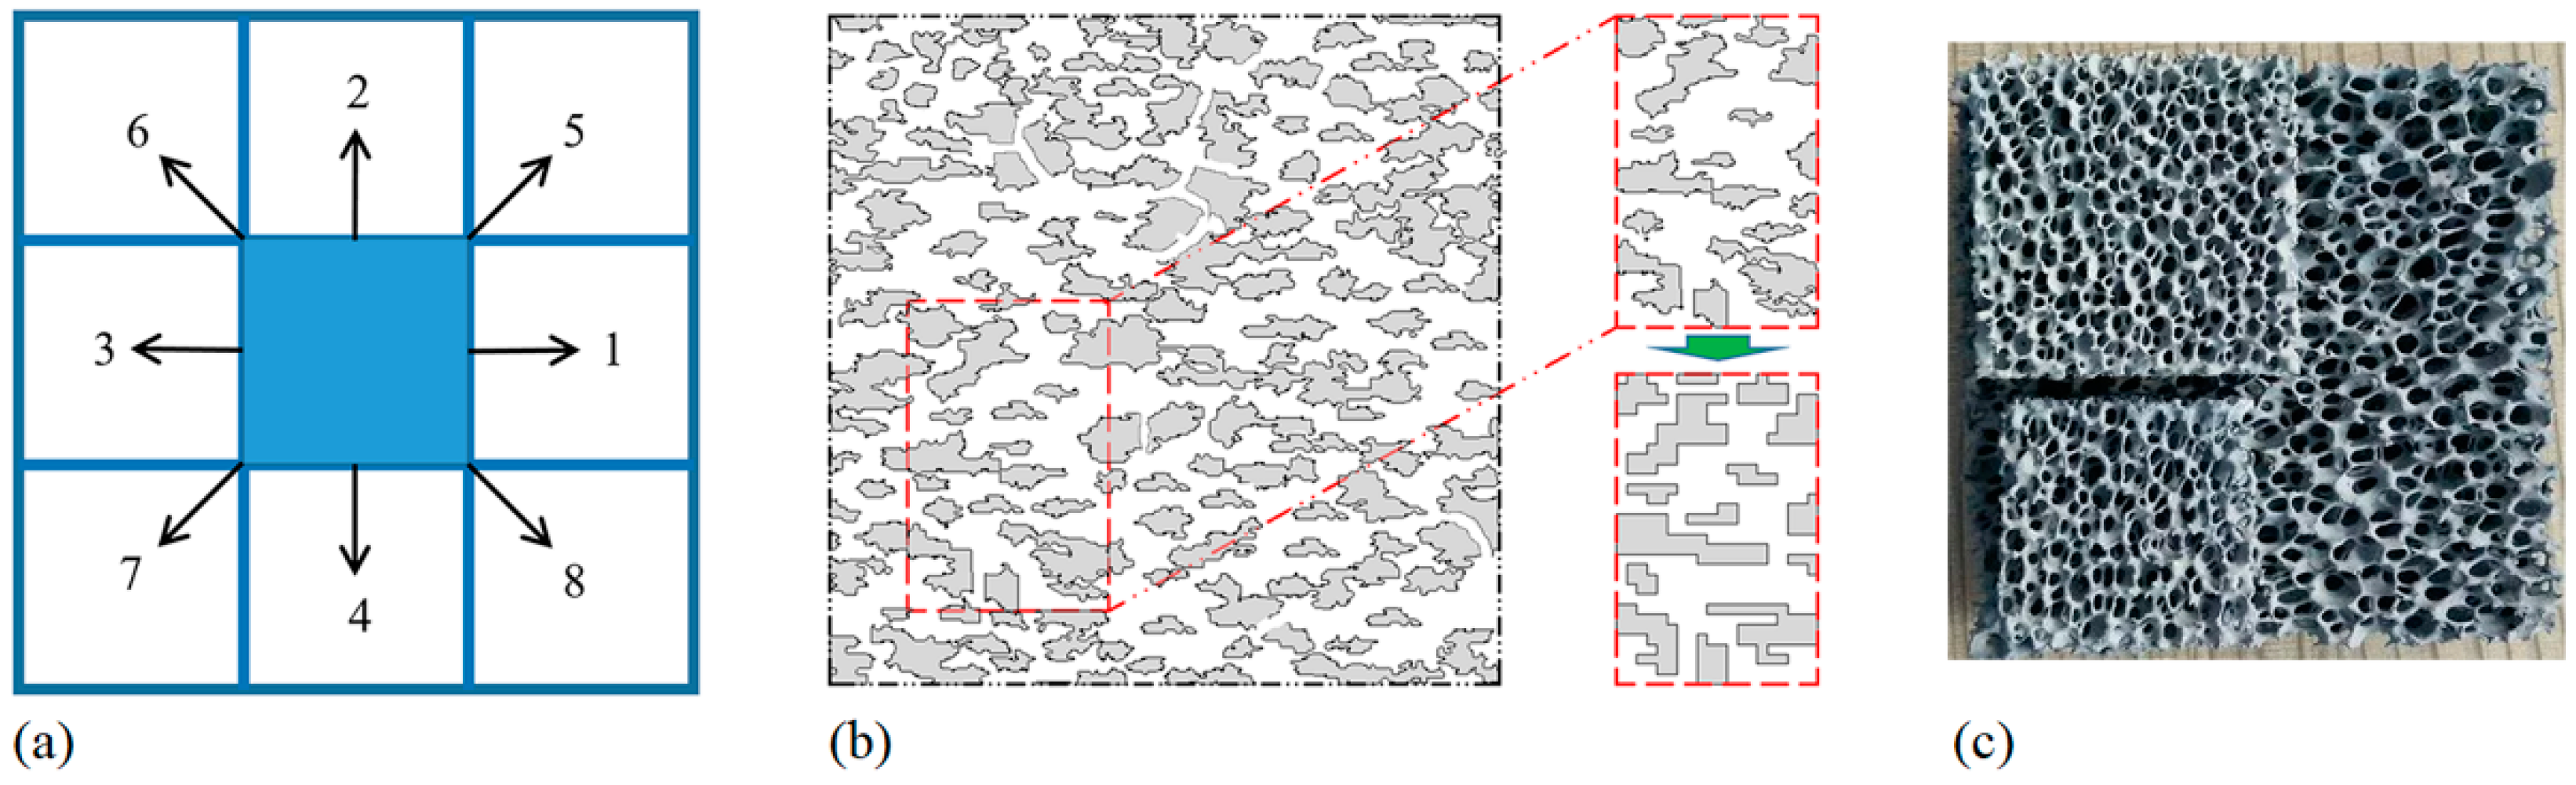
2.2. Numerical Generation of Stochastic Porous Material
2.3. Mathematical Method
2.4. Grid Sensitivity Analysis and Verification of the Numerical Model
3. Case Study Description
4. Results and Discussion
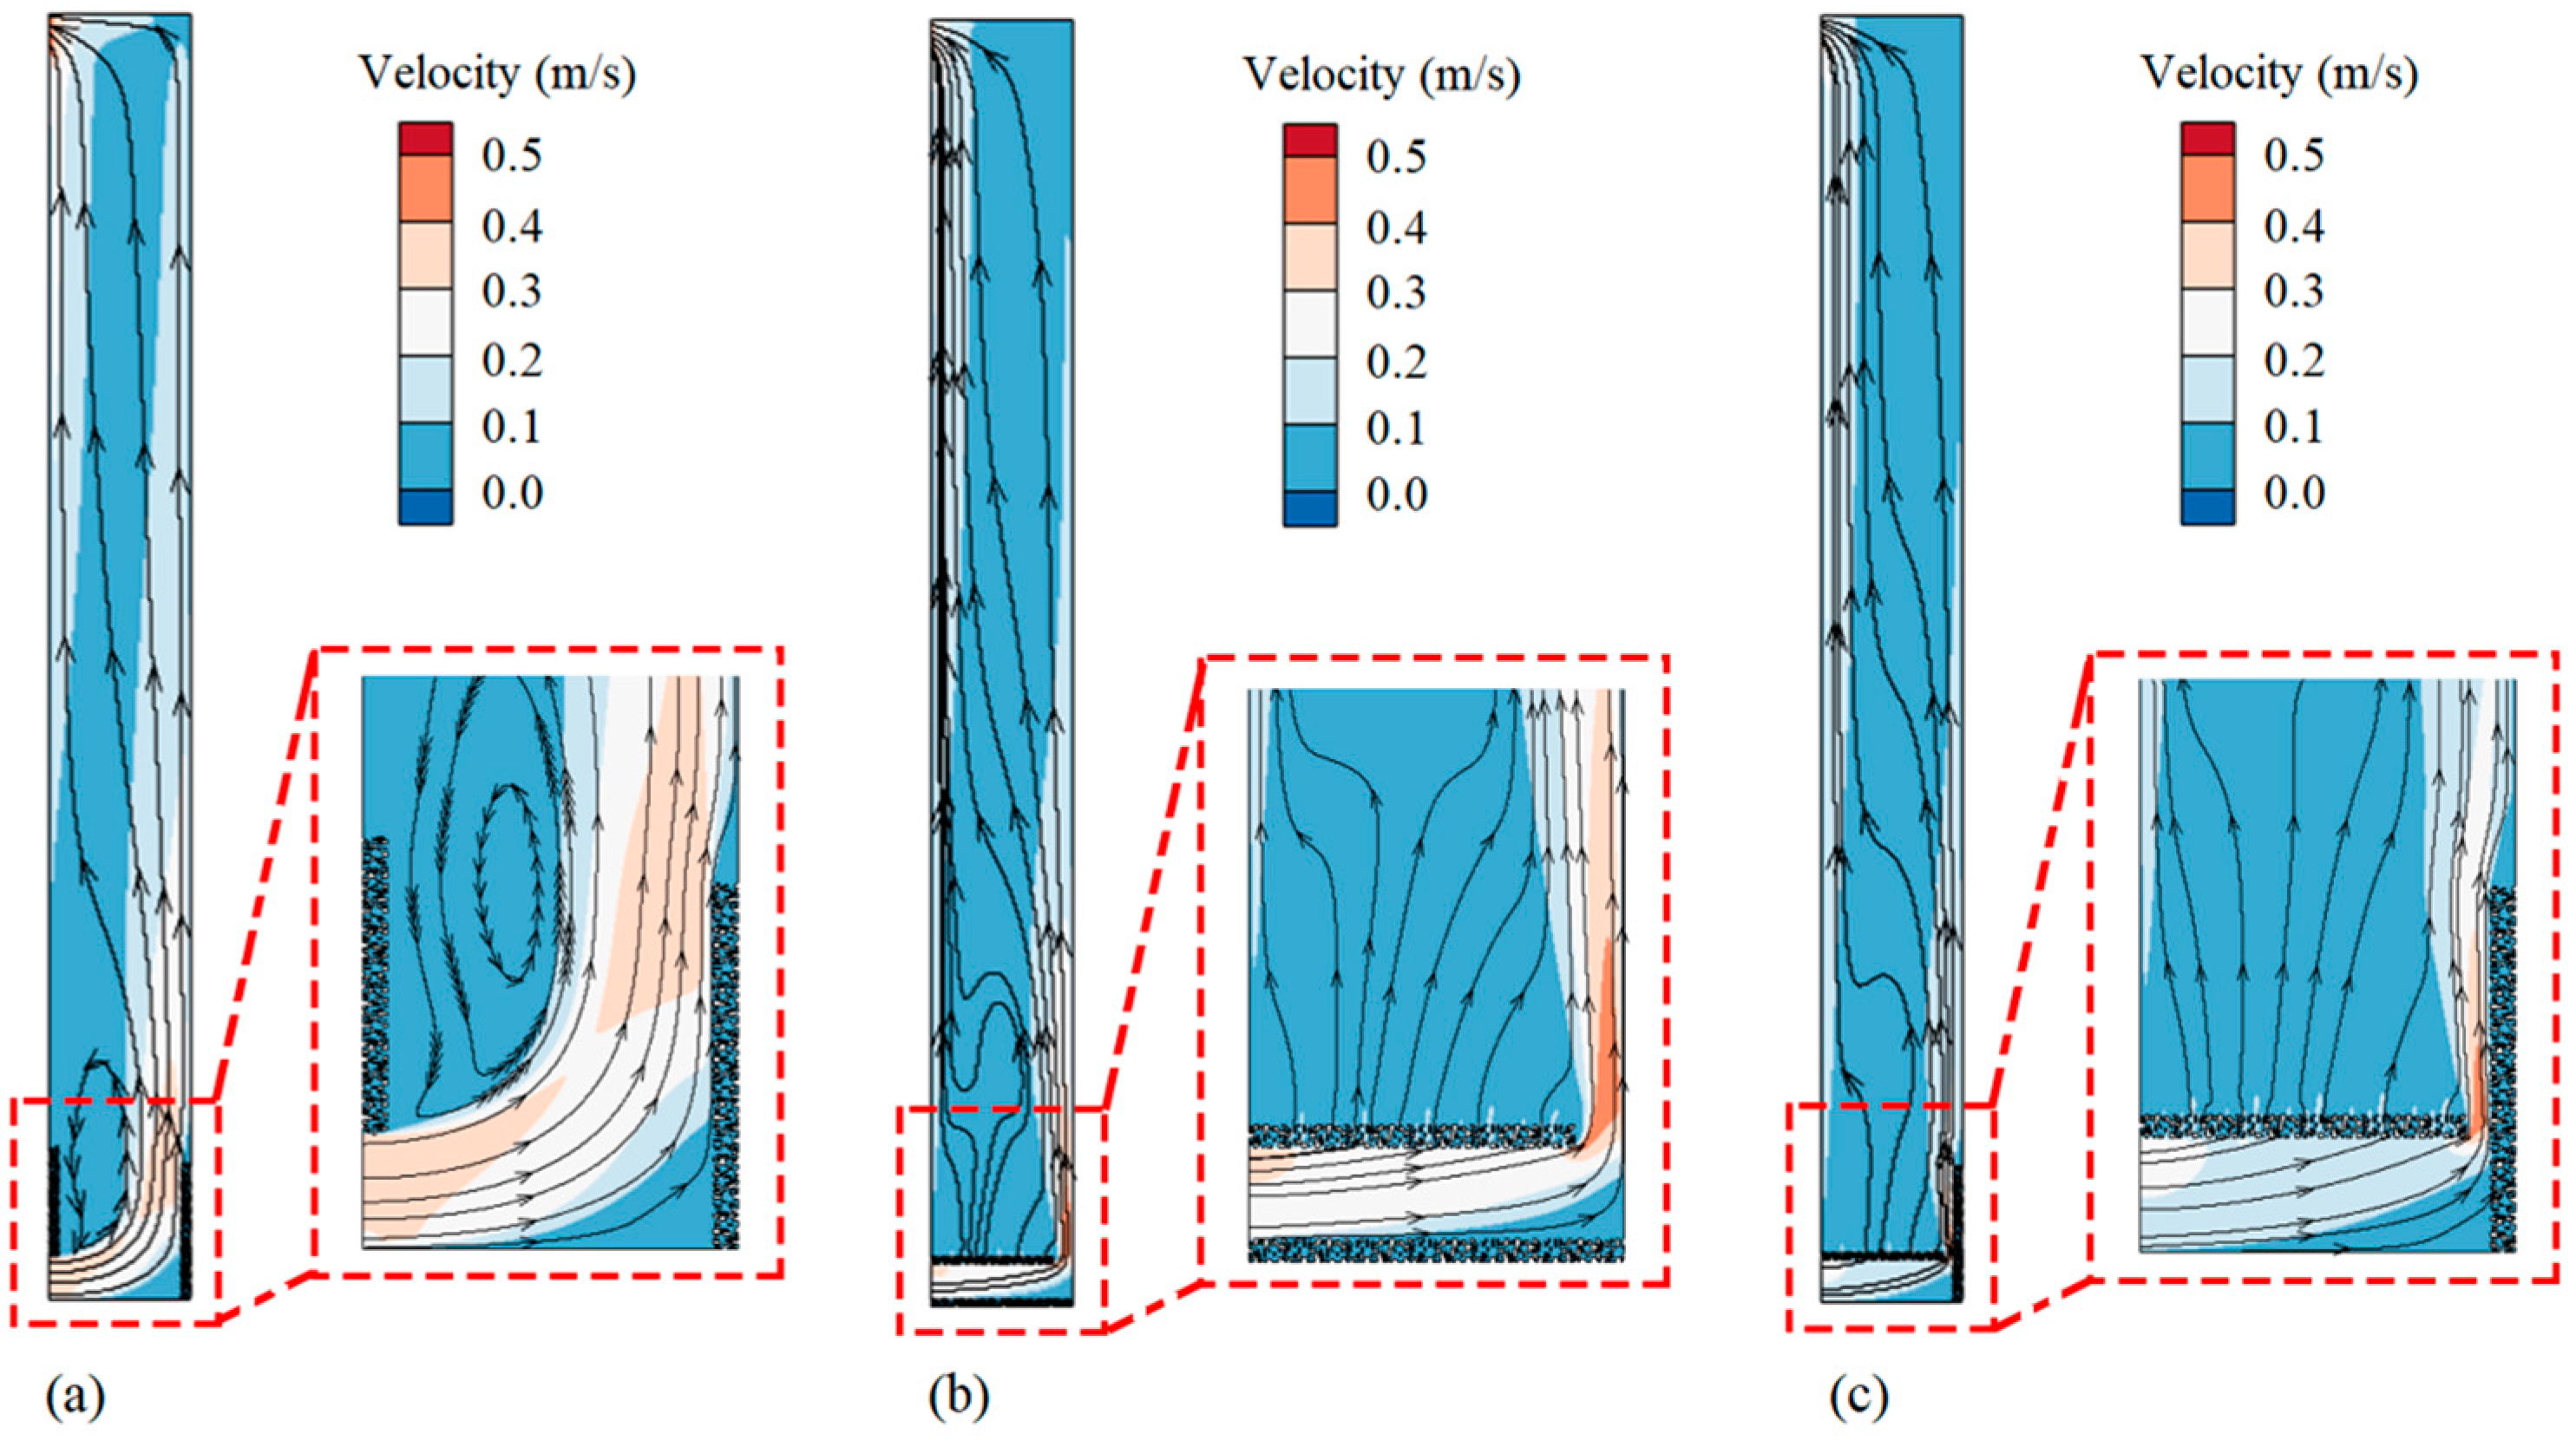
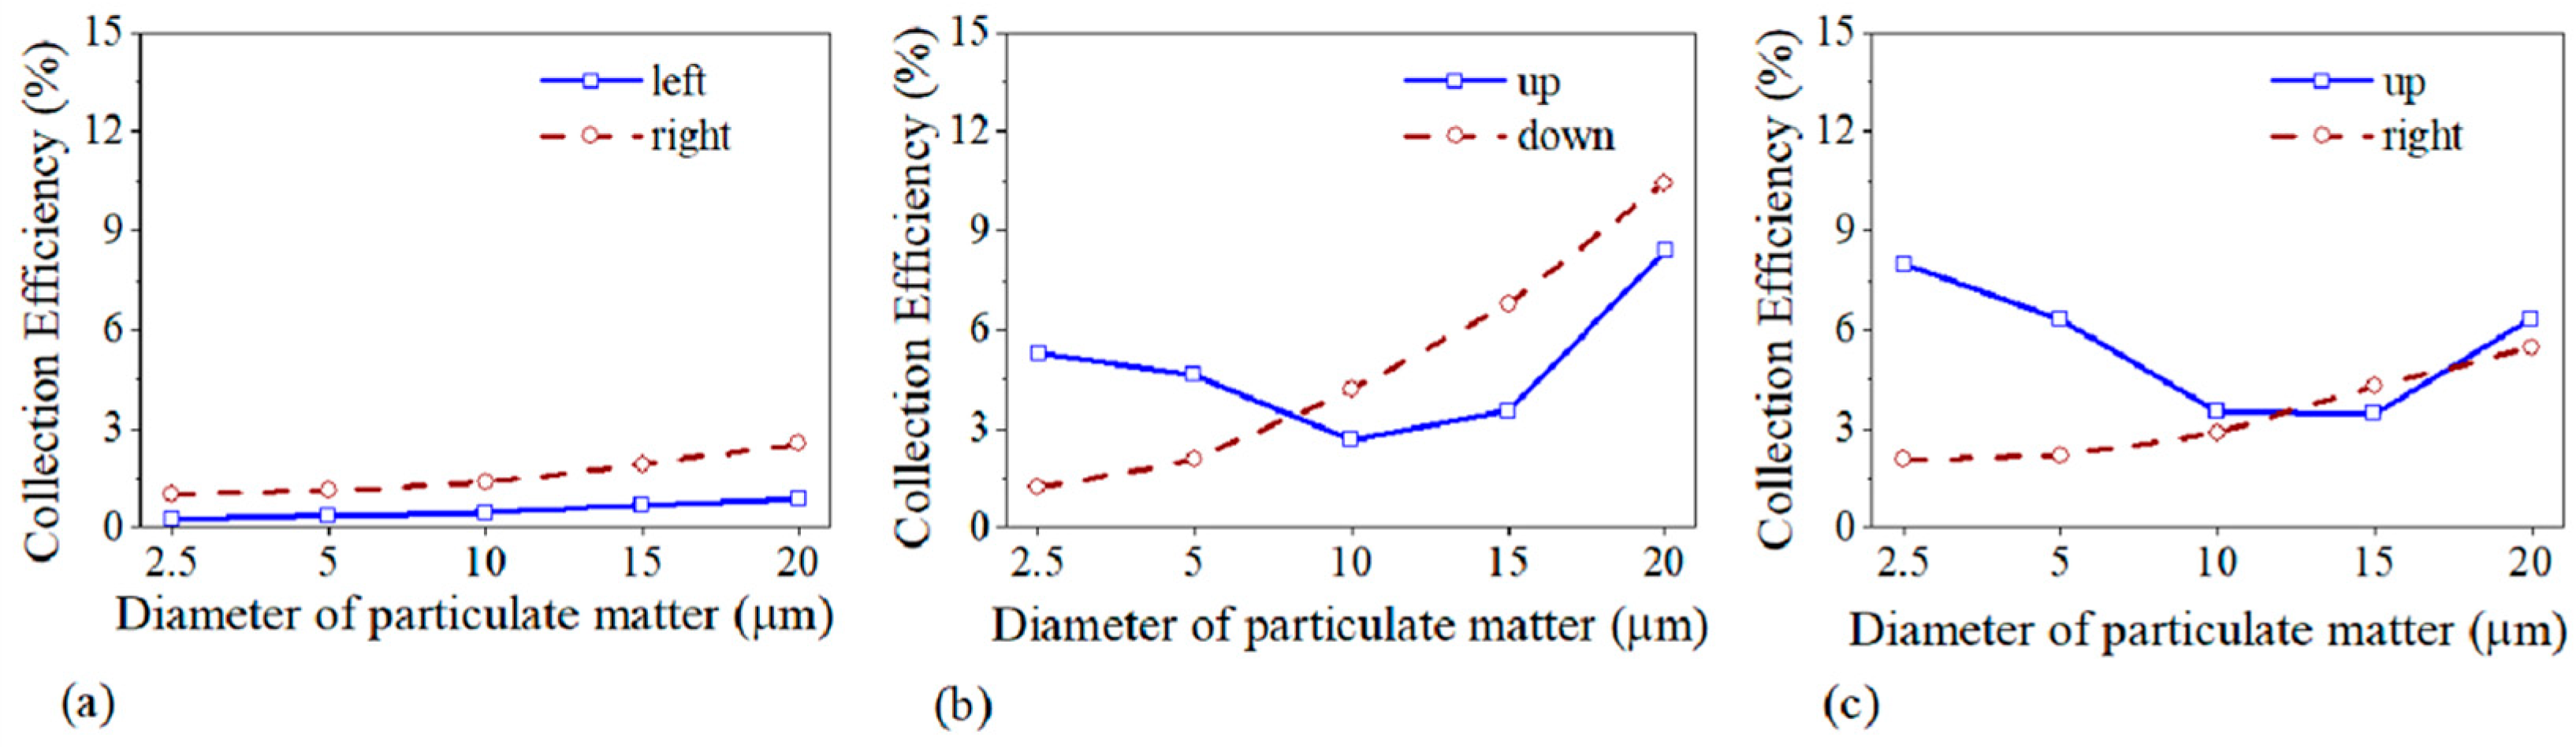
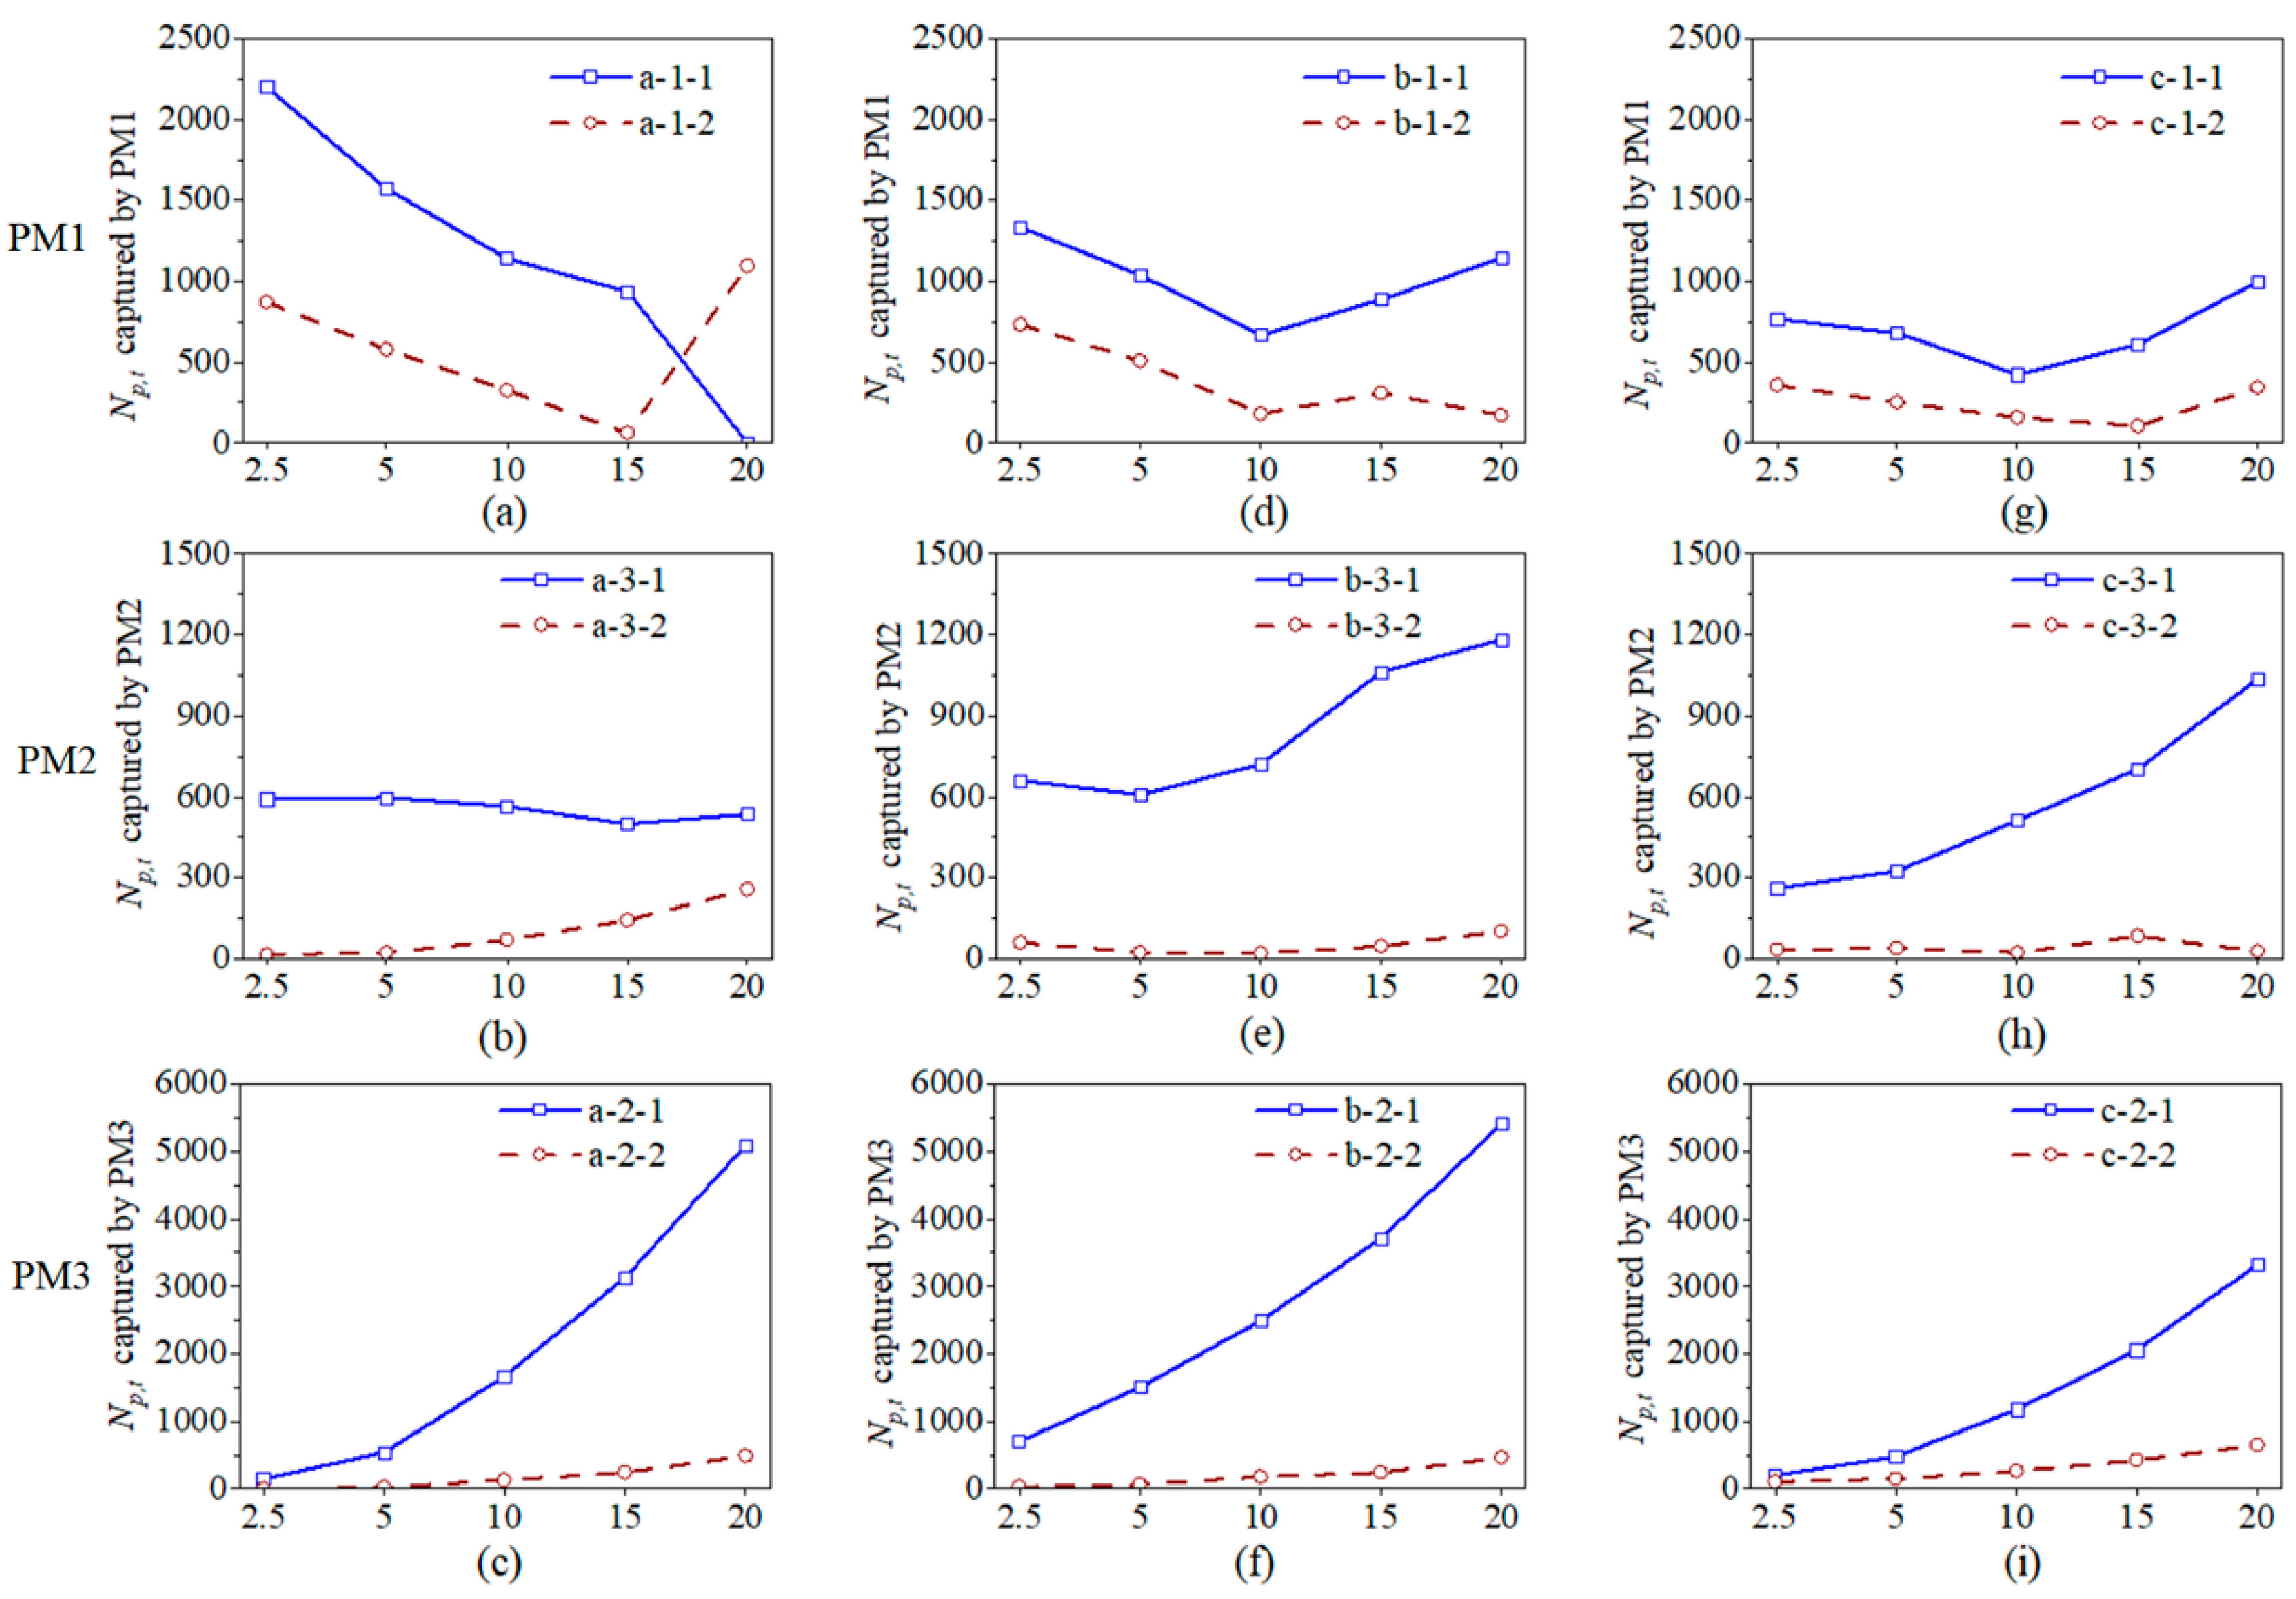
4.1. Placement of Porous Materials inside the Double-Skin Façade
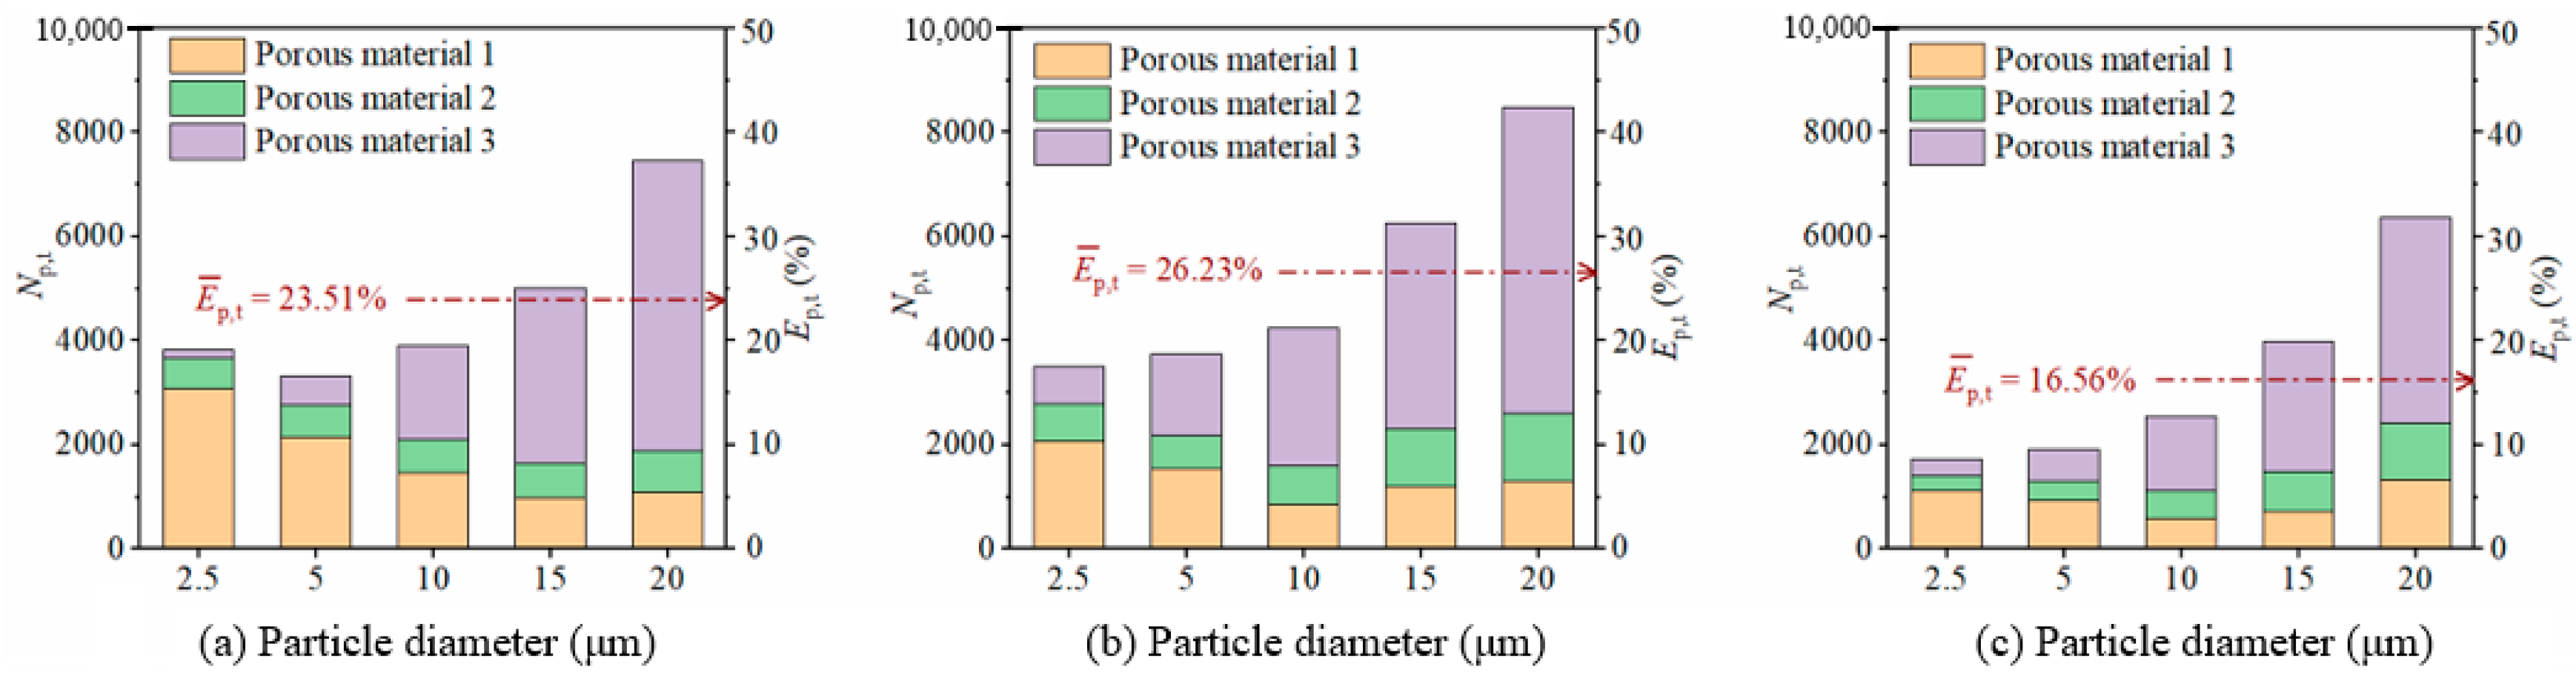
4.2. Effects of Porous Materials with Different Pore Sizes on Particle Capture Efficiency
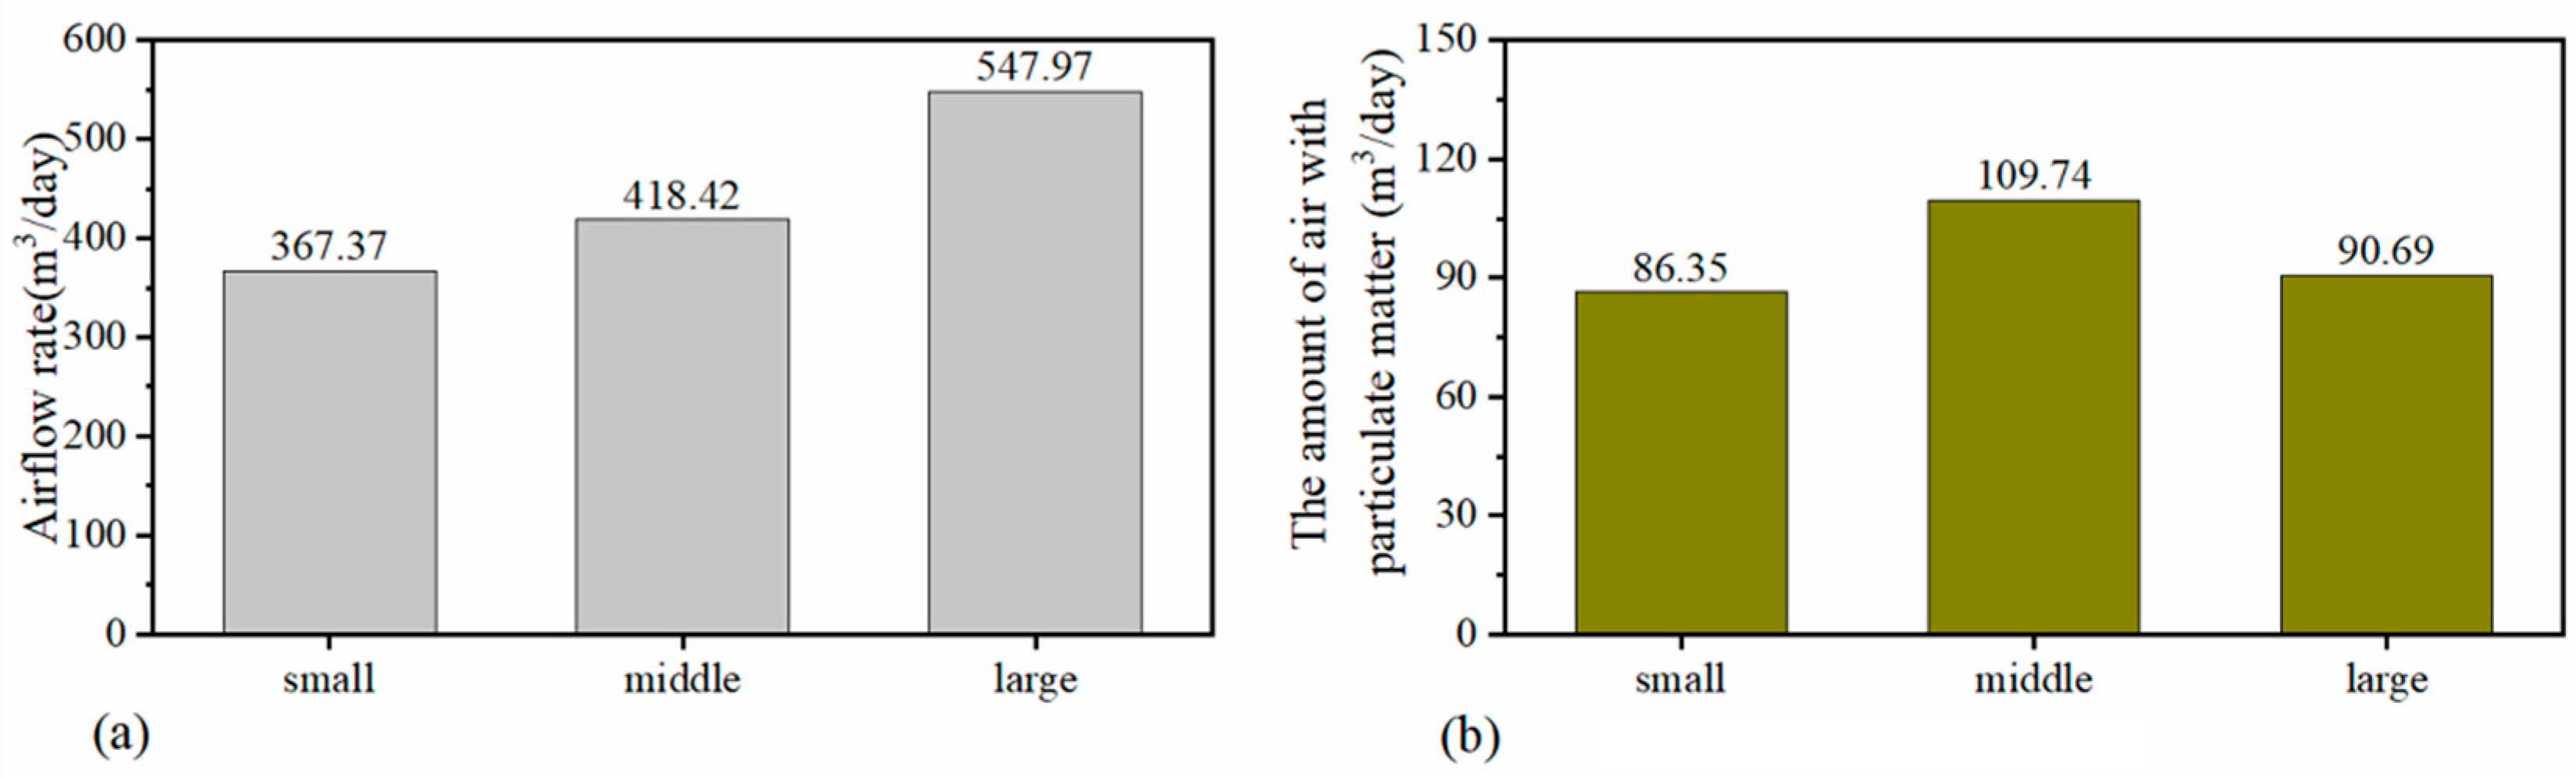
4.3. Annual Performance Evaluation
4.4. Discussion and Prospects
5. Conclusions
Author Contributions
Funding
Institutional Review Board Statement
Informed Consent Statement
Data Availability Statement
Acknowledgments
Conflicts of Interest
References
- Li, D.; Yue, W.; Gong, T.; Gao, P.; Zhang, T.; Luo, Y.; Wang, C. A comprehensive SERS, SEM and EDX study of individual atmospheric PM2.5 particles in Chengdu, China. Sci. Total Environ. 2023, 883, 163668. [Google Scholar] [CrossRef]
- Bulletin of Marine Ecology and Environment Status of China. Report on the State of the Ecology and Environment in China; China Water Risk: Hong Kong, China, 2022. [Google Scholar]
- Jones, A.P. Indoor air quality and health. Atmos. Environ. 1999, 33, 4535–4564. [Google Scholar] [CrossRef]
- Jung, W.; Lee, J.S.; Han, S.; Ko, S.H.; Kim, T.; Kim, Y.H. An efficient reduced graphene-oxide filter for PM2.5 removal. J. Mater. Chem. A 2018, 6, 16975–16982. [Google Scholar] [CrossRef]
- Grabchenko, M.V.; Mikheeva, N.N.; Mamontov, G.V.; Salaev, M.A.; Liotta, L.F.; Vodyankina, O.V. Ag/CeO2 composites for catalytic abatement of CO, Soot and VOCs. Catalysts 2018, 8, 285. [Google Scholar] [CrossRef]
- Yoon, K.; Hsiao, B.S.; Chu, B. Functional nanofibers for environmental applications. J. Mater. Chem. 2008, 18, 5326–5334. [Google Scholar] [CrossRef]
- Xiao, J.; Liang, J.; Zhang, C.; Tao, Y.; Ling, G.W.; Yang, Q.H. Advanced Materials for Capturing Particulate Matter: Progress and Perspectives. Small Methods 2018, 2, 1800012. [Google Scholar] [CrossRef]
- Liang, C.; Li, Z.; Dai, S. Mesoporous carbon materials: Synthesis and modification. Angew. Chem. Int. Ed. 2008, 47, 3696–3717. [Google Scholar] [CrossRef] [PubMed]
- Ji, X.; Huang, J.; Teng, L.; Li, S.; Li, X.; Cai, W.; Chen, Z.; Lai, Y. Advances in particulate matter filtration: Materials, performance, and application. Green Energy Environ. 2022, 8, 673–697. [Google Scholar] [CrossRef]
- Liu, F.; Lu, T.; Bu, W.; Xiang, H.; Yang, J.; Li, J.; Zhao, X.; Shao, W.; Ni, Q.; He, J. ZIF-8 Modified Nanofiber Composite Window Screen for Efficient Indoor PM2.5 and Formaldehyde Removal. Fibers Polym. 2022, 23, 2176–2187. [Google Scholar] [CrossRef]
- Zanoletti, A.; Bilo, F.; Depero, L.E.; Zappa, D.; Bontempi, E. The first sustainable material designed for air particulate matter capture: An introduction to Azure Chemistry. J. Environ. Manag. 2018, 218, 355–362. [Google Scholar] [CrossRef] [PubMed]
- Zanoletti, A.; Bilo, F.; Borgese, L.; Depero, L.E.; Fahimi, A.; Ponti, J.; Valsesia, A.; La Spina, R.; Montini, T.; Bontempi, E. SUNSPACE, A porous material to reduce air Particulate Matter (PM). Front. Chem. 2018, 6, 534. [Google Scholar] [CrossRef] [PubMed]
- Ma, X.; Xu, W.; Su, R.; Shao, L.; Zeng, Z.; Li, L.; Wang, H. Insights into CO2 capture in porous carbons from machine learning, experiments and molecular simulation. Sep. Purif. Technol. 2023, 306, 122521. [Google Scholar] [CrossRef]
- Zhang, L.; Zhang, Z.; Feng, C.; Tian, M.; Gao, Y. Impact of various vegetation configurations on traffic fine particle pollutants in a street canyon for different wind regimes. Sci. Total Environ. 2021, 789, 147960. [Google Scholar] [CrossRef]
- Janhäll, S. Review on urban vegetation and particle air pollution—Deposition and dispersion. Atmos. Environ. 2015, 105, 130–137. [Google Scholar] [CrossRef]
- Li, Y.; Wang, S.; Chen, Q. Potential of thirteen urban greening plants to capture particulate matter on leaf surfaces across three levels of ambient atmospheric pollution. Int. J. Environ. Res. Public Health 2019, 16, 402. [Google Scholar] [CrossRef]
- Pomponi, F.; Moncaster, A. Embodied carbon mitigation and reduction in the built environment–What does the evidence say? J. Environ. Manag. 2016, 181, 687–700. [Google Scholar] [CrossRef]
- Kong, X.; Ren, Y.; Ren, J.; Duan, S.; Guo, C. Energy-saving performance of respiration-type double-layer glass curtain wall system in different climate zones of China: Experiment and simulation. Energy Build. 2021, 252, 111464. [Google Scholar] [CrossRef]
- Ding, W.; Hasemi, Y.; Yamada, T. Natural ventilation performance of a double-skin façade with a solar chimney. Energy Build. 2005, 37, 411–418. [Google Scholar] [CrossRef]
- Mohammad Shuhaimi, N.D.A.; Mohamed Zaid, S.; Esfandiari, M.; Lou, E.; Mahyuddin, N. The impact of vertical greenery system on building thermal performance in tropical climates. J. Build. Eng. 2022, 45, 103429. [Google Scholar] [CrossRef]
- Yu, B.; Li, N.; Ji, J.; Wang, C. Thermal, electrical and purification performance of a novel thermal-catalytic CdTe double-layer breathing window in winter. Renew. Energy 2021, 167, 313–332. [Google Scholar] [CrossRef]
- Liu, X.; Shen, C.; Wang, J.; Zhang, C.; Shuai, Y. Static and dynamic regulations of photovoltaic double skin facades towards building sustainability: A review. Renew. Sustain. Energy Rev. 2023, 183, 113458. [Google Scholar] [CrossRef]
- Li, H.; Zhong, K.; Zhai, Z.J. A new double-skin façade system integrated with TiO2 plates for decomposing BTEX. Build. Environ. 2020, 180, 107037. [Google Scholar] [CrossRef]
- Su, Z.; Li, X.; Xue, F. Double-skin façade optimization design for different climate zones in China. Sol. Energy 2017, 155, 281–290. [Google Scholar] [CrossRef]
- DG/TJ08-56-2019; Technical standard for building curtain wall. Tongji University Press: Shanghai, China, 2019.
- Cornelio, A.; Zanoletti, A.; Federici, S.; Depero, L.E.; Bontempi, E. Porous materials derived from industrial by-products for titanium dioxide nanoparticles capture. Appl. Sci. 2020, 10, 8086. [Google Scholar] [CrossRef]
- Wu, Y.; Ju, D.; Wang, H.; Sun, C.; Wu, Y.; Cao, Z.; Tolochko, O.V. Simulation of the Particle Transport Behaviors in Nanoporous Matter. Polymers 2022, 14, 3563. [Google Scholar] [CrossRef] [PubMed]
- Wang, Q.X.; Zhang, H.M.; Cai, H.N.; Fan, Q.B. Modified Quartet Structure Generation Set Reconstruction of Finite Element Model for Co-Continuous Ceramic Composites. Appl. Mech. Mater. 2015, 782, 278–290. [Google Scholar] [CrossRef]
- Guan, D.; Wu, J.H.; Jing, L. A statistical method for predicting sound absorbing property of porous metal materials by using quartet structure generation set. J. Alloys Compd. 2015, 626, 29–34. [Google Scholar] [CrossRef]
- Papakonstantinou, K.A.; Kiranoudis, C.T.; Markatos, N.C. Numerical simulation of air flow field in single-sided ventilated buildings. Energy Build. 2000, 33, 41–48. [Google Scholar] [CrossRef]
- Tahmasebi, P.; Sahimi, M. Reconstruction of three-dimensional porous media using a single thin section. Phys. Rev. E 2012, 85, 066709. [Google Scholar] [CrossRef] [PubMed]
- Rebaï, M.; Drolet, F.; Vidal, D.; Vadeiko, I.; Bertrand, F. A Lattice Boltzmann approach for predicting the capture efficiency of random fibrous media. Asia-Pac. J. Chem. Eng. 2011, 6, 29–37. [Google Scholar] [CrossRef]
- Joshi, M. A Class of Stochastic Models for Porous Media. Ph.D. Thesis, University of Kansas, Lawrence, KS, USA, 1974. [Google Scholar]
- Hazlett, R.D. Statistical characterization and stochastic modeling of pore networks in relation to fluid flow. Math. Geol. 1997, 29, 801–822. [Google Scholar] [CrossRef]
- Madadi, M.; Sahimi, M. Lattice Boltzmann simulation of fluid flow in fracture networks with rough, self-affine surfaces. Phys. Rev. E 2003, 67, 12. [Google Scholar] [CrossRef]
- Pilotti, M. Generation of realistic porous media by grains sedimentation. Transp. Porous Media 1998, 33, 257–278. [Google Scholar] [CrossRef]
- Maier, R.S.; Kroll, D.M.; Bernard, R.S.; Howington, S.E.; Peters, J.F.; Davis, H.T. Pore-scale simulation of dispersion. Phys. Fluids 2000, 12, 2065–2079. [Google Scholar] [CrossRef]
- Wang, M.; Wang, J.; Pan, N.; Chen, S. Mesoscopic predictions of the effective thermal conductivity for microscale random porous media. Phys. Rev. E 2007, 75, 036702. [Google Scholar] [CrossRef]
- Wang, M.; Pan, N. Numerical analyses of effective dielectric constant of multiphase microporous media. J. Appl. Phys. 2007, 101, 114102. [Google Scholar] [CrossRef]
- Li, Y.; Darkwa, J.; Kokogiannakis, G. Heat transfer analysis of an integrated double skin façade and phase change material blind system. Build. Environ. 2017, 125, 111–121. [Google Scholar] [CrossRef]
- ANSYS, 19.3; Fluent Theory Guide; ANSYS Inc.: Canonsburg, PA, USA, 2019.
- Zhai, Z.Q. Computational Fluid Dynamics for Built and Natural Environments; Springer: Singapore, 2020. [Google Scholar]
- Chen, X.; Zhong, W.; Sun, B.; Jin, B.; Zhou, X. Study on gas/solid flow in an obstructed pulmonary airway with transient flow based on CFD-DPM approach. Powder Technol. 2012, 217, 252–260. [Google Scholar] [CrossRef]
- Boache, P.J. Perspective: A method for uniform reporting of grid refinement studies. J. Fluids Eng. Trans. ASME 1994, 116, 405–413. [Google Scholar]
- Celik, I.B.; Ghia, U.; Roache, P.J.; Freitas, C.J.; Coleman, H.; Raad, P.E. Procedure for estimation and reporting of uncertainty due to discretization in CFD applications. J. Fluids Eng. Trans. ASME 2008, 130, 0780011–0780014. [Google Scholar] [CrossRef]
- Roache, P.J. Quantification of uncertainty in computational fluid dynamics. Annu. Rev. Fluid Mech. 1997, 29, 123–160. [Google Scholar] [CrossRef]
- Holmberg, S. Modelling of the indoor environment—Particle dispersion and deposition. Indoor Air 1998, 8, 113–122. [Google Scholar] [CrossRef]
- Yakhot, V.; Orszag, S.A.; Thangam, S.; Gatski, T.B.; Speziale, C.G. Development of turbulence models for shear flows by a double expansion technique. Phys. Fluids A 1992, 4, 1510–1520. [Google Scholar] [CrossRef]
- Miroshnichenko, I.; Sheremet, M. Comparative study of standard k-ε and k-ω lence models by giving an analysis of turbulent natural convection in an enclosure. EPJ Web Conf. 2015, 82, 01057. [Google Scholar] [CrossRef]
- GB 14295-2019; The People’s Republic of China National Standard. Air Filter. China Architecture and Building Press: Beijing, China, 2019.
- EN-779-2012; Particulate Air Filters for General Ventilation-Determination of the Filter Performance. European Committee for Standardization: Brussels, Belgium, 2012.
- ASHRAE 52.2-2017; Method of Testing General Ventilation Air-Cleaning Devises Used for Removal Efficiency by Particle Size. ASHRAE: Peachtree Corners, GA, USA, 2017.
- He, G.Q.; Qian, W.; Li, Z.G.; Ge, W.Q.; Da, L.; Lei, C. Ventilation performance of solar chimney in a test house: Field measurement and validation of plume model. Build. Environ. 2021, 193, 107648. [Google Scholar] [CrossRef]


| Parameters | Values |
|---|---|
| Height of DSF-PM | 3.0 m |
| Depth of DSF-PM | 0.3 m |
| Height of external glass | 2.8 m |
| Height of internal glass | 3.0 m |
| Thickness of external and internal glass | 0.006 m |
| Height of air inlet and outlet | 0.1 m |
| Glass density | 2500 kg/m3 |
| Specific heat of glass | 840 J/(kg·K) |
| Thermal conductivity of glass | 1.5 W/(kg·K) |
| Item | GCI |
|---|---|
| Criteria value | ≤2.2% |
| II–III | 0.27% |
| I–II | 5.9% |
| Case | Term | Parameters |
|---|---|---|
| 1 | Installation strategies | Horizontal placement |
| 2 | Vertical placement | |
| 3 | Horizontal and vertical cross placement | |
| 4 | Pore size of porous material | 2.0 mm |
| 5 | 1.0 mm | |
| 6 | 0.5 mm |
| Variable | Values |
|---|---|
| Aerodynamic diameter of particle | 2.5 μm, 5 μm, 10 μm, 15 μm, 20 μm |
| Density of particle | 1000 kg/m3 |
| Parameters | Values |
|---|---|
| Wind pressure | 0 Pa (buoyancy analysis only) |
| Outdoor air temperature | 30.4 °C |
| Indoor air reference temperature | 26 °C |
| Solar radiation intensity in summer | 647.22 W/m2 |
| Heat-transfer coefficient of outer surface | 23 W/(m2·°C) |
| Heat-transfer coefficient of inner surface | 8.7 W/(m2·°C) |
| Transmittance of the glass shell | 0.85 |
| Transmittance of the heat insulation film | 0.25 |
| Season | Winter | Spring/Autumn | Summer | |
|---|---|---|---|---|
| Parameters | ||||
| Direct solar radiation intensity (W/m2) | 195.17 | 444.05 | 556.26 | |
| Diffuse solar radiation intensity (W/m2) | 32.92 | 72.62 | 90.96 | |
| Outdoor temperature (°C) | 6.9 | 18.3 | 30.4 | |
| Indoor temperature (°C) | 18 | 18.3 | 26 | |
| Indoor–outdoor temperature difference (°C) | 11.1 | 0 | −4.4 | |
Disclaimer/Publisher’s Note: The statements, opinions and data contained in all publications are solely those of the individual author(s) and contributor(s) and not of MDPI and/or the editor(s). MDPI and/or the editor(s) disclaim responsibility for any injury to people or property resulting from any ideas, methods, instructions or products referred to in the content. |
© 2024 by the authors. Licensee MDPI, Basel, Switzerland. This article is an open access article distributed under the terms and conditions of the Creative Commons Attribution (CC BY) license (https://creativecommons.org/licenses/by/4.0/).
Share and Cite
Li, H.; Guo, H.; Lu, X.; Hu, J.; Zhong, K. Zero-Energy Purification of Ambient Particulate Matter Using a Novel Double-Skin Façade System Integrated with Porous Materials. Sustainability 2024, 16, 2489. https://doi.org/10.3390/su16062489
Li H, Guo H, Lu X, Hu J, Zhong K. Zero-Energy Purification of Ambient Particulate Matter Using a Novel Double-Skin Façade System Integrated with Porous Materials. Sustainability. 2024; 16(6):2489. https://doi.org/10.3390/su16062489
Chicago/Turabian StyleLi, He, Hongwei Guo, Xiaohan Lu, Jun Hu, and Ke Zhong. 2024. "Zero-Energy Purification of Ambient Particulate Matter Using a Novel Double-Skin Façade System Integrated with Porous Materials" Sustainability 16, no. 6: 2489. https://doi.org/10.3390/su16062489
APA StyleLi, H., Guo, H., Lu, X., Hu, J., & Zhong, K. (2024). Zero-Energy Purification of Ambient Particulate Matter Using a Novel Double-Skin Façade System Integrated with Porous Materials. Sustainability, 16(6), 2489. https://doi.org/10.3390/su16062489