


Developing a New ANN Model to Estimate Daily Actual Evapotranspiration Using Limited Climatic Data and Remote Sensing Techniques for Sustainable Water Management


Abstract
1. Introduction
2. Materials and Methods
2.1. Study Area and Its Characteristics
2.2. Remote Sensing Data Used
2.2.1. Landsat Satellite Imagery
2.2.2. Moderate Resolution Imaging Spectroradiometer (MODIS) Products
2.3. In Situ Meteorological Observations
2.4. Reference Evapotranspiration (ETo) Estimation
2.5. METRIC Model
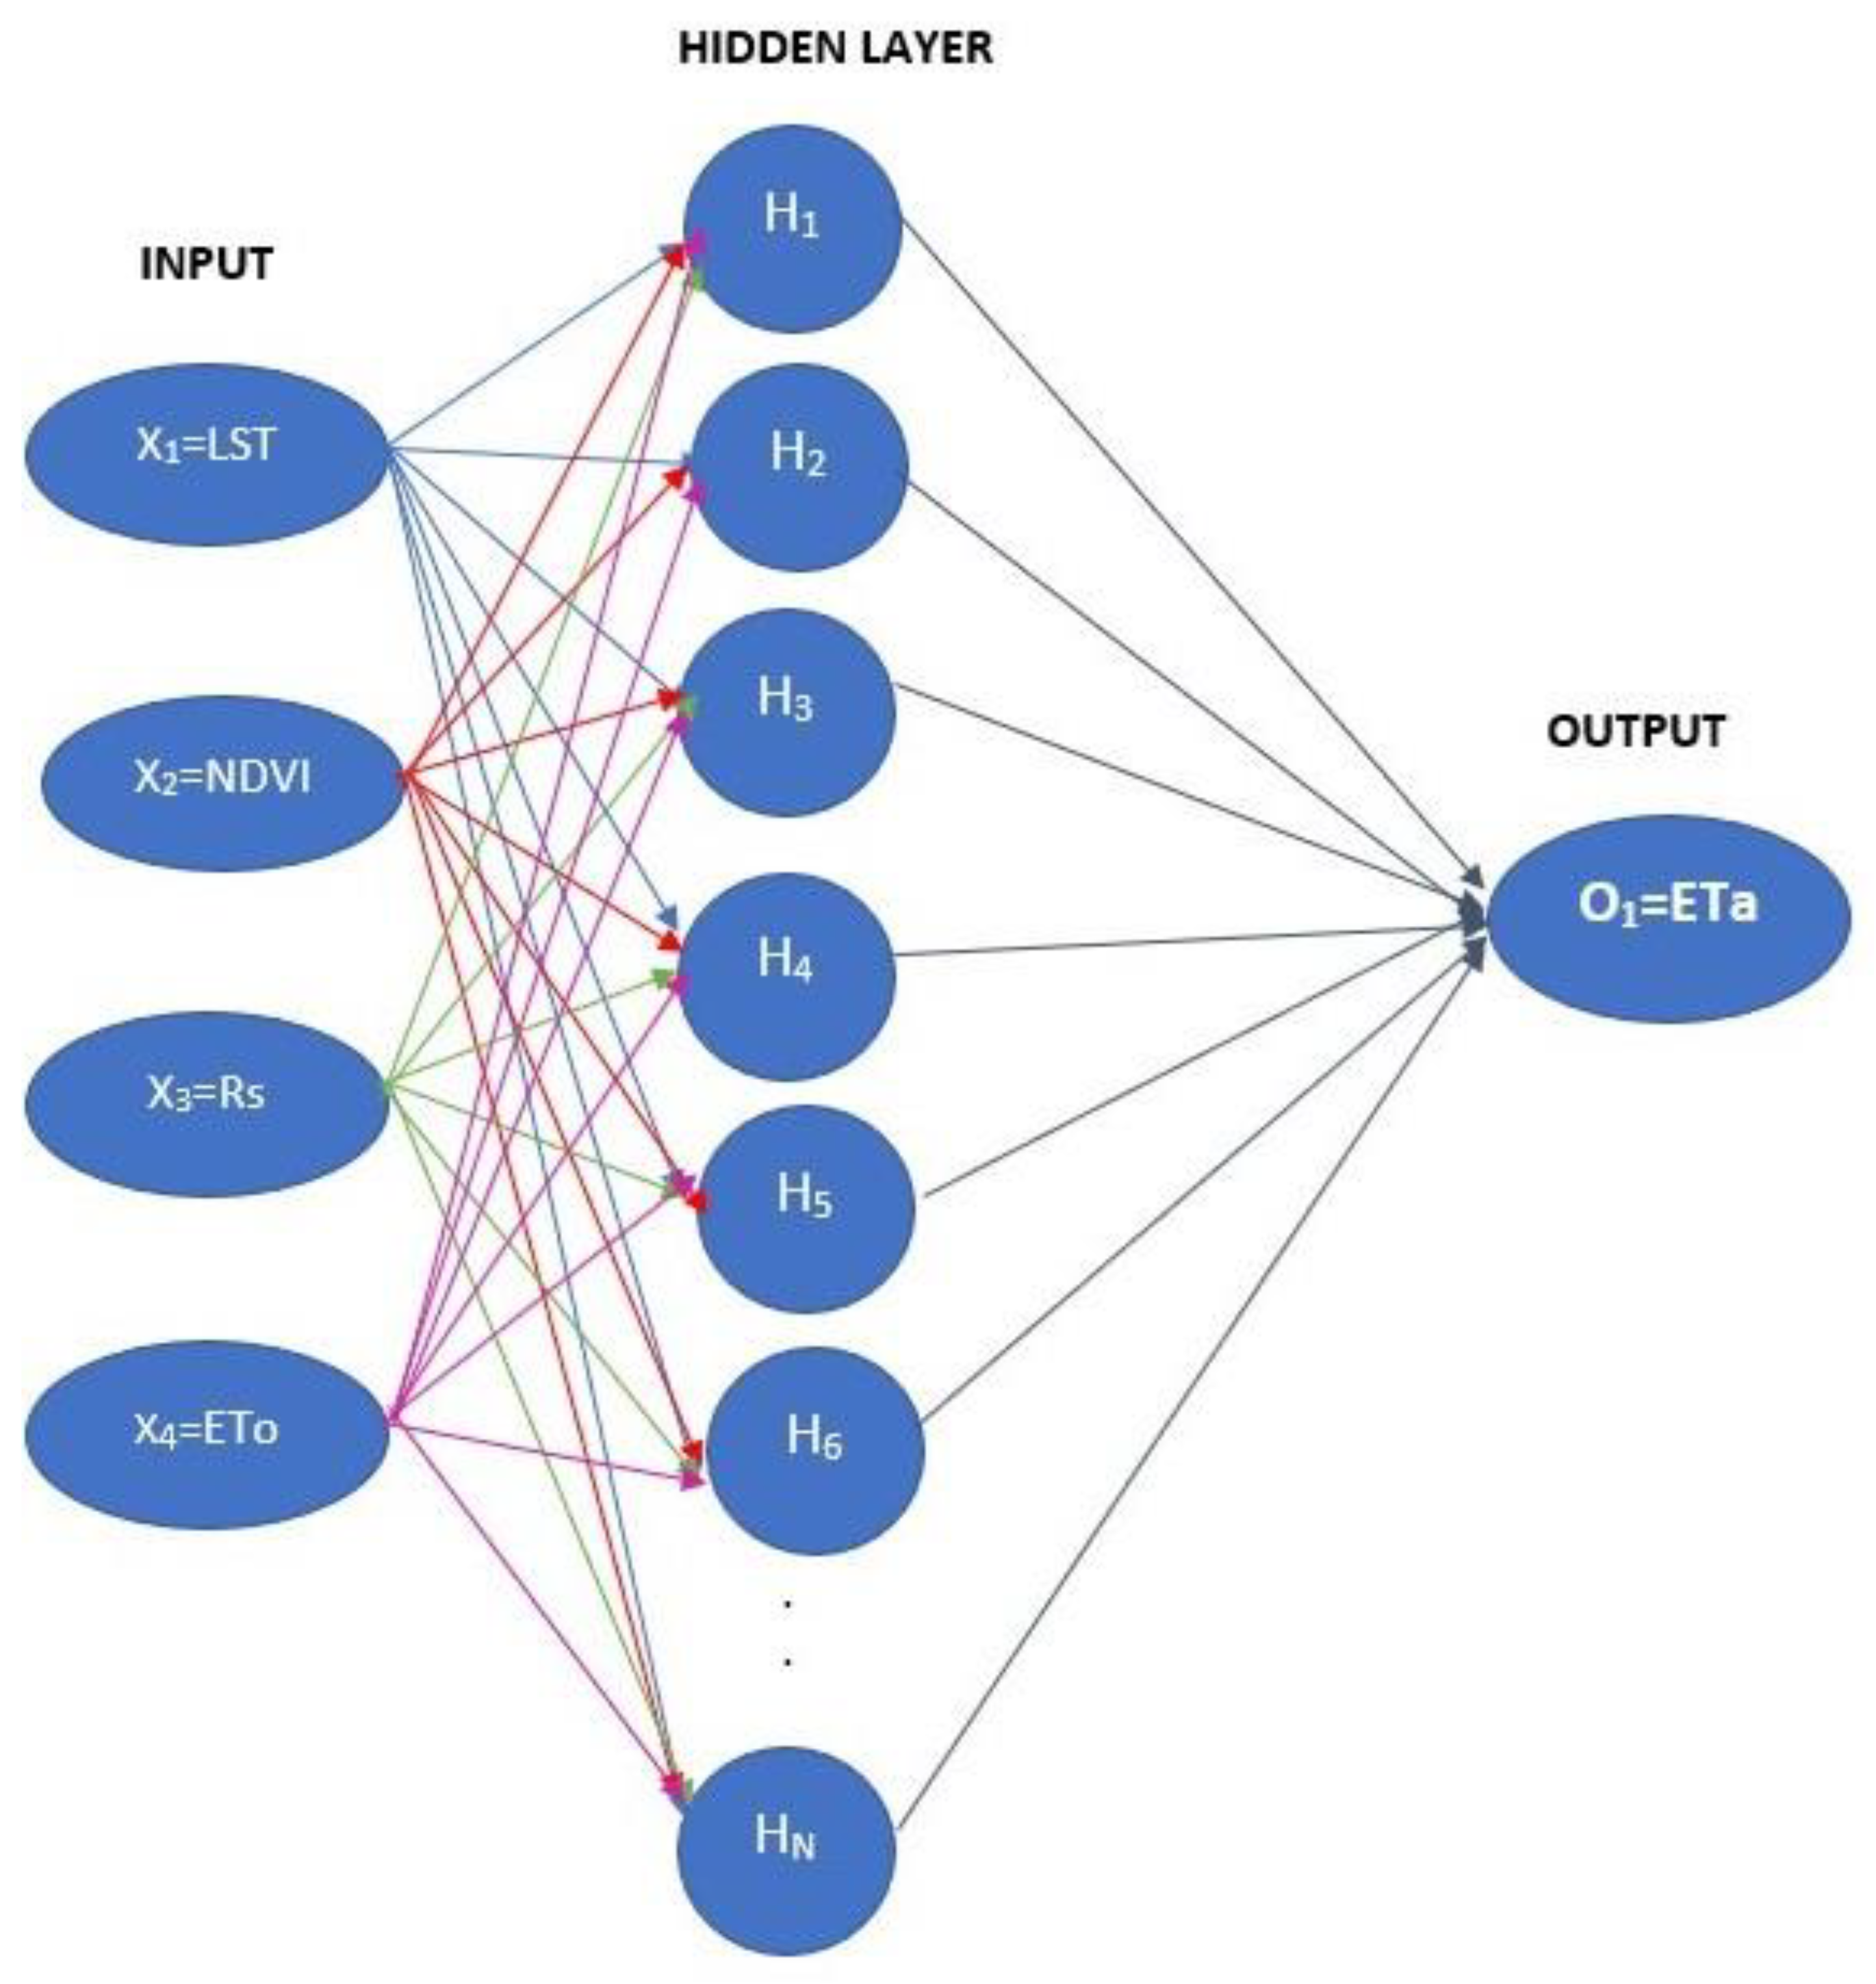
2.6. Developing an ANN Model for Actual Evapotranspiration (ETa) Estimation
3. Results
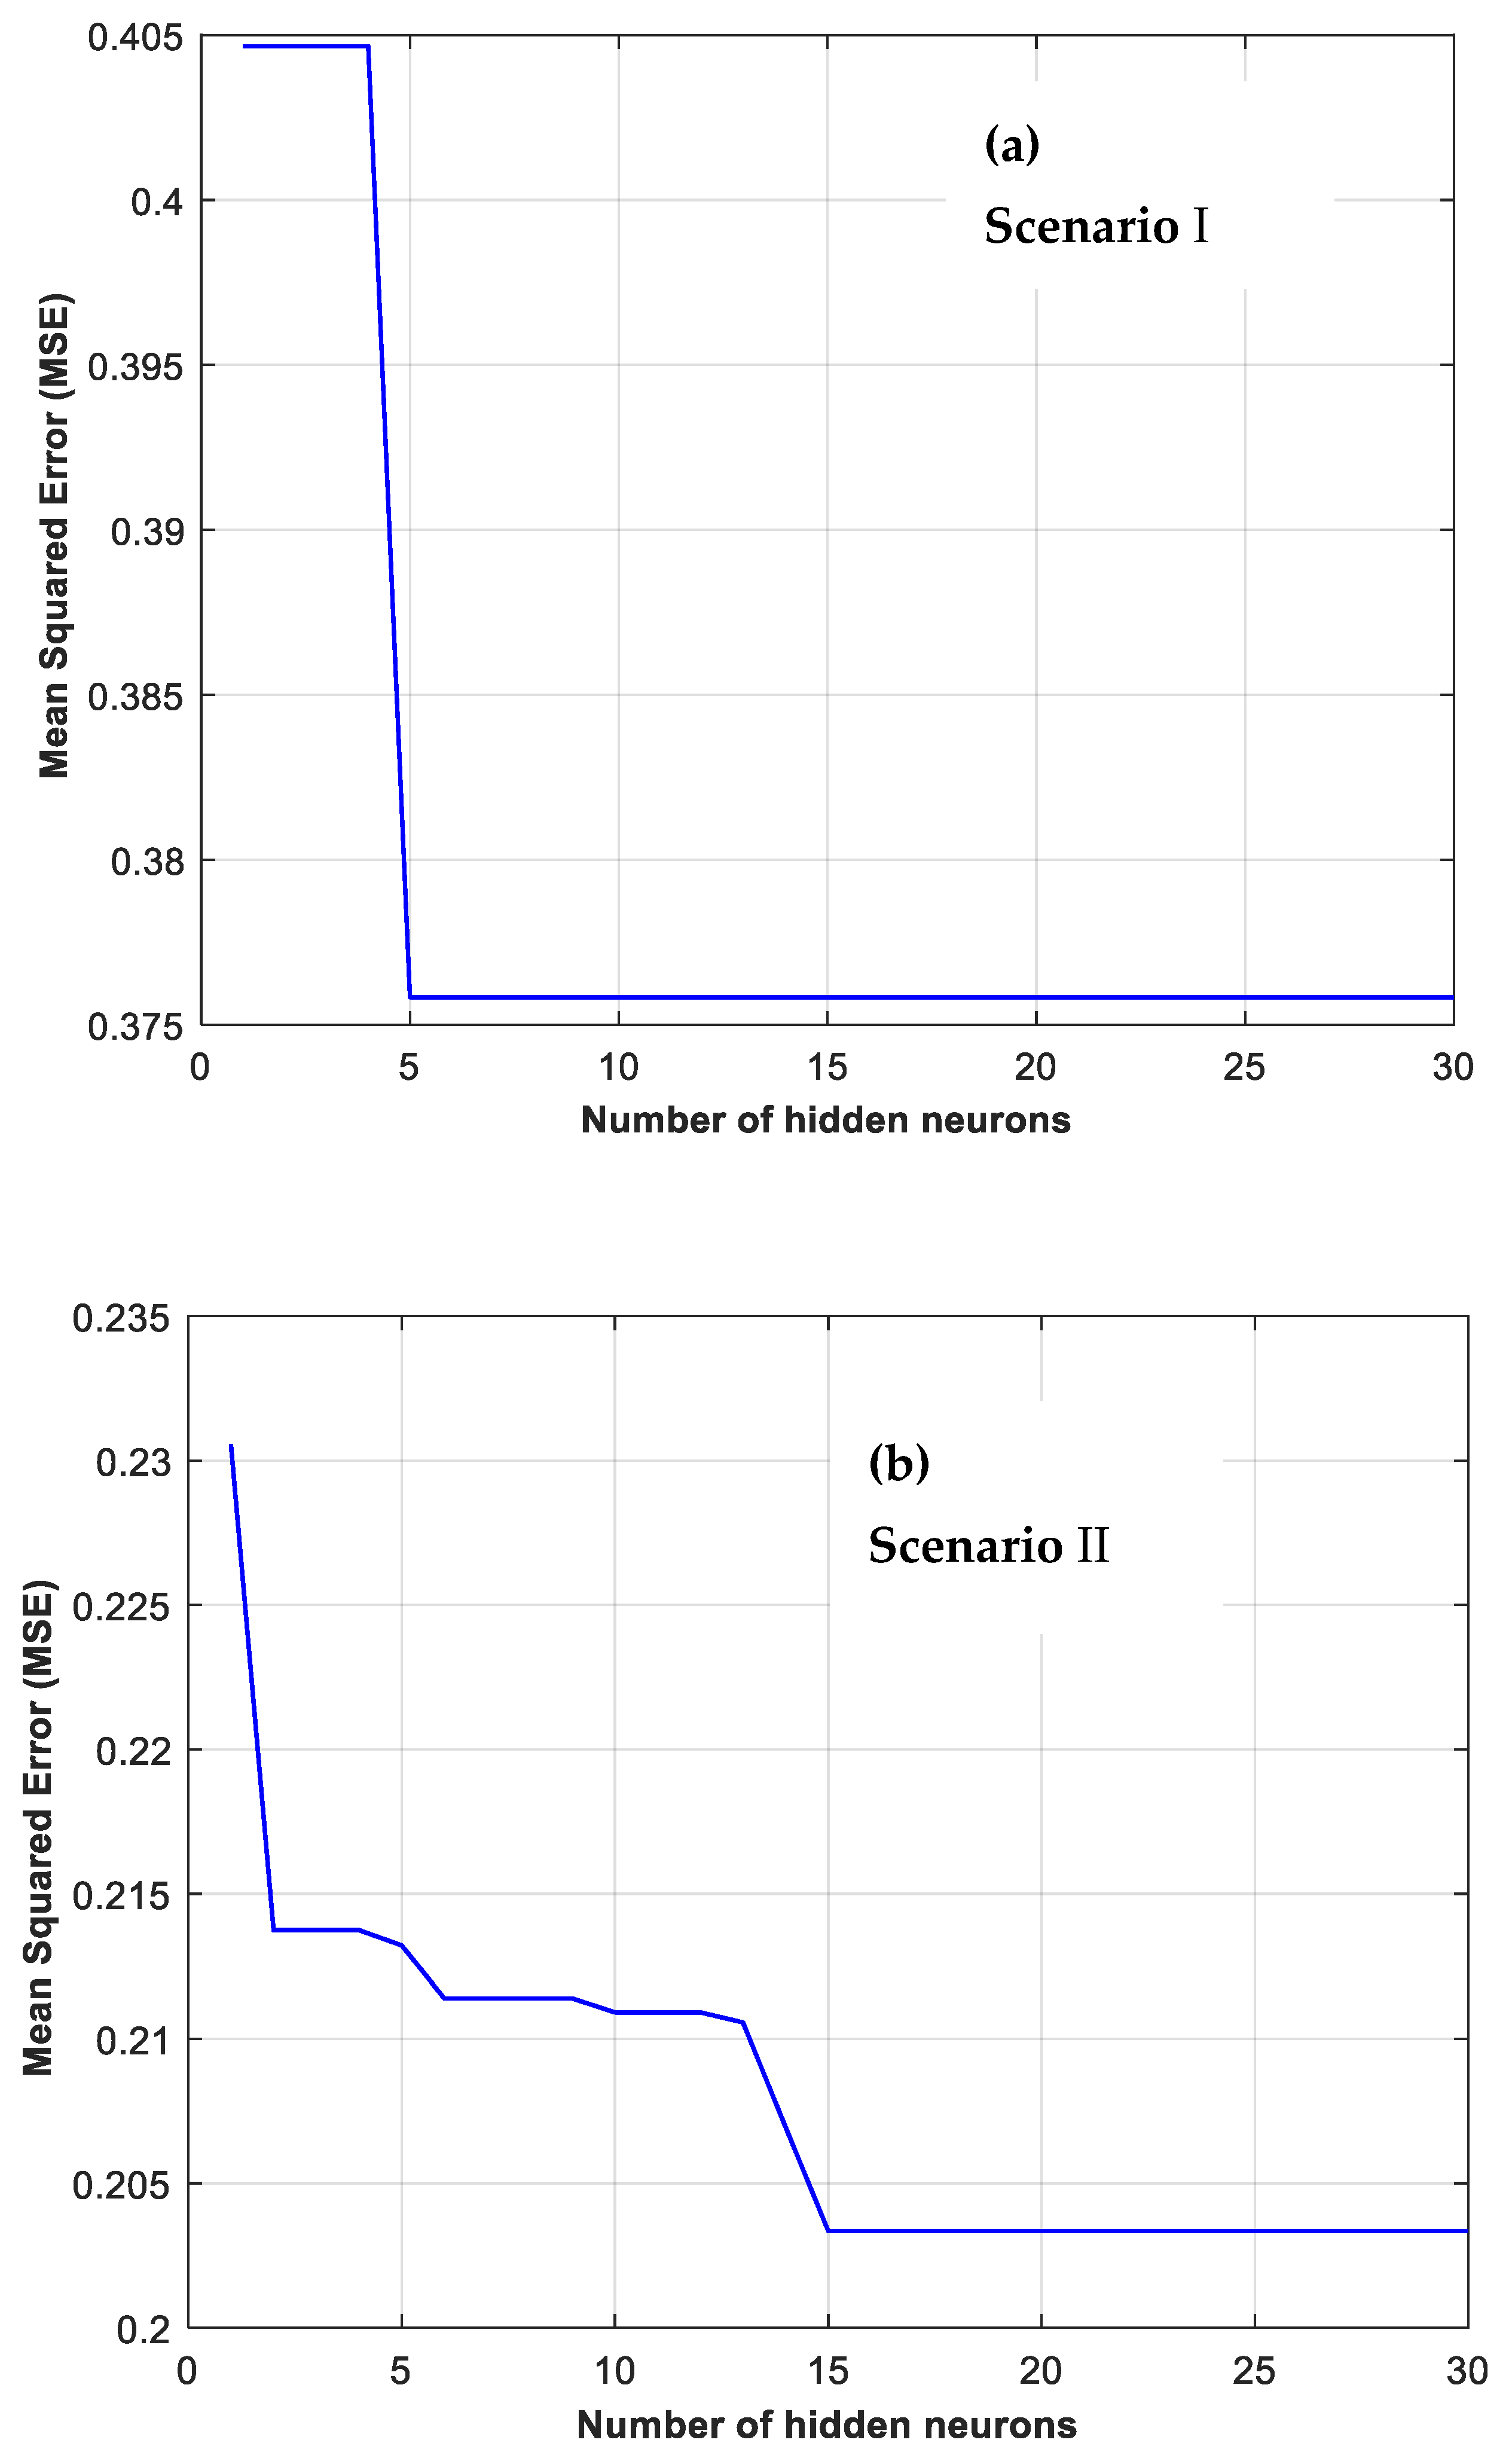
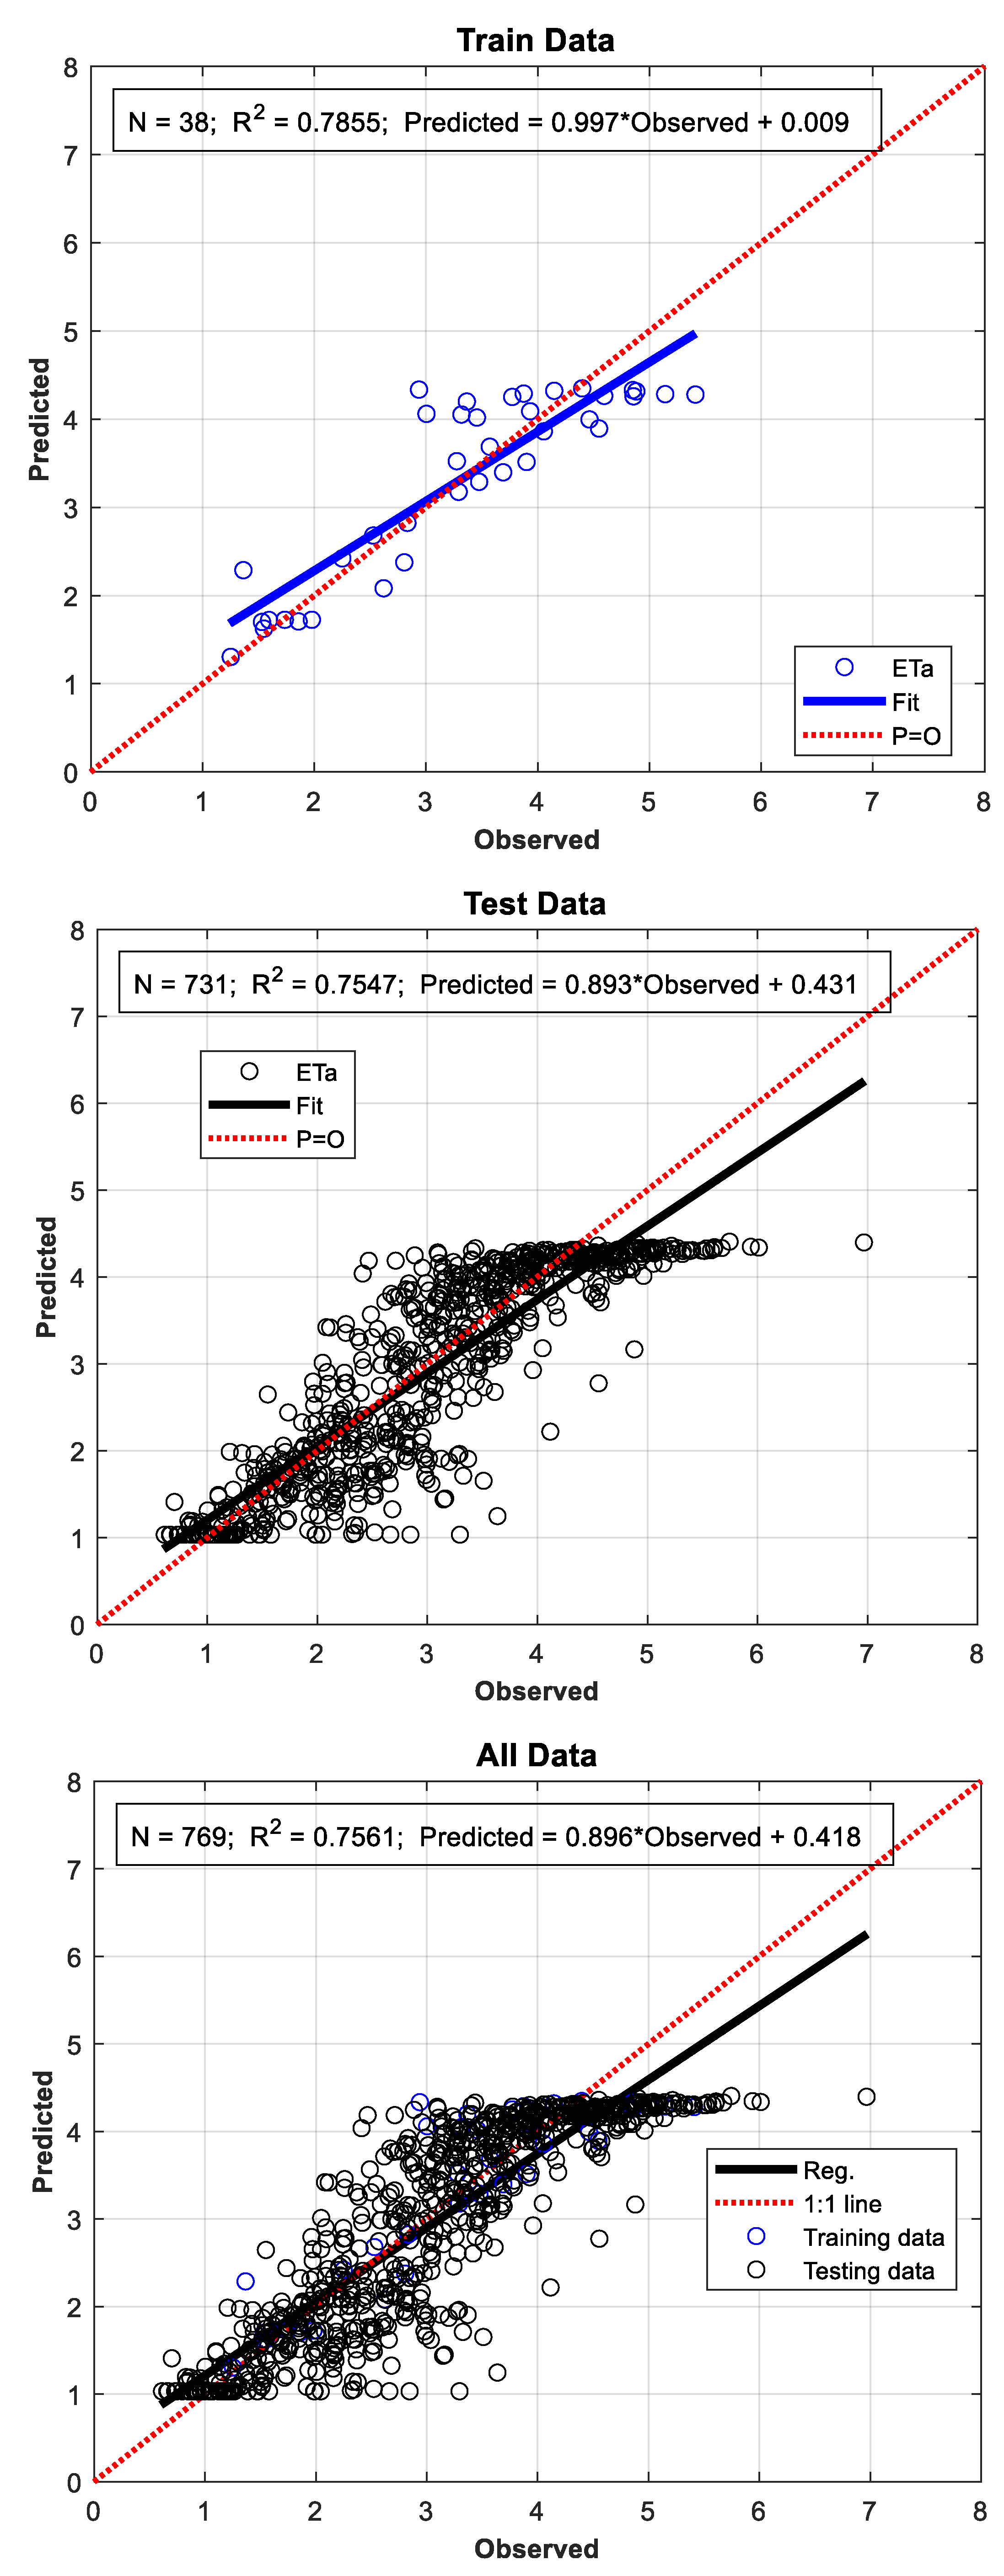
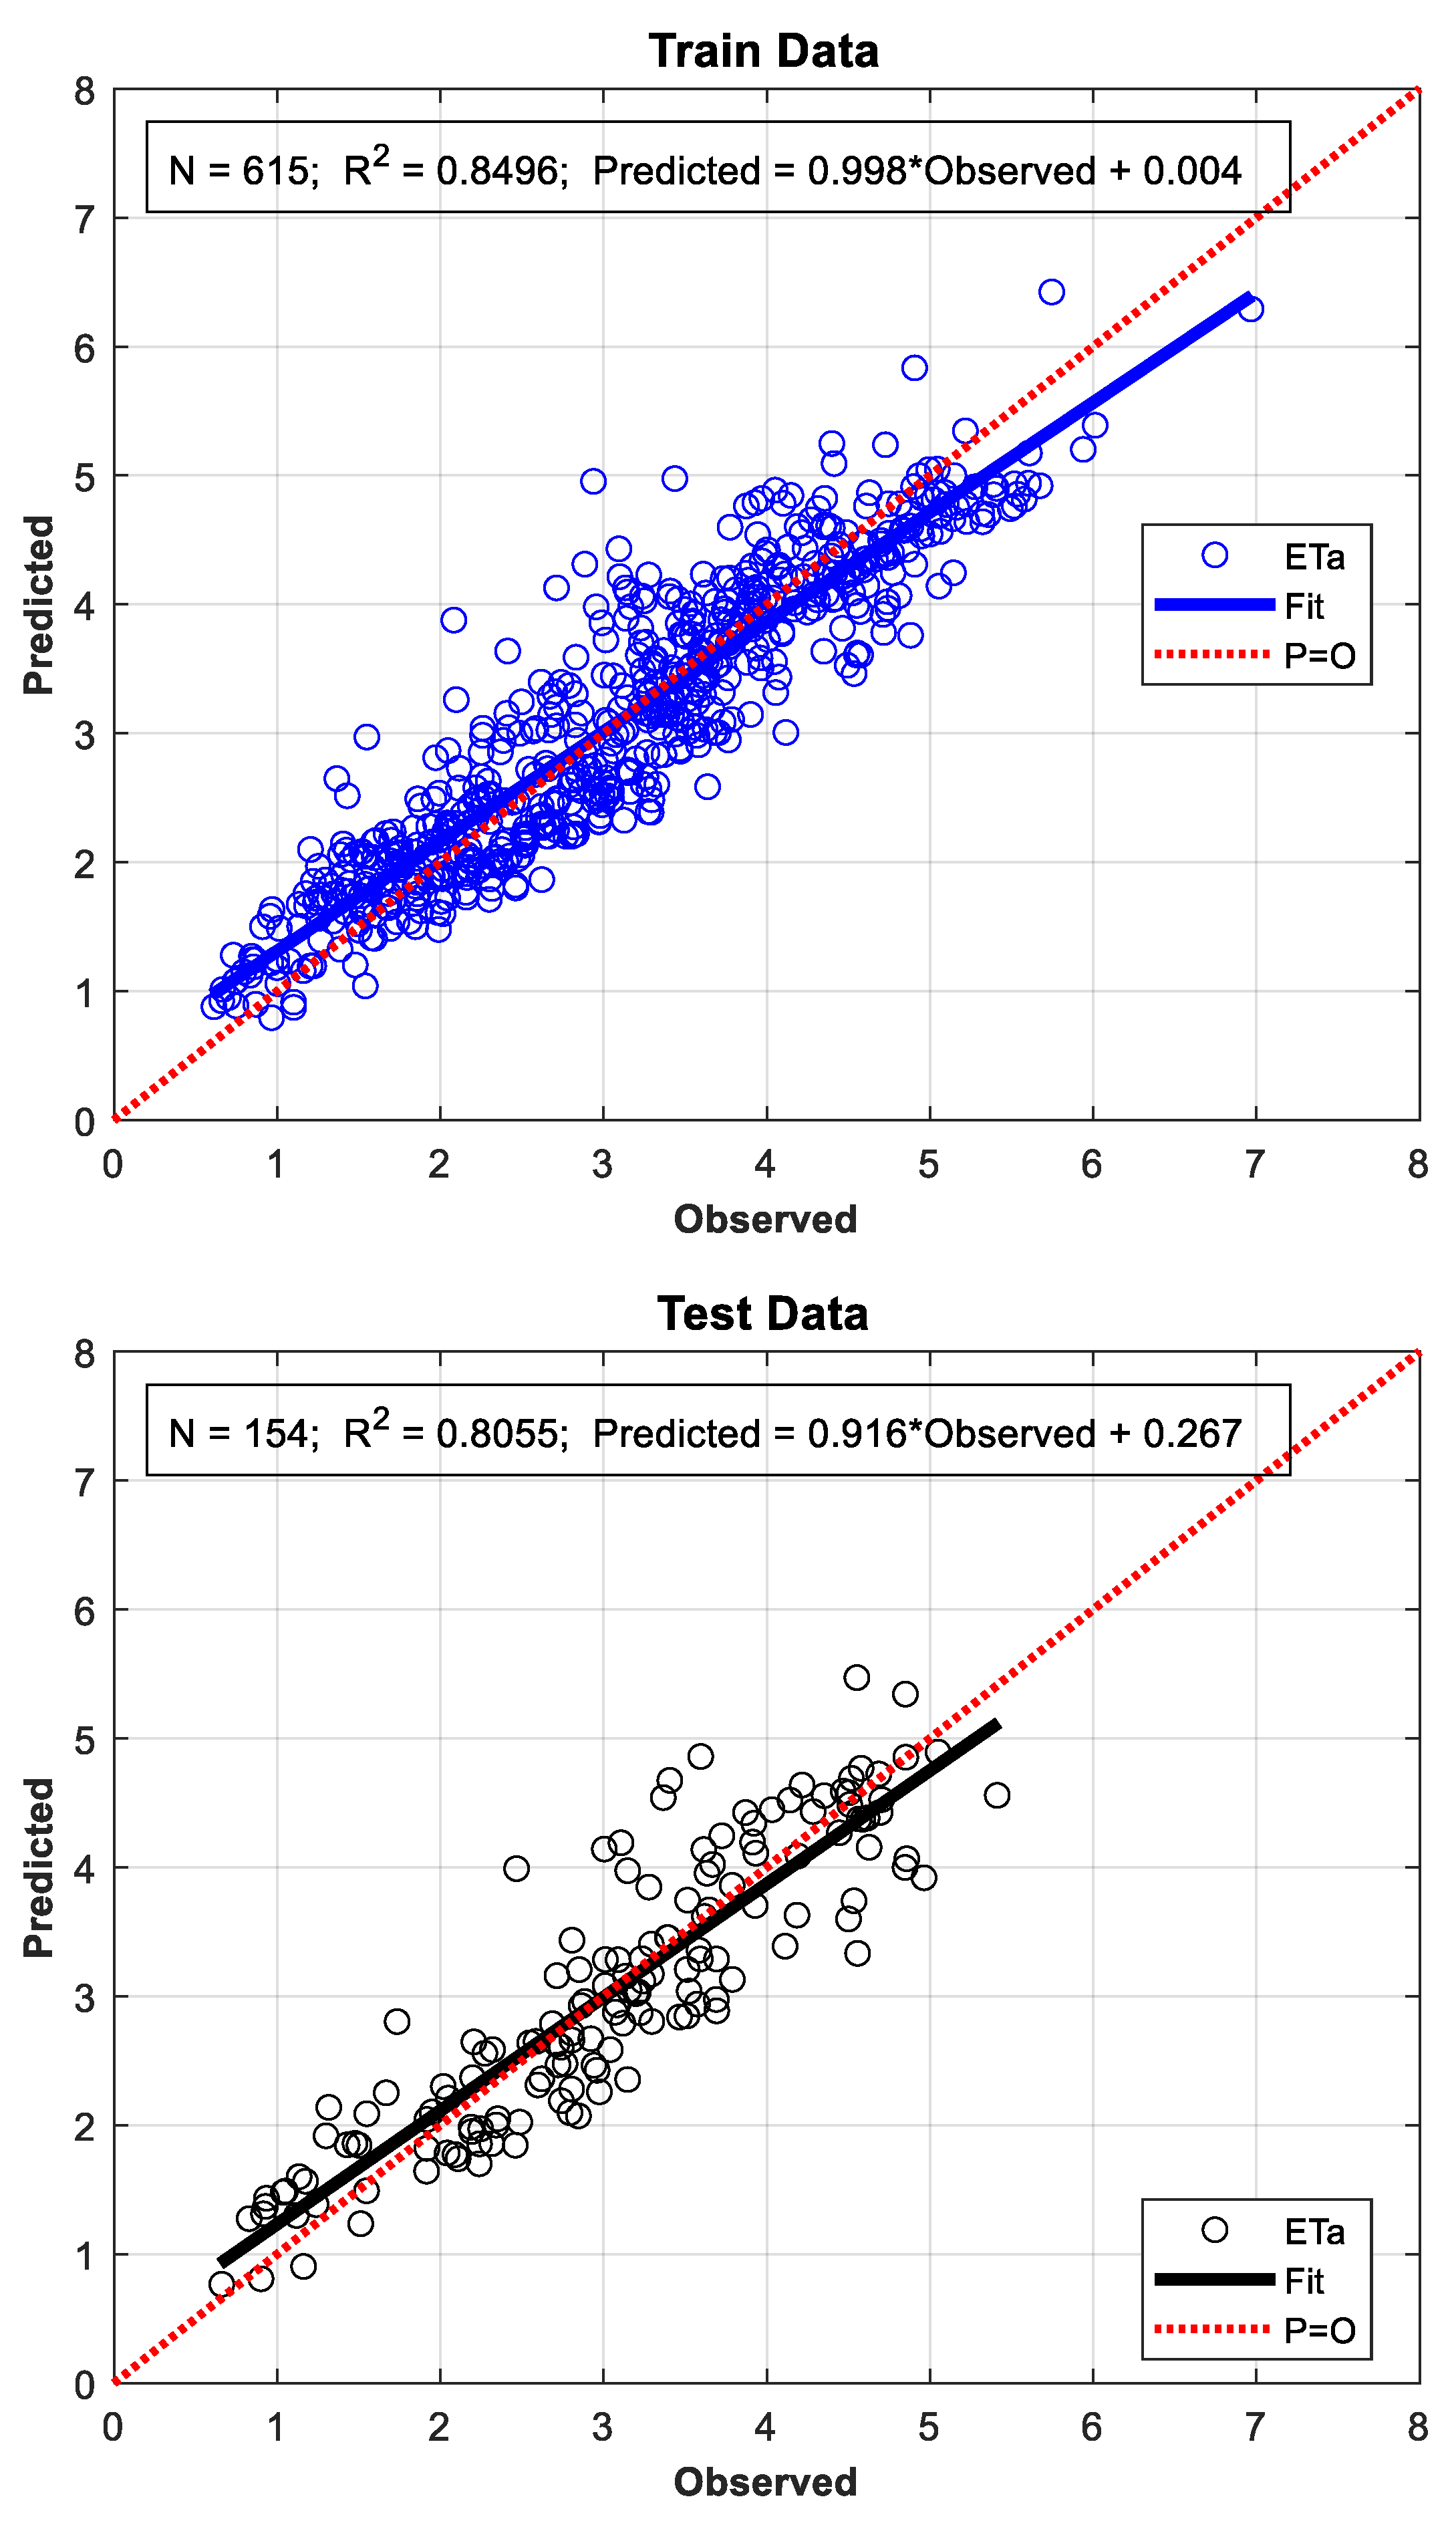
3.1. Implementation of the ANN Model
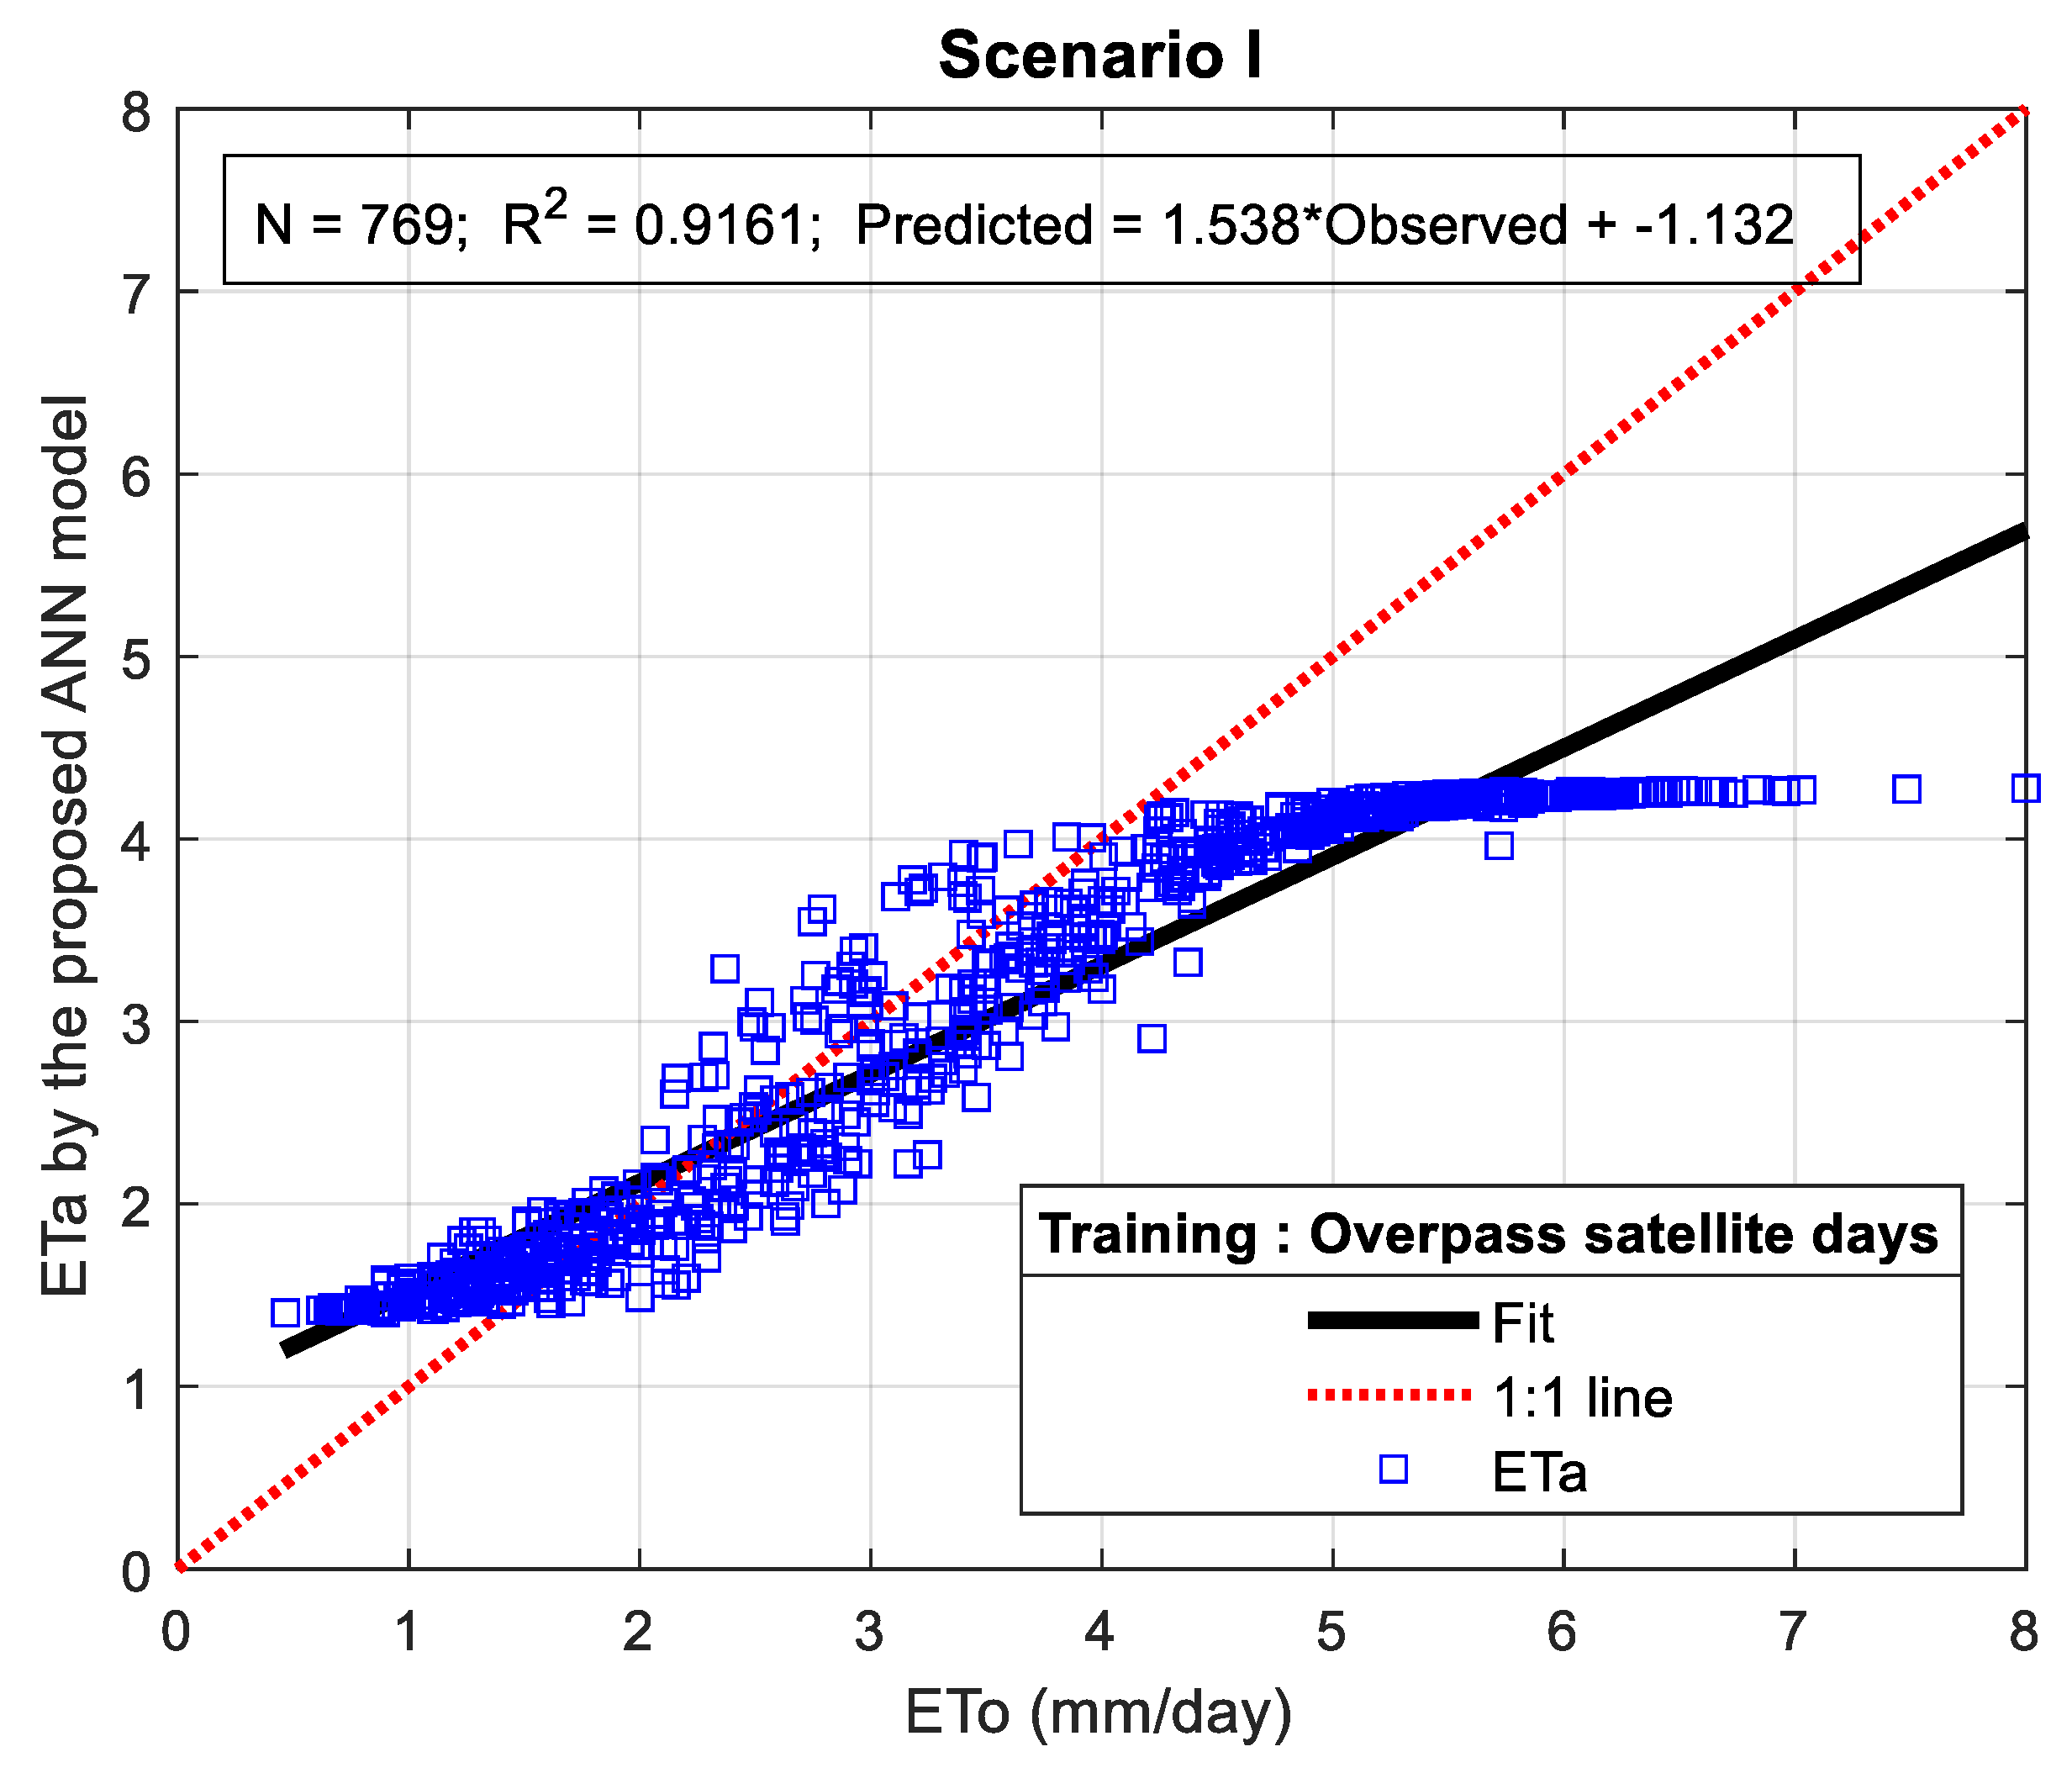
3.1.1. Scenario I
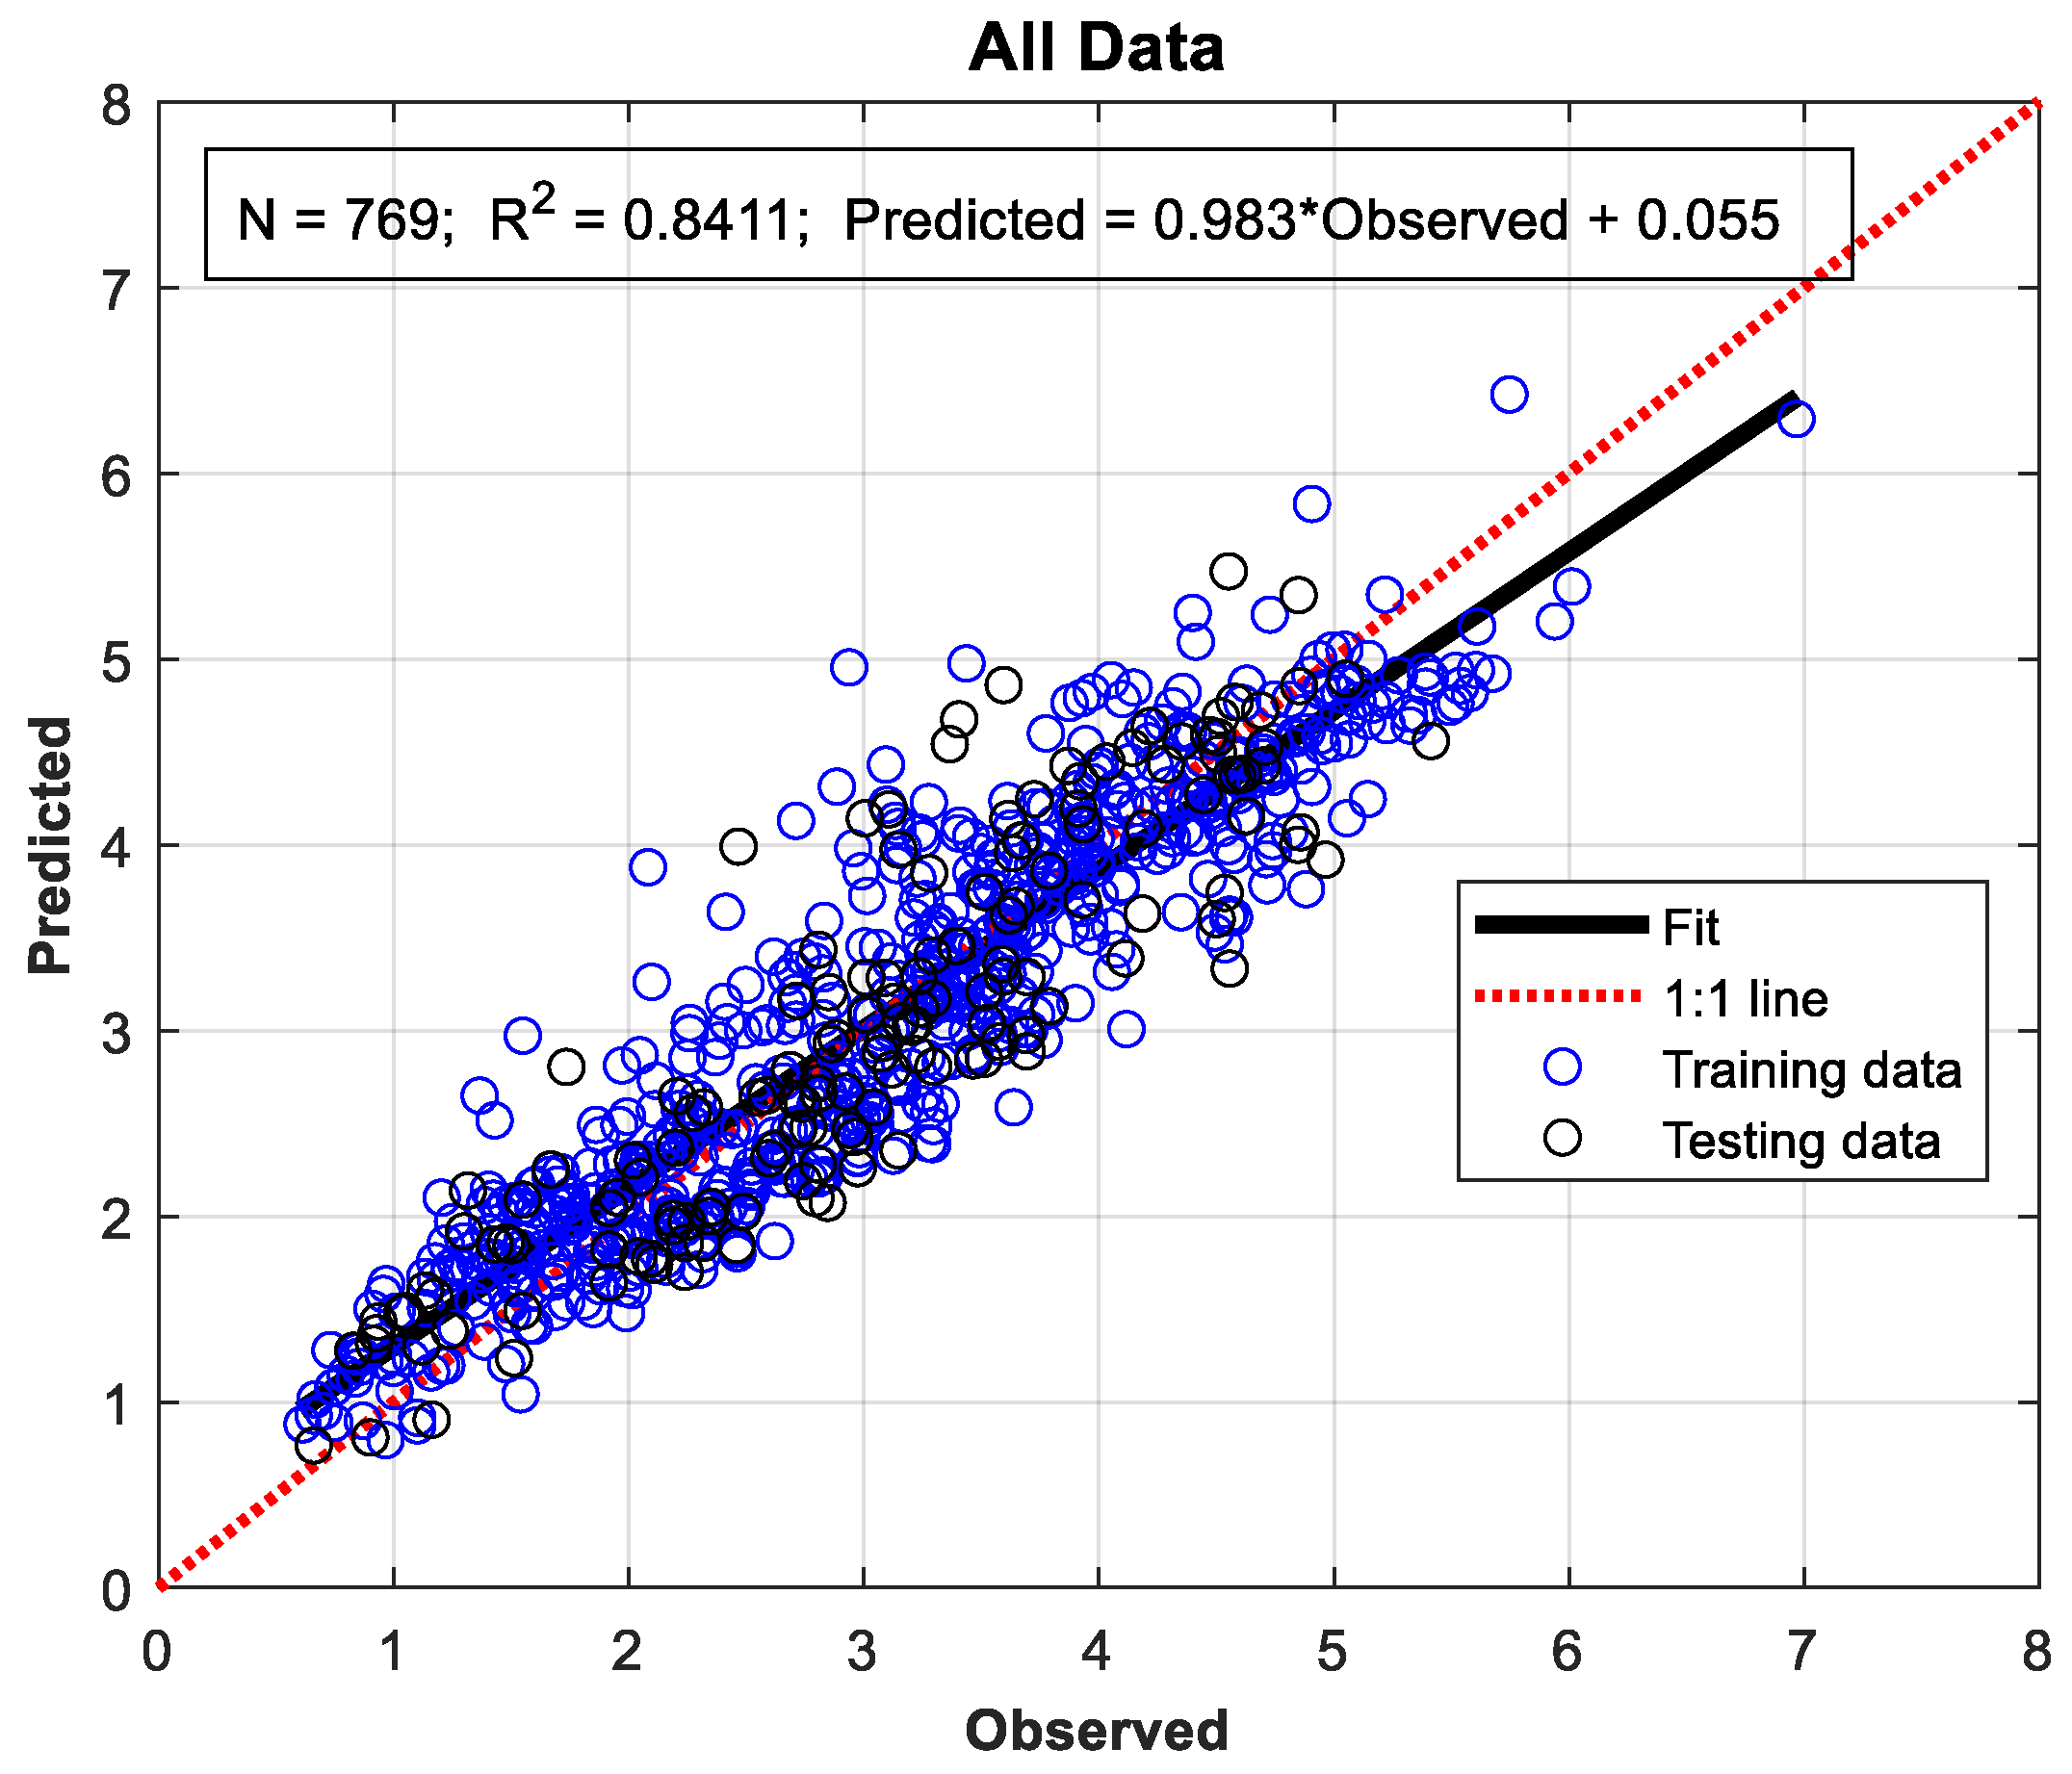
3.1.2. Scenario II
4. Discussion
5. Conclusions
Author Contributions
Funding
Institutional Review Board Statement
Informed Consent Statement
Data Availability Statement
Conflicts of Interest
References
- Kumar, M.; Raghuwanshi, N.S.; Singh, R. Artificial Neural Networks Approach in Evapotranspiration Modeling: A Review. Irrig. Sci. 2011, 29, 11–25. [Google Scholar] [CrossRef]
- Allen, R.G.; Pereira, L.S.; Raes, D.; Smith, M. Crop Evapotranspiration Guidelines for Computing Crop Water Requirements; FAO Irrigation and Drainage Paper 56; FAO: Rome, Italy, 1998. [Google Scholar]
- Rawat, K.S.; Bala, A.; Singh, S.K.; Pal, R.K. Quantification of Wheat Crop Evapotranspiration and Mapping: A Case Study from Bhiwani District of Haryana, India. Agric. Water Manag. 2017, 187, 200–209. [Google Scholar] [CrossRef]
- Gharbia, S.S.; Smullen, T.; Gill, L.; Johnston, P.; Pilla, F. Spatially Distributed Potential Evapotranspiration Modeling and Climate Projections. Sci. Total Environ. 2018, 633, 571–592. [Google Scholar] [CrossRef] [PubMed]
- Alsenjar, O.; Cetin, M.; Aksu, H.; Akgul, M.A.; Golpinar, M.S. Cropping Pattern Classification Using Artificial Neural Networks and Evapotranspiration Estimation in the Eastern Mediterranean Region of Turkey. J. Agric. Sci. 2023, 29, 677–689. [Google Scholar] [CrossRef]
- Zhang, X.C.; Wu, J.W.; Wu, H.Y.; Li, Y. Simplified SEBAL Method for Estimating Vast Areal Evapotranspiration with MODIS Data. Water Sci. Eng. 2011, 4, 24–35. [Google Scholar] [CrossRef]
- Cetin, M.; Alsenjar, O.; Aksu, H.; Golpinar, M.S.; Akgul, M.A. Comparing Actual Evapotranspiration Estimations by METRIC to In-situ Water Balance Measurements Over an Irrigated Field in Turkey. Hydrol. Sci. J. 2023, 68, 1162–1183. [Google Scholar] [CrossRef]
- Bastiaanssen, W.G.M.; Menenti, M.; Feddes, R.A.; Holtslag, A.A.M. A Remote Sensing Surface Energy Balance Algorithm for Land (SEBAL): 1. Formulation. J. Hydrol. 1998, 212–213, 198–212. [Google Scholar] [CrossRef]
- Bastiaanssen, W.G.M.; Pelgrum, H.; Wang, J.; Ma, Y.; Moreno, J.F.; Roerink, G.J.; van der Wal, T. A Surface Energy Balance Algorithm For Land (SEBAL): 2. Validation. J. Hydrol. 1998, 212–213, 213–229. [Google Scholar] [CrossRef]
- Allen, R.; Tasumi, M.; Morse, A.; Trezza, R.; Wright, J.L.; Bastiaanssen, W.; Kramber, W.; Lorite, L.; Robison, C.W. Satellite-Based Energy Balance for Mapping Evapotranspiration with Internalized Calibration, METRIC (applications). J. Irrig. Drain. Eng. 2007, 133, 395–406. [Google Scholar] [CrossRef]
- Allen, R.G.; Tasumi, M.; Trezza, R. Satellite-Based Energy Balance for Mapping Evapotranspiration with Internalized Calibration, METRIC (model). J. Irrig. Drain. Eng. 2007, 133, 380–394. [Google Scholar] [CrossRef]
- Su, Z. The Surface Energy Balance System (SEBS) for Estimation of Turbulent Heat Fluxes. Hydrol. Earth Syst. Sci. 2002, 6, 85–100. [Google Scholar] [CrossRef]
- Bachour, R.; Walker, W.; Ticlavilca, A.; McKee, M.; Maslova, I. Estimation of Spatially Distributed Evapotranspiration Using Remote Sensing and A Relevance Vector Machine. J. Irrig. Drain. Eng. 2014, 140, 04014029. [Google Scholar] [CrossRef]
- Singh, R.K.; Irmak, A. Treatment of Anchor Pixels in the METRIC Model for Improved Estimation of Sensible and Latent Heat Fluxes. Hydrol. Sci. J. 2011, 56, 895–906. [Google Scholar] [CrossRef]
- ASCE Task Committee on Application of Neural Networks in Hydrology. Artificial Neural Network in Hydrology. I: Preliminary Concepts. J. Hydrol. Eng. 2000, 5, 115–123. [Google Scholar] [CrossRef]
- ASCE Task Committee on Application of Neural Networks in Hydrology. Artificial Neural Network in Hydrology. II: Hydrologic Application. J. Hydrol. Eng. 2000, 5, 124–137. [Google Scholar] [CrossRef]
- Bruton, J.M.; McClendon, R.W.; Hoogenboom, G. Estimating Daily Pan Evaporation with Artificial Neural Networks. Trans. 2000, 43, 491–496. [Google Scholar] [CrossRef]
- Odhiambo, L.O.; Yoder, R.E.; Yoder, D.C.; Hines, J.W. Optimization of Fuzzy Evapotranspiration Model Through Neural Training with Input-Output Examples. Trans. ASAE 2001, 44, 1625–1633. [Google Scholar] [CrossRef]
- Kumar, M.; Raghuwanshi, N.; Singh, R.; Wallender, W.W.; Pruitt, W.O. Estimating Evapotranspiration Using Artificial Neural Network. J. Irrig. Drain. Eng. 2002, 128, 224–233. [Google Scholar] [CrossRef]
- Dehbozorgi, F.; Sepaskhah, A.R. Comparison of Artificial Neural Networks and Prediction Models for Reference Evapotranspiration Estimation in a Semi-Arid Region. Arch. Agron. Soil. Sci. 2011, 58, 477–497. [Google Scholar] [CrossRef]
- Khoshhal, J.; Mokarram, M. Model for Prediction of Evapotranspiration Using MLP Neural Network. Inter. J. Environ. Sci. 2012, 3, 1000–1009. [Google Scholar]
- Abrishami, N.; Sepaskhah, A.R.; Shahrokhnia, M.H. Estimating Wheat and Maize Daily Evapotranspiration Using Artificial Neural Network. Theoret Appl. Climatol. 2019, 135, 945–958. [Google Scholar] [CrossRef]
- Yamac, S.S.; Todorovic, M. Estimation of Daily Potato Crop Evapotranspiration Using Three Different Machine Learning Algorithms and Four Scenarios of Available Meteorological Data. Agric. Water Manag. 2020, 228, 105875. [Google Scholar] [CrossRef]
- Virnodkar, S.S.; Pachghare, V.K.; Patil, V.C.; Jha, S.K. Application of machine learning on remote sensing data for sugarcane crop classification: A review. In ICT Analysis and Applications. Lecture Notes in Networks and Systems; Fong, S., Dey, N., Joshi, A., Eds.; Springer: Singapore, 2020; Volume 93. [Google Scholar] [CrossRef]
- Olmedo, G.F.; Ortega-farias, S.; Fonseca-luengo, D. Tools and Functions to Estimate Actual Evapotranspiration Using Land Water: Toolsand Functions to Estimate Actual Evapotranspiration Using Land Surface Energy Balance Models. R J. 2016, 8, 352. [Google Scholar] [CrossRef]
- Bhattarai, N.; Quackenbush, L.J.; Im, J.; Shaw, S.B. A New Optimized Algorithm for Automating Endmember Pixel Selection in the SEBAL and METRIC Models. Remote Sens. Environ. 2017, 196, 178–192. [Google Scholar] [CrossRef]
- Jain, S.K.; Nayak, P.C.; Sudheer, K.P. Models for Estimating Evapotranspiration Using Artificial Neural Networks, and Their Physical Interpretation. Hydrol. Process. 2008, 22, 2225–2234. [Google Scholar] [CrossRef]
- Coppola, E., Jr.; Szidarovszky, F.; Poulton, M.; Charles, E. Artificial Neural Network Approach for Predicting Transient Water Levels in a Multilayered Groundwater System Under Variable State, Pumping, and Climate Conditions. J. Hydrol. Eng. 2003, 8, 348–360. [Google Scholar] [CrossRef]
- Daliakopoulos, I.N.; Coulibaly, P.; Tsanis, I.K. Groundwater Level Forecasting Using Artificial Neural Networks. J. Hydrol. 2005, 309, 229–240. [Google Scholar] [CrossRef]
- Karahan, H.; Iplikci, S.; Yasar, M.; Gurarslan, G. River Flow Estimation from Upstream Flow Records Using Support Vector Machines. J. Appl. Math. 2014, 2014, 714213. [Google Scholar] [CrossRef]
- Luk, K.C.; Ball, J.E.; Sharma, A. A Study of Optimal Model Lag and Spatial Inputs to Artificial Neural Network for Rainfall Forecasting. J. Hydrol. 2000, 227, 56–65. [Google Scholar] [CrossRef]
- Garcia, L.A.; Shigidi, A. Using Neural Networks for Parameter Estimation in Groundwater. J. Hydrol. 2006, 318, 215–231. [Google Scholar] [CrossRef]
- Granata, F. Evapotranspiration Evaluation Models Based on Machine Learning Algorithms: A Comparative Study. Agric. Water Manag. 2019, 217, 303–315. [Google Scholar] [CrossRef]
- Tikhamarine, Y.; Malik, A.; Kumar, A.; Souag-Gamane, D.; Kisi, O. Estimation of Monthly Reference Evapotranspiration Using Novel Hybrid Machine Learning Approaches. Hydrol. Sci. J. 2019, 64, 1824–1842. [Google Scholar] [CrossRef]
- Madugundu, R.; Al-Gaadi, K.A.; Tola, E.; Hassaballa, A.A.; Patil, V.C. Performance of the METRIC Model in Estimating Evapotranspiration Fluxes Over an Irrigated Field in Saudi Arabia Using Landsat-8 Images. Hydrol. Earth Syst. Sci. 2017, 21, 6135–6151. [Google Scholar] [CrossRef]
- Tang, D.; Feng, Y.; Gong, D.; Hao, W.; Cui, N. Evaluation of Artificial Intelligence Models for Actual Crop Evapotranspiration Modeling in Mulched and Non-mulched Maize Croplands. Comput. Electron. Agric. 2018, 152, 375–384. [Google Scholar] [CrossRef]
- Karahan, H.; Ayvaz, M.T. Simultaneous Parameter Identification of a Heterogeneous Aquifer System Using Artificial Neural Networks. Hydrogeol. J. 2008, 16, 817–827. [Google Scholar] [CrossRef]
- Maier, H.R.; Dandy, G.C. Neural Networks for the Prediction and Forecasting of Water Resources Variables: A Review of Modelling Issues and Applications. Environ. Model. Softw. 2000, 15, 101–124. [Google Scholar] [CrossRef]
- Antonopoulos, V.Z.; Antonopoulos, A.V. Daily Reference Evapotranspiration Estimates by Artificial Neural Networks Technique and Empirical Equations Using Limited Input Climate. Comput. Electron. Agric. 2017, 132, 86–96. [Google Scholar] [CrossRef]
- Ferreira, L.B.; Cunha, F.F. New Approach to Estimate Daily Reference Evapotranspiration Based on Hourly Temperature and Relative Humidity Using Machine Learning and Deep Learning. Agric. Water Manag. 2020, 234, 106–113. [Google Scholar] [CrossRef]
- Mattar, M.A. Using Gene Expression Programming in Monthly Reference Evapotranspiration Modeling: A Case Study in Egypt. Agric. Water Manag. 2018, 198, 28–38. [Google Scholar] [CrossRef]
- Santos, P.A.B.; Schwerz, F.; Carvalho, L.G.; Baptista, V.B.S.; Marin, D.B.; Ferraz, G.A.S.; Rossi, G.; Conti, L.; Bambi, G. Machine Learning and Conventional Methods for Reference Evapotranspiration Estimation Using Limited-Climatic-Data Scenarios. Agronomy 2023, 13, 2366. [Google Scholar] [CrossRef]
- Chen, X.; Yu, S.; Zhang, H.; Li, F.; Liang, C.; Wang, Z. Estimating the Actual Evapotranspiration Using Remote Sensing and SEBAL Model in an Arid Environment of Northwest China. Water 2023, 15, 1555. [Google Scholar] [CrossRef]
- Abdel-Fattah, M.K.; Kotb Abd-Elmabod, S.; Zhang, Z.; Merwad, A.R.M.A. Exploring the Applicability of Regression Models and Artificial Neural Networks for Calculating Reference Evapotranspiration in Arid Regions. Sustainability 2023, 15, 15494. [Google Scholar] [CrossRef]


| Image | Day of the Year (DOY) | Landsat Scene-ID | Satellite Type | Cloud Cover (%) | Acquisition Dates | Overpass Local Time (AM) |
|---|---|---|---|---|---|---|
| 1 | 260 | LC81750342020260LGN00 | Landsat 8 | 1 | 16 September 2020 | 11:15:56.5028510 |
| 2 | 300 | LE71750342020300SG100 | Landsat 7 | 8 | 26 October 2020 | 10:38:56.1154274 |
| 3 | 316 | LE71750342020316NPA00 | Landsat 7 | 3 | 11 November 2020 | 10:37:51.0228172 |
| 4 | 364 | LE71750342020364NPA00 | Landsat 7 | 1 | 29 December 2020 | 10:34:21.8153233 |
| 5 | 22 | LC81750342021022LGN00 | Landsat 8 | 9 | 22 January 2021 | 11:15:49.9861710 |
| 6 | 54 | LC81750342021054LGN00 | Landsat 8 | 7 | 23 February 2021 | 11:15:43.2139690 |
| 7 | 79 | LE71750342021078SG100 | Landsat 7 | 5 | 19 March 2020 | 10:28:24.8443048 |
| 8 | 118 | LC81750342021118LGN00 | Landsat 8 | 8 | 28 April 2021 | 11:15:15.8809360 |
| 9 | 134 | LC81750342021134LGN00 | Landsat 8 | 1 | 14 May 2021 | 11:15:15.9098560 |
| 10 | 158 | LE71750342021158SG100 | Landsat 7 | 1 | 7 June 2021 | 10:21:43.6865663 |
| 11 | 182 | LC81750342021182LGN00 | Landsat 8 | 4 | 1 July 2021 | 11:15:35.1871370 |
| 12 | 190 | LE71750342021190SG100 | Landsat 7 | 3 | 9 July 2021 | 10:19:04.5579664 |
| 13 | 198 | LC81750342021198LGN00 | Landsat 8 | 5 | 17 July 2021 | 11:15:36.9021800 |
| 14 | 214 | LC81750342021214LGN00 | Landsat 8 | 0 | 2 August 2021 | 11:15:45.3409259 |
| 15 | 230 | LC81750342021230LGN00 | Landsat 8 | 2 | 18 August 2021 | 11:15:51.0643500 |
| 16 | 262 | LC81750342021262LGN00 | Landsat 8 | 9 | 19 September 2021 | 11:15:59.0216650 |
| 17 | 278 | LC81750342021278LGN00 | Landsat 8 | 1 | 5 October 2021 | 11:16:04.4435930 |
| 18 | 294 | LC81750342021294LGN00 | Landsat8 | 0 | 21 October 2021 | 11:16:07.4309270 |
| 19 | 326 | LC81750342021326LGN00 | Landsat 8 | 6 | 22 November 2021 | 11:16:02.0432969 |
| 20 | 358 | LC81750342021358LGN00 | Landsat 8 | 4 | 24 December 2021 | 11:15:59.4307040 |
| 21 | 001 | LE71750342022001NPA00 | Landsat 7 | 13 | 1 January 2022 | 10:03:01.7753300 |
| 22 | 017 | LE71750342022017NPA00 | Landsat 7 | 3 | 17 January 2022 | 10:01:30.1854341 |
| 23 | 049 | LE71750342022049NPA00 | Landsat 7 | 6 | 18 February 2022 | 09:58:18.1083401 |
| 24 | 081 | LE71750342022081NPA00 | Landsat 7 | 19 | 22 March 2022 | 09:55:10.7155745 |
| 25 | 089 | LC81750342022089LGN00 | Landsat 8 | 7 | 30 March 2022 | 11:15:25.6965150 |
| 26 | 113 | LC91750342022113LGN00 | Landsat 9 | 2 | 23 April 2022 | 11:15:26.7327310 |
| 27 | 121 | LC81750342022121LGN00 | Landsat 8 | 60 | 1 May 2022 | 11:15:28.7371250 |
| 28 | 140 | LE71750342022140SG100 | Landsat 7 | 12 | 20 May 2022 | 09:50:56.6332014 |
| 29 | 157 | LE71750342022157SG100 | Landsat 7 | 23 | 6 June 2022 | 09:50:06.2292853 |
| 30 | 169 | LC81750342022169LGN00 | Landsat 8 | 1 | 18 June 2022 | 11:15:53.3072380 |
| 31 | 186 | LE71750342022186SG100 | Landsat 7 | 0 | 5 July 2022 | 09:42:29.8002719 |
| 32 | 201 | LC81750342022201LGN00 | Landsat 8 | 1 | 20 July 2022 | 11:15:58.6410700 |
| 33 | 209 | LC91750342022209LGN00 | Landsat 9 | 0 | 28 July 2022 | 11:15:42.4933480 |
| 34 | 220 | LE71750342022220SG100 | Landsat 7 | 29 | 8 August 2022 | 09:39:50.3921524 |
| 35 | 237 | LE71750342022237SG100 | Landsat 7 | 9 | 25 August 2022 | 09:38:18.9640686 |
| 36 | 249 | LC81750342022249LGN00 | Landsat 8 | 8 | 06 September 2022 | 11:16:15.2109079 |
| 37 | 271 | LE71750342022271SG100 | Landsat 7 | 3 | 28 September 2022 | 09:34:51.9536731 |
| 38 | 297 | LC81750342022297LGN00 | Landsat 8 | 0 | 24 October 2022 | 11:16:18.0041120 |
| MODIS Standard Products | Parameter | Spatial Resolution | Temporal Resolution |
|---|---|---|---|
| MOD09GA-Terra | NDVI | 500 m by 500 m | Daily |
| MOD11A1.061-Terra | LST | 1000 m by 1000 m | Daily |
Disclaimer/Publisher’s Note: The statements, opinions and data contained in all publications are solely those of the individual author(s) and contributor(s) and not of MDPI and/or the editor(s). MDPI and/or the editor(s) disclaim responsibility for any injury to people or property resulting from any ideas, methods, instructions or products referred to in the content. |
© 2024 by the authors. Licensee MDPI, Basel, Switzerland. This article is an open access article distributed under the terms and conditions of the Creative Commons Attribution (CC BY) license (https://creativecommons.org/licenses/by/4.0/).
Share and Cite
Karahan, H.; Cetin, M.; Can, M.E.; Alsenjar, O. Developing a New ANN Model to Estimate Daily Actual Evapotranspiration Using Limited Climatic Data and Remote Sensing Techniques for Sustainable Water Management. Sustainability 2024, 16, 2481. https://doi.org/10.3390/su16062481
Karahan H, Cetin M, Can ME, Alsenjar O. Developing a New ANN Model to Estimate Daily Actual Evapotranspiration Using Limited Climatic Data and Remote Sensing Techniques for Sustainable Water Management. Sustainability. 2024; 16(6):2481. https://doi.org/10.3390/su16062481
Chicago/Turabian StyleKarahan, Halil, Mahmut Cetin, Muge Erkan Can, and Omar Alsenjar. 2024. "Developing a New ANN Model to Estimate Daily Actual Evapotranspiration Using Limited Climatic Data and Remote Sensing Techniques for Sustainable Water Management" Sustainability 16, no. 6: 2481. https://doi.org/10.3390/su16062481
APA StyleKarahan, H., Cetin, M., Can, M. E., & Alsenjar, O. (2024). Developing a New ANN Model to Estimate Daily Actual Evapotranspiration Using Limited Climatic Data and Remote Sensing Techniques for Sustainable Water Management. Sustainability, 16(6), 2481. https://doi.org/10.3390/su16062481