Article

Research on the Spatiotemporal Distribution of Railway Architectural Heritages Based on Heritage Database—Taking the Jinqin Section of the Peking–Mukden Railway as an Example

1
JangHo Architecture College, Northeastern University, Shenyang 110169, China
2
The Key Laboratory of Urban and Architectural Digital Technology, Shenyang 110169, China
*
Author to whom correspondence should be addressed.
Sustainability 2024, 16(6), 2466; https://doi.org/10.3390/su16062466
Submission received: 5 February 2024 / Revised: 12 March 2024 / Accepted: 13 March 2024 / Published: 15 March 2024
(This article belongs to the Section Tourism, Culture, and Heritage)

Abstract

:
This research analyzes the development and evolution of the Jinqin section of Peking–Mukden railway. Based on defining the scope of the study, the project to make “The List of Architectural Heritage of Jinqin section in Peking–Mukden Railway” is proposed. Data acquisition, data processing, and heritage information visualization are completed after the survey. ArcGIS was applied to build the database, which was used to analyze the spatiotemporal distribution. The following conclusions were obtained after analyzing spatial distribution characteristics, spatial agglomeration, and spatial equilibrium: ① The overall spatial distribution of architectural heritage is characterized by significant “cohesion”, while the three major categories of heritage in three time sections show obvious spatial distribution direction. ② The integral architectural heritage is characterized by an agglomeration pattern of six points connected by railway. ③ Both the integral heritage and the three major categories have a large gap in distribution, a low degree of balance, and a high degree of agglomeration. The research can support the study of regional protection strategy and sustainable use of railway architectural heritage.

1. Introduction

The Peking–Mukden Railway (also known as the “Beining Railway” or the “Pingfeng Railway”) originates from the earliest “Tangxu Railway” built by the China government in 1877. Through the line expansion of Tanglu, Jinyu, and Guanwai, the Liaoning Terminus was constructed in 1930, representing the completion of the Peking–Mukden Railway after 53 years of construction. Its management and name changed several times after that. Until the establishment of New China, it was renamed as the Beijing–Shenyang Railway. The Peking–Mukden Railway has witnessed the evolution of China’s modern regional political, social, economic, historical, and cultural history [1,2].
The Jinqin section of the Peking–Mukden Railway passes through Tianjin, Tangshan, and Qinhuangdao, with stations along the main line from Luofa Station in the west to Shanhaiguan Station in the east. The origin of the Peking–Mukden Railway is the Tangxu Railway, which was used to transport the coal from the Kailuan Coal Mine. The construction started in 1877 and opened to traffic in June 1881. Under the demand of regional political and socio-economic development, the railway gradually expanded and reached Tianjin in 1884. When the line extended to Shanhaiguan in 1894, the Jinqin section of the Peking–Mukden Railway was finished [1,2]. In the evolution of regional railway development, the Jinqin section was linked to the Tanggu Branch Line, Nanbu Branch Line, Tianjin Interchange North Ring Line, Jin-Ji Railway, and eight branch lines, such as the Qinshan Line, Peishui Line, Woluntuo Line, Nanlong Line, etc. In Hebei Province, several special lines for industry and mining were connected with the Jinqin section railway due to the regional industry and mining development [3,4]. The survey shows that the main line, branch line, special line, and other railways along the Jinqin section railway originally possessed a rich number of railway architectural heritage of all types and scales, which projected the history of modern railways along the Peking–Mukden Railway, the development of regional socio-economy and culture, the changes of humanities and natural geography, as well as the evolution of modern railway transportation technology.
In recent years, many valuable railway heritage buildings have been reconstructed or dismantled. The existing representative railway heritage urgently need preservation and revitalization as a vital part of the regional historical and cultural heritage. In this regard, to avoid the disappearance of architectural heritage resources of the Peking–Mukden Railway in the rapid urbanization and renewal of the railway network, it is necessary to conduct sustainable protection on representative railway architectural heritage.

2. Scope and Data

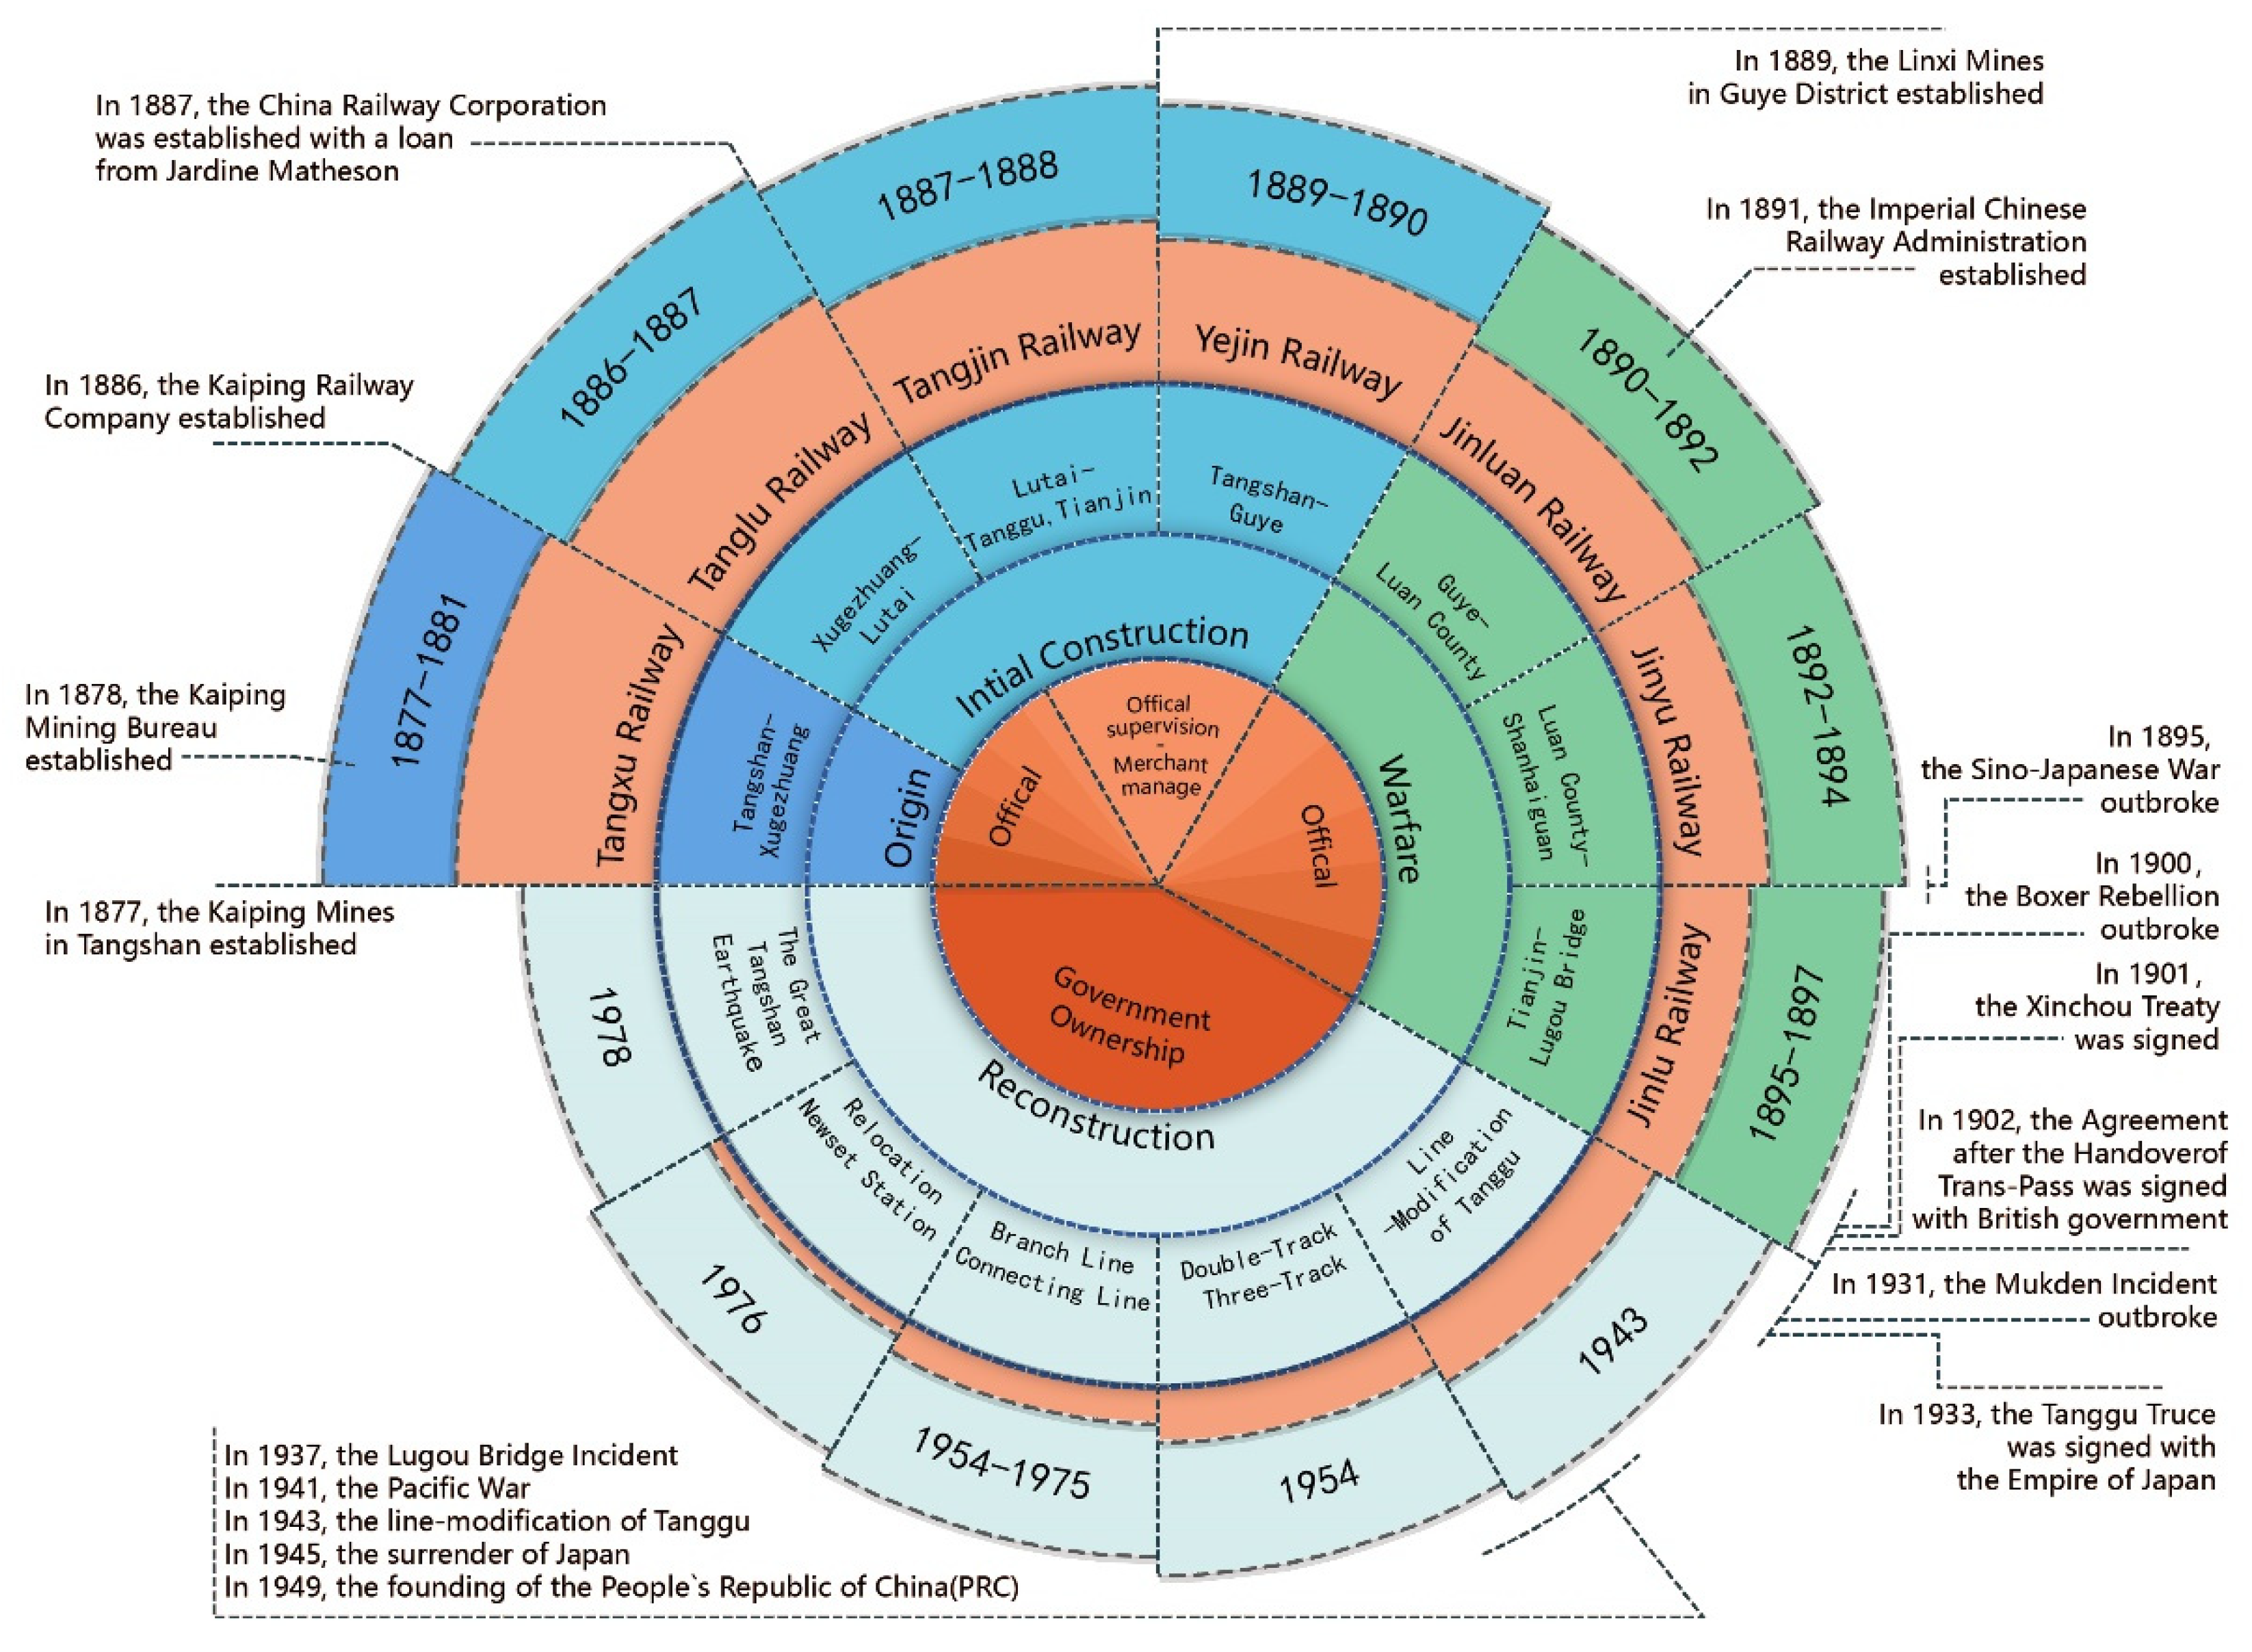
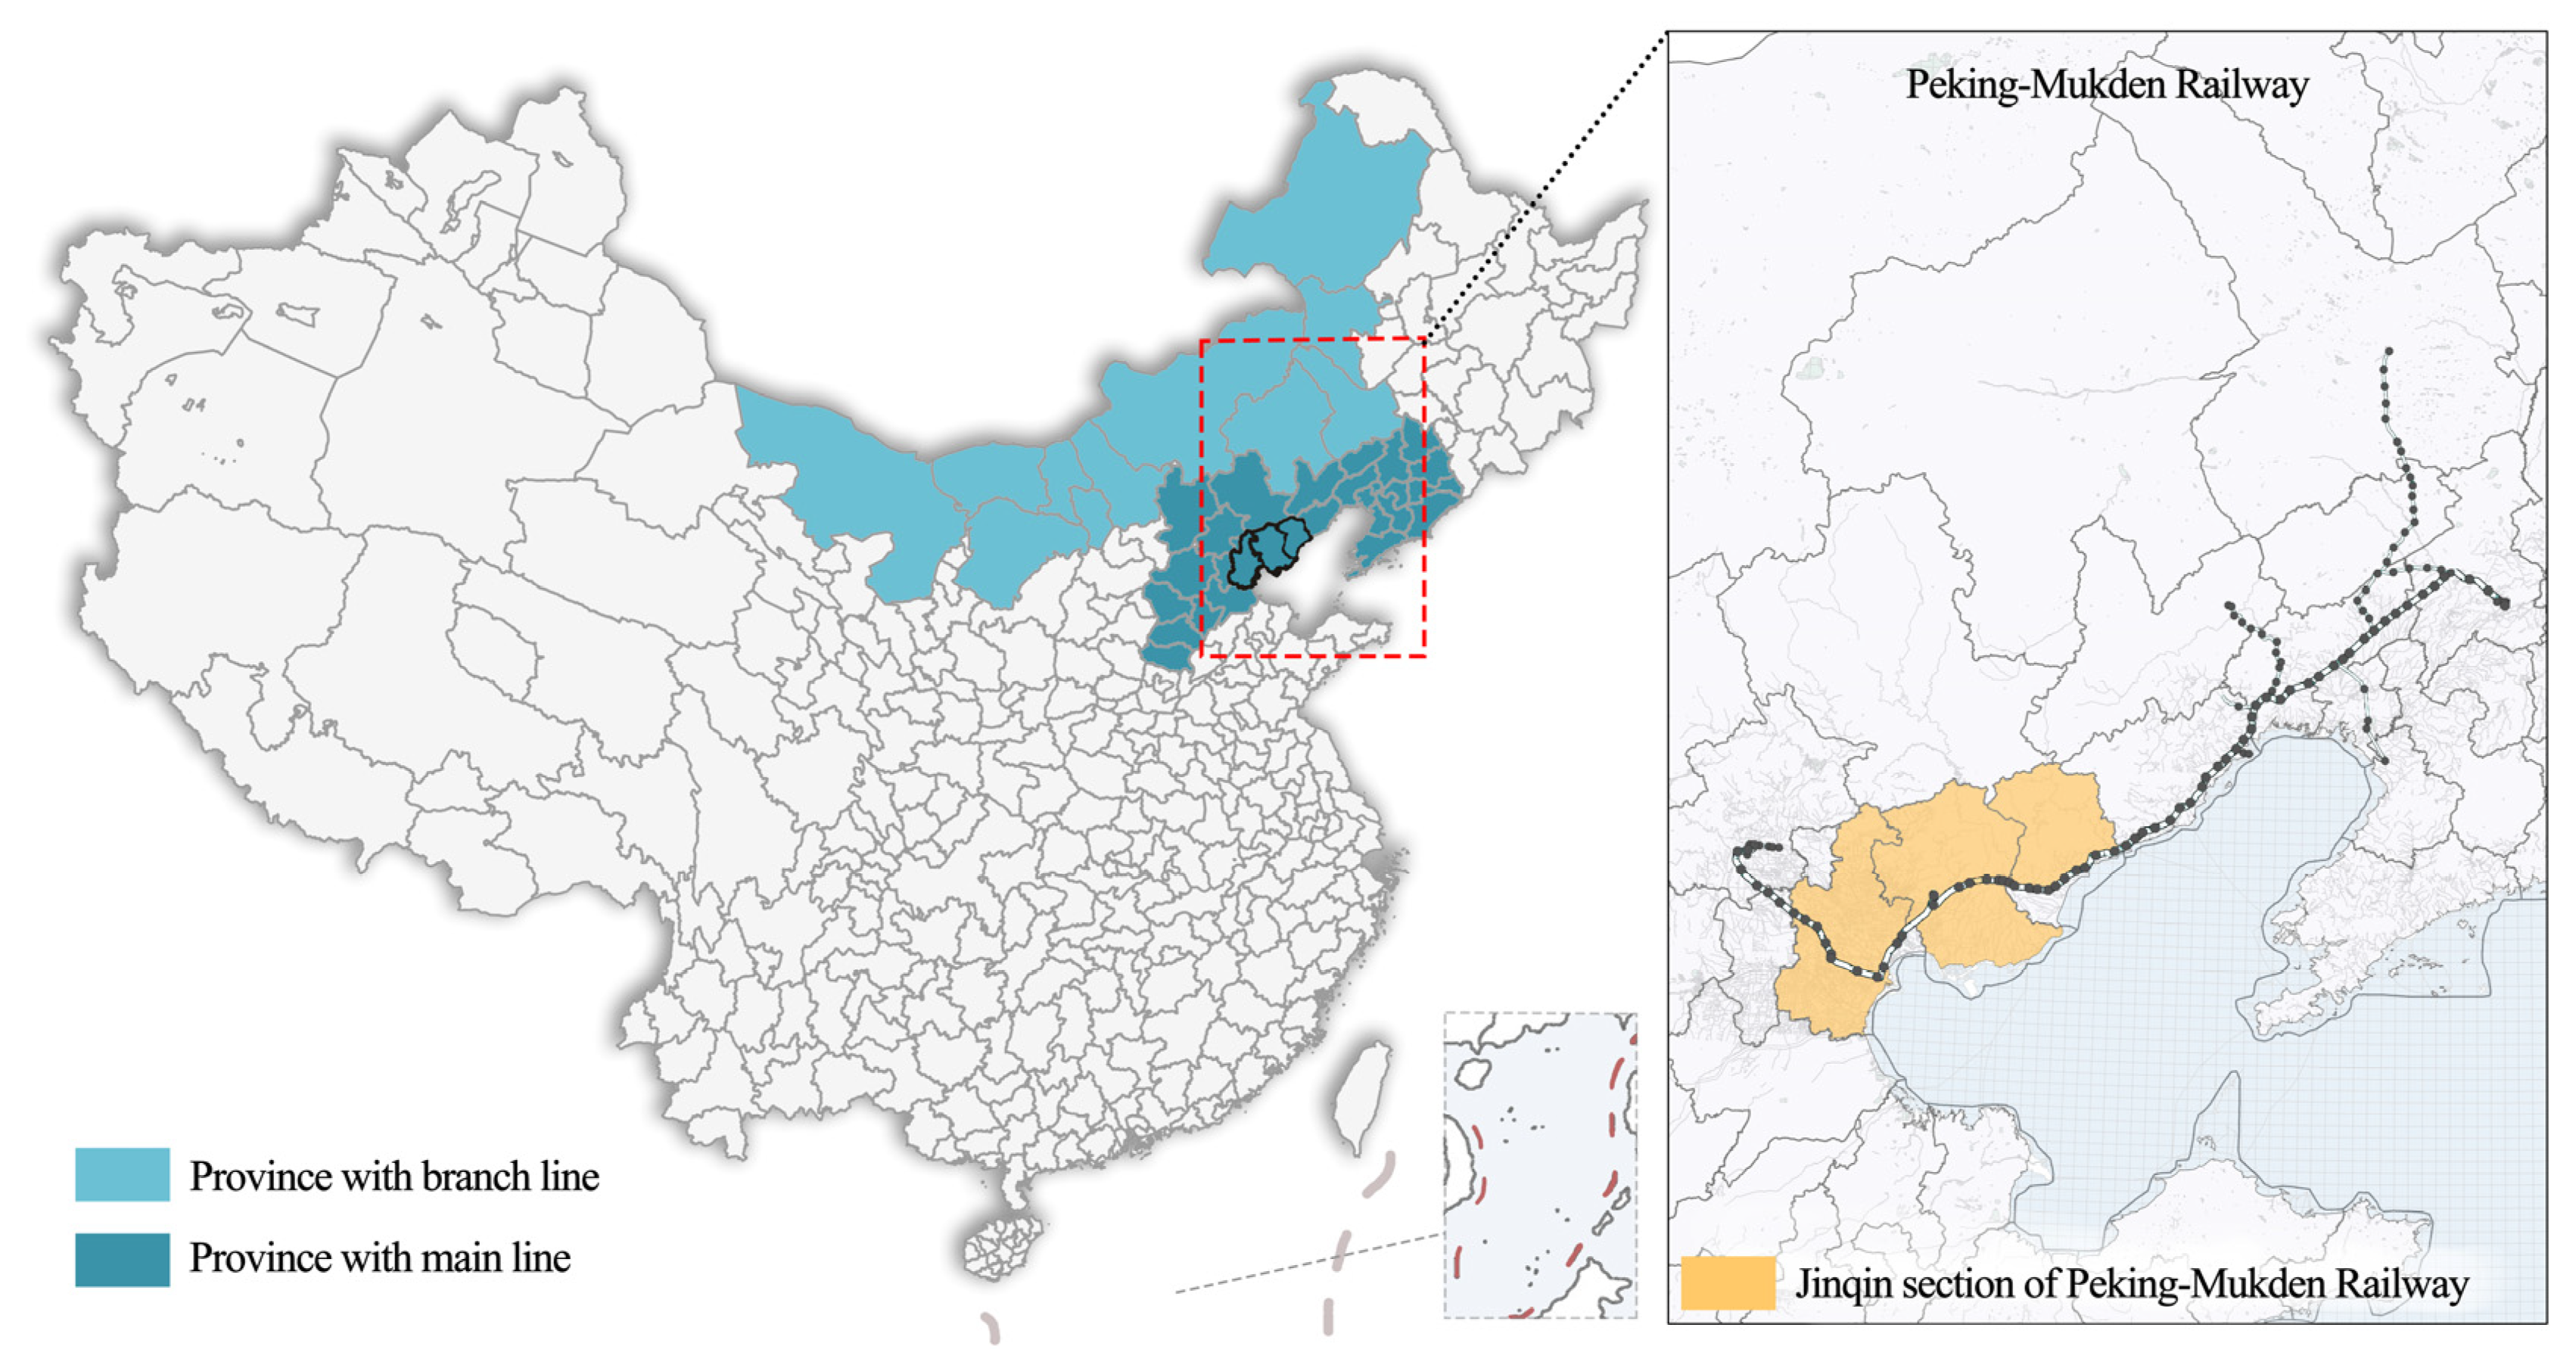
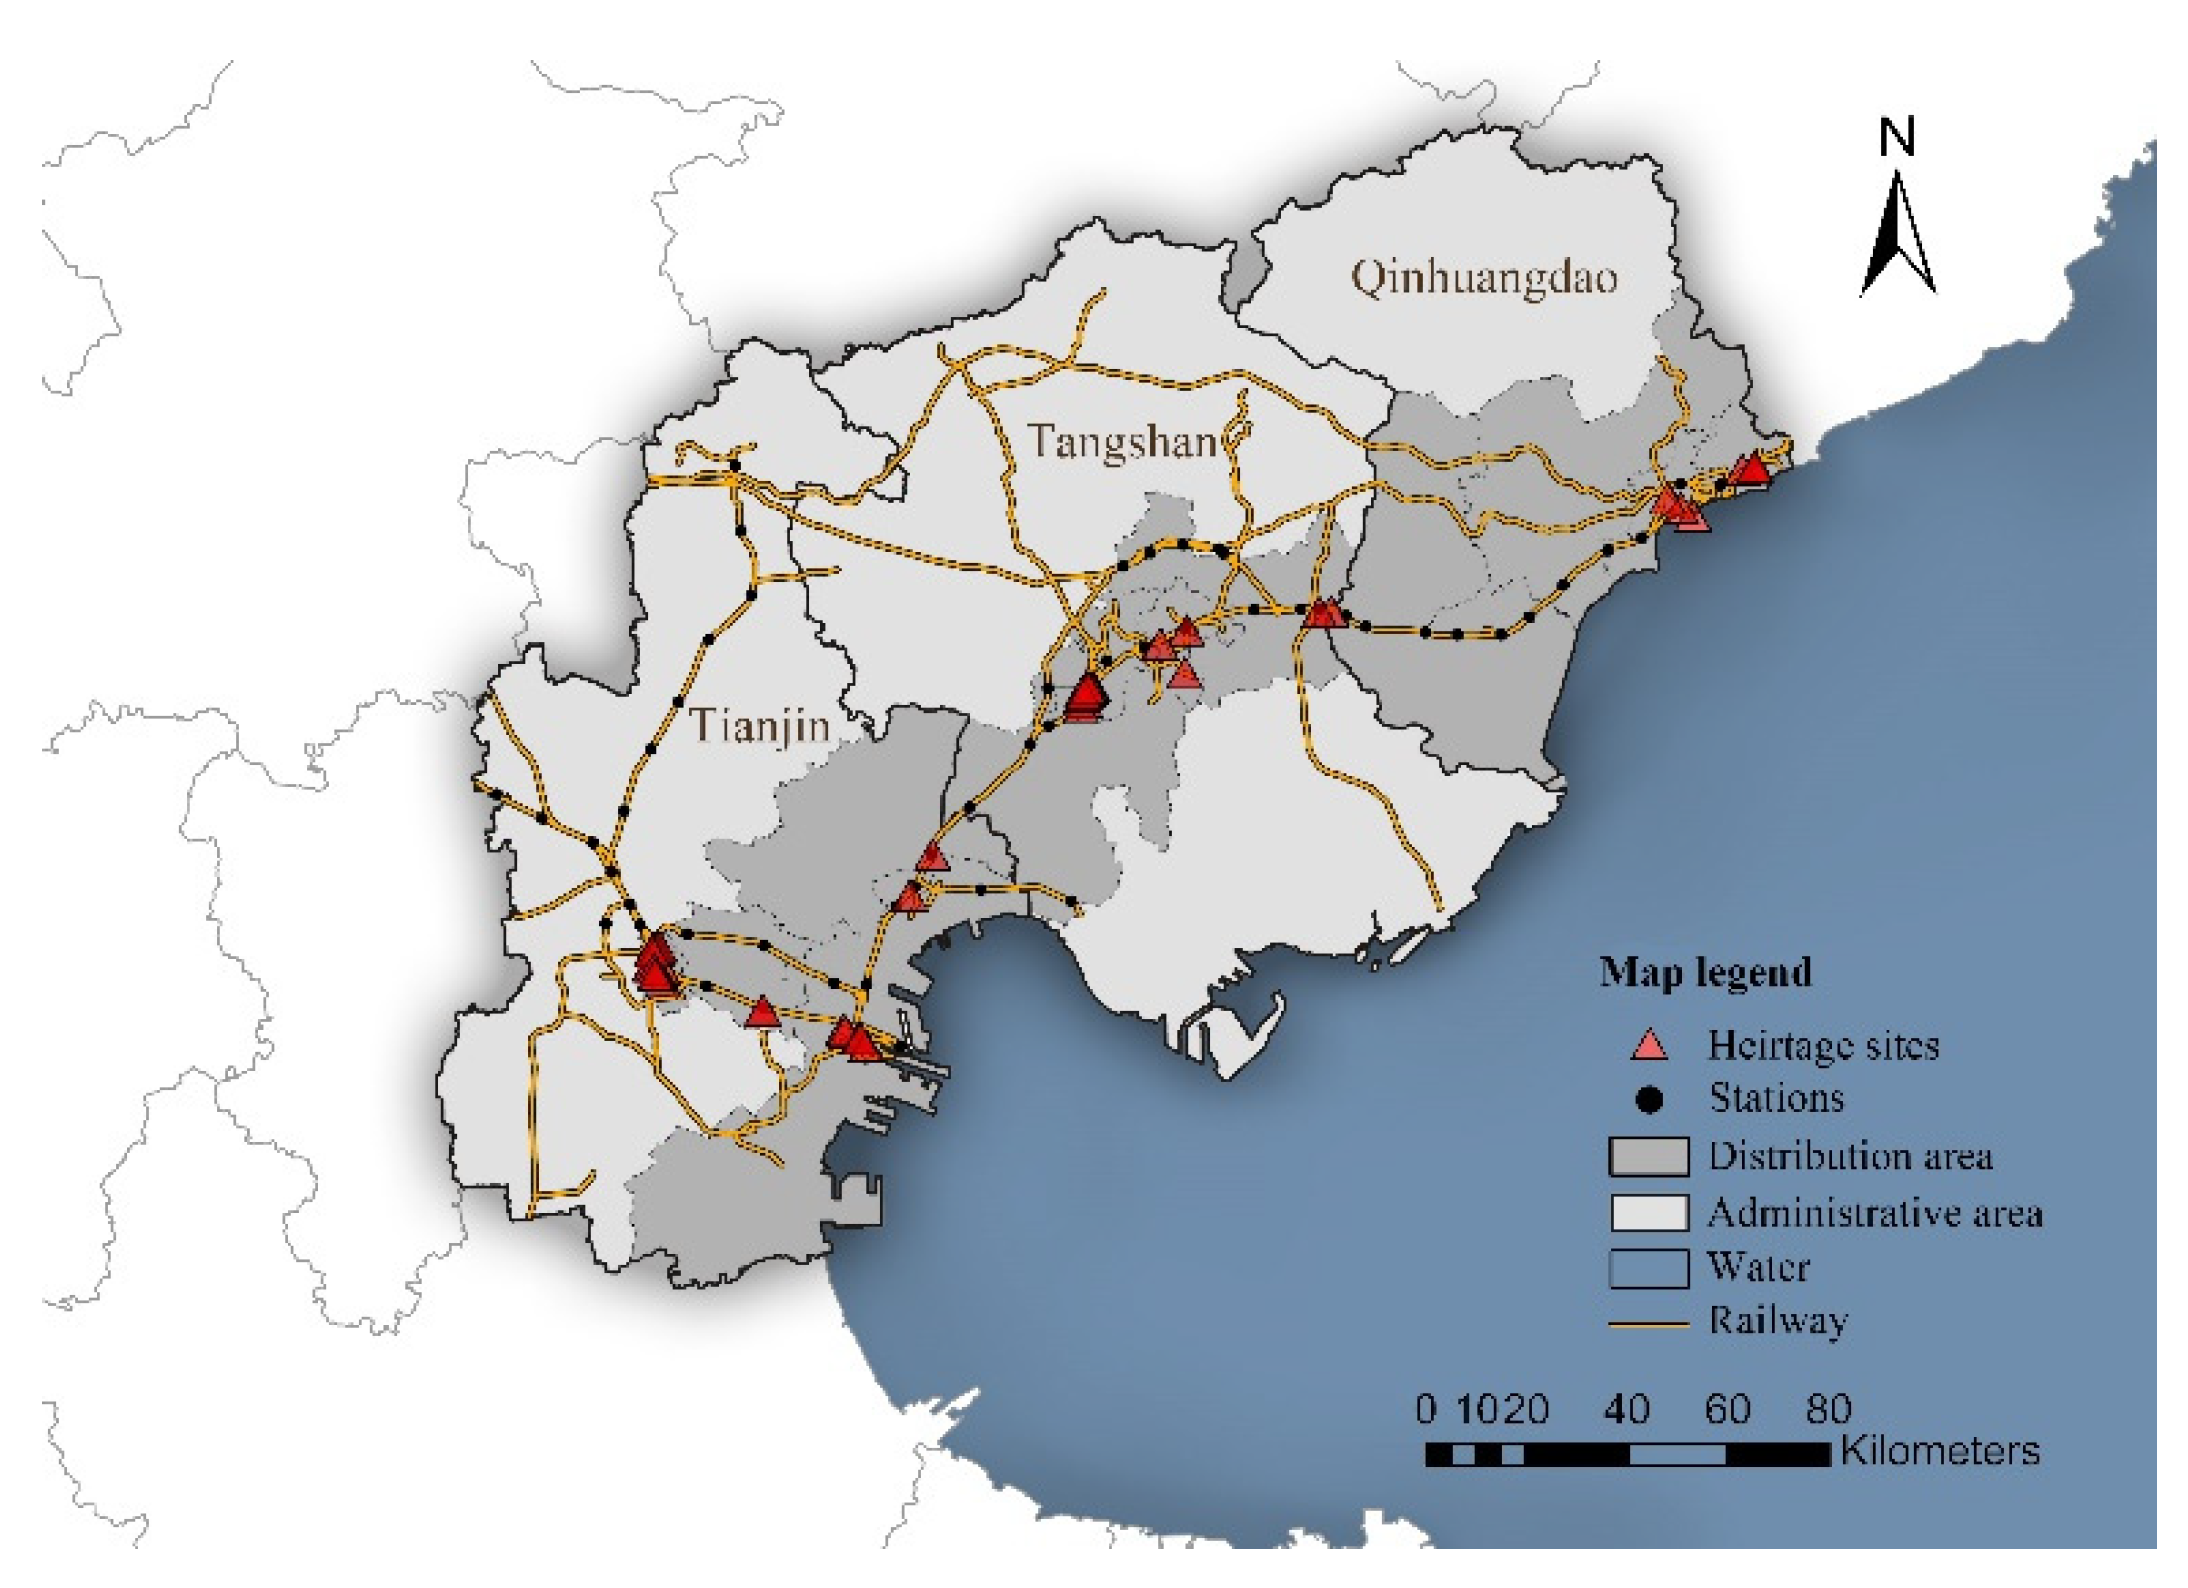
2.1. Research Scope and List of Heritage

The research of the Jinqin section of the Peking–Mukden Railway is defined in three aspects: time, space, and category.
In terms of the temporal scope, based on the historical evolution [5,6], this study defines the period of architectural heritage research of the Jinqin section of the Peking–Mukden Railway from 1881 to 1978, which can be divided into 3 periods. The first stage is the late Qing Dynasty (1877–1911), including the completion of the Tangxu Railway in 1877–1881. The construction of the railway and its ancillary buildings from Xugezhuang station to Tianjin station finished in 1886–1888. The eastern stations from Tangshan station to Shanhaiguan station was completed in 1889–1894. The second stage is the period of the Republic of China (ROC) (1911–1949). After the establishment of ROC, the Peking–Mukden Railway was renamed as Beining Railway, and then it underwent many changes in name and ownership, as well as destructions and reconstructions. The third stage is the period from the founding of the People’s Republic of China (PRC) to Reform and openness (1949–1978). After the establishment of the PRC, the Peking–Mukden Railway was renationalized, and renamed as Beijing-Shenyang Railway. During this period, the line has experienced a number of transformation and upgrading [7]. The temporal scope of the Jinqin section of the Peking–Mukden Railway is shown in Figure 1.
In terms of spatial scope, the Jinqin section of the Peking–Mukden Railway is divided into three sections. See Figure 2. The study establishes the spatial scope as the management space of the railway organization along the main line section, branch line sections, local special lines, and liaison lines belonging to the Tianjin section, the Tangshan section, and the Shanhaiguan section [7,8,9].
In terms of category, the architectural heritage is divided into three categories, namely “Main Buildings”, “Ancillary Buildings”, and “Structures”, according to the functional categories of the railway architectural heritage, and subdivided into 14 sub-categories and several sub-categories, as shown in Table 1.
Based on the scope mentioned before, three cities of Tianjin, Tangshan, and Qinhuangdao are set as the spatial analysis units. In total, 58 samples of railway architectural heritage were screened by literature research, network survey, and field survey (including on-site research and mapping), and then summarized and collated to form “The List of Railway Architectural Heritage of the Jinqin Section of the Peking–Mukden Railway” (see Table 2).
The railway architectural heritage is mainly distributed in the regions still served by stations and the railway management departments. Heritage has significant relevance both on special distribution and functional characteristics with stations. Statistical analysis shows that 45 existing heritage sites are distributed in the main line region, with 12 stations; 13 in branch line region, with 1 station; see Table 3.
Typologically, the Jinqin section covers 3 major categories and 11 sub-categories. Among them are 17 main buildings, 17 ancillary buildings, and 24 structures. An overview of the typology-quantity distribution of the railway architectural heritage is presented in Table 4.
Geographically, 32 heritage sites are distributed in Tianjin, 19 in Tangshan, and 7 in Qinhuangdao. In terms of temporal distribution, 37 heritage sites belong to the late Qing period (1881–1911); 13 belong to the modern Republican period (1911–1949); and 8 belong to the People’s Republic of China period (1949–1978). An overview of the spatiotemporal distribution is presented in Table 5.
In the statistics of the protection levels, 42 of the 58 case samples were included in the protection lists at all levels, and an overview is shown in Table 6.

2.2. Main Source of Data

2.2.1. Heritage Ontology Data Sources

The sources of heritage ontology data include the following: ① Anti-Japanese War and Modern Sino-Japanese Relations Documentary Data Platform, North China Transportation Archives, Wanfang Database, and other information databases. ② Official online data platforms such as Tianjin Urban Construction Archives and Hebei Provincial Urban Construction Archives. ③ Information of monographs and journals such as Journal of Tianjin Railway Branch, Journal of Beijing Railway Bureau, and Local Railways of Hebei Province. ④ Official public documents such as “List of Architectural Heritage in China”, “List of Industrial Heritage in China”, etc. issued jointly by China Heritage Society and Architectural Society of China in the past 22 years. ⑤ Spatial data information such as longitude and latitude coordinate points, elevation, and other spatial data for the positioning of the heritage, originated from Google Earth satellite maps and extracted by the Map API coordinate picker.

2.2.2. Sources of Heritage-Related Geographic Information Data

The heritage-related geographic information data required for the study, including remote sensing image data, DEM data, municipal administrative division data, traffic routes and supporting data, and land use status, were obtained from national database platforms such as the Platform for Resource and Environmental Science and Data Center, as well as data published on the official website of the municipal government, as shown in Table 7.

3. Methodology

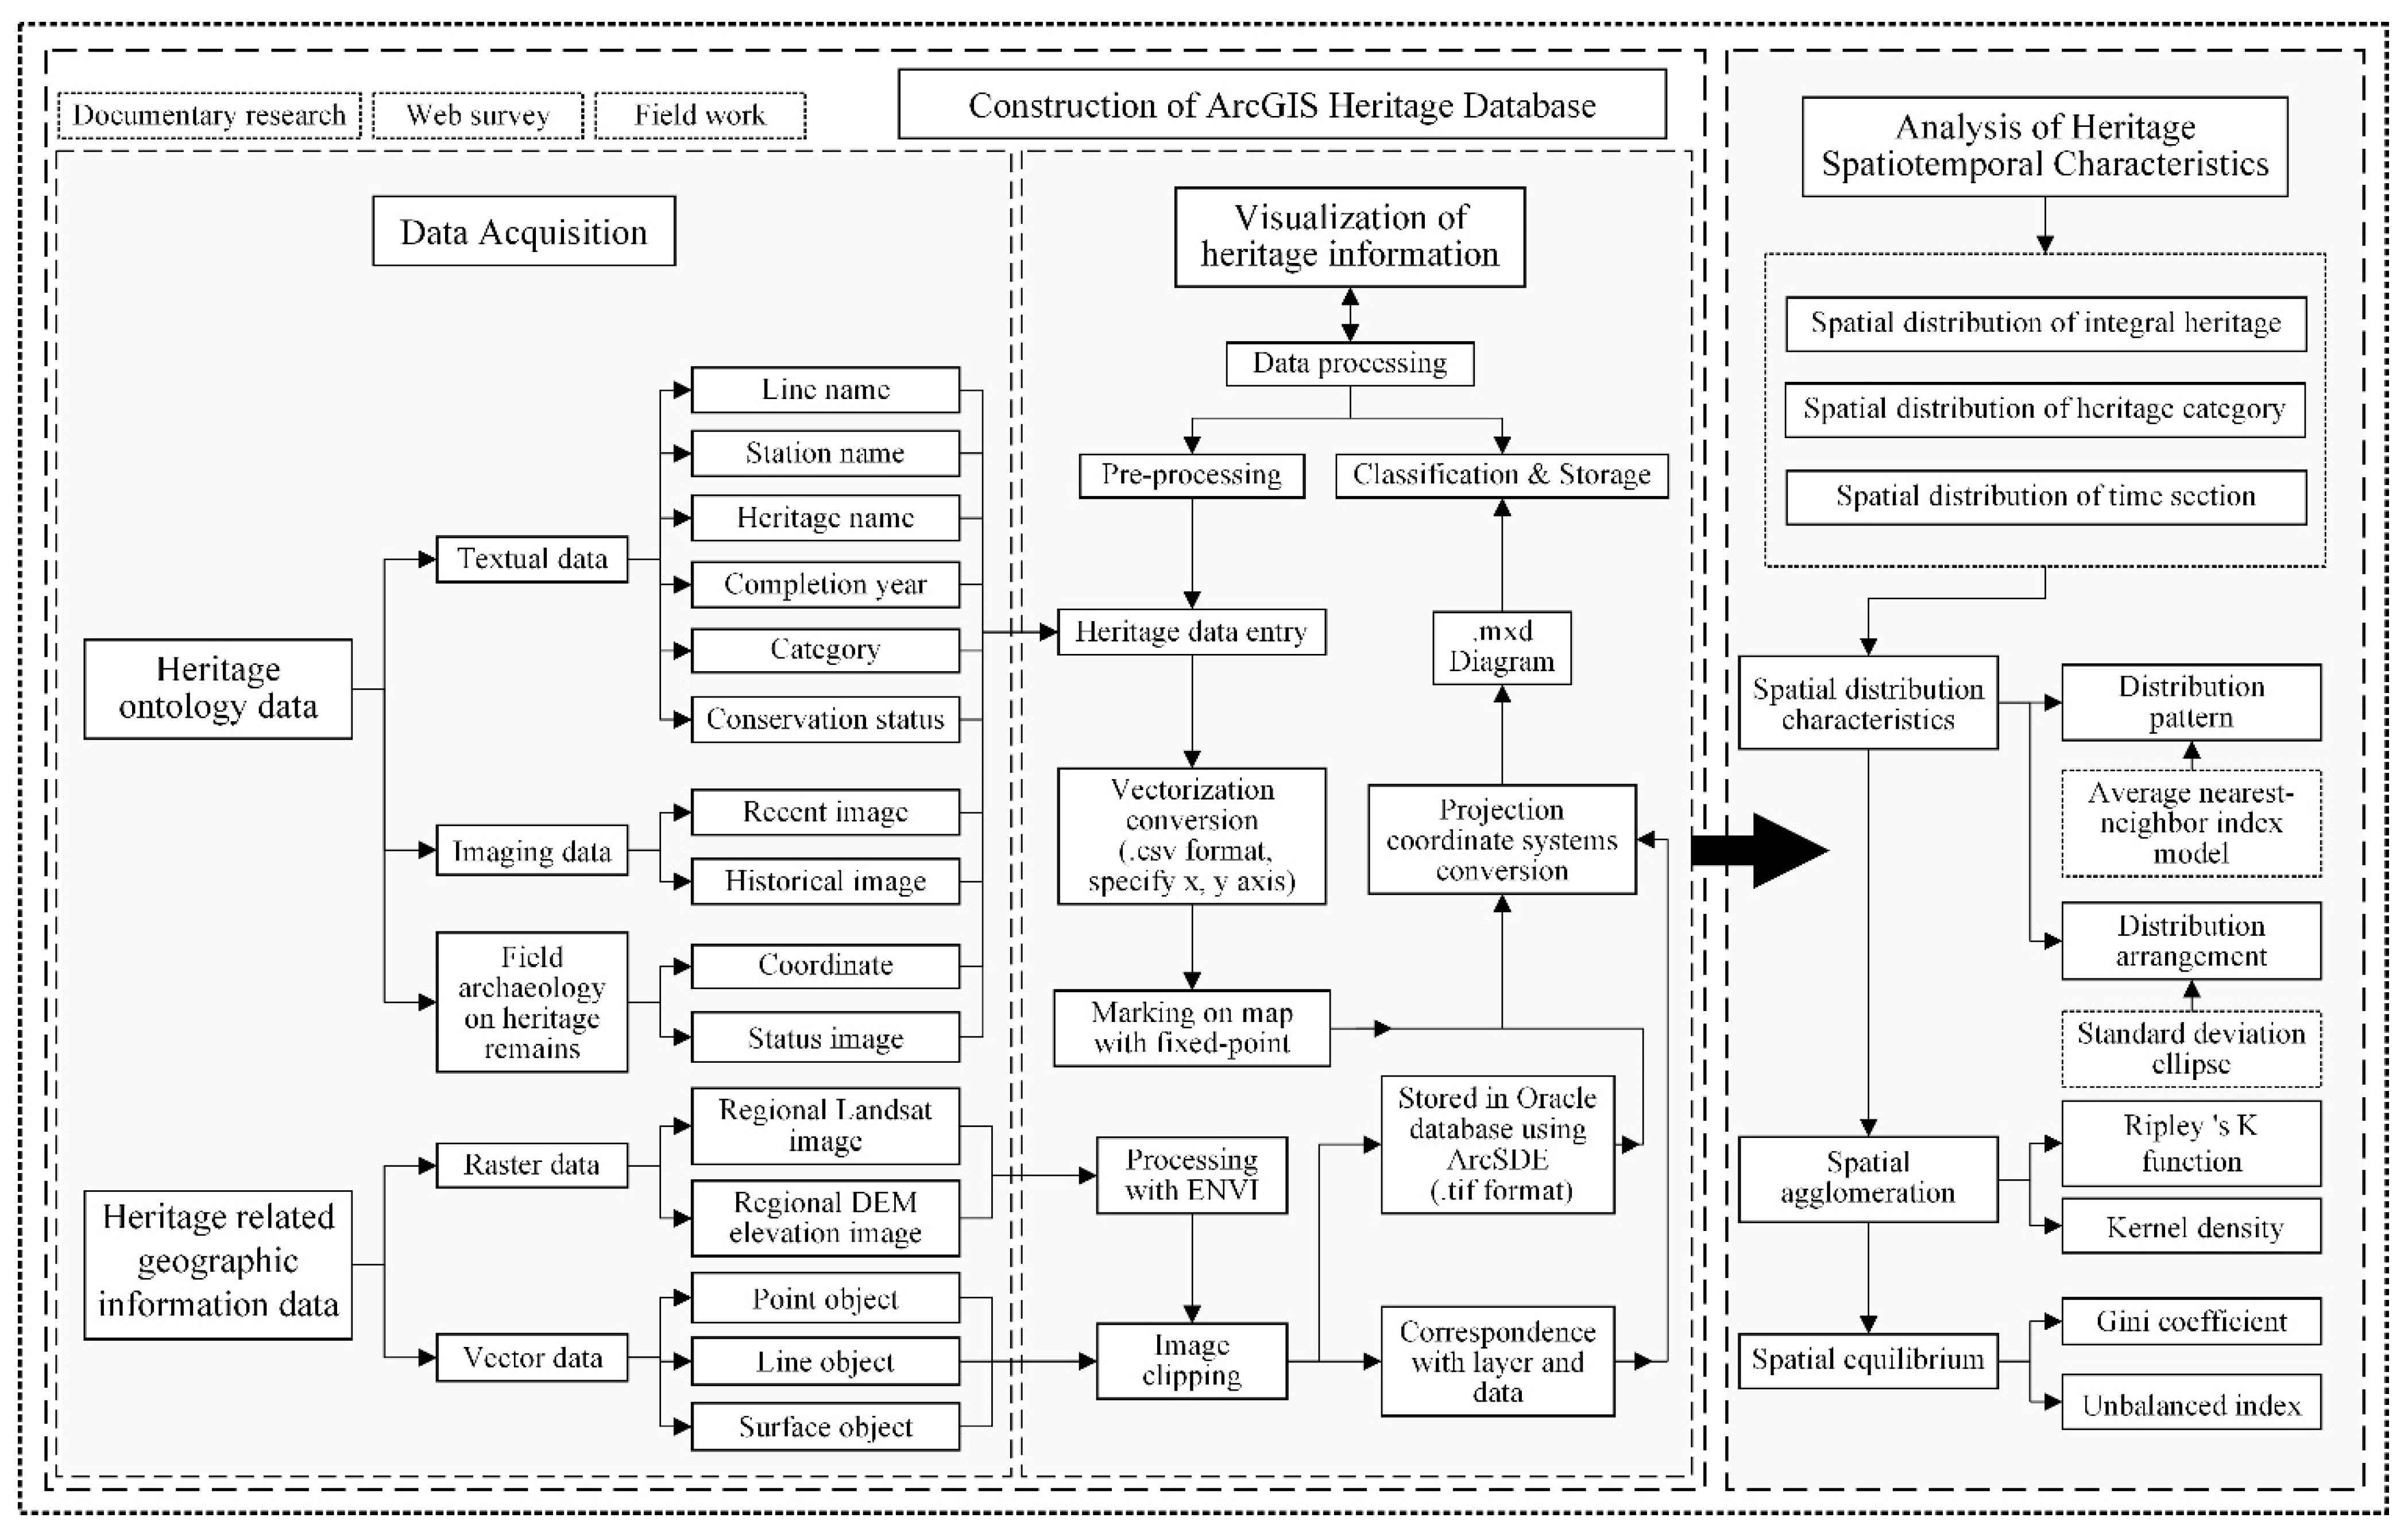
3.1. Logic and Procedures

The research includes data acquisition, data processing, and data analysis based on the construction of ArcGIS heritage database. To obtain required data, the research team has adopted methods including literature research, network surveys, and field surveys. The data acquisition process involves two main parts: ontology information data [10] and other relevant information data. The data processing involves two stages: data processing and classified storage. The database is used to analyze the spatiotemporal distribution of heritage, including spatial distribution of integral heritage, spatial distribution of heritage category, and temporal distribution. The analysis was divided into three parts: spatial distribution characteristics, spatial agglomeration, and spatial equilibrium. The research logic and program are shown in Figure 3.

3.2. Construction of the Database

3.2.1. Ideas for Database Construction

The study is based on the ArcGIS platform. The spatial data collected and processed in the previous period, including raster data, vector data, and text data of heritage information, etc., are stored in a database management system such as Oracle, SQL Server (RDBMS) [11,12]. ArcGis Server is applied to complete the adaptation of the heritage spatial data and attribute data and realize the visualization of information [13].

3.2.2. Legacy Data Preprocessing

The first is data table processing. The BD09 coordinate system was converted to l in the WGS84 coordinate system. The collected heritage data were summarized into an Excel table in the format “line name—site name—heritage name—date of construction—north latitude—east longitude—category of heritage—protection status”.
The second is remote sensing image processing. The ENVI 5.3 software was used to improve the images’ accuracy. The remote sensing images were preprocessed to get the remote sensing image data that could be used for the next step of data extraction and analysis.
The third is image cropping. The raster data and vector data collected were cropped according to the administrative boundary line of the study area, so as to obtain the data cluster of the study area.

3.2.3. Data Classified Storage

Data classification and storage mainly include the following: the vector data collection of water system, green area, administrative unit boundary, traffic line, etc., which are stored and managed correspondently. The raster data are stored in the 0racle database by using ArcSDE. The vectorized conversion of the coordinate data is complete to achieve the marking of the heritage on the map. The basic information chain of heritage is formed with the latitude and longitude to realize the storage of attribute data of heritage.
Based on the above work, the adaptation of graphic information and attribute data is completed. The Railway Architectural Heritage Database of Jinqin Section of Peking–Mukden Railway is constructed.

3.3. Spatiotemporal Characterization Analysis

3.3.1. Characterization of Spatial Distribution

The methods of historical section, nearest-neighbor index, and standard deviation ellipse are mainly used to analyze the spatial distribution characteristics of historical buildings [14,15].
Among them, the historical section method is based on the spatial and temporal evolution process of heritage, dividing the historical period into a number of historical sections, and dynamically revealing evolution process in the continuous static time section.
The nearest-neighbor index refers to the type of spatial distribution of heritage by calculating the distance between their data.
R = r i / r E
In Formula (1), R: nearest-neighbor index; r i : average actual nearest-neighbor distance between architectural heritage site data; and r E : theoretical nearest-neighbor distance between architectural heritage site data.
Standard deviation ellipse: The direction of spatial distribution of heritage obtained by calculating the standard distances in the x and y directions of an ellipse starting from the mean center of a cluster of vector data points of the architectural heritage, forming a standard deviation ellipse containing the majority (68%) of the point heritage elements.

3.3.2. Spatial Agglomeration Analysis

Spatial agglomeration was analyzed mainly for kernel density and multi-distance spatial clustering [16,17,18].
Kernel density is used to calculate the density of architectural heritage point data in the surrounding neighborhood, to determine the size of its density in different spatial distributions.
f x = 1 n h i = 1 n k ( x x i h )  
In Formula (2), k(x): the kernel function; h: the search radius from each heritage site to the surrounding heritage sites; and (xxi): the distance from a particular architectural heritage site to the surrounding architectural heritage sites.
Multi-distance spatial clustering (Ripley’s K-function) was used to explore the corresponding changes in the degree of clustering that occurred when the data on architectural heritage sites were distributed over different spatial extent scales within the study area.
f x = A i = 1 , j = 1 n j 1 n K ( d i j ) n ( n 1 )  
In Formula (3), f x : the observed distance value; d: denotes the spatial scale; A: the area of the study region; n: the number of heritage points in the region, d: the distance from heritage point i to heritage point j; and K(dij): the point that defines the range by using i as the center of the circle and dij as the radius of the circle formed by the circle, but not including i itself.

3.3.3. Analysis of Spatial Equilibrium

The analysis of spatial equilibrium includes the spatial Gini coefficient and the imbalance index [19,20].
The spatial Gini coefficient is a measure of the spatial distribution of heritage across the study area by measuring the degree of equalization of the spatial distribution of data on architectural heritage sites.
G i n i = i = 1 n P i ln P i ln n
In Formula (4), Gini: the spatial Gini coefficient of architectural heritage; Pi: the proportion of the number of properties in the ith study area within the study area to the total number of properties within the study area; and n: the total number of study areas within the study area.
The imbalance index is used to reflect the degree of spatial distribution balance of architectural heritage site data within the study area.
S = i = 1 n Y i 50 ( n + 1 ) 100 n 50 ( n + 1 )
In Formula (5), S: the imbalance index; n: the total number of study areas (district administrative units) within the study area; an Yi: the cumulative percentage of the number of properties owned by each study area within the study area in the ith position in descending order of the total number of properties within the study area.

4. Results

4.1. Spatial Distribution Characteristics

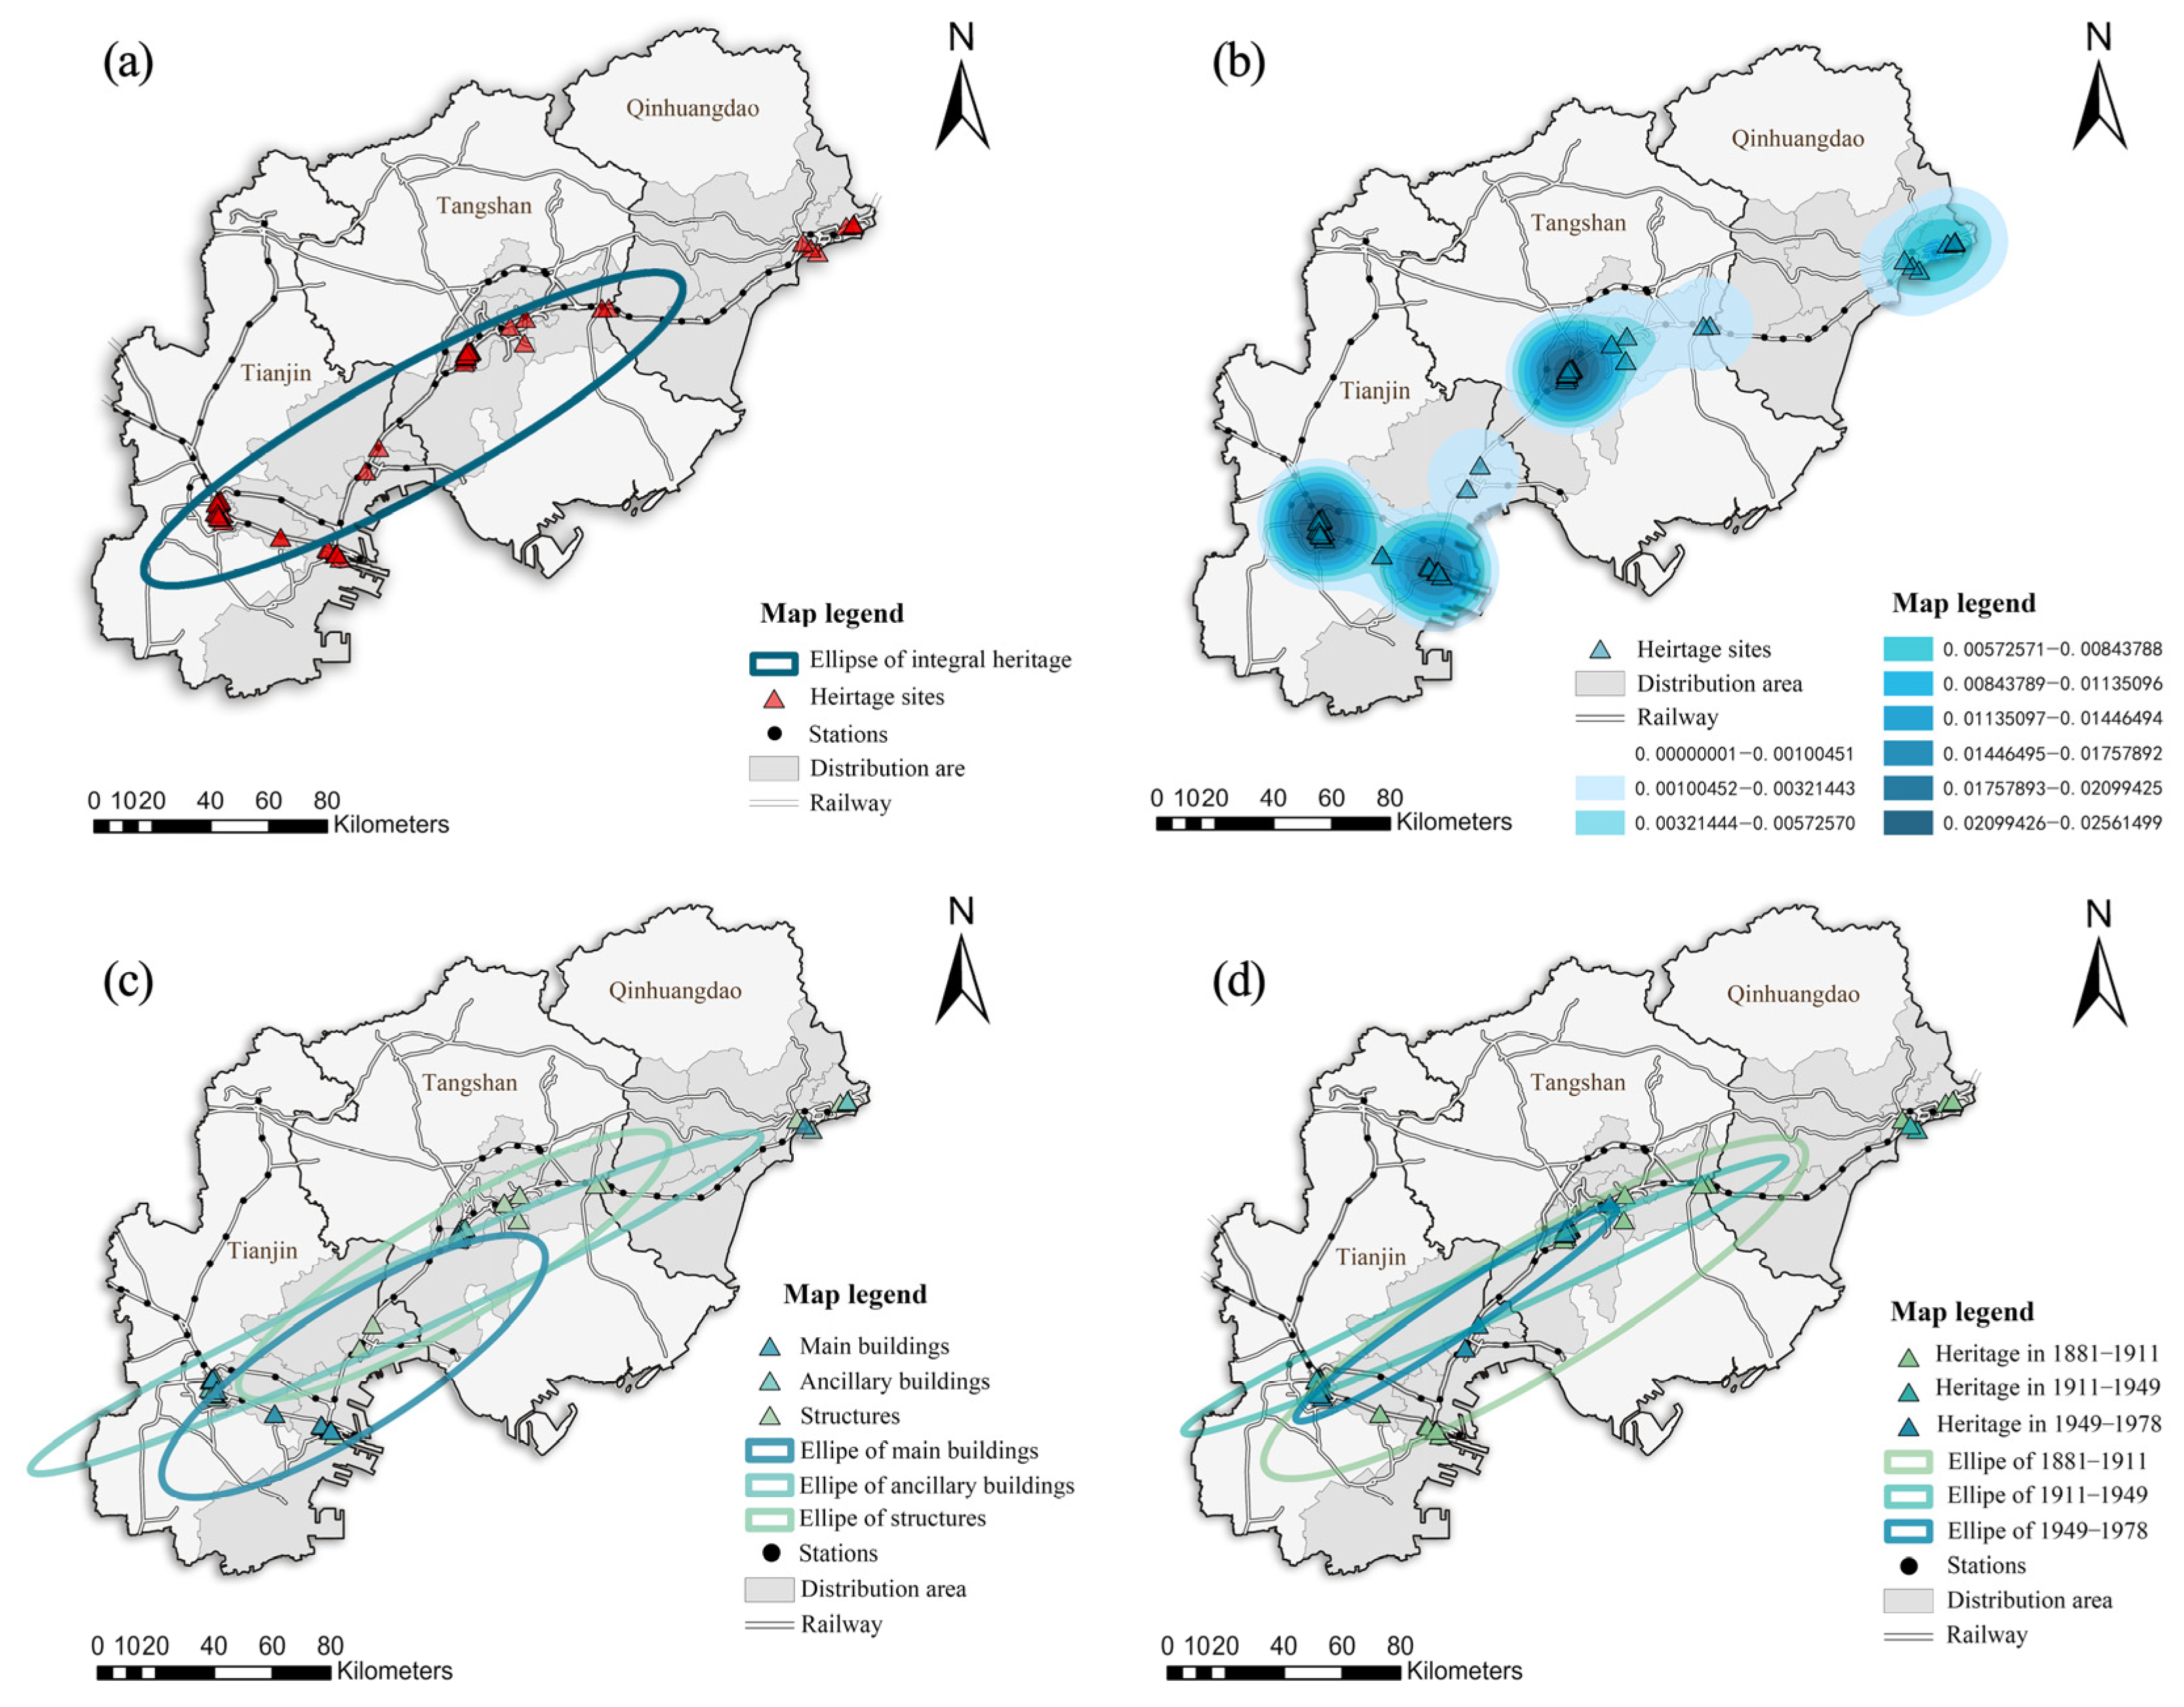
4.1.1. Spatial Distribution of Integral Heritage

The spatial distribution map of the railway architectural heritage in the Jinqin section of the Peking–Mukden Railway can be drawn. See Figure 4. The spatial distribution method is analyzed according to the ArcGIS average nearest-neighbor index model [21,22]. The calculated R = 0.19931 < 1, which indicates that the spatial distribution is characterized by cohesion. The calculated z-value is −11.665588, indicating that the degree of cohesion is high; the calculated p-value is 0.0000, which is less than 0.01, indicating that the distribution of the heritage does not have the characteristics of random distribution. In conclusion, the spatial distribution pattern is a significant cohesive. The degree of cohesion is high [23]. See Table 8.
According to the analysis of the spatial distribution pattern (see Table 9), the proximity ratios of the heritage are all less than 1. The absolute value of the z-value of Tianjin and Tangshan is greater than 1, indicating that the spatial distribution is in a “cohesive” state, and presenting a strong concentration. The z-value of Tianjin is greater than that of Tangshan, indicating a higher degree of cohesion. In Qinhuangdao, the closest-neighbor ratio is close to 1. The z-value is about 0.27 and the p-value is about 0.79, indicating that the spatial distribution is close to a “random” distribution.
The standard deviation ellipse analysis tool in ArcGIS was used to analyze the spatial distribution direction of the heritage [24]. The first level ellipse was used in this study. The results of the analysis (see Figure 5) show that the standard deviation ellipse covers about 1/3 of the study area with significant distribution direction. The long axis of the ellipse is northeast–southwest with a distance of about 188.8 km, and the short axis is northwest–southeast with a distance of about 37.8 km. Its center is located at the interchange of Ninghe County in Tianjin and Fengnan District in Tangshan, with the latitude and longitude of 117.88 E and 39.32 N [25]. In terms of spatial structure, the flattened ellipse indicates that the heritage sites are mostly concentrated in the same direction line section, with less distribution in the branch lines.
The spatial distribution of the heritage is analyzed in three time sections of 1881–1911, 1911–1949, and 1949–1978, as shown in Figure 5. In the period of 1881–1911, the ellipse center is located in the central part of Fengnan District in Tangshan. In the period of 1911 to 1949, the ellipse center is located at the interchange of Tianjin and Tangshan City. In the period of 1949 to 1978, the ellipse center is shifted southward to the central part of Ninghe County in Tianjin City. The difference between the lengths of the long and short axes of the ellipse shortens.
Accordingly, the relevant characteristics of the time distribution structure can be obtained. Firstly, the long axes of the time ellipse are all in the northeast–southwest direction, indicating that the spatial distribution in each period shows a similar direction. The difference of the axis length is significant, which indicates that the distribution of the heritage in the three periods is obviously directional and more concentrated. Secondly, the range of the ellipses in the three periods shows a “gradually shrinking” trend, indicating that the degree of heritage agglomeration has a tendency to become stronger with the change of the historical period [26]. Thirdly, the angle of ellipse in the three periods is mainly changed in short-axis direction (Tianjin North Station—Tanggu South Station). From 1881 to 1911, there were heritage points distributed in the stations at both ends of the line section. And then the heritage points in the subsequent period contracted towards Tianjin North Station, which indicates that the remaining heritage buildings of the Tanggu Branch Line, in which Tanggu South Station is situated, decreased significantly after 1911. In addition, the long axis of the time ellipse shows a significant change, indicating the heritage sites contracted towards the direction inside the Shanhaiguan Pass during the period 1911–1978.

4.1.2. Spatial Distribution of Heritage Category

The spatial distribution of heritage category analysis shows that the spatial distribution in the study area is “cohesive” (see Table 10). The z-value of −2.051434614 for the category of main buildings indicates that the probability of random is less than 5%. The z-values of ancillary buildings and structures are similar, indicating that the probability of random is less than 1%.
The analysis with standard deviation ellipse tool is shown in Figure 5. The ellipse long axes are all in the northeast–southwest direction, and the short axes are in the northwest–southeast direction. Among them, the ellipse center of the main buildings is distributed in the central part of Binhai New Area in Tianjin, with an ellipse turning angle of 65°. The gap between the length of the long axis and short axis is smaller. And the distribution is weaker at orientation. The ellipse center of the ancillary buildings is in Fengnan District in Tangshan, which is located at the interchange of Tianjin and Tangshan City. And the angle of the ellipse turns to be bigger at 71°, with a larger gap between the length of long and short axes. The distribution shows a stronger direction. The ellipse center of structures heritage is in the northeast of Fengnan District, Tangshan City, with an ellipse angle of 66°, which is closer to the distribution of the main buildings. The difference between the length and short axes is moderate [27].

4.2. Spatial Agglomeration

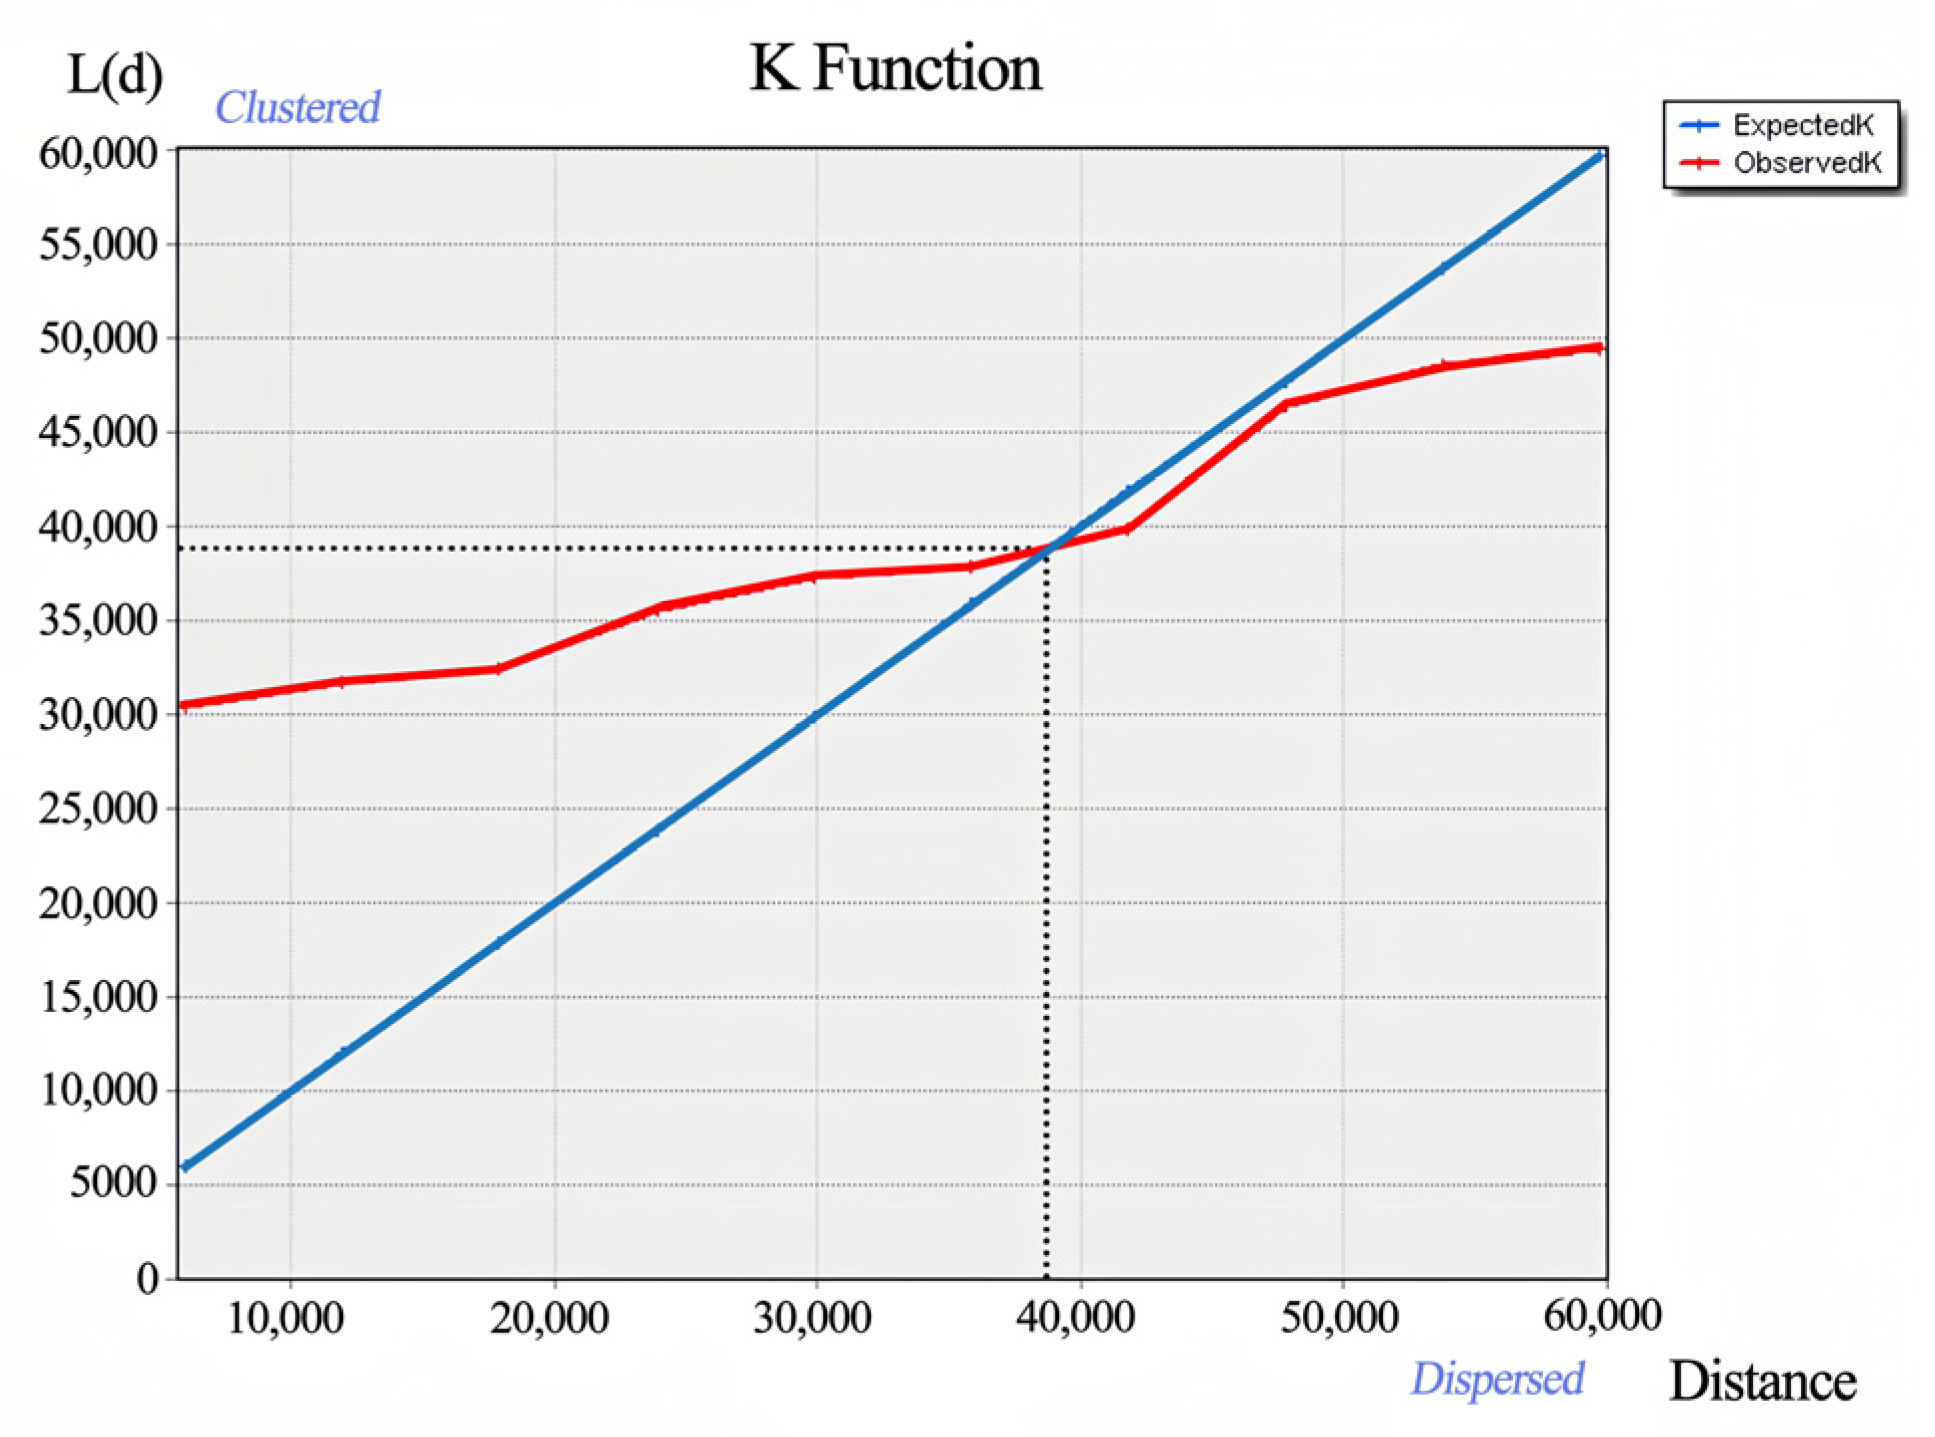
4.2.1. Overall Spatial Clustering of Heritage

The ArcGIS Kernel Density tool was applied to generate the overall kernel density map of the heritage [28,29], see Figure 5. The degree of aggregation was categorized into four levels according to the Jenks optimization method: high aggregation (kernel density of eight levels), medium aggregation (kernel density of six levels), average aggregation (kernel density of four levels), and low aggregation (kernel density of two levels). It can be observed that the heritage cluster as a whole forms an agglomeration pattern with the railway as the line connecting the six points. In terms of the aggregation levels, two “high aggregation points” are located in Hebei District in Tianjin, and the interchange of Lubei District and Lunan District of Tangshan City. One “medium aggregation point” is located in Binhai New District in Tianjin. One “general aggregation point” is located in Shanhaiguan District in Qinhuangdao. Two “low aggregation points” are located at the interchange of Binhai New Area in Tianjin and Fengnan District in Tangshan, and Luanxian County in Tangshan. The two high aggregation points and one general aggregation point form the three pivotal nodes on the main line, with a spacing of 100 km to 120 km, which roughly divides the main line into three more parts, indicating that the main supply nodes of the line have a radial range of about 100 km.
The study uses Ripley’s K-function to analyze the clustering of heritage, see Figure 6. L(d) represents the function applied in Ripley’s K calculation. Comparison of expected K and observed K is carried out and it is observed that the two curves intersect at the distance value of 38,800 m. When the distance range is less than 38,800 m, the K observed value is greater than the K expected value, indicating that the degree of clustering within the range is higher. When the distance range is greater than 38,800 m, the K observed value is less than the K expected value, indicating that the degree of discrete distribution within the range is higher.

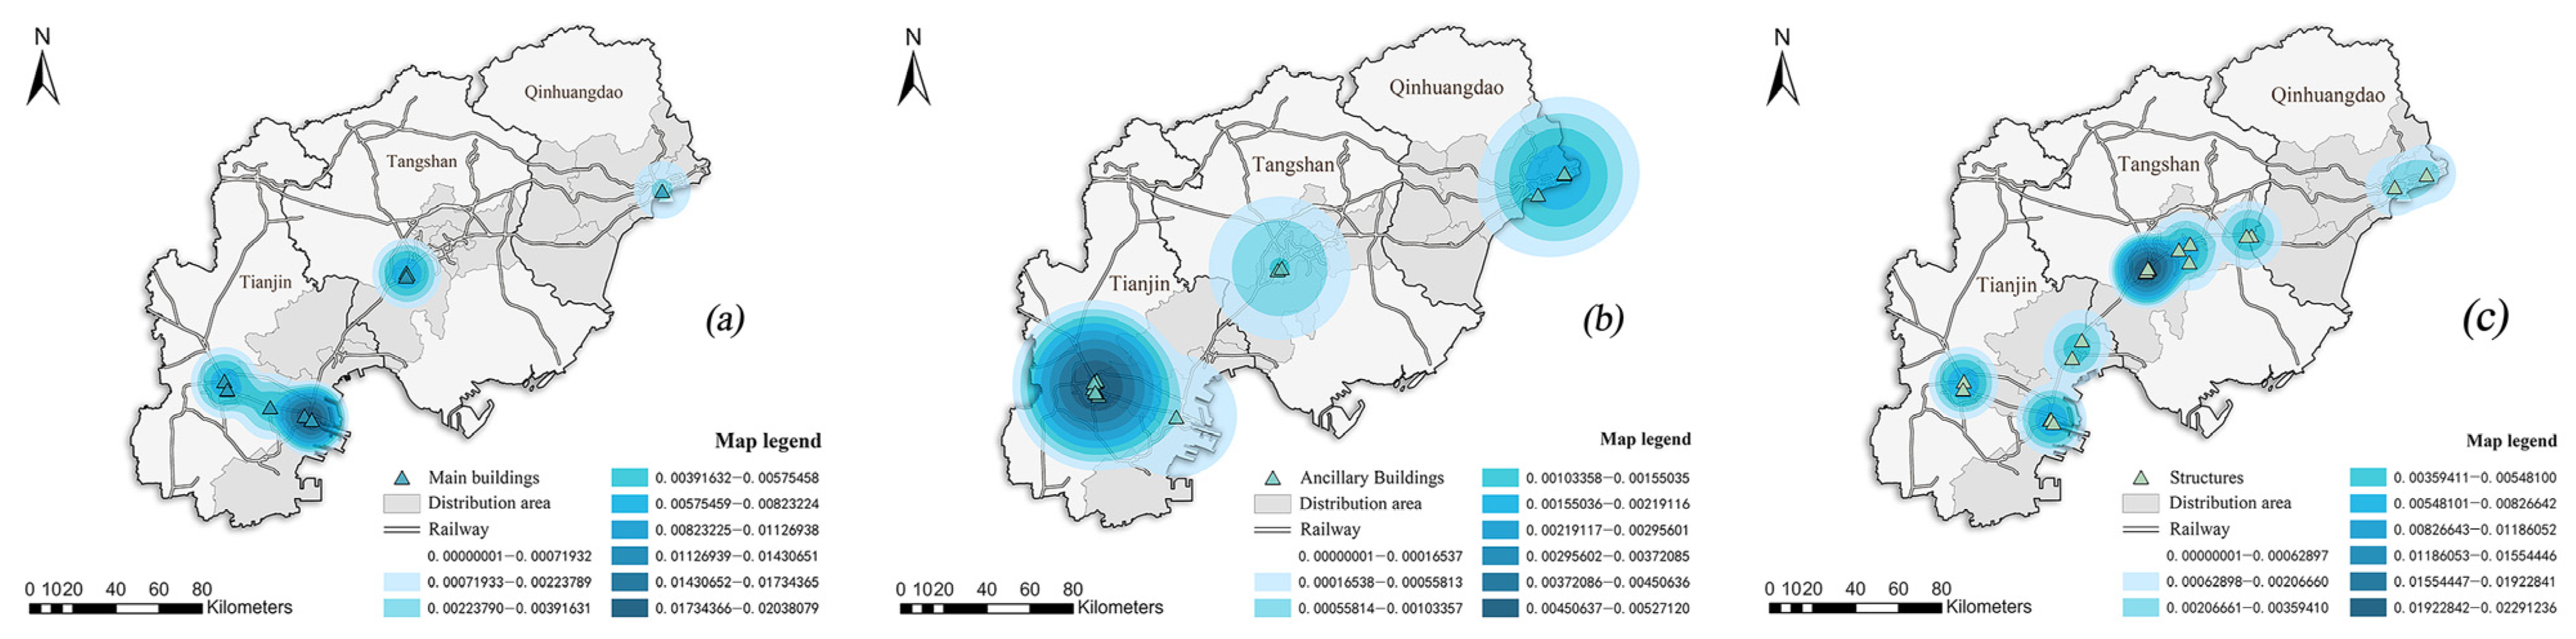
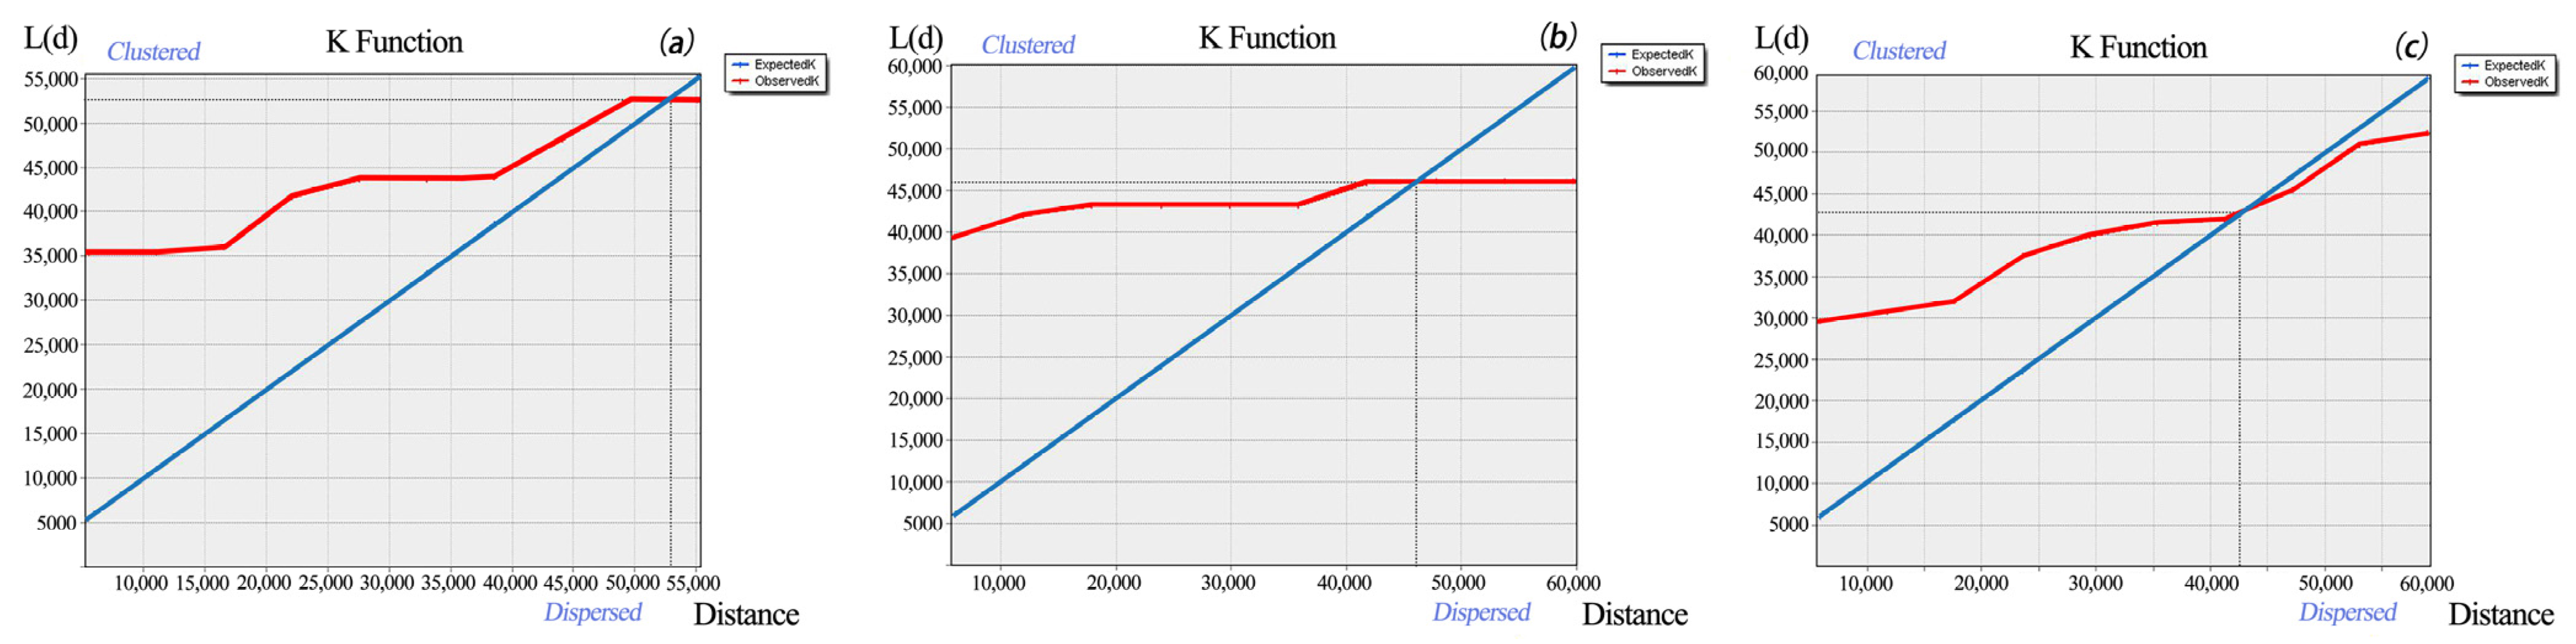
4.2.2. Spatial Clustering of Heritage Category

Kernel density analysis of the three heritage categories shows different patterns of aggregation, see Figure 7. The heritage of main buildings shows four aggregation points. One high aggregation point is located in the Binhai New Area of Tianjin. Two general aggregation points is located in the Hebei District of Tianjin, and the interchange of the Lubei District and the Lunan District of Tangshan City. One low aggregation point located in the Seaport District in Qinhuangdao. The heritage of ancillary buildings shows three aggregation points, with one high aggregation in Hebei District, Tianjin. One general aggregation in Shanhaiguan District, Qinhuangdao. One low aggregation in the interchange of Lubei District, Lunan District, and Kaiping District. Six aggregation points are obtained in the category of structures, with one high aggregation point at the interchange of Lubei District and Lunan District in Tangshan City. The other five low aggregation points are in Hebei District, Binhai New District, Interchange of Ninghe County and Fengnan District, Luan County, and Harbor District [30].
In Figure 8, multi-distance clustering analysis of heritage categories is shown. The ExpectedK and ObservedK of the railway main buildings intersect at the distance value of 52,500 m. When the distance range is less than 52,500 m, the K observed value is greater than the K expected value, which indicates that the clustering degree of this type of heritage within the range is higher; when the distance range is larger than 52,500 m, the observed value of K is smaller than the expected value of K, which indicates that the dispersion degree of this type of heritage within the range is higher. The distribution of ancillary buildings has a higher clustering degree within the distance range of 45,500 m, and a higher dispersion degree within the distance range of more than 45,500 m. The distribution of structures heritage has a higher clustering degree within the distance range of 42,500 m, and the degree of discrete is higher within the distance range of radius greater than 42,500 m.
By comparing the difference in the spatial kernel density map of heritage categories, it can be seen that, except for the Tanggu South Station node on the Tanggu branch line, the other nodes on the main line are distributed with ancillary buildings. According to the analysis, Tanggu South Station, as a node of the Peking–Mukden Railway radiating to the coast, mainly took the role of receiving cargo flow of the port, and did not set up related ancillary buildings; while the nodes on the main line provided comprehensive service functions, so there are more related ancillary buildings.

4.3. Spatial Equilibrium

4.3.1. Overall Spatial Equilibrium of the Heritage

Using the Gini coefficient to analyze the equilibrium of the distribution, a total of 37 district-level administrative units in 3 cities were used to divide the study area [31]. The data obtained were substituted into the formula. Calculated Gini = 0.58588, with 0.5 < Gini < 1, indicating that the integral heritage distributes with a wide range of disparities. Further, the imbalance index was used to analyze the distribution balance, calculated as S = 0.48659, indicates that the distribution of heritage is very unbalanced at the municipal level and district administrative units. The top three proportion regions of the heritage distribution are Lunan District in Tangshan, Hebei District, and Binhai New District in Tianjin, accounting for about 22%, 22%, and 21%, respectively, which altogether account for 65% of the total, as shown in Table 11. The analysis results of the overall spatial equilibrium of heritage show that the proportion of the distribution decreases from Tianjin to Qinhuangdao, and the distribution gap is vast.

4.3.2. Spatial Balance of Heritage Categories

The Gini coefficient is used to analyze spatial balance of heritage categories. The data are substituted into the formula. The calculated Gini (main building facilities) = 0.46386 and Gini (ancillary building facilities) = 0.46386. And 0.4 < Gini < 0.5 indicates that the distribution gap between main buildings category and ancillary buildings category in the study area is large, the degree of balance is low, and the degree of concentration is high. Gini (structure) = 0.53212, 0.5 < Gini < 1 indicates that the distribution gap of structure category in the study area is huge.
The study utilizes the imbalance index to investigate the degree of distribution balance of the three categories of heritage (see Table 12). The calculated data were sorted to show that the distribution of the three categories of heritage is not balanced at the municipal level and district administrative units. The degree of balance is in the order of ancillary buildings category < main buildings category < structures category. The main buildings category is the most distributed in the Binhai New Area in Tianjin, accounting for about 50% of the total. The ancillary buildings category is the most distributed in the Hebei District in Tianjin, accounting for about 41% of the total. The structures category is the most distributed in the Lunan District in Tangshan, accounting for about 33% of the total.

5. Discussion

The existing railway heritage in the Jinqin section is concentrated. The overall distribution is concentrated in the eastern and middle regions, while the regional distribution is concentrated around the stations, as discernible from Figure 7. This is mainly related to factors such as the level of industrial development and geographical conditions [32,33]. The transportation of goods requires infrastructure as a guarantee [34]. Tianjin has the geographical advantage of being close to the capital and has a long-established port, which has led to the concentration of a large number of industries and generated a huge transportation demand, making the railway construction in Tianjin more intensive [35]. Tangshan benefits from abundant mineral resources, therefore, it has good industrial development conditions. Qinhuangdao, as a vital transportation hub, is of great significance. But its industry was not developed at that time, which led to fewer supporting railway facilities. Furthermore, heritage clusters have formed at both Tianjin and Qinhuangdao port stations, indicating that the railway and water transport in the Jinqin section have formed a strong linkage. Driven by industrial demand, water transport and railway have complemented each other, promoting the development of the railway. In addition, the category of industry is one of the factors that affects the distribution. The industrial development in Tianjin mainly relies on the market of the capital business district, forming a comprehensive industrial development. Tianjin had an industrial value of 400 million yuan between 1840 and 1927, ranking second only to Shanghai in China [36]. Tangshan relies on natural endowments and mainly develops industry by transporting raw materials for production. Therefore, architectural heritage (including main buildings and ancillary buildings) is mainly distributed in Tianjin, while structure heritage is mainly distributed in Tangshan.
Among the stations along the entire route, railway heritage is concentrated in the areas where several specific large stations are located. From the perspective of historical vicissitude, it can be considered that large stations provide better protection for historical heritage, making it more likely to avoid being ruined. The stations where heritage is concentrated are all railway interchanges. Among the six gathering points analyzed earlier, two are located at port stations, and the remaining four are located at line intersection stations. The port stations provided unique geographical advantages and abundant marine resources [37]. Additionally, the two intersection stations with more lines have more heritage. Better transportation convenience means more reasonable resource exchange and more population inflow. Tianjin provides industrial productivity, Tangshan provides mineral resources, Tianjin and Qinhuangdao jointly provide port freight. A good economic condition has been formed around large stations, which enables the surrounding buildings to be well maintained, thus forming a heritage gathering point.
The discussion on the distribution characteristics and contributing factors of railway heritage is conducive to the sustainable heritage protection. On the one hand, these efforts can sort out the past traces of the heritage and find the impact of railway construction on the existing urban pattern [38]. On the other hand, it helps to understand the formation process of heritage and guide to management mechanism and social environment that are more conducive to the sustainable protection of heritage now and in the future [39,40]. The Jinqin section has diverse types of railway heritage. The formation of railway heritage is clustered in spots, and each spot is clearly connected by railway lines. Under the condition of division according to historical period and functional category, the distribution of heritage still shows a directional trend. In carrying out sustainable protection, it is necessary to distinguish between differences and commonalities. This requires further in-depth case studies [41] and targeted protection strategies based on existing analysis. Technological research on the changing of heritage is one of the directions [42,43]. Therefore, it is necessary to construct a multi-level operation system to correspond to different sizes and types of heritage protection, so as to avoid the damage of homogenized urban development to the rich connotation of heritage [44].

6. Conclusions

The GIS method is helpful for analyzing the distribution characteristics of railway heritage in the Jinqin section. In this study, a research paradigm was established that includes “surveying and collecting research sample information data, constructing a heritage GIS database, and analyzing the heritage characteristics of the application database”. On this basis, through analyzing the distribution characteristics and contributing factors of the Jinqin section, a preliminary sustainable protection strategy was formulated:
(1)
In the study of spatial distribution characteristics, the integral spatial distribution is characterized by a significant “cohesion”. However, differentiation occurs in the municipal scale domains to which the heritage belongs. Accordingly, the planning of regional railway heritage tourism routes and the functional revitalization and utilization of historical buildings can be considered in a unified way. The results of the standard ellipse analysis show that the integral heritage in the region indicates similar and obvious spatial distribution direction in three periods and three major categories. A multi-scale hierarchical linear heritage protection corridor should be taken into account according to the analysis.
(2)
In the results of the spatial agglomeration, the heritage as a whole shows a spatial clustering pattern of six points connected by railway, while each major category of heritage has only one single high level clustering point, and the main distribution points form a staggered relationship. Due to the differentiation of the functions carried by each pivotal node on the railway line section, adaptive heritage organization mode and systematic renewal strategies should be adopted.
(3)
In the study of spatial equilibrium, the integral heritage of the region and the three categories of heritage have a large distribution gap in the study area of the three cities, with a low degree of balance and a high degree of agglomeration. The amount of heritage in each region shows a significant difference, which can be used as a basis for conservation and adaptive use measures by dividing the heritage distribution domains into different scale tiers.
Summarizing and analyzing regional heritage information is the foundation for further in-depth case studies and protection. It is hoped that more research on the protection and revitalization of regional railway heritage will be conducted, providing a systematic information data platform and research logic and methods that can be used for reference for the sustainable protection of regional railway heritage.

Author Contributions

Conceptualization, F.L.; Methodology, Y.W.; Formal analysis, Z.L.; Investigation, Y.W.; Resources, F.L. and Y.W.; Writing—original draft, Z.L. and Y.W.; Writing—review & editing, F.L. and Z.L.; Visualization, Z.L.; Supervision, F.L.; Project administration, F.L.; Funding acquisition, F.L. All authors have read and agreed to the published version of the manuscript.

Funding

This study is supported by the National Natural Science Foundation of China under Grant No. 52078107.

Institutional Review Board Statement

Not applicable.

Informed Consent Statement

Not applicable.

Data Availability Statement

The data that support the findings of this study may be made available from the corresponding author upon request.

Conflicts of Interest

The authors declare that they have no conflicts of interest.

References

  1. Zeng, K. A History of China Railway; Yanjing Publishing House: Beijing, China, 1924; p. 742. [Google Scholar]
  2. Mi, R. Historical Materials for Chinese Modern Railway: 1863–1911 (Vol. 2); Zhonghua Book Company: Beijing, China, 1963; pp. 574–582. [Google Scholar]
  3. Compilation Committee of the Record of Beijing Railway Bureau. Journal of Beijing Railway Bureau; China Railway Press: Beijing, China, 1995; pp. 207–232. [Google Scholar]
  4. Tangshan Local Records Compilation Committee. Tangshan City Records; Fangzhi Press: Beijing, China, 1999; pp. 3–9. [Google Scholar]
  5. Huang, Q.; Chen, X. A study of the historical geography of Peking-Mukden Railway (1881–1912). Geogr. Res. 2014, 33, 2180–2194. [Google Scholar]
  6. Jiang, T. Modern Chinese History; China Law Press: Beijing, China, 2016; pp. 2–183. [Google Scholar]
  7. Hebei Provincial Local Records Compilation Committee. Hebei Provincial Record (Volume 40 Railway Record); China Railway Press: Beijing, China, 1997. [Google Scholar]
  8. Tianjin Local Records Compilation and Revision Committee Office; Tianjin Railway Office; Tianjin Railway Group Co., Ltd.; The Third Railway Survey and Design Institute. Tianjin General Records (Railway Records); Tianjin Academy of Social Sciences Press: Tianjin, China, 2006. [Google Scholar]
  9. Sun, B. Dictionary of Chinese Railway Station Names; China Railway Press: Beijing, China, 2003; pp. 117–126. [Google Scholar]
  10. Katja, M.R.; Boris, D.; Laurens, O. Old buildings need new ideas: Holistic integration of conservation-restoration process data using Heritage Building Information Modelling. J. Cult. Herit. 2022, 55, 30–42. [Google Scholar] [CrossRef]
  11. Elfadaly, A.; Shams Eldein, A.; Lasaponara, R. Cultural Heritage Management Using Remote Sensing Data and GIS Techniques around the Archaeological Area of Ancient Jeddah in Jeddah City, Saudi Arabia. Sustainability 2020, 12, 240. [Google Scholar] [CrossRef]
  12. Ding, A.; Cenci, J.; Zhang, J. Links between the pandemic and urban green spaces, a perspective on spatial indices of landscape garden cities in China. Sustain. Cities Soc. 2022, 85, 104046. [Google Scholar] [CrossRef] [PubMed]
  13. Brundu, G.; Peruzzi, L.; Domina, G.; Bartolucci, F.; Galasso, G.; Peccenini, S.; Raimondo, F.M.; Albano, A.; Alessandrini, A.; Banfi, E.; et al. At the intersection of cultural and natural heritage: Distribution and conservation of the type localities of Italian endemic vascular plants. Biol. Conserv. 2017, 214, 109–118. [Google Scholar] [CrossRef]
  14. Wang, X.; Zhang, J.; Cenci, J.; Becue, V. Spatial Distribution Characteristics and Influencing Factors of the World Architectural Heritage. Heritage 2021, 4, 2942–2959. [Google Scholar] [CrossRef]
  15. Korpilo, S.; Kajosaari, A.; Rinne, T. Coping with Crisis: Green Space Use in Helsinki Before and During the COVID-19 Pandemic. Front. Sustain. Cities 2021, 6, 99. [Google Scholar] [CrossRef]
  16. Nie, X.; Xie, Y.; Xie, X.; Zheng, L. The characteristics and influencing factors of the spatial distribution of intangible cultural heritage in the Yellow River Basin of China. Herit. Sci. 2022, 10, 121. [Google Scholar] [CrossRef]
  17. Liao, Y.; Cenci, J.; Zhang, J. Chinese Modern Architectural Heritage Resources: Perspectives of Spatial Distribution and Influencing Factors. ISPRS Int. J. Geo-Inf. 2023, 12, 358. [Google Scholar] [CrossRef]
  18. Wang, X.; Zhang, T.; Duan, L.; Liritzis, I.; Li, J. Spatial distribution characteristics and influencing factors of intangible cultural heritage in the Yellow River Basin. J. Cult. Herit. 2024, 66, 254–264. [Google Scholar] [CrossRef]
  19. Gao, H.; Wang, Y.; Zhang, H.; Huang, J.; Yue, X.; Chen, F. Spatial Distribution and Typological Classification of Heritage Buildings in Southern China. Buildings 2023, 13, 2025. [Google Scholar] [CrossRef]
  20. Zhang, J.; Cenci, J.; Becue, V.; Koutra, S. Research of the Industrial Heritage Category and Spatial Density Distribution in the Walloon Region, Belgium, and Northeast China. In Repairs and Maintenance of Heritage Architecture XVII & Earthquake Resistant Engineering Structures XIII (2021); WIT Press: Southampton, UK, 2021; p. 285. Available online: https://www.witpress.com/elibrary/wit-transactions-on-the-built-environment/203/37960/ (accessed on 4 February 2024).
  21. Li, M.; Ouyang, W.; Zhang, D. Spatial Distribution Characteristics and Influencing Factors of Traditional Villages in Guangxi Zhuang Autonomous Region. Sustainability 2022, 15, 632. [Google Scholar] [CrossRef]
  22. Jia, A.; Liang, X.; Wen, X.; Yun, X.; Ren, L.; Yun, Y. GIS-Based Analysis of the Spatial Distribution and Influencing Factors of Traditional Villages in Hebei Province, China. Sustainability 2023, 15, 9089. [Google Scholar] [CrossRef]
  23. Kang, J.; Wang, J.; Wang, Y.; Chen, C. Research on the combing of industrial heritage resources and spatial distribution characteristics of the Yunnan section of the Yunnan-Vietnam Railway. Green Technol. 2022, 24, 17–20+51. [Google Scholar]
  24. Pang, L.; Wu, L. Distribution characteristics and influencing factors of Intangible Cultural Heritage in Beijing-Tianjin-Hebei. Herit. Sci. 2023, 11, 19. [Google Scholar] [CrossRef]
  25. Zhao, Y. Spatial Distribution Characteristics and Influencing Factors of Industrial Heritage in China. Archit. Cult. 2020, 9, 88–91. [Google Scholar]
  26. Guo, H. Analysis of spatial distribution and influencing factors of cultural relics protection units in Jiangxi Province. Ph.D. Dissertation, Jiangxi Normal University, Nanchang, China, 2019. [Google Scholar]
  27. Mao, F.; Wu, Y.; Tang, J. Application of spatial information technology in the protection of Grand Canal heritage. China Cult. Herit. 2011, 6, 55–59. [Google Scholar]
  28. Fan, X.; Sun, L. Geographic Distribution Characteristics and Influencing Factors for Industrial Heritage Sites in Italy Based on GIS. Sustainability 2024, 16, 2085. [Google Scholar] [CrossRef]
  29. Jin, J.; Yan, H.; Wang, G.; Su, G. Spatial scanning of traditional villages and geographical exploration of spatial differentiation mechanism: A case study of Gansu Province. In Proceedings of the 2021 28th International Conference on Geoinformatics, Nanchang, China, 8–10 August 2021; pp. 1–5. [Google Scholar]
  30. Zhang, J.; Xu, S.; Aoki, N. GIS-based application in the pre-planning of conservation planning of Dagu Dockyard of Beiyang Naval Division. Herit. Conserv. Res. 2018, 3, 51–54. [Google Scholar]
  31. Zhang, J.; Cenci, J.; Becue, V.; Koutra, S. Analysis of spatial structure and influencing factors of the distribution of national industrial heritage sites in China based on mathematical calculations. Environ. Sci. Pollut. Res. 2022, 29, 27124–27139. [Google Scholar] [CrossRef]
  32. Henderson, J.V. Urbanization and growth. In Handbook of Economic Growth; Elsevier: Amsterdam, The Netherlands, 2005; Volume 1, pp. 1543–1591. Available online: https://www.sciencedirect.com/science/article/pii/S1574068405010245 (accessed on 10 March 2024).
  33. Hudson, R. Institutional change, cultural transformation, and economic regeneration: Myths and realities from Europe’s old industrial areas. In Production, Places and Environment; Routledge: London, UK, 2000; pp. 196–216. [Google Scholar]
  34. Pilsitz, M. Determining factors for the architectural development of factory buildings in Budapest between 1860 and 1918. Period. Polytech. Archit. 2011, 42, 43. [Google Scholar] [CrossRef]
  35. Zhang, J.; Sun, H.; Xu, S.; Aoki, N. Analysis of the Spatial and Temporal Distribution and Reuse of Urban Industrial Heritage: The Case of Tianjin, China. Land 2022, 11, 2273. [Google Scholar] [CrossRef]
  36. Kui, Y. A Comprehensive Study on Different Types of Cities in Modern China; Sichuan University Press: Chengdu, China, 1998; p. 525. [Google Scholar]
  37. Cepolina, S.; Ghiara, H. New trends in port strategies. Emerging role for ICT infrastructures. Res. Transp. Bus. Manag. 2013, 8, 195–205. [Google Scholar] [CrossRef]
  38. Guo, J.; Li, H.; Zhang, Y. Industrial Heritage Preservation Method Integrating with Urban Development: The Case of Chongqing. New Archit. 2016, 3, 19–24. [Google Scholar]
  39. Moshaver, A. Re Architecture: Old and New in Adaptive Reuse of Modern Industrial Heritage. Master’s Thesis, Ryerson University, Toronto, ON, Canada, 2011. Available online: https://s3.ca-central-1.amazonaws.com/pstorage-ryerson-5010877717/28136355/Moshaver_Ava.pdf (accessed on 26 February 2024).
  40. Shipley, R.; Snyder, M. The role of heritage conservation districts in achieving community economic development goals. Int. J. Herit. Stud. 2013, 19, 304–321. [Google Scholar] [CrossRef]
  41. Blagojevic, M.R.; Tufegdzic, A. The new technology era requirements and sustainable approach to industrial heritage renewal. Energy Build. 2016, 115, 148–153. [Google Scholar] [CrossRef]
  42. Hemeda, S. Engineering failure analysis and design of support system for ancient Egyptian monuments in Valley of the Kings, Luxor, Egypt. Geoenviron. Disasters 2018, 5, 12. [Google Scholar] [CrossRef]
  43. Fort, R.; Ergenç, D.; Aly, N.; de Buergo, M.A.; Hemeda, S. Implications of new mineral phases in the isotopic composition of Roman lime mortars at the Kom el-Dikka archaeological site in Egypt. Constr. Build. Mater. 2021, 268, 121085. [Google Scholar] [CrossRef]
  44. Jiang, J.; Zang, T.; Xing, J.; Ikebe, K. Spatial Distribution of Urban Heritage and Landscape Approach to Urban Contextual Continuity: The Case of Suzhou. Land 2023, 12, 150. [Google Scholar] [CrossRef]
Figure 1. Development history of the Peking–Mukden Railway.
Sustainability 16 02466 g001
Figure 2. Scope of the Peking–Mukden Railway.
Sustainability 16 02466 g002
Figure 3. Diagram of the study logic and procedures.
Sustainability 16 02466 g003
Figure 4. Spatial distribution of heritage.
Sustainability 16 02466 g004
Figure 5. Distribution characteristics analysis. (a). Ellipse of integral heritage, (b). Kernal density map of heritage, (c). Ellipse of heritage categories, (d). Ellipse of time section.
Sustainability 16 02466 g005
Figure 6. Ripley’s K-function analysis diagram of integral heritage.
Sustainability 16 02466 g006
Figure 7. Spatial kernel density map of heritage categories. (a), Kernel density of main buildings. (b), Kernel density of accessory buildings. (c), Kernel density of structures.
Sustainability 16 02466 g007
Figure 8. Multi-distance clustering analysis of heritage categories. (a), K-function diagram. (b), K-function diagram. (c), K-function diagram of main buildings of ancillary buildings of the structures.
Sustainability 16 02466 g008
Table 1. Scope of railway architectural heritage types.
Main TypesMedium TypeSubcategory
Main Building CategoryBuildings of
the Train Operation Section
Passenger and freight station buildings, and ancillary building facilities.
Buildings of
the Locomotive Section
Buildings for locomotive maintenance and overhaul, such as overhaul workshops, preparation workshops, equipment workshops, management offices, etc.
Buildings of
the Electricity Section
For railway operation signal management, signal maintenance, and related buildings.
Buildings of
the Maintenance Section
Workshop and other related building facilities (responsible for the maintenance and repair of railway lines and related equipment).
Buildings of
the Vehicle Section
Overhaul workshops and other related building facilities for rolling stock (excluding locomotives).
Buildings of
the Power-Supply Section
Power-supply buildings and ancillary buildings.
Buildings of
the Communications Section
① Communication station buildings: long-distance mechanical room, automatic mechanical room, main wiring room.
② Long-distance automatic communication station buildings: long-distance mechanical room, automatic mechanical room, main wiring room, long-distance automatic.
Ancillary BuildingsManagement offices, dormitories, cafeterias, bathhouses, and other buildings, inside the railway’s operating area
Ancillary Building CategoryOffice BuildingsManagement office buildings located outside the railway’s operating area set up by the management department of the railway sector.
Warehouse The storage facilities outside the railway’s operating area that is dedicated to railway service.
Residential Buildings Residences, group quarters, crew apartments, etc. outside the section area that serve the railway operation.
Public FacilitiesPublic facilities outside the railway’s operating area such as commercial buildings, hotels, hospitals, sports centers, educational institutions, places of worship, memorials, and other establishments.
Military InstallationsPillboxes and railway bridges built during the war, etc.
StructuresStructuresFlyovers, bridges, tunnels, coal platforms, wells, water towers, etc. inside the railway’s operating area
Table 2. The list of railway architectural heritage of the Jinqin Section of the Peking–Mukden Railway.
CityLineStationHistorical BuildingCityLineStationHistorical Building
Tianjin
(32 sites)
Main LineTianjin
North Station
Tianjin North Railway Station,
Tianjin North Railway Station Rain Shelter (Palace Station House),
Beining Railway Administration (Tianjin Railway Office of China Railway Beijing Bureau Group Corporation),
Former site of Tianjin Hospital of Beining Railway at Tianjin North Station (Tianjin Fourth Central Hospital),
Tianjin North Railway Station Crossing North Flyover,
Tianjin North Railway Station Old Tunnel Bridge,
Tianjin Railway No. 1 Middle School (formerly Rotary Middle School),
Tianjin Railway Vocational and Technical School,
Former residence of Liu Jianzhang
Tangshan
(19 sites)
Main LineTangshan South StationPost-earthquake site of Tangxu Railway Repair Factory at Tangshan South Station,
Site of the old factory steel casting workshop of Tangshan Locomotive and Rolling Stock Factory in Lunan District (CNR Tangshan Vehicle Factory),
Early Industrial Remains of Kailuan Mines in Tangshan,
Pillboxes and Railway Bridge of Tangshan South Station,
Tangshan South Station Platform Site,
Tangshan South Station Passenger Overpass,
Tangshan South Station Water Tower,
Tangshan South Station Waiting Shelter,
Tangshan South Station Fuxing Road Tunnel Bridge,
Yonghong tunnel bridge at Tangshan South Station (Dongfeng tunnel bridge),
Dahong Bridge at Tangshan South Station (Huaxin Textile Factory Special Line Railway Bridge),
Shuangqiaoli West Bridge at Tangshan South Station (Shuangqiaoli Kailuan Line Railway Bridge),
Shuangqiaoli East Bridge at Tangshan South Station (Shuangqiaoli Jingshan Railway Bridge)
Tianjin
East Station
Tianjin East Railway Station Jiefang Bridge (Zhongzheng Bridge, Wanguo Bridge),
Former site of the Works Section of the Tianjin Railway Branch,
The former site of Tianjin East Station Transportation Ministry of Materials Storage,
Tianjin East Station Vehicle Section Annex Building,
Former site of Peking–Mukden Railway Hotel,
Main Building of Tianjin Railway Engineering School
Lutai StationWater Tower of Lutai StationGuye StationElevated coal platform at Guye Station,
Guye Railway Bridge at Guye Station
Hangu StationHangu Iron Bridge of Hangu Station
Junliangcheng
Station
Former site of the station building at Junliangcheng Station
Former site of the stationmaster’s apartment at Jungangseong Station
Beijia
dian
Station
Qixin Cement Industry Museum B Field Ash Train Loading Trestle of Beijiadian Station Factory and Mining Railway,
Shahe Railway Bridge at Beijiadian Station
Tanggu
Branch
Line
Tanggu South StationStation House, Telegraph House, and Railway Public Security of Tanggu South Station,
Tanggu South Station Warehouse,
Tanggu South Station Pier 8,
Tanggu South Station Trigger Room,
Beining Road Repair Shop of Tanggu South Station (Tanggu Station Locomotive Depot),
Tanggu South Station Locomotive Section of Old North Site,
Existing mechanic room at Tanggu South Station,
Former Tanggu Water Treatment Plant Material Yard Used Room of Tanggu South Station,
Jeme Tian You Office Room at Tanggu South Station,
Tanggu South Station water well and four parallel tracks
Tanggu Wharf Site of Kailuan Mines Bureau,
Hangar Building of Tanggu Back-turning Section
Tanggu South Station Xinhe Wharf (former Xinhe Material Yard Wharf)
Tuozitou StationLuanhe Old Railway Bridge at Tuozitou Station
Luanzhou East Railway StationLuanzhou Station Passenger Bridge
Qinhuangdao
(7 sites)
Qinhuangdao South Railway StationQinhuangdao Harbor Modern Building Complex,
Qinhuangdao South Station Platform Site,
Tanghe Bridge at Qinhuangdao Station
Shanhai
guan Station
Stone River Bridge at Shanhaiguan Station,
Shanhaiguan Eight-Nation Allied Forces Qinhuangdao Camp Site,
Shanhaiguan Bridge Plant,
Modern Railway and Ancillary Buildings at Shanhaiguan Sation
Table 3. Overview of the station-quantity distribution.
TypesStationsQuantity
Main LineHangu Station1
Lutai Station1
Tuozitou Station1
Luanzhou East Station1
Junliangcheng Station2
Guye Station2
Beijiadian Station2
Qinhuangdao South Station3
Shanhaiguan Station4
Tianjin North Station9
Tianjin East Station6
Tangshan South Station13
Branch LineTanggu South Station13
Total1358
Table 4. Overview of the type-quantity distribution of heritage.
Main TypesMedium TypesNumber of Heritage
Main Building CategoryBuildings of the Train Operation Section7
Buildings of the Locomotive Section7
Buildings of the Maintenance Section1
Buildings of the Vehicle Section1
Ancillary Buildings1
Residential Buildings2
Warehouse1
Office Buildings3
Public Facilities9
Military Installations2
StructuresStructures24
Total1358
Table 5. Overview of the spatiotemporal distribution of heritage.
PeriodTianjinTangshanQinhuangdaoTotal
1949–19785308
1911–194974213
1881–19112012537
Total3219758
Table 6. Conservation levels distribution of the heritage.
Protection LevelTianjinTangshan Qinhuangdao Total
National Industrial Heritage List17210
Major Historical and Cultural Sites Protected at the National Level112215
State Protected Historic Site1203
Municipal Key Cultural Relics Protection Units1001
Municipality Protected Historic Site4206
Historical Architecture of the City2103
District-Level Cultural Relics Protection Units and Immovable Cultural Relics4004
Total2414442
Table 7. Sources of heritage-related geographic information data.
Data CategoryComprehensive DatabaseSource (of Information etc.)Note
Base map of the regionMap of China under the Supervision of the Ministry of Natural ResourcesSurveying and Mapping and Geographic Information Centers of Tianjin Municipality and Hebei ProvinceReview No. GS (2019) 1823
Remote sensing image dataLandsat8 OLITIRS Satellite Digital Data SetAll-in-One Map Downloader2020, Landsat, raster, 30 m spatial resolution, less than 10% cloud cover, United States Landsat
DEM dataDEM Digital Elevation DatasetGeospatial Data CloudGDEMV330M Resolution
Administrative division data of Tianjin, Tangshan, QinhuangdaoMulti-year Administrative Division Boundary Database in China (provincial, municipal, and district level) Platform of Resource and Environmental Science and Data Center; Local Statistical Yearbook of Tianjin, Tangshan, and Qinhuangdao Vector (spatial)
Regional vegetation cover dataSpatial Distribution of 1 Million Vegetation Types in ChinaRaster with 1 km spatial resolution
Railway and road dataA multi-period road spatial distribution dataset for China, 1995–2020Vector (spatial)
Land use status dataChina Multi-period Land Use Remote Sensing Monitoring Data Set (CNLUCC)U.S. Landsat, vector and raster, spatial resolution 30 m, less than 20% cloudiness
Transportation FacilitiesPoint-of-interest POI dataset, China, 2005/2010/2015–2021Vector (spatial)
Table 8. The average closest proximity distance across the railway architectural heritage.
Average Observation Distance (m)Expected Average Distance (m)Nearest-Neighbor RatioZ-Scorep-Value
1252.67066284.88180.199315−11.6655880.000000
Table 9. Nearest-neighbor index and distribution pattern.
CityAverage Observation Distance (m)Expected Average Distance (m)Nearest-Neighbor RatioZ-Scorep-ValueTypology
Tianjin964.04983852.57810.250235−8.1139260.000000cohesion
Tangshan1559.11522306.52560.675958−2.7021440.006889cohesion
Qinhuangdao1740.30011837.00520.947357−0.2664520.789891randomization
Table 10. Neighborhood index and distribution pattern of architectural heritage by category.
CategoryAverage Observation Distance (m)Expected Average Distance (m)Nearest-Neighbor RatioZ-Scorep-ValueTypology
Main building 7996.738210,807.53100.739923−2.0514350.040225cohesion
Ancillary buildings3764.066510,871.52340.346232−5.1567870.000000cohesion
Structures3482.38359673.59750.359988−5.9982460.000000cohesion
Table 11. Lorentz curve data sheet.
DistrictNumber of HeritageYiYi AccumulationUniformly Distributed Accumulation
Lunan District in Tangshan 1322.4137931022.413793107.692307692
Binhai New District in Tianjin1322.4137931044.8275862015.38461538
Hebei District in Tianjin1220.6896551765.5172413723.07692308
Shanhaiguan District in Qinhuangdao 46.89655172472.4137930930.76923077
Harbor District in Qinhuangdao35.17241379377.5862068938.46153846
Guye District in Tangshan35.17241379382.7586206846.15384615
Luanzhou in Tangshan23.44827586286.2068965453.84615384
Dongli District in Tianjin23.44827586289.6551724061.53846154
Heping District in Tianjin23.44827586293.1034482769.23076923
Lubei District in Tangshan11.72413793194.8275862076.92307692
Ninghe District in Tianjin11.72413793196.5517241384.61538461
Hedong District in Tianjin11.72413793198.2758620692.3076923
Hexi District in Tianjin11.724137931100100
Table 12. Index of the spatial distribution balance of heritage categories.
CategoryNumber of HeritageNumber of Distribution AreasGini ValueS-Value
Main buildings1770.463860.75817
Ancillary buildings 1770.463860.75817
Structures2490.532120.67824
Disclaimer/Publisher’s Note: The statements, opinions and data contained in all publications are solely those of the individual author(s) and contributor(s) and not of MDPI and/or the editor(s). MDPI and/or the editor(s) disclaim responsibility for any injury to people or property resulting from any ideas, methods, instructions or products referred to in the content.

