1. Introduction
Despite the fact that the number of road accidents is steadily leveling off and generally on the decline due to the systematic use of technology, some nations continue to experience incidents caused by human error. For example, the United States of America faces increasing problems from traffic accidents [
1]. According to one study, human factors account for 90–95 percent of all accident incidents, with around 60 percent of those accidents directly attributable to human mistakes [
2], making it a main cause of traffic incidents. Autonomous vehicles (AVs) are driverless vehicles that run on a sensor system and get notified based on their proximity. Furthermore, connected autonomous vehicles provide additional safety and awareness through various connectivity features such as vehicle to vehicle (V2V) and vehicle to infrastructure (V2I).
Manufacturers and experts claim that autonomous vehicles are guaranteed to overcome human errors and increase safety for humans in numerous instances [
3,
4,
5]. Additionally, autonomous vehicles provide an increased road capacity [
6], environmental friendliness, and congestion reduction [
7] by enabling platoon building, V2V and V2I communications, and the highway may be made more comfortable by, among other things, decreasing the number of vehicle stops at junctions [
8]. Among many other features, cooperative adaptive cruise control (CACC) and adaptive cruise control (ACC) affect the travel experience [
9]. One of the numerous benefits of CAVs is that they communicate and share information with other entities, such as other cars, infrastructure, or traffic systems, which reduces response times and shortens safety headways compared with human-driven vehicles. The capacity of the road is increased when there is little space between two subsequent road agents. Other benefits, including interacting with infrastructures to get early warnings of accidents, traffic, or natural disasters are essential to optimizing the use of travel time. To understand the influence on the actual world, these behaviors must be replicated in a simulation model [
9]. According to research in the past, it is predicted that C/AVs will improve traffic performance while reducing emissions and energy use [
9,
10].
Microscopic traffic simulations may be utilized to perceive different phases of the introduction of automation on the streets alongside conventional cars to comprehend the impacts of AVs and CAVs on the present transportation system prior to real-world deployment. Effective modeling techniques are needed to assess the effects of these significant changes [
9,
11]. The driving behavior settings in any traffic simulator also play crucial roles in how accurately the simulation models reflect reality.
Even today, it is still not possible to obtain publicly available, real traffic data from autonomous vehicles. This gap hinders the calibration and validation of the connected autonomous vehicle (CAV), two important elements of microscopic traffic simulation. To overcome this gap, this study assumes that both CAVs and AVs would behave similarly to human-driven vehicles. There are traffic volumes and speeds from human-driven vehicles which could be used for C/AVs as well from the assumption of their similarity. The characteristics of driving behaviors for connected and/or autonomous vehicles (C/AVs) need to be determined according to distinct driving behaviors, such as aggressive, normal, and safe [
12], as reflecting on three different human driving patterns makes it more humanlike than other C/AVs. Vehicles will decide which parameters to follow from their permissible range in accordance with their regulated driving behaviors. The direct user selection of these driving behaviors is also possible through external connections, such as V2V, V2I, and emergency states. These behaviors exhibit wildly disparate responses to roads and traffic. A safe driving behavior means the vehicle is not permitted to drop the safe distance below the authorized limits; however, an aggressive driving behavior means the vehicle may have a smaller safe driving distance with an increased acceleration, resulting in C/AVs that resemble human behaviors [
12,
13,
14].
The research findings show how traffic and safety aspects are influenced by C/AVs that resemble human driving. Additionally, we will use a sensitivity analysis platform to visualize how various AV driving behavior parameters interact with the traffic performance. The speed, delay time, and travel time have all been used to examine the traffic performance. In this process, only the interactions among motor vehicles are taken into account. For these types of studies, the PTV VISSIM and surrogate safety assessment model (SSAM) must work together to identify the number of potential conflicts from the simulated data and vehicle trajectories to understand the safety implications of C/AVs. Examining how mixed traffic in an urban corridor will be impacted by the humanlike behaviors of C/AVs is the primary objective of this study. To do this, the HV–AV–CAV ratio for three traffic flows—peak hour traffic demand, 20% below the peak hour traffic demand, and 20% over the peak hour traffic demand—will be studied. For C/AVs, three different driving behaviors—aggressive, normal, and safe—will be evaluated. The second objective is to look at how the parameters of the AVs’ driving behavior connect with the traffic performance. To determine which car-following parameter has the greatest influence, this will be researched and studied. Following the identification of influential car-following parameters, a sensitivity analysis for a chosen traffic performance indicator will be carried out. This research outlines a sustainable method to achieve autonomous technologies utilizing the current road network without the need to build new lanes. The additional roadworks can result in environmental emissions and may require the acquisition of more land for extension. By sharing the space of the existing motorway and letting autonomous vehicles into mixed traffic, a considerable economic and environmentally friendly balance can be attained.
2. Related Work
Different functions (event script files) are currently attached in the simulator to implement these C/AV features in the microscopic simulation. There are many functionalities in VISSIM 11 or later versions to explore C/AVs [
12]. Platoon building, signal influence, and V2V and V2I connectivities are all included in VISSIM 2020 and are implemented both universally (using GUI) and exclusively (using COM) [
12,
14,
15]. In the VISSIM interface, the Wiedermann 74 does not provide many options for customized modeling, so the standard method for modeling C/AVs can be used to build modified versions of the Wiedermann 99 [
12]. Similar research with fewer parameters from Wiedermann 74 suggested that as the AV inflow increases, the capacity of roads will become quite congested [
6]. The C/AVs that resemble human-driven vehicles are a subset of traditional driving behaviors and can be acquired with the right legal framework to correspond with various autonomous driving behaviors. In order to improve the automation features in the VISSIM interface, some extensively created simulator-integral and user-defined parameters are completely dedicated to match the characteristics of AVs and CAVs [
3,
12,
13,
14,
16]. Additionally, numerous C/AV features are modeled using external script files. The calibration and validation are integral parts in the microscopic traffic simulation to create a realistic simulation. The one of the major challenges in connected and/or autonomous vehicles (C/AVs) is the lack of a measure of effectiveness from the real world to do the calibration. It is also difficult to find a set of calibration parameters that matches the modeling and simulation technique for the C/AVs [
12,
17,
18]. The time-to-time traffic performance and safety proved to be great indicator for optimistic research studies focusing on C/AVs [
19]. The emissions are also an indicator in many studies, but the emission calculation significantly varies over the years, based on individual software and calculation techniques.
Previous studies showed that a higher influx of CAVs in mixed traffic creates higher quality traffic conditions. It is to be expected that in the first stage of the implementation of C/AVs, the road capacity and thus, the speed of vehicles, will drop. With more of these kinds of vehicles on the road, the status of the mobility, road safety, and environmental conditions will improve due to various benefits of AV technologies such as platooning [
20,
21].
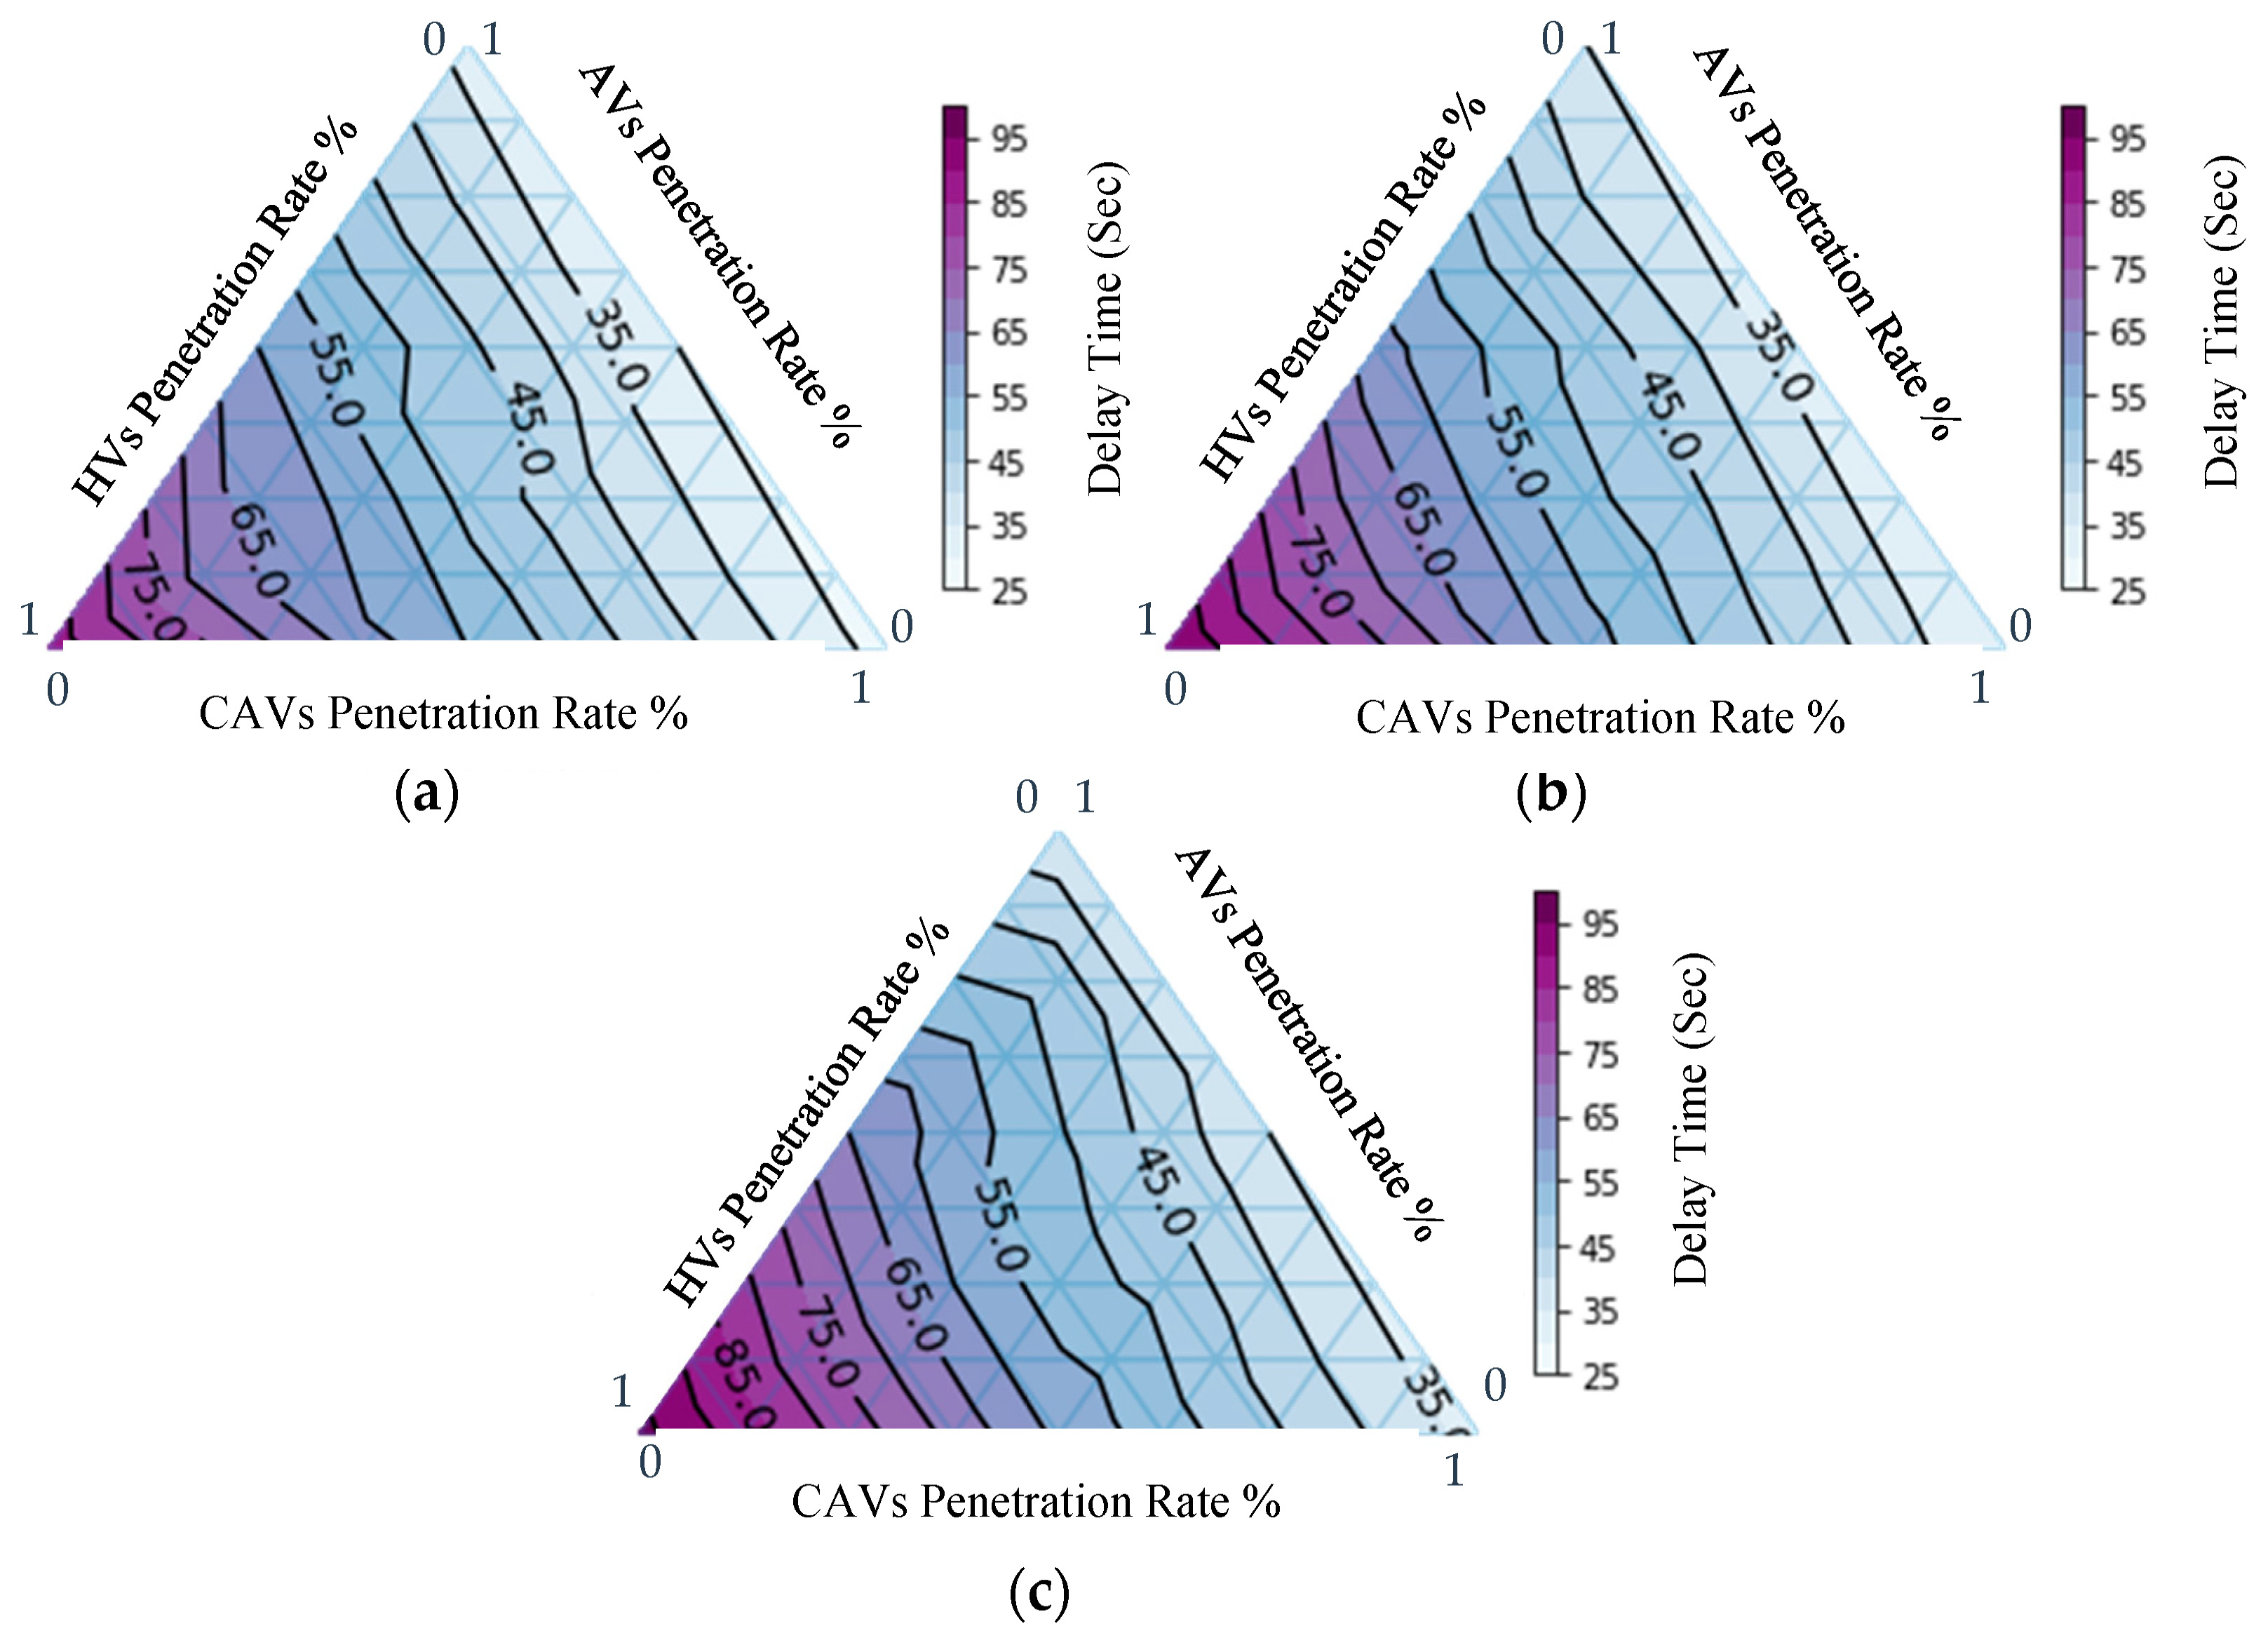
Figure 1 shows three ternary plots which depict three different traffic demand levels, where the color indicates the harmonic average speed over the network. A high traffic demand leads to a deterioration of traffic conditions, as the number of interacting vehicles gradually increases and reaches technical limits [
9,
10].
Both the urban motorway and the freeway benefit greatly from automation features like connectivity to other vehicles and infrastructure, emergency stops, the formation of vehicle platoons, slowing down before a traffic signal, and automatic driving behaviors [
6,
22]. Researchers showed that in the initial stages of implementation, C/AVs should be self-driven and self-sufficient, as adaptive infrastructure development will take some time to fully absorb the connectivity features [
23]. In such an early phase of development and implementation, AVs will be ahead of CAVs in terms of functionalities. In summary, research methods and simulation processes of autonomous vehicles differ for car-following behaviors, lane changing behaviors, calibration methods, planned performance indicators, etc. Because of a lack of real-world data, autonomous vehicles are difficult to calibrate, and behaviors are also unpredictable, so it is safe to consider their performance to be akin to humanlike driving maneuvers. In theory, the traffic performance can be improved by using CAVs, but there is an obvious technical limit.
3. Methods
3.1. Simulation Framework
Figure 2 shows the organigram of the microscopic traffic simulation for this study that is inspired by a former study [
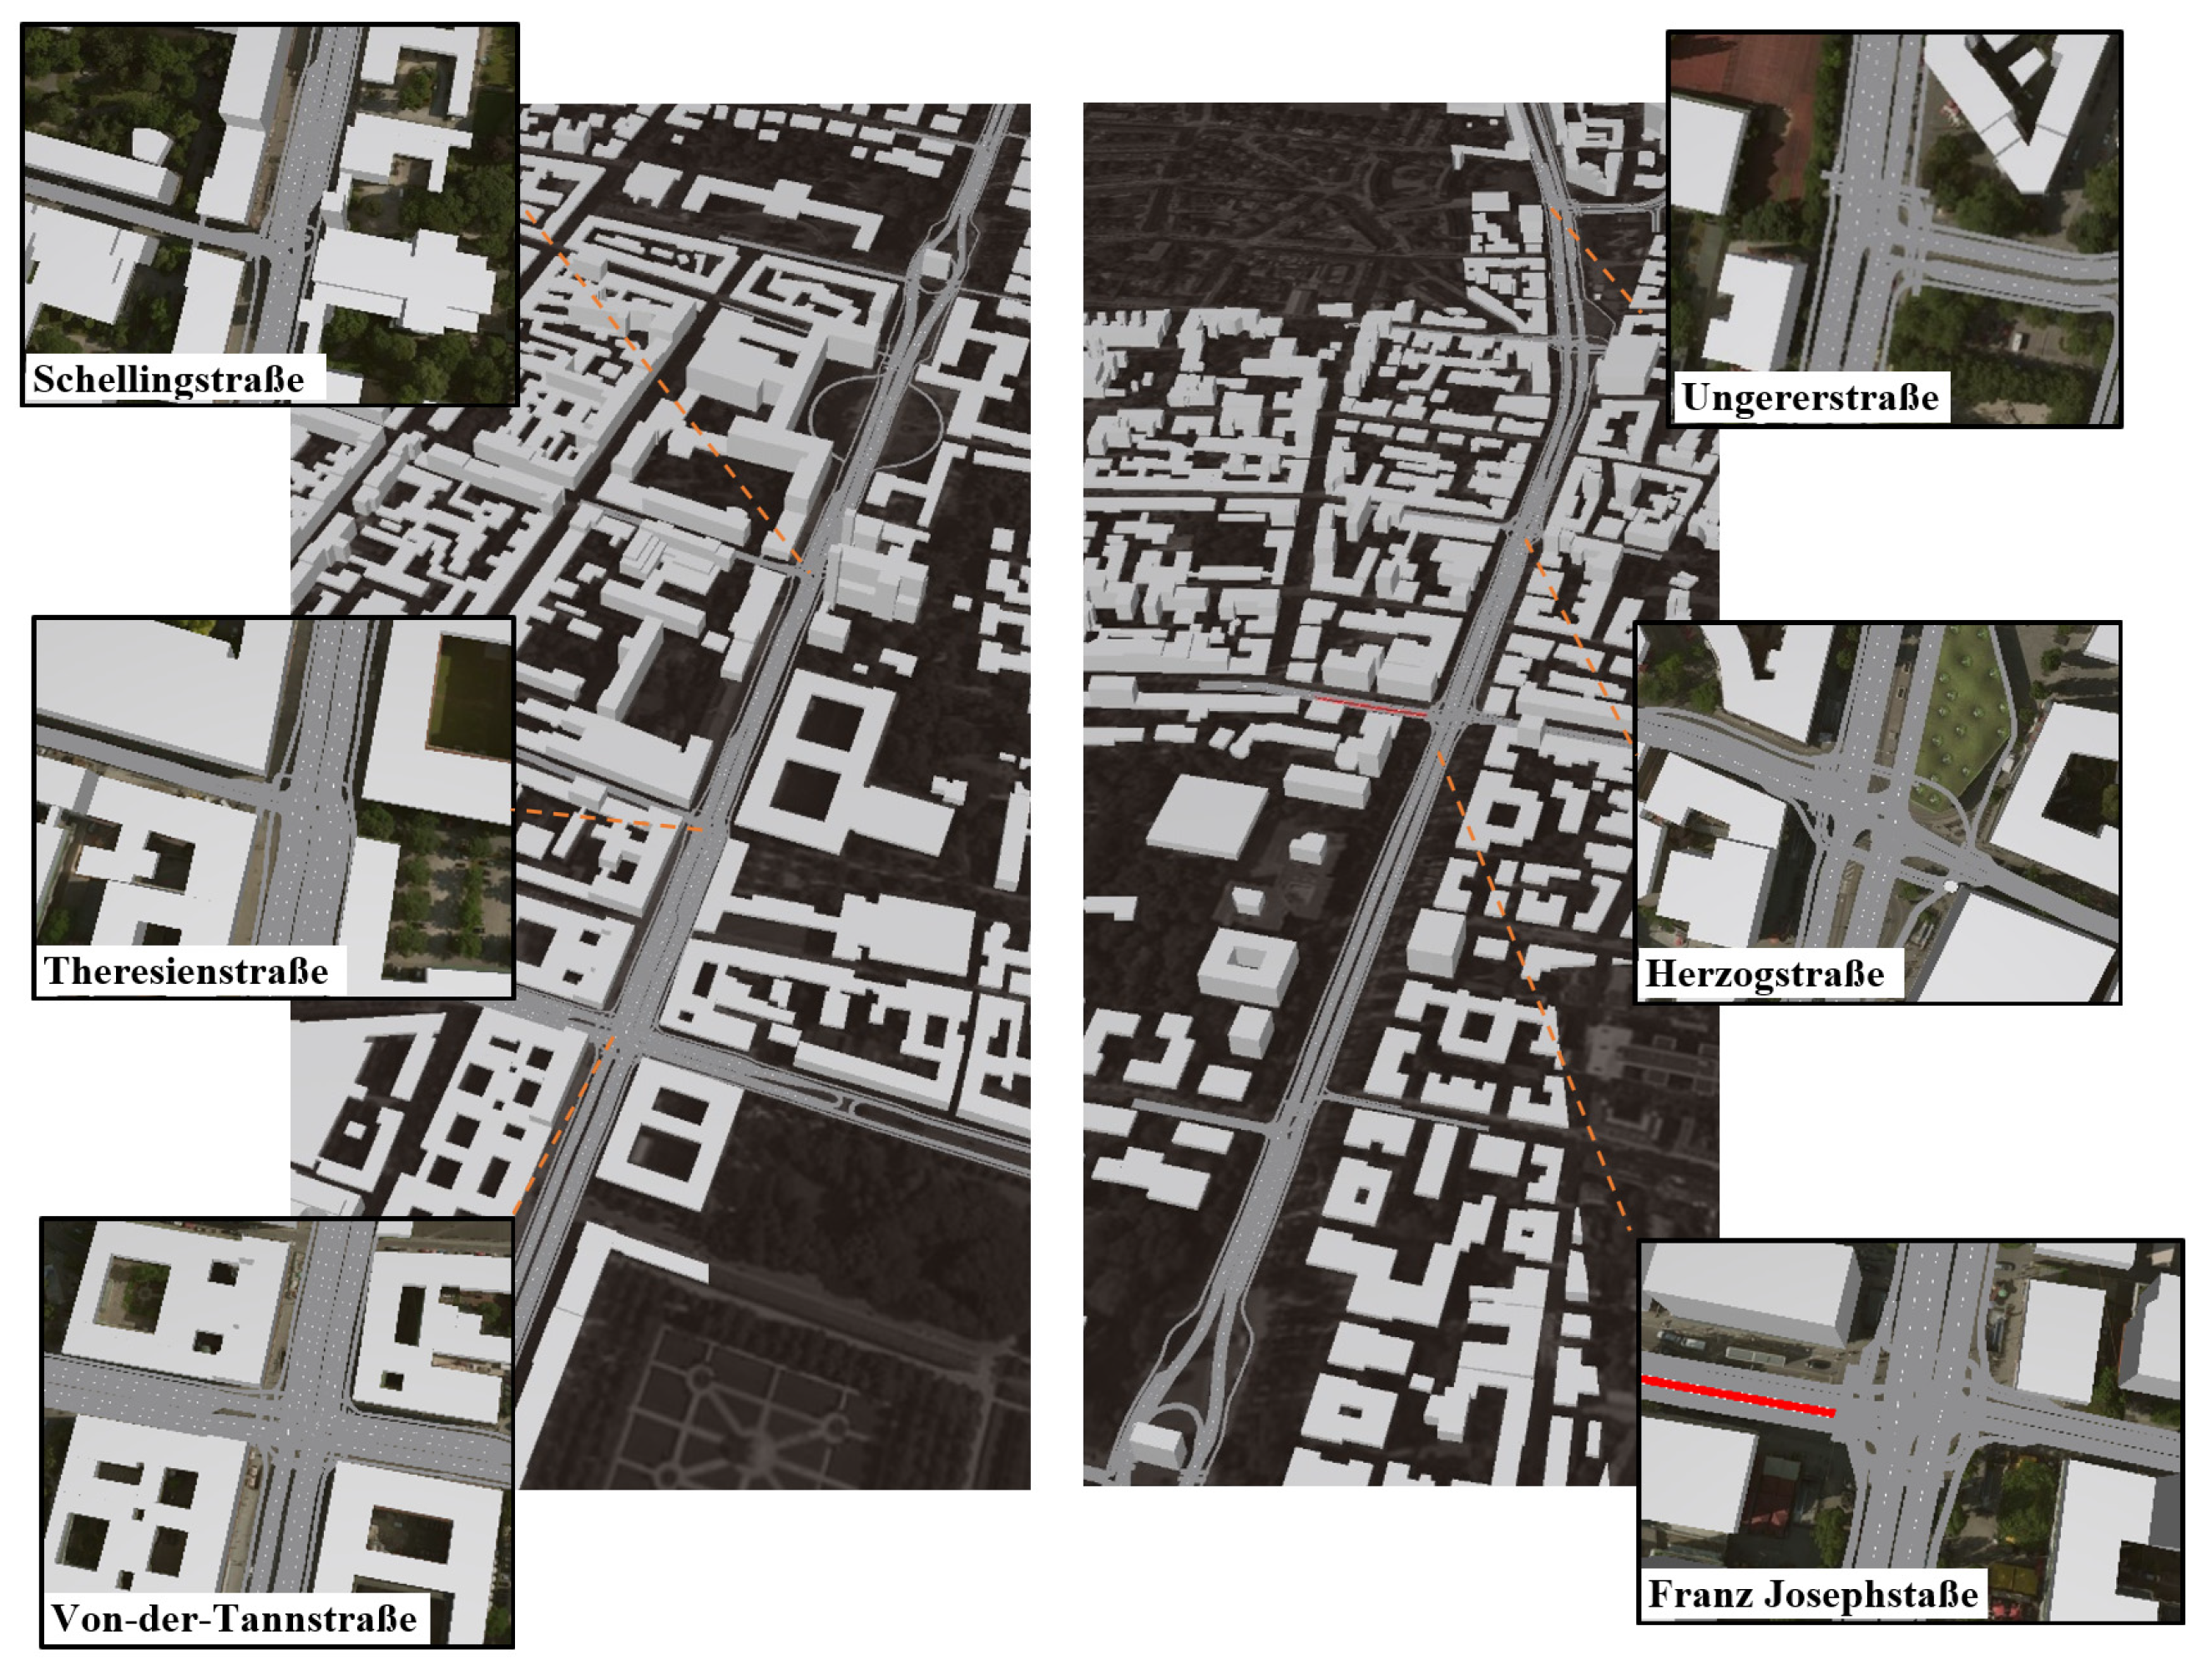
24]. Network data such as the road sign, location, and priority rules are the first to be input in the model. The base demand was obtained and processed from real traffic data, and the network was modeled to precisely detail the existing infrastructure. The network data contain the road sign, location, and priority rules. The overall approach taken in this study is to predict the impact of CAVs in an existing traffic condition. VISSIM, a microscopic traffic simulation software from PTV, was used to perform the simulation. Moreover, the SSAM was used for additional inquires such as the impact of an accident. The parameters of the car, following a model such as Wiedemann 74 or 99, are chosen in VISSIM to represent the human-driven vehicles for maneuver and lane behaviors. Along with the previously mentioned car-following behaviors, adaptive cruise control and cooperative adaptive cruise control technologies are used to represent C/AVs in the VISSIM interface. The vehicle-to-vehicle (V2V) and vehicle-to-infrastructure (V2I) connectivities assure the reflection of the real world into the model, and are stored as the external event. The surrogate safety assessment behavior assures the proper visualization of probable accidents.
3.2. Driving Behaviors
The three main autonomous vehicle driving behaviors that are currently part of the research phase are examined in this study. Aggressive, safe, and cautious are the names given to the driving behaviors. Unlike CAVs, AVs do not act as a platoon and do not slow down in traffic through connectivity. AVs are totally isolated and act according to the surrounding vehicles using their sensors. For this study, an Autonomous Level of 5 is considered, as per the Society of Automotive Engineers [
25,
26], as the level in which one can see the best results in terms of autonomous communication and self-sufficient actions.
Researchers indicated these can solely and exclusively begin from the Wiedemann 99 car-following model. The driving courses taken for this study were modeled after the “CoExist” project, which was funded by Horizon 2020 [
12]:
Aggressive: The cognizance, predictive, and safety maintenance features of the C/AVs’ driving behavior are thought to result in smaller gaps for all types of network maneuvers. The road capacity is increased by this driving behavior [
12]. C/AVs are expected to approach at high speeds, which allows for an aggressive driving behavior, because the system is intended to be non-human. It will allow for a shorter headway in the traffic.
Safe: The C/AVs’ safe driving behavior responds more like a human driver, with additional skills and features. The ability to measure the speeds and spatial distances of other vehicles up to a certain range is one of the features [
12].
Cautious: The cautious driving behavior is the ideal road code follower, because it consistently acts safely around all vehicles. A previous study has shown that the brick wall stop distance is always guaranteed by the cautious driving behavior [
12].
These C/AV features are imposed in the microscopic traffic flow simulation by a separate function. This function is implemented by the VISSIM interface by requiring an absolute braking distance. This feature could also allow for the vehicle to perform lane change maneuvers and act in unsignalized intersections. To keep wide gaps in the road, the vehicles will be taken care of [
12].
Table 1 shows additional settings for the C/AVs in the PTV VISSIM interface.
To model a new vehicle model in the simulator, various microscopic traffic simulators offer various features. There are many features and a methodology to create C/AVs in the interface with the Wiedermann 99 version of VISSIM. The parameters that have been adjusted to fit the car-following driving model of C/AVs are shown in
Table 2.
3.3. Performance Indicators
There are two categories of performance indicators which are used in this study: traffic performance and safety in terms of a possible conflict. The average travel time, average speed, and average delay time are part of the traffic performance. The average total number of conflicts is the representation of safety. These performance indicators are common when comparing the results from transportation simulations [
27,
28]. They are compared with natural traffic data to assess the traffic flow before and after the implementation of various measures such as the implementation of autonomous vehicles [
29,
30].
The average travel time is defined as the ratio of the total link travel time of the network and the number of links:
Here, the travel time of a link = .
The avg. travel time = .
The average Speed is defined as the ratio of the total link speed of the network and the number of links:
Here, the speed of a link = .
The avg. speed = .
The average delay time is defined as the ratio of the total link delay time of the network and the number of links:
Here, the vehicle trajectory is expressed as t.
Nt is total number of demand trajectories.
The delay is expressed as .
The average total number is defined as the ratio of the total link number of the network and the number of links:
Here, the travel time of a link = .
The avg. travel time = .
The link = i where (I is all the links in the network).
is total number of links in the network.
The post-encroachment time (PET) and time to collision (TTC) are used to measure the total number of conflicts. The surrogate safety measure (SSM) is used to evaluate the traffic safety. The PET indicates the possible risk, and the TTC describes the impending threat.
5. Results
5.1. CAV–AV–HV Combination
Ternary plots can visualize the proportional participation of three variables corresponding to one of the simulation outcomes.
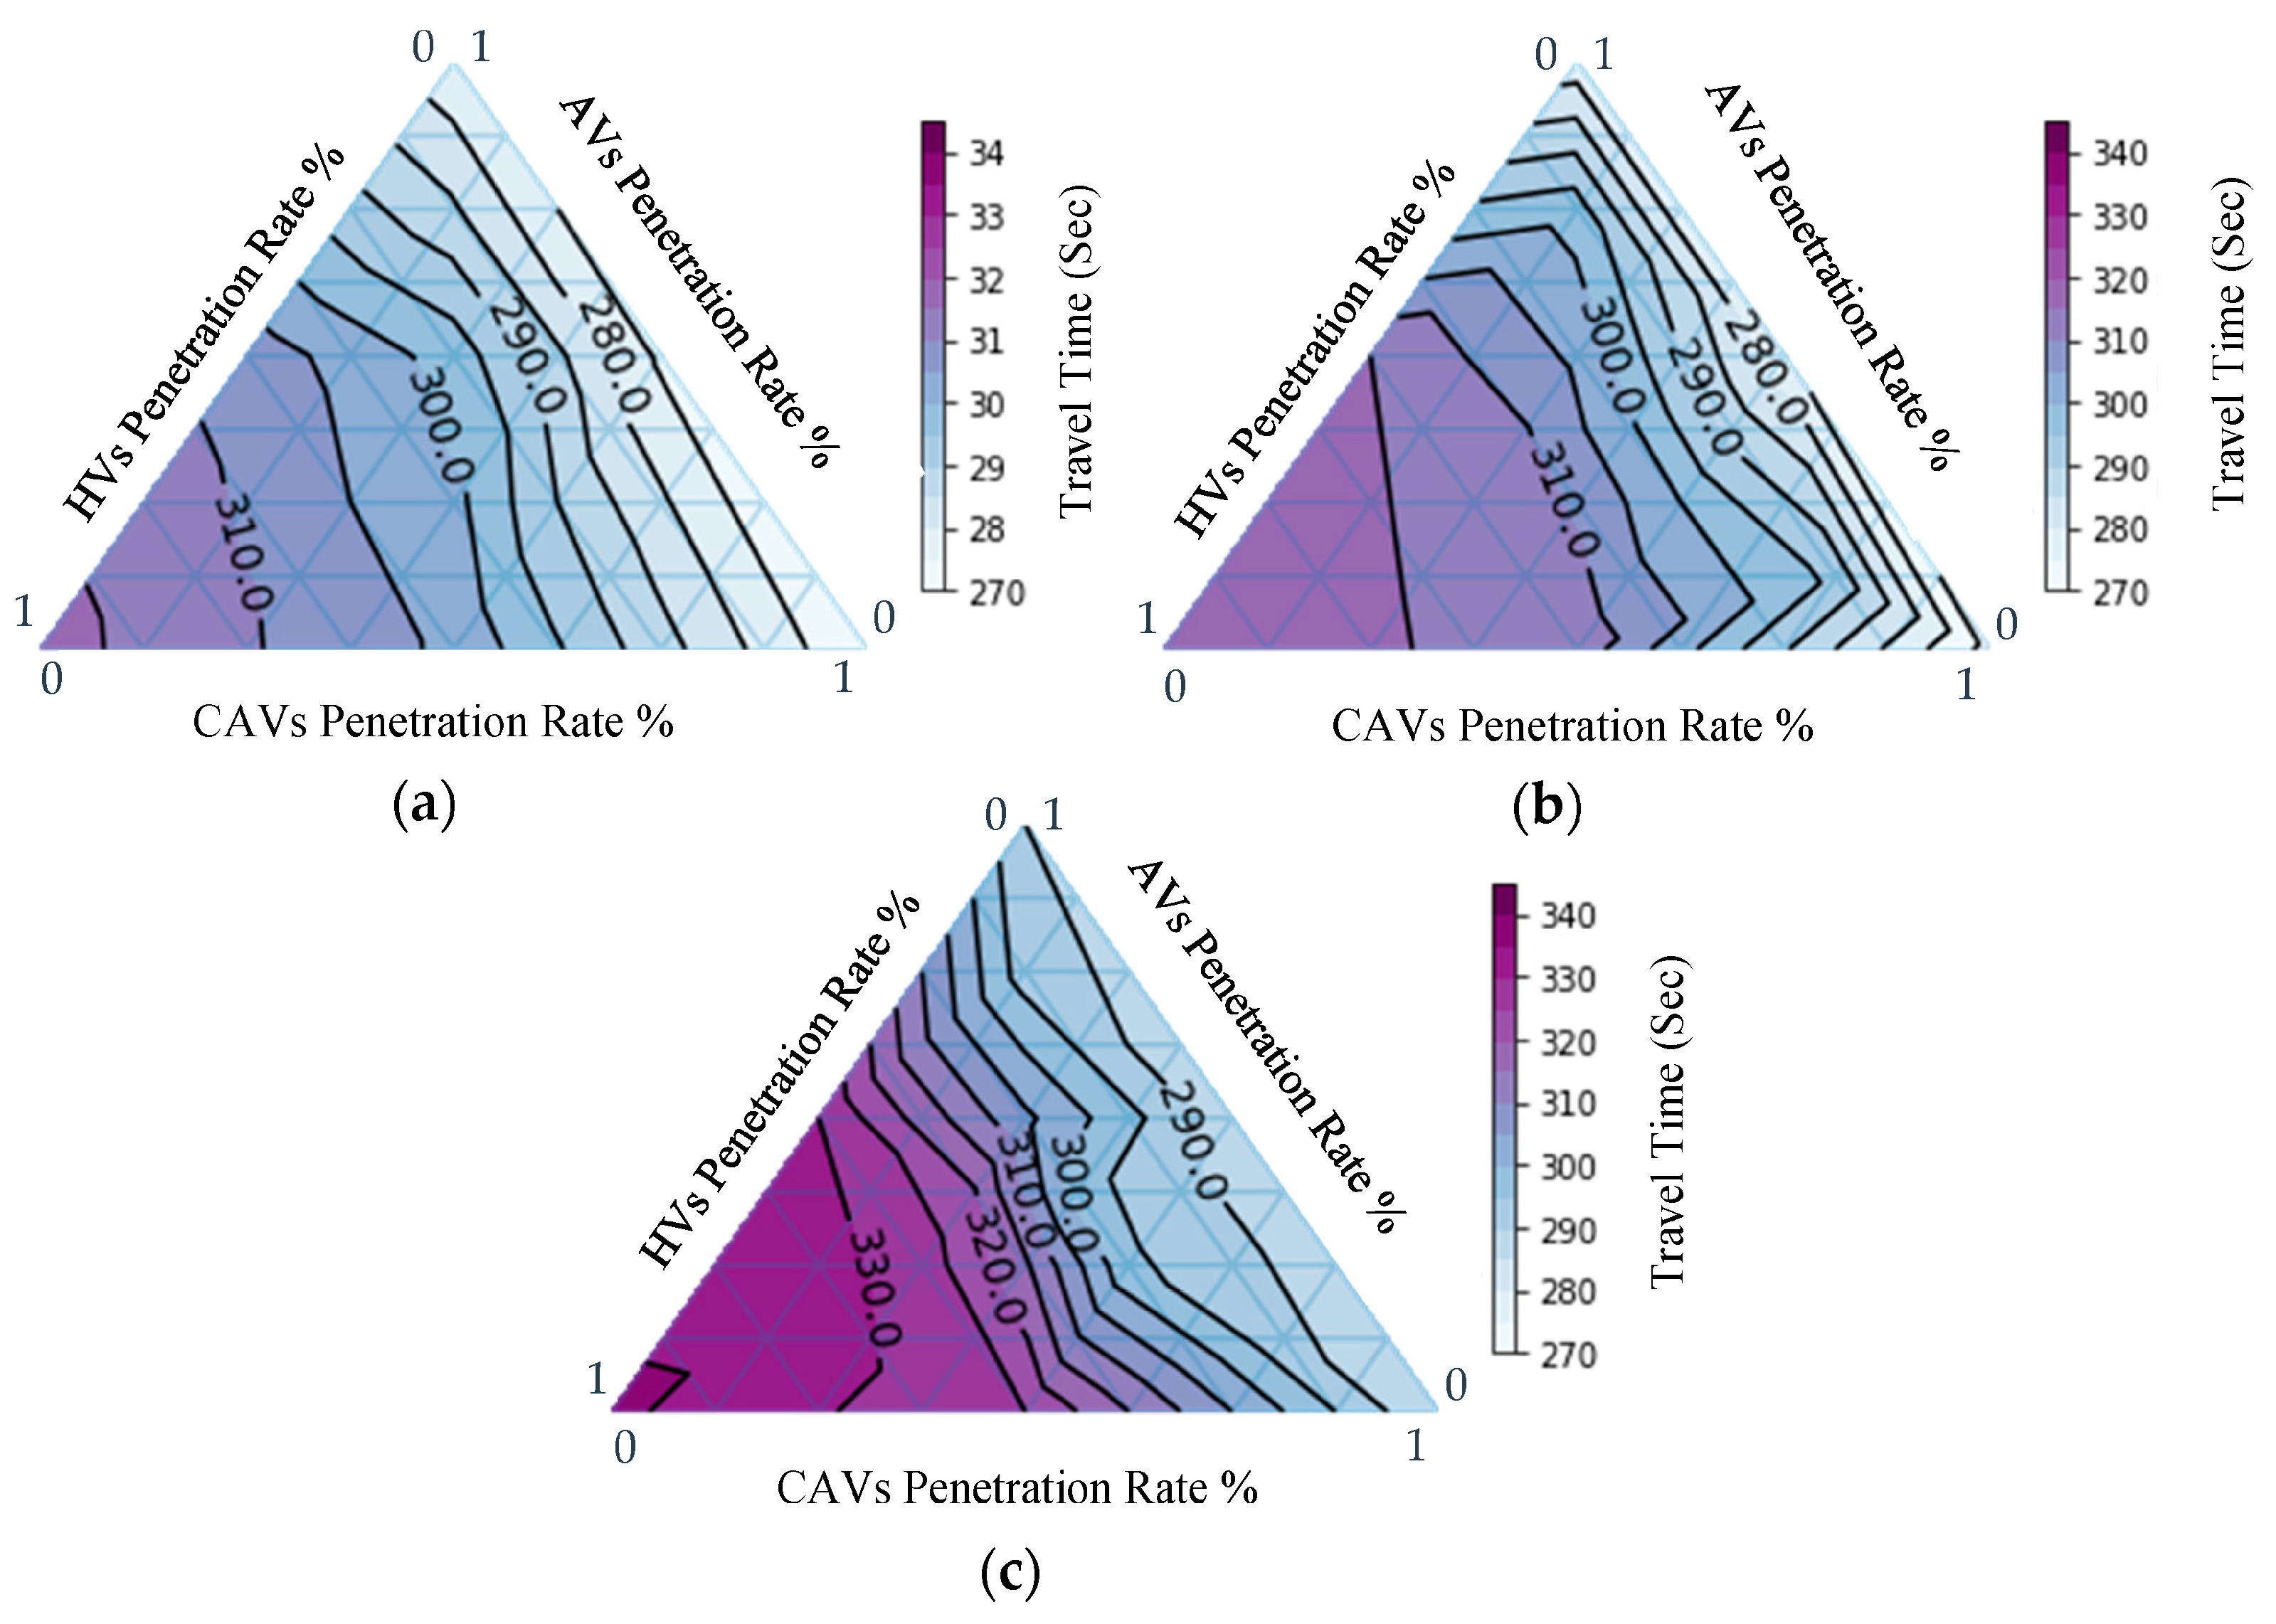
Figure 5 shows the travel time corresponding to the demand at 20% below the peak hour, at the peak hour, and at 20% above the peak hour. In this plot, each axis presents the proportion of inflow of a certain vehicle type, ranging from 0 to 1. The inner area of the ternary plot provides different possible HV–AV–CAV combinations. The plots indicate the travel time changes for three traffic demand cases. The colors inside the plots depict the status of the traffic performance based on different combinations of HVs, AVs, and CAVs.
The first impression from the ternary plots for the travel time is that CAVs demonstrate better performances than AVs and HVs for different demand cases. CAVs act on their platoon; slowing down automatically on upcoming queues gives it an advantage over AVs, which only work according to their surrounding vehicles. Increasing the proportion of CAVs by a certain amount reduces the travel time more quickly than when increasing the proportion of AVs by the same amount. With higher AV–CAV inflows, the network encounters a lower travel time than any of the other combinations with higher influxes of HVs. As AVs and CAVs come with diverse types of features such as connectivity, early speed reduction, and the management of distance, the traffic performance increases for higher C/AV inflows. These additional strategies offered by C/AVs work better for the peak hour demand and 20% below the peak hour demand than the 20% above the peak hour demand case for the same corridor study. The number of interacting vehicles plays a role in this phenomenon. With increasing traffic on the road, the interaction of the vehicles intensifies as the communication continuity remains stable in the network. For the case of speed, as shown in
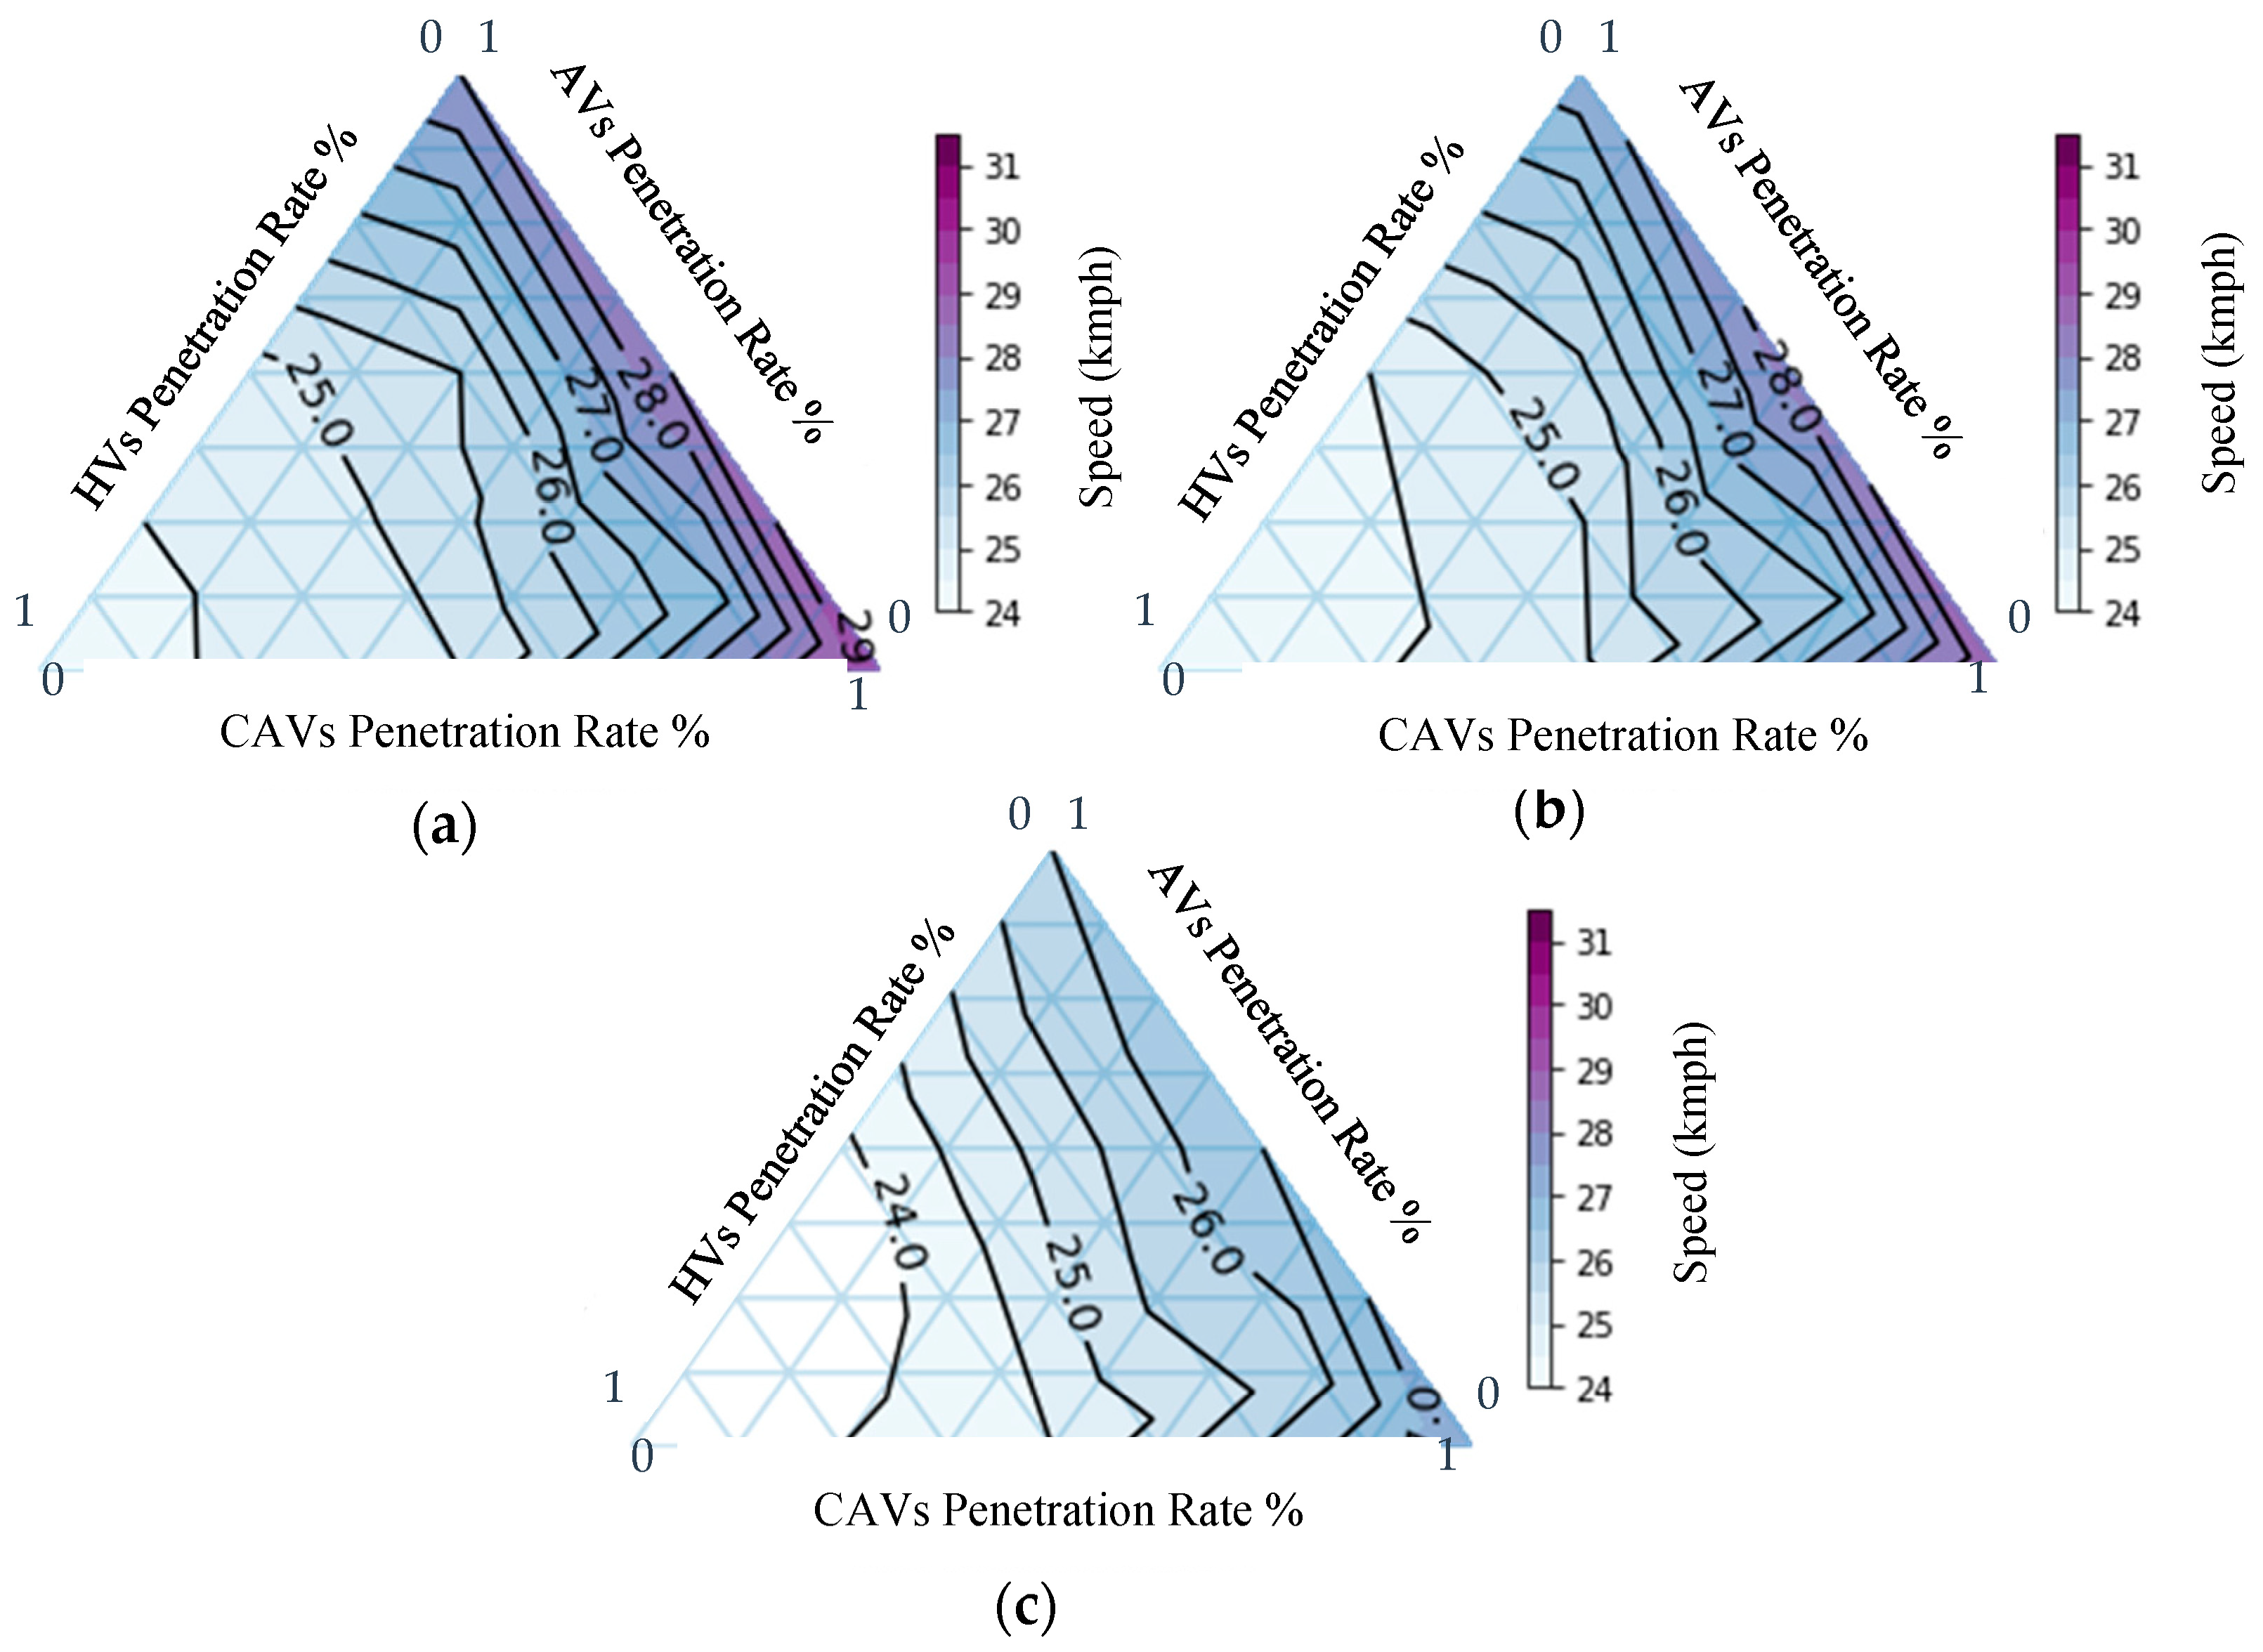
Figure 6, a similar pattern can be seen for all three demands: the peak hour, 20% below the peak hour, and 20% above the peak hour. A higher AV–CAV inflow outperforms a higher HV–AV inflow in every possible similar combination, which can be seen in the ternary plots of
Figure 5. The cause behind the improved speeds remains the same.
Figure 7 shows that the delay times strengthen the reports of the other performance indicators, travel time and speed, as expected. The scenarios with a lower travel time and a higher speed tend to have a lower delay time and a lower number of stops [
27,
32]. The delay time reduces more quickly for a higher AV–CAV inflow, as expected.
Based on the above results, it can be said that the introduction of automation in the network performs better overall than HVs alone. There are little improvements for the lower amount of automation inflow in the transportation system. A higher degree of improvement can be seen in the models once the automation participation ratio reaches a certain level. The normal driving behaviors in this study interact optimistically positively for the travel time, speed, and delay time. CAVs show a better performance, because the additional properties of CAVs can conserve a higher competency in the network. The ability to make a platoon, slow down to the signal, and interact with other vehicles make the CAV a strong actor in the traffic flow.
More automation in the network assures a higher efficiency of the automation itself, because vehicles can communicate to each other and react with others intelligently. For a higher number of vehicles in the network, the number of interacting vehicles needs to be higher, but to study the variability, it was kept constant at three. This results in the lowering of traffic performances in the network again for a high traffic demand after reaching the yield point.
5.2. Comparison between CAVs and AVs
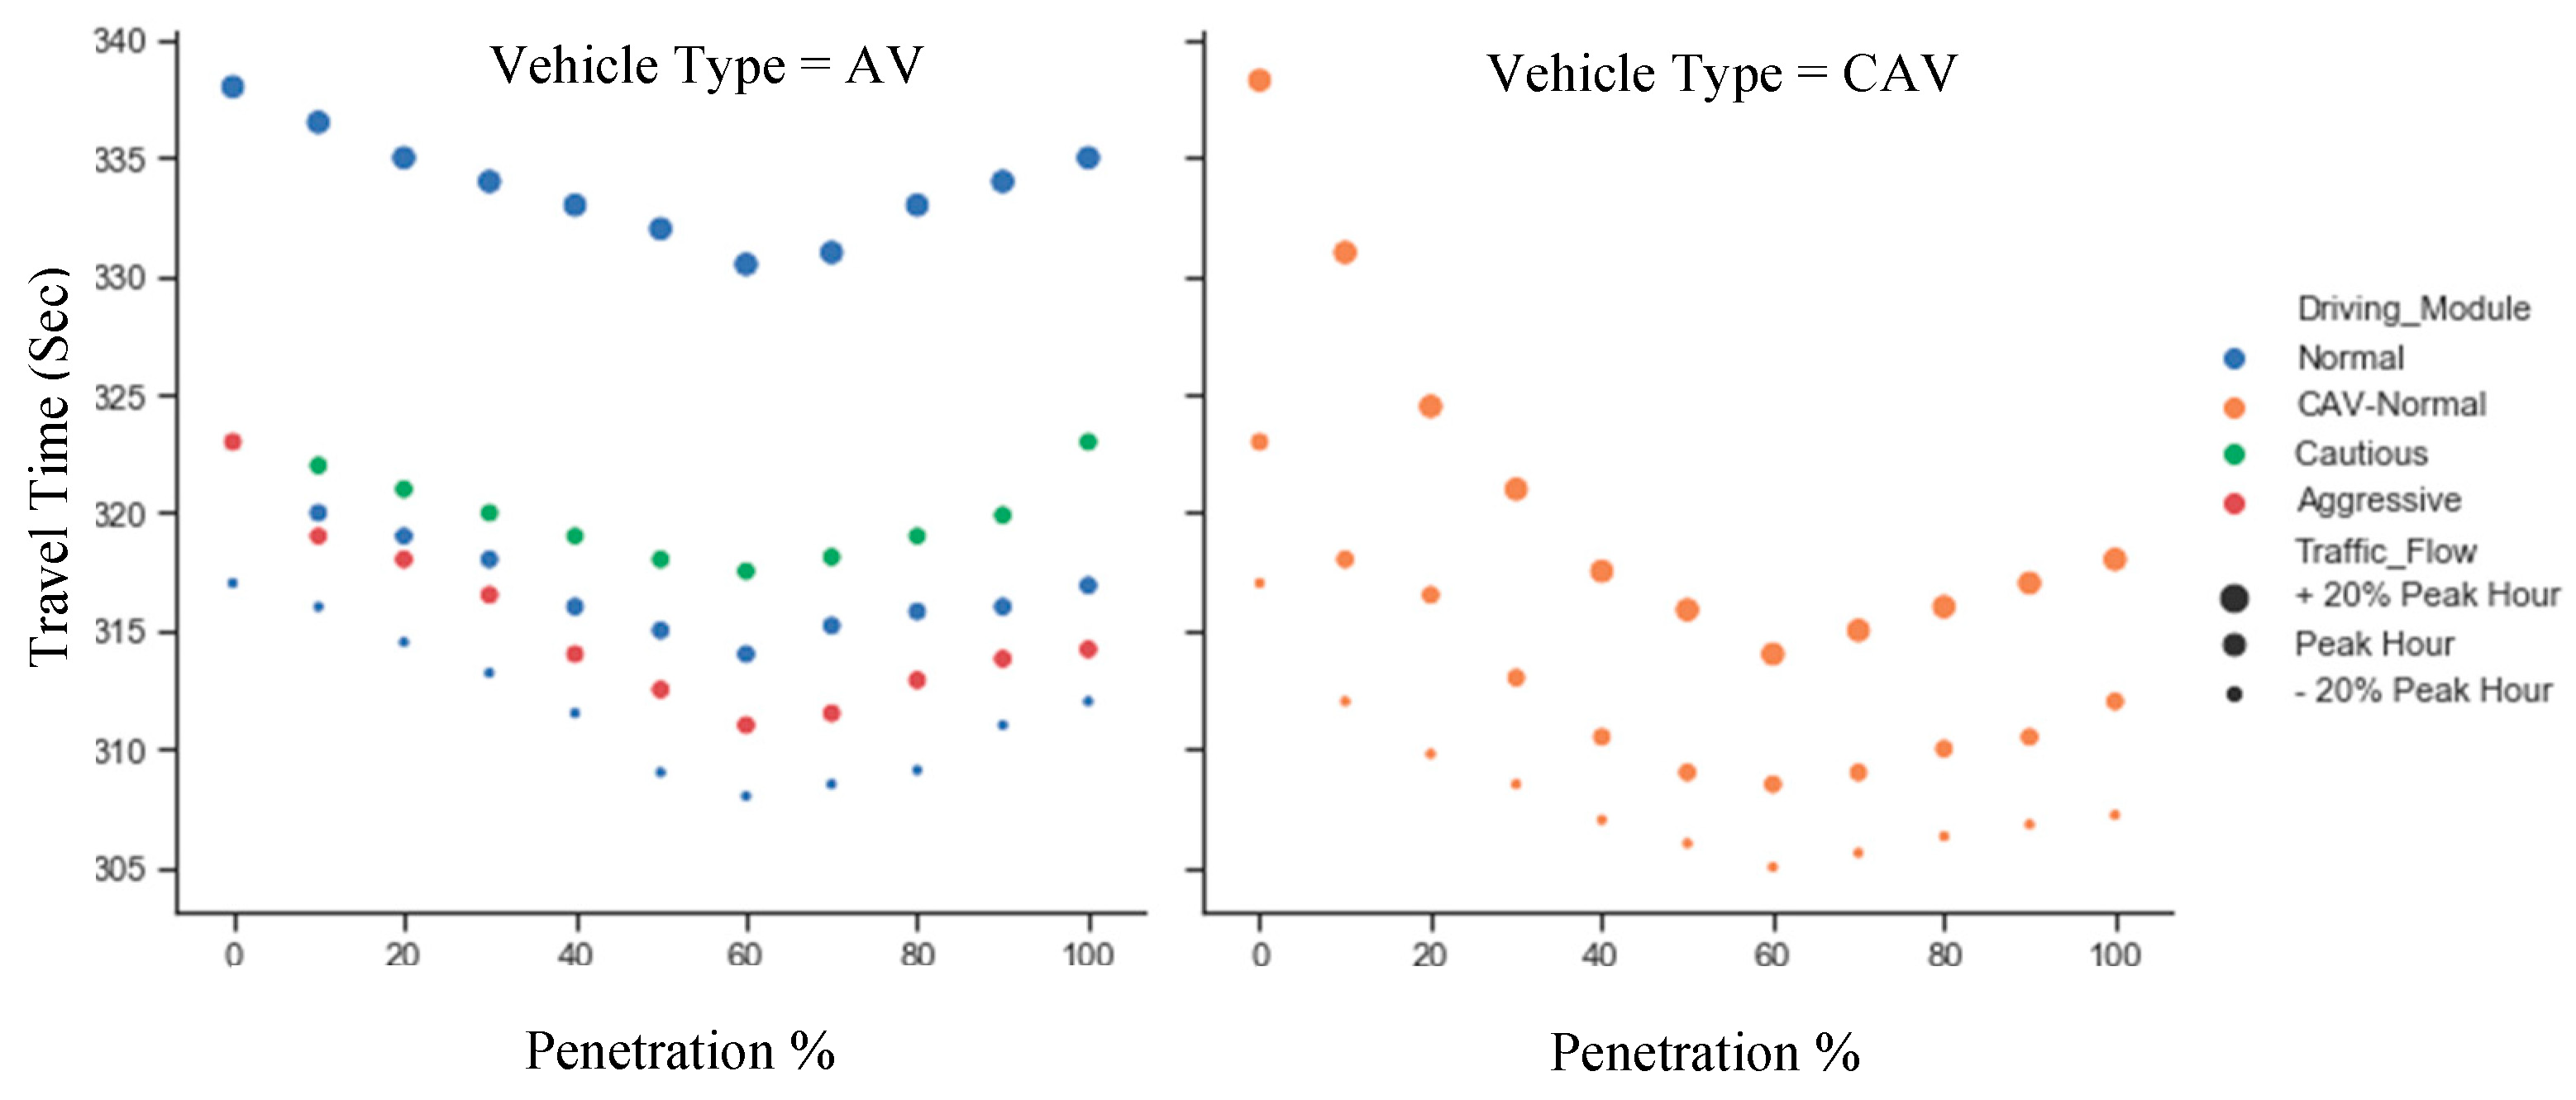
In
Figure 8, the travel time scatter plots of AVs and CAVs reinforce the conceptual gains and in addition, some additional information about the driving behaviors. CAVs have additional features over HVs and AVs that show a similar trend, that the CAVs use a lower travel time in contrast to the other vehicle types. A gradual shift in the travel time can be seen for different traffic demand cases. The lowest travel time is achieved faster for the higher demand. The availability of the required number of vehicles in the network causes the earlier yielding of the travel time. The travel time yields into the lowest value in the range of inflow between 50–70% C/AV penetration. This phenomenon can be connected to the fact that the number of interacting vehicles plays a major role in the performance. If there are more vehicles in a segment of the network than the allowable number of interacting vehicles, the performance ought to drop as most of them are not interacting after the yielding point. In summary, with a significantly higher quantity of vehicles, the interacting vehicle range surpasses the number of vehicles in the street.
Likewise, different traffic demand cases demonstrate differences in the performances, and the driving behaviors cause differences in the traffic performances as well. The cautious and aggressive driving modes illustrate higher and lower travel times, respectively, than the normal driving mode. Cautious driving modes conserve the safe measures in high levels, which elongate the travel time more than in a normal state. In contrary, the aggressive drivers maintain closer gaps with their surroundings and react aggressively in the intersection, so the travel time reduces, and the capacity of the segment increases for the same amount of traffic demand.
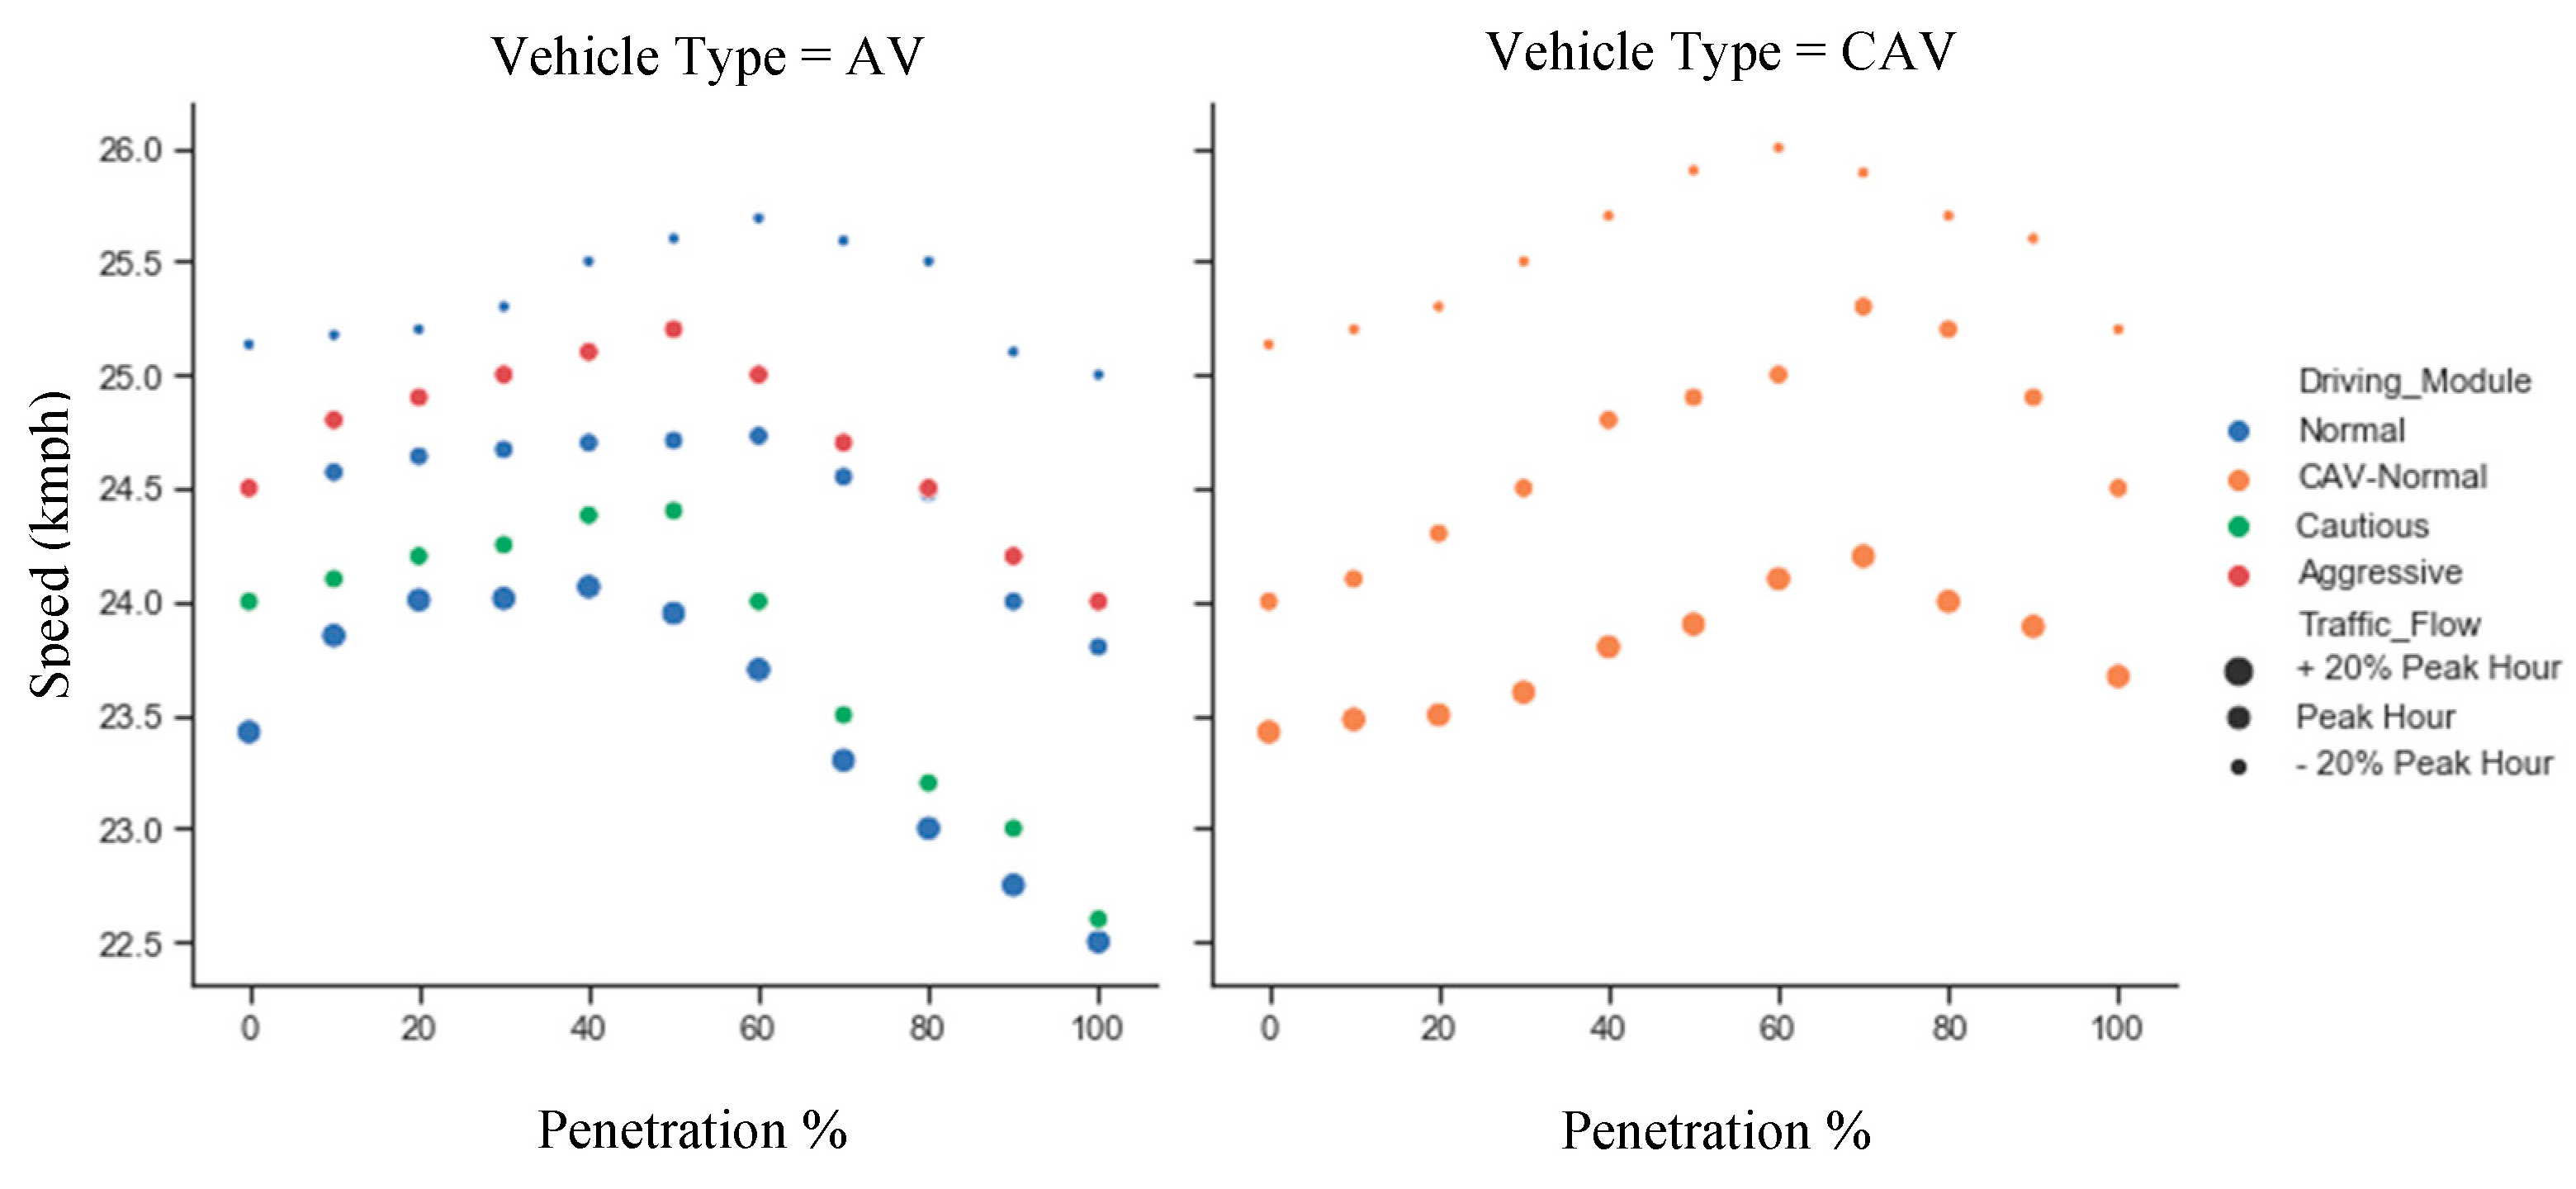
A similar trend can be experienced from
Figure 9 for the speed, as the speed and travel time act together, as experienced in the previous section. The traffic demand cases and driving behaviors depict similar trends but inversely. To exhibit a concave-shaped travel time plot, the speed plot needs to be a convex shaped.
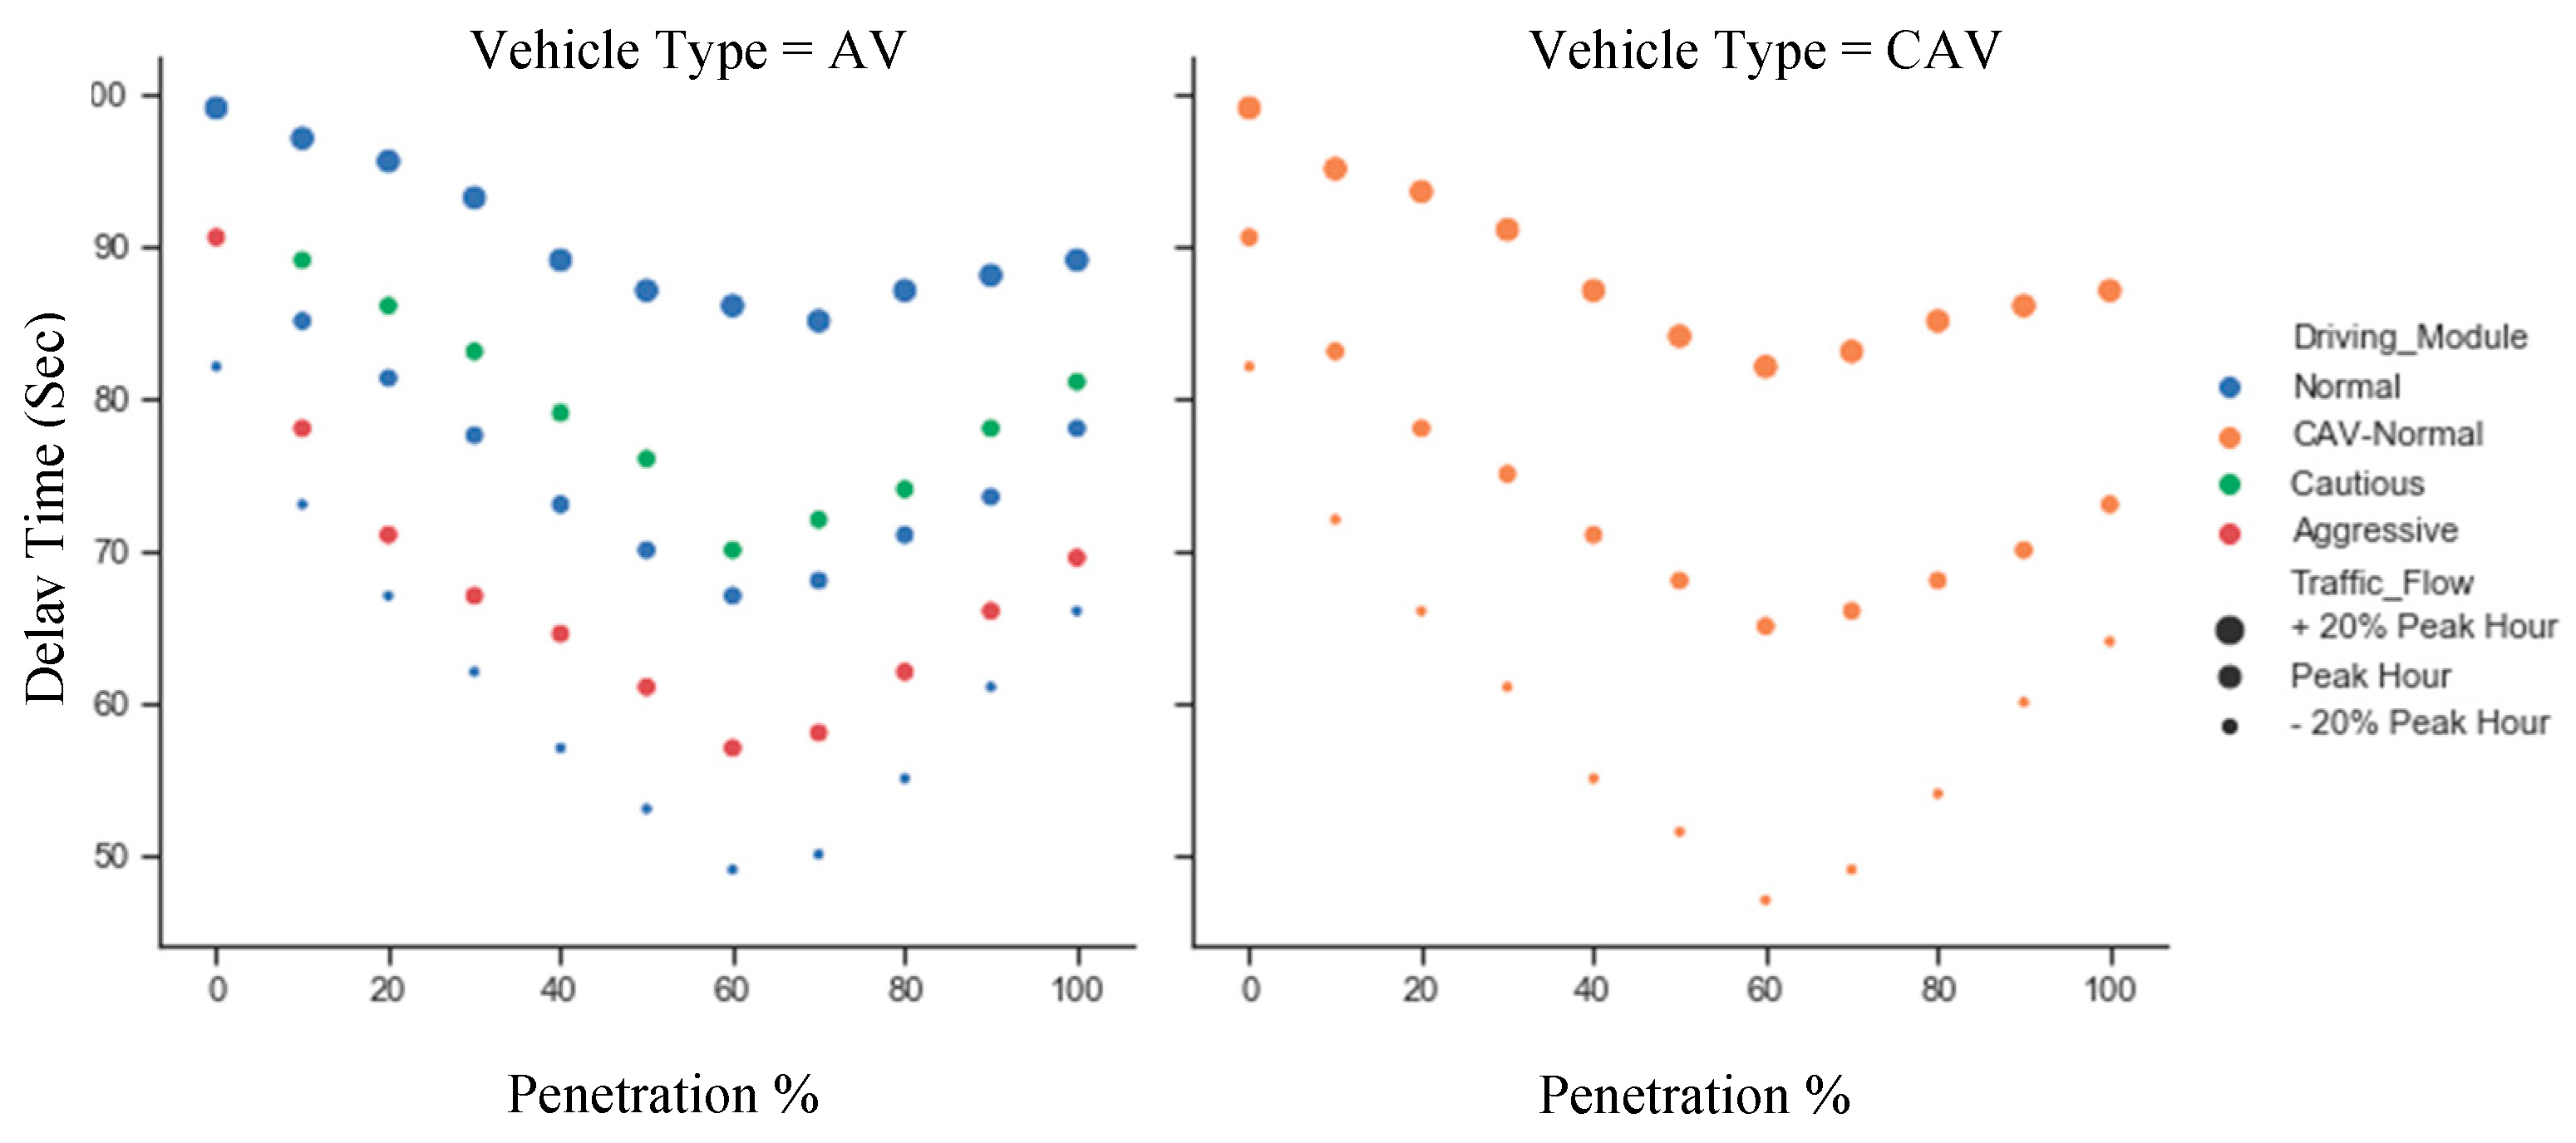
The delay time is also affected similarly, like the previous two traffic performance indicators that can be seen in
Figure 10. The delay time maintains a similar concave shape like the travel time. Automation features such as the early slowing down in the intersection, collision prevention measures, and connectivity of the C/AVs deduce the delay time in general and hold similar trends like its ancestors.
The safety aspect of introducing C/AVs in the network has positive responses.
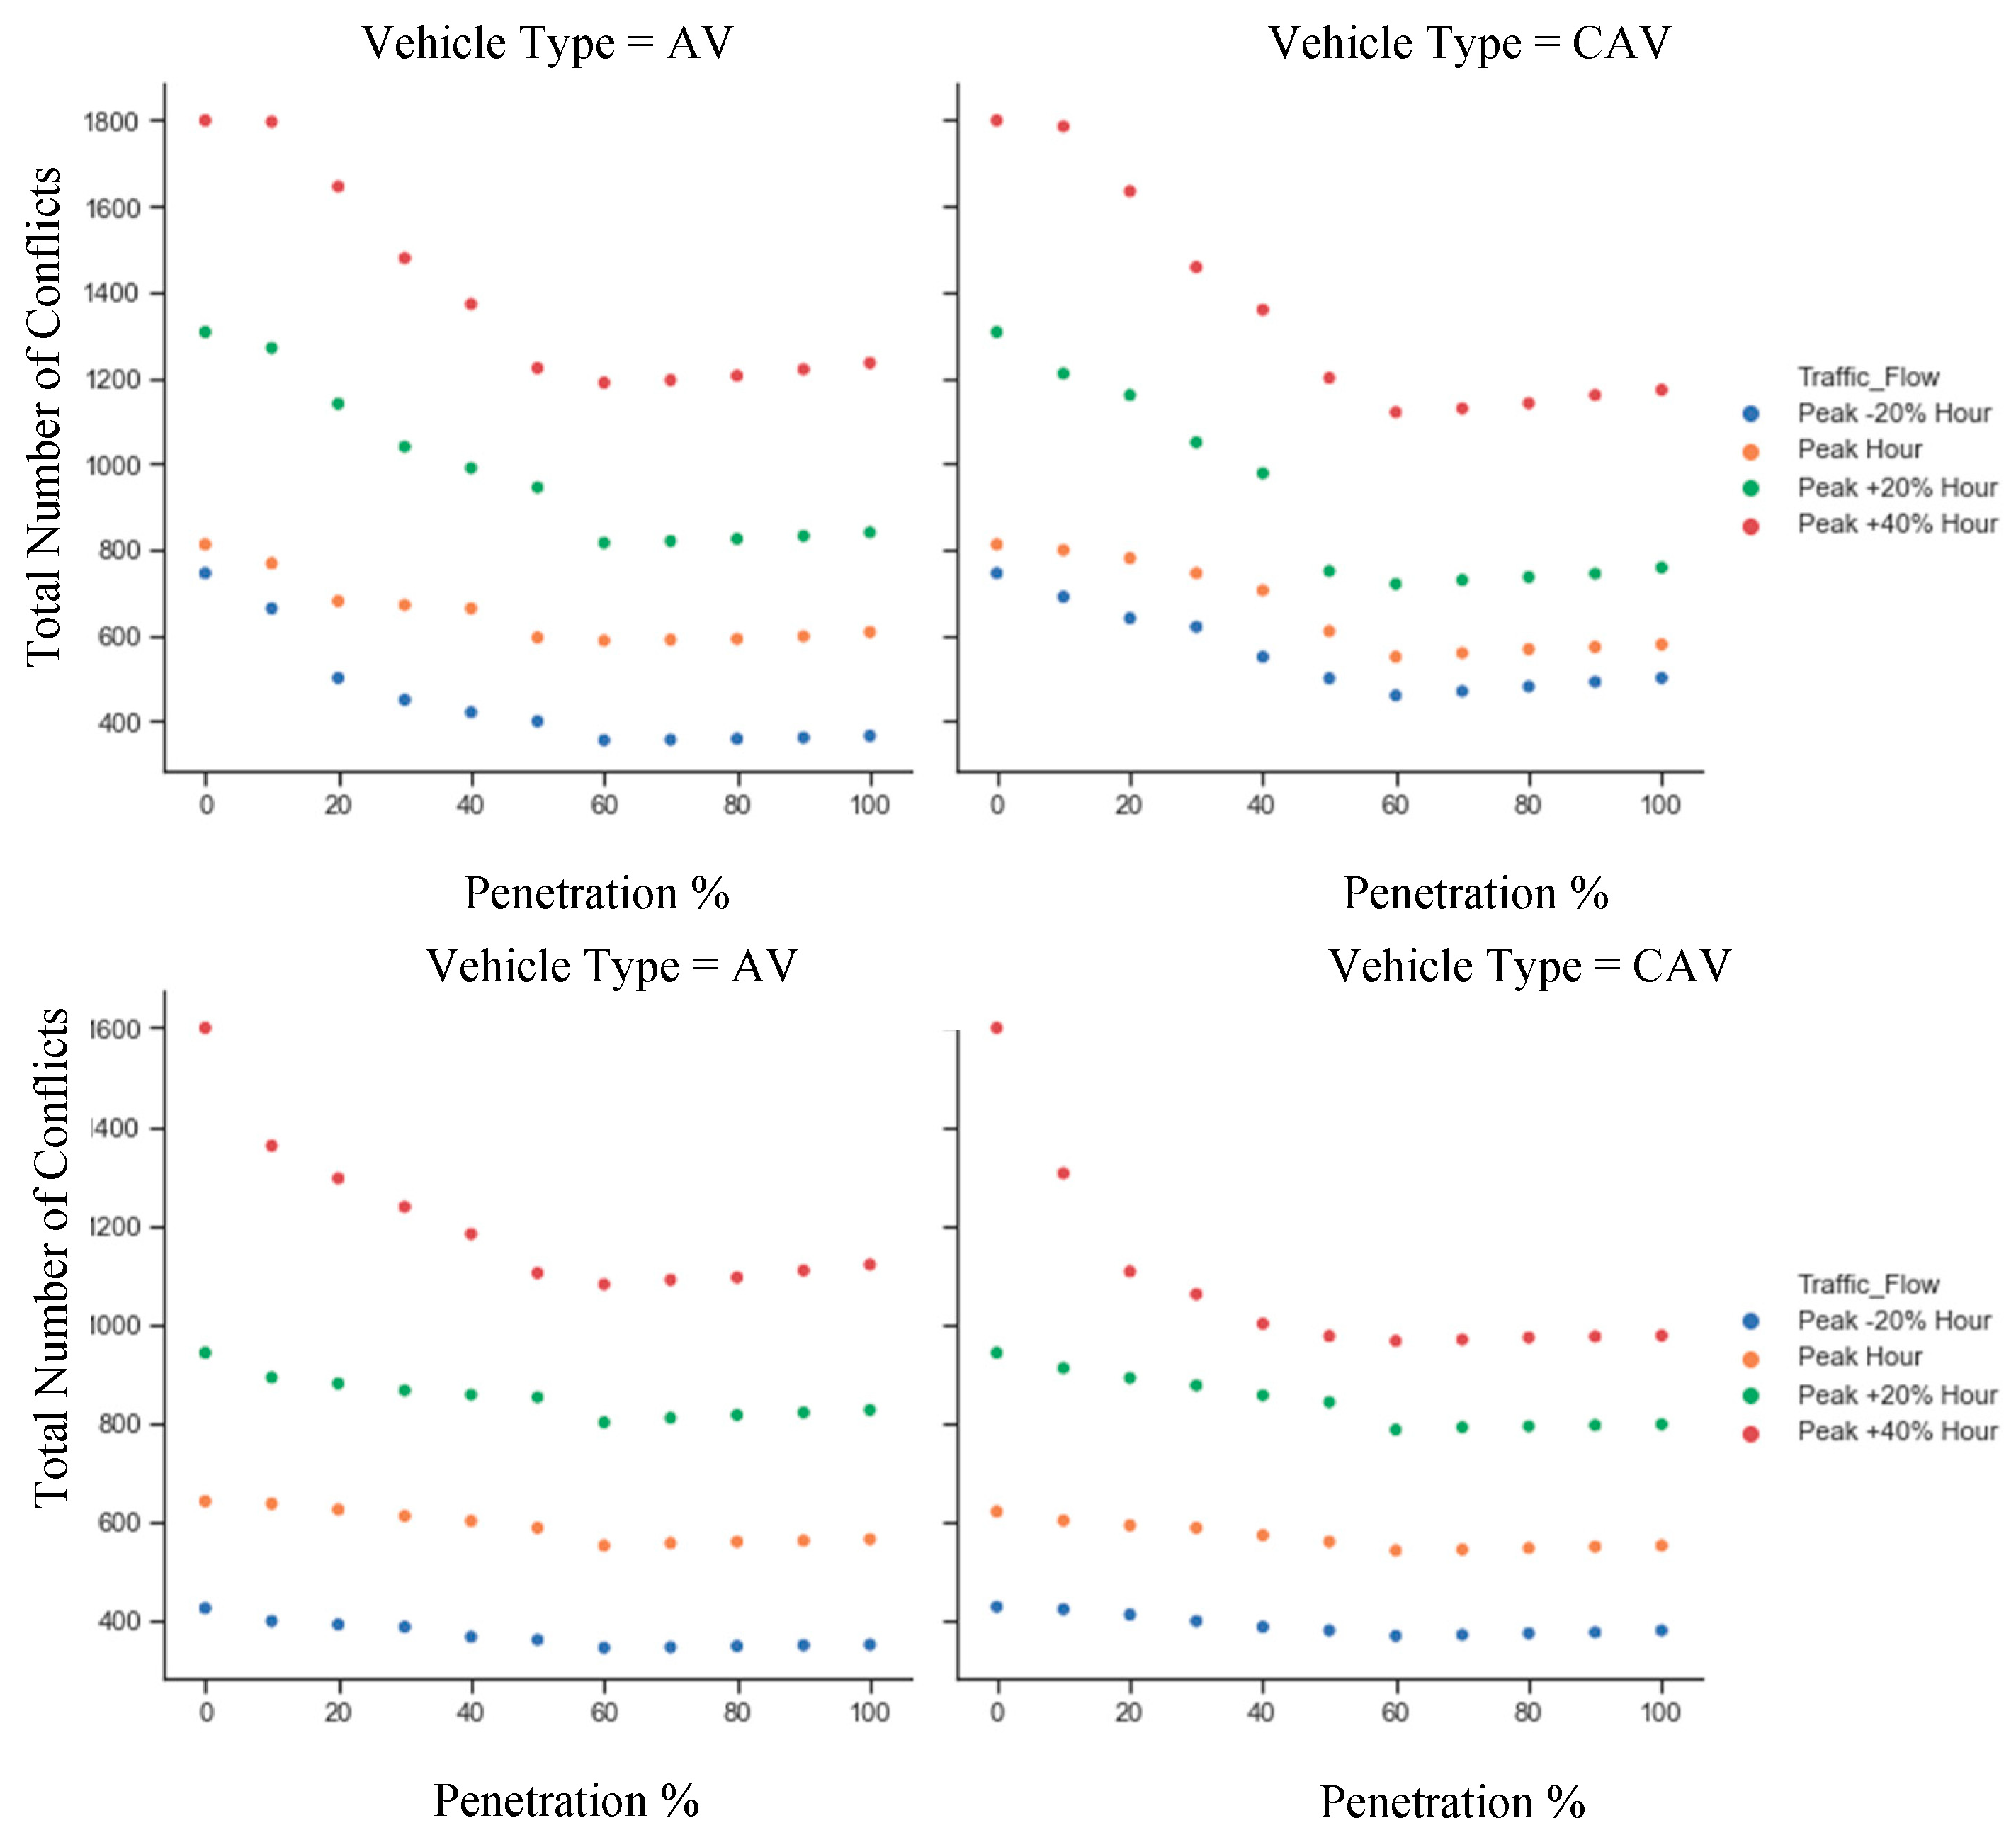
Figure 11 depicts the safety aspects in terms of the total number of conflicts for different traffic demands of C/AVs. The safety can be set for two different values of TTC: TTC = 0.75 sec and 1.5 sec as per the discussion in the previous section. Some observations have been repeated as like the previous performance studies, traffic performance, and emission.
In first place, the smaller the TTC, the higher the number of potential conflicts will be in the network. For a smaller TTC, the system defines more conflicts in the traffic maneuvers. Secondly, the higher the traffic demand, the higher the total number of conflicts will be, because vehicles confronts each other at a higher frequency, which leads to a higher possible of conflicts. Thirdly, the turning points of the performances are still in the range of 50–60%, and the reason for such a recurrence of the trends is same as stated in the previous subsections. Lastly, the CAVs encounter slightly lower numbers of conflicts in the network, as they come with additional connectivity features.
5.3. Sensitivity Analysis
Three hundred and thirty scenarios of different combinations of AVs have been investigated for eight driving parameters of autonomous vehicles, which significantly impacts the performance in road traffic. The sensitivity analysis (SA) is performed in two steps: the preliminary sensitivity analysis and cross-correlational sensitivity analysis. In the preliminary stage, eighty-eight scenarios are scrutinized to find the presiding driving parameters from eight driving behavior parameters. In the cross-correlational sensitivity analysis, two hundred and forty-two scenarios are investigated to create the SA for the dominating parameters found from the preliminary stage. An AV influx value of 60% is on the conservatively stable side of the simulation. A lesser number of AVs will demonstrate a lesser impact on the scenarios originating from the presence of AVs. In contrast, a higher number of AVs might bring about severe changes in real-world driving behaviors, which can be seen in the previous sections. For a higher influx, the scenarios of mixed traffic move towards full automation scenarios, which can be studied better with different considerations [
33]. The entire SA experiment is performed for the peak hour demand to eliminate the effects of the under or over presence of the vehicles in this controlled corridor study.
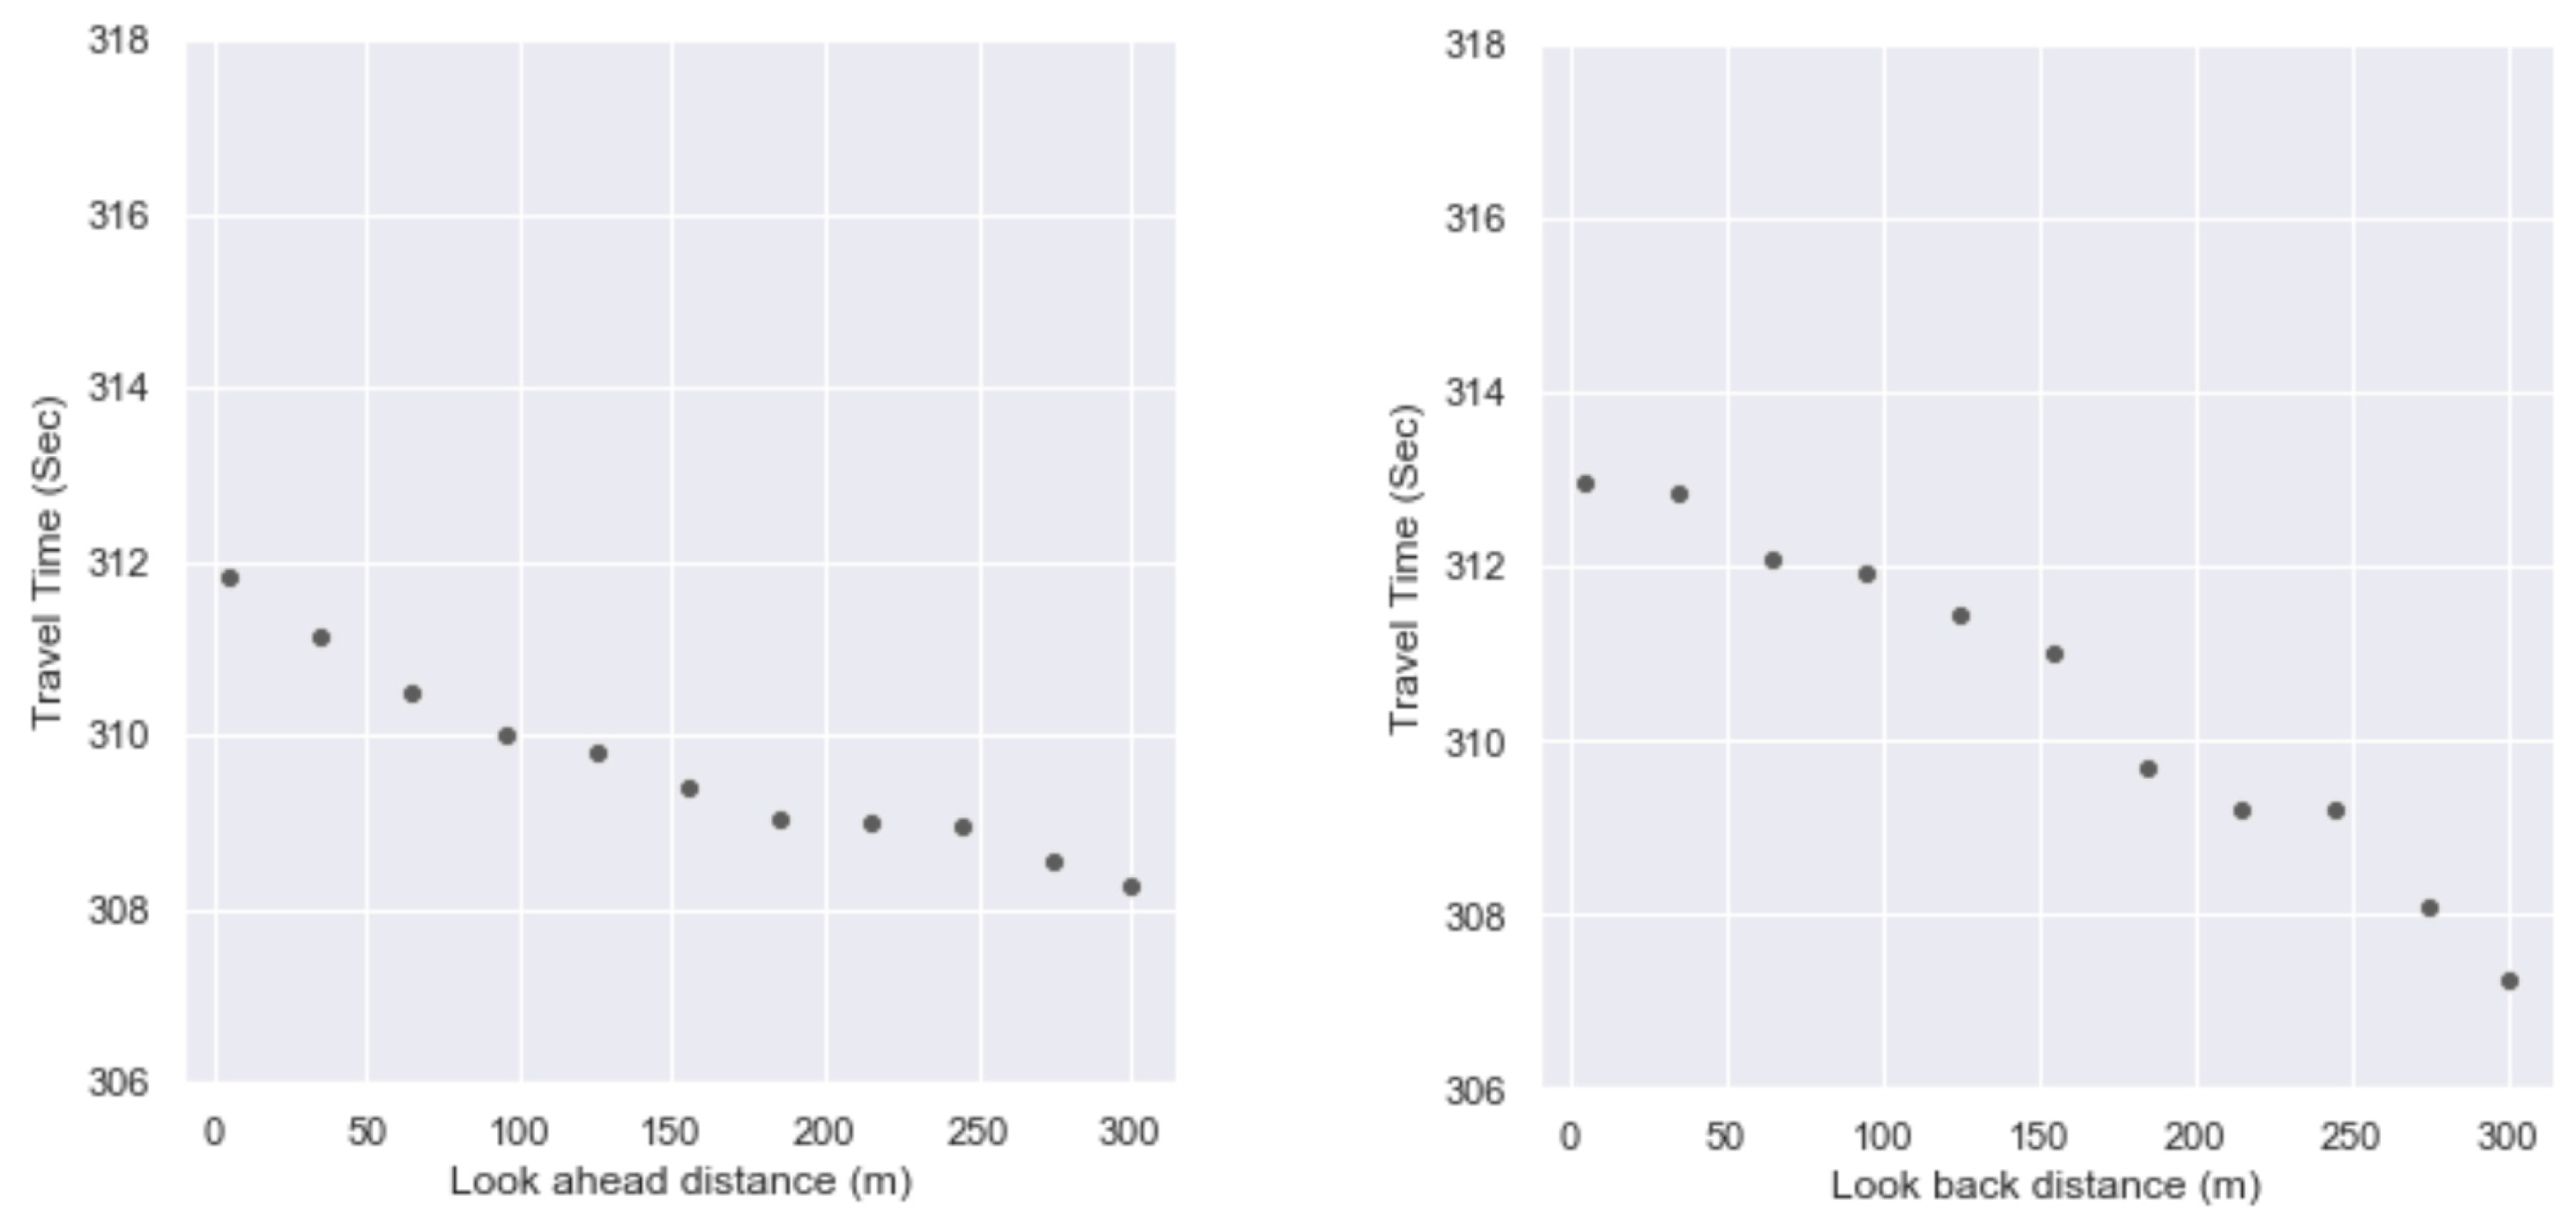
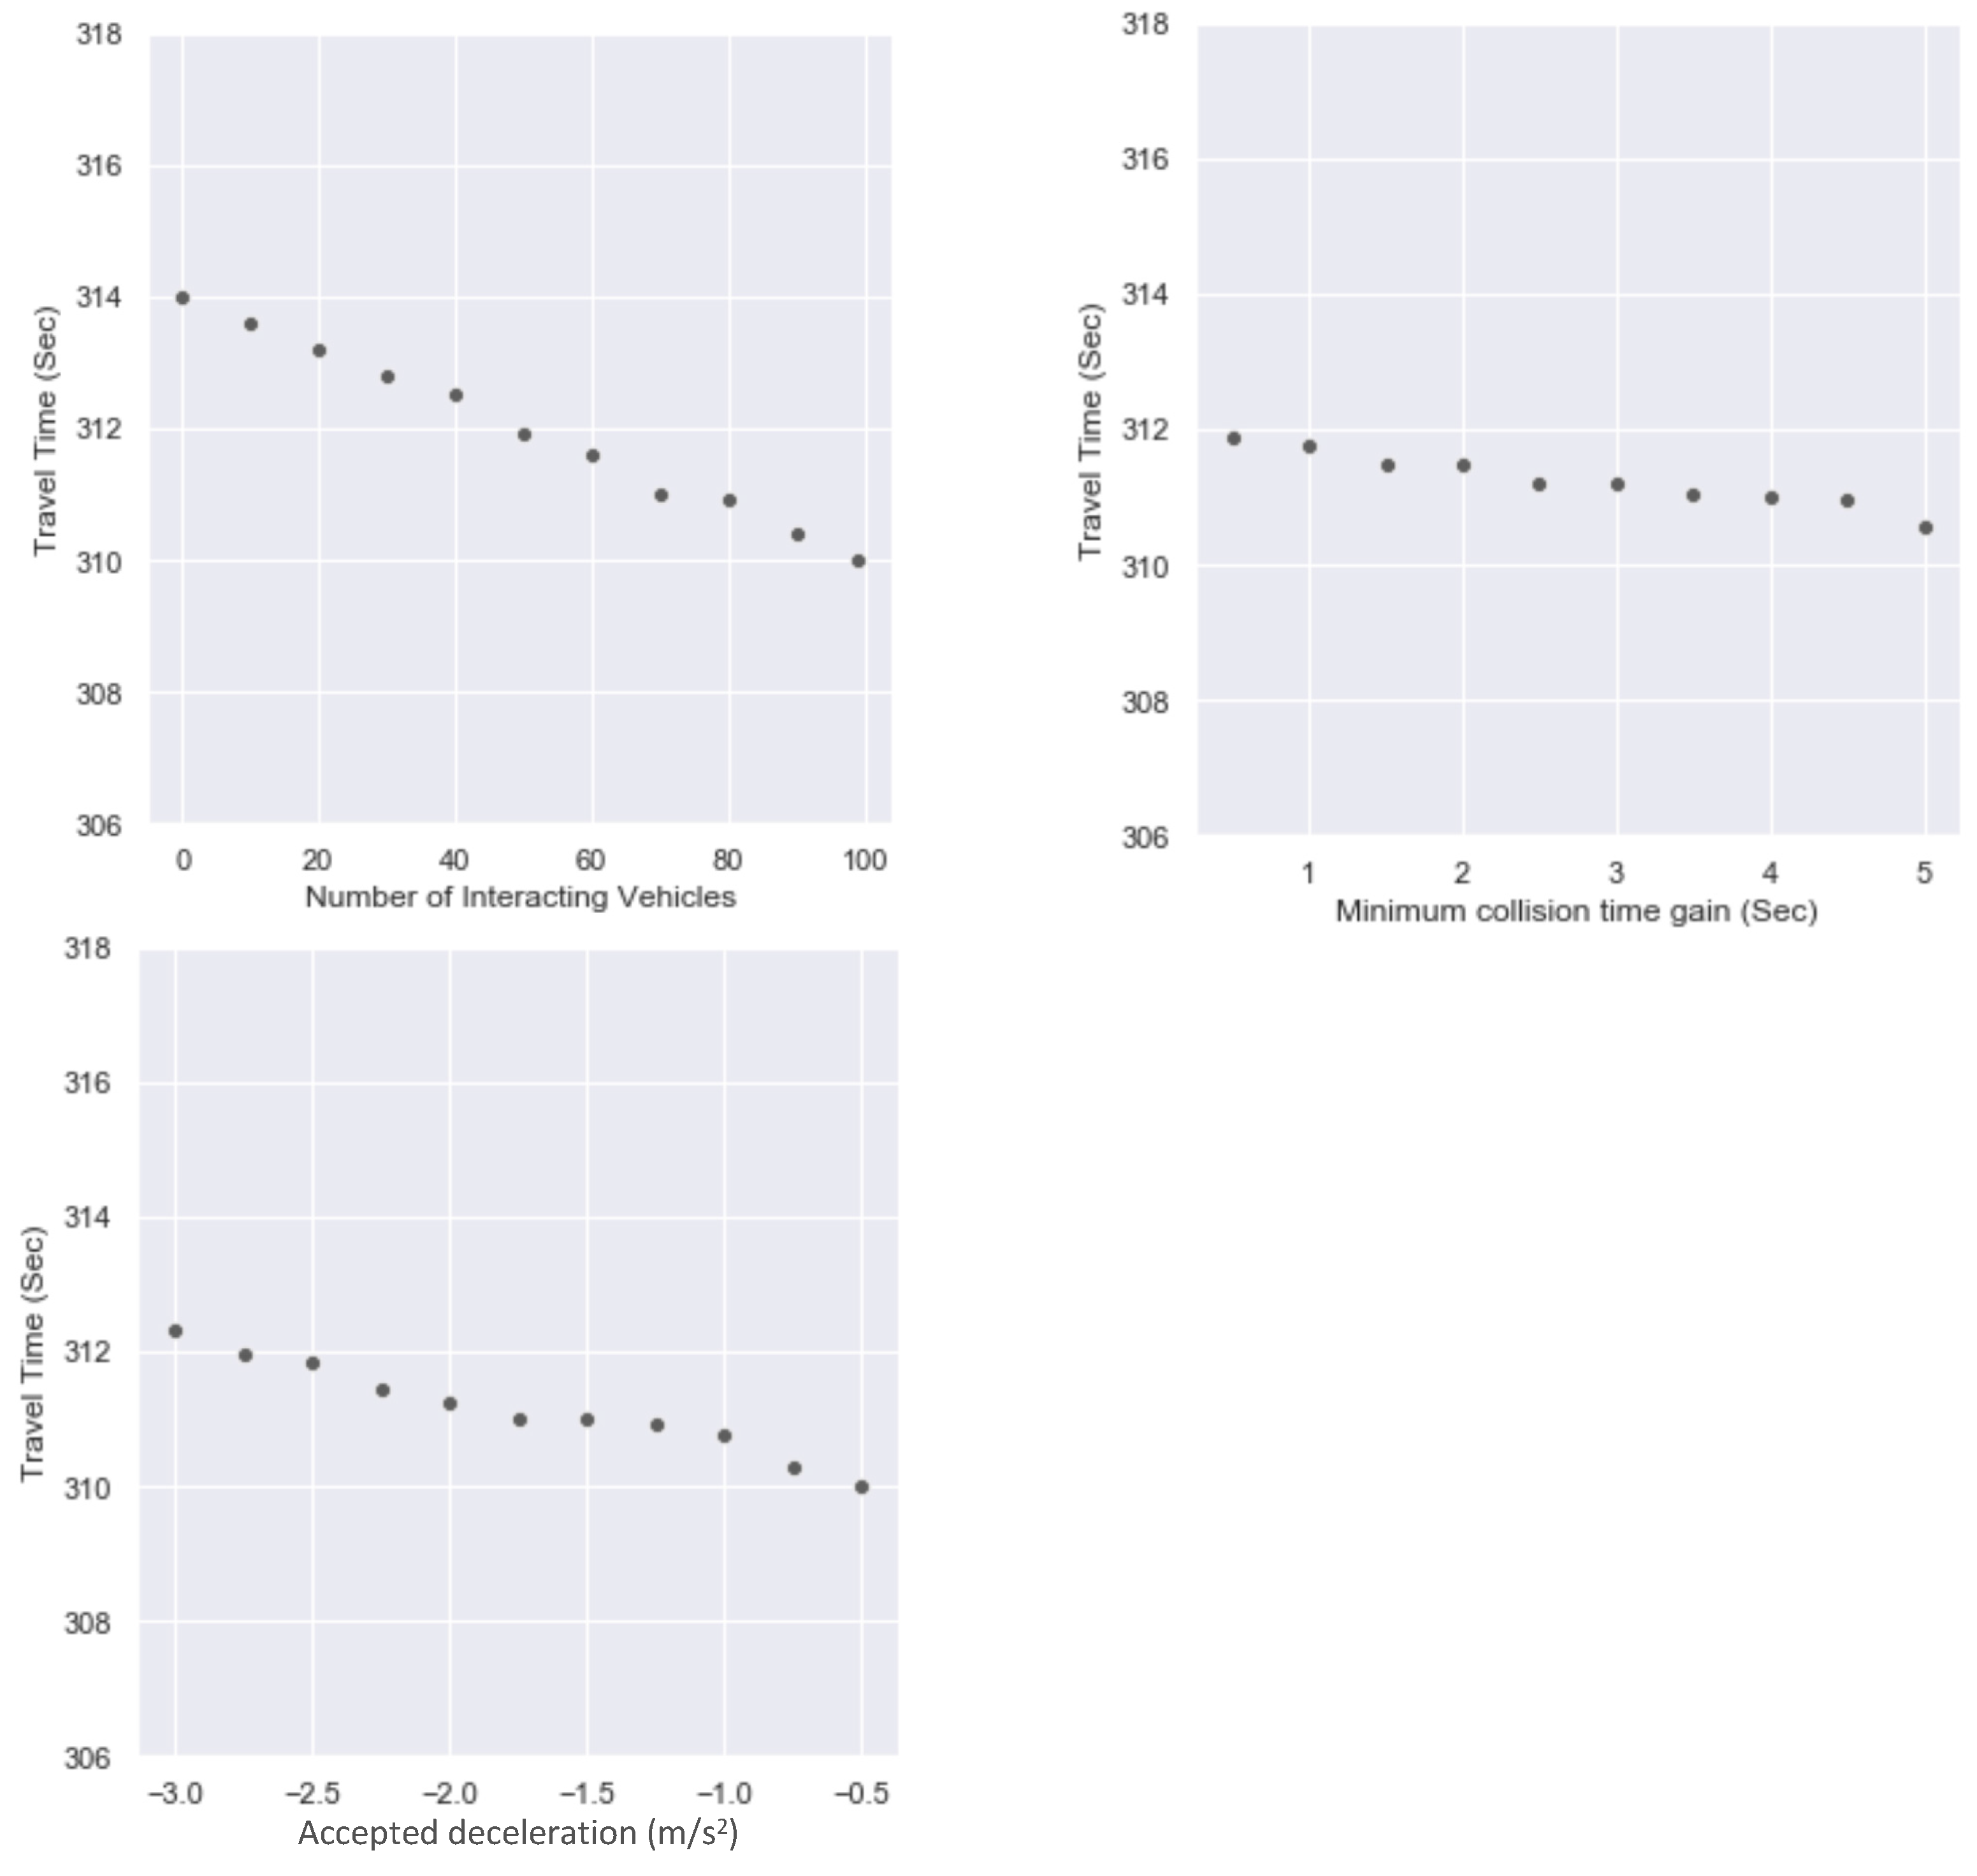
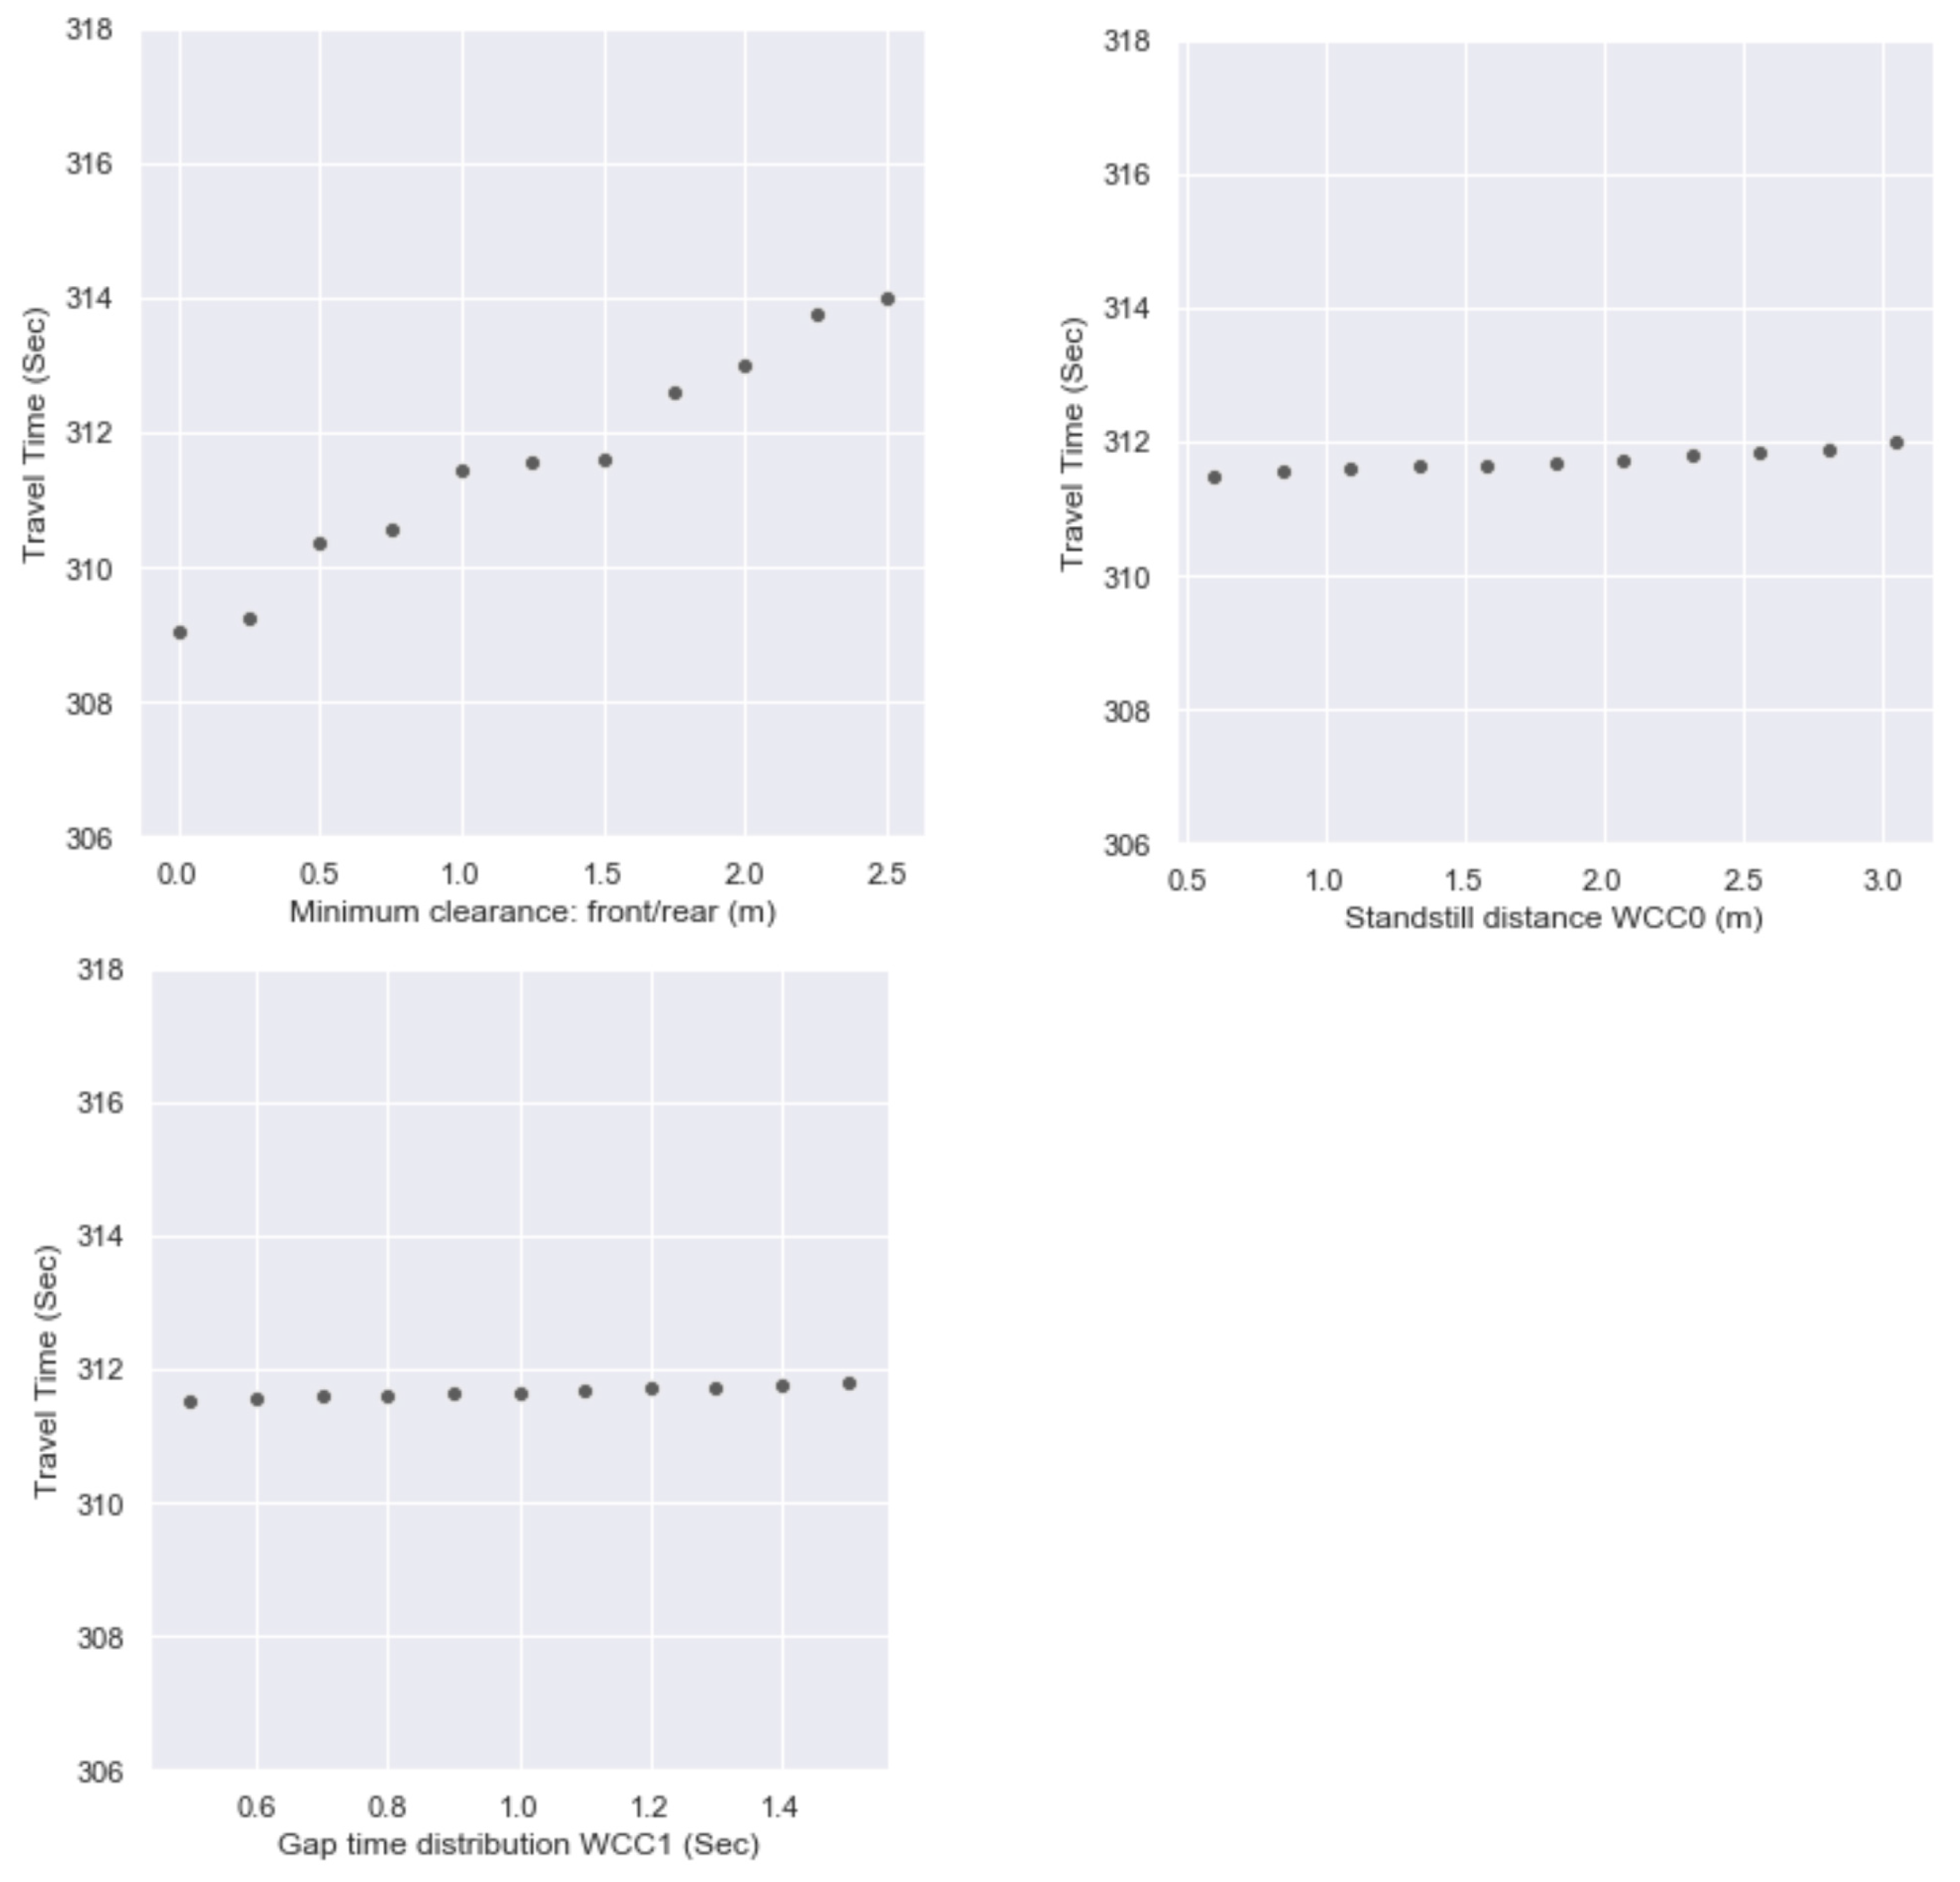
A preliminary SA has been performed for a total of eight driving parameters: the look-ahead distance, look-back distance, number of interacting vehicles, minimum collision time gain, minimum clearance (front/rear), accepted deceleration, standstill distance, and gap time distribution. The travel time is used as a performance indicator, as it has shown quite distinguishable responses for this corridor study in previous sections.
Figure 12 shows that the look-ahead distance, look-back distance, number of interacting vehicles, minimum collision time gain, and accepted deceleration show inversely proportional responses towards the performance indicator in each range.
Figure 13 shows a minimum clearance: the front/rear, standstill distance, and gap time distribution show proportional responses towards the performance indicator in each range.
The first value and the last value from each graph (in total 8) from
Figure 12 and
Figure 13 show how much variation has taken place in the travel time.
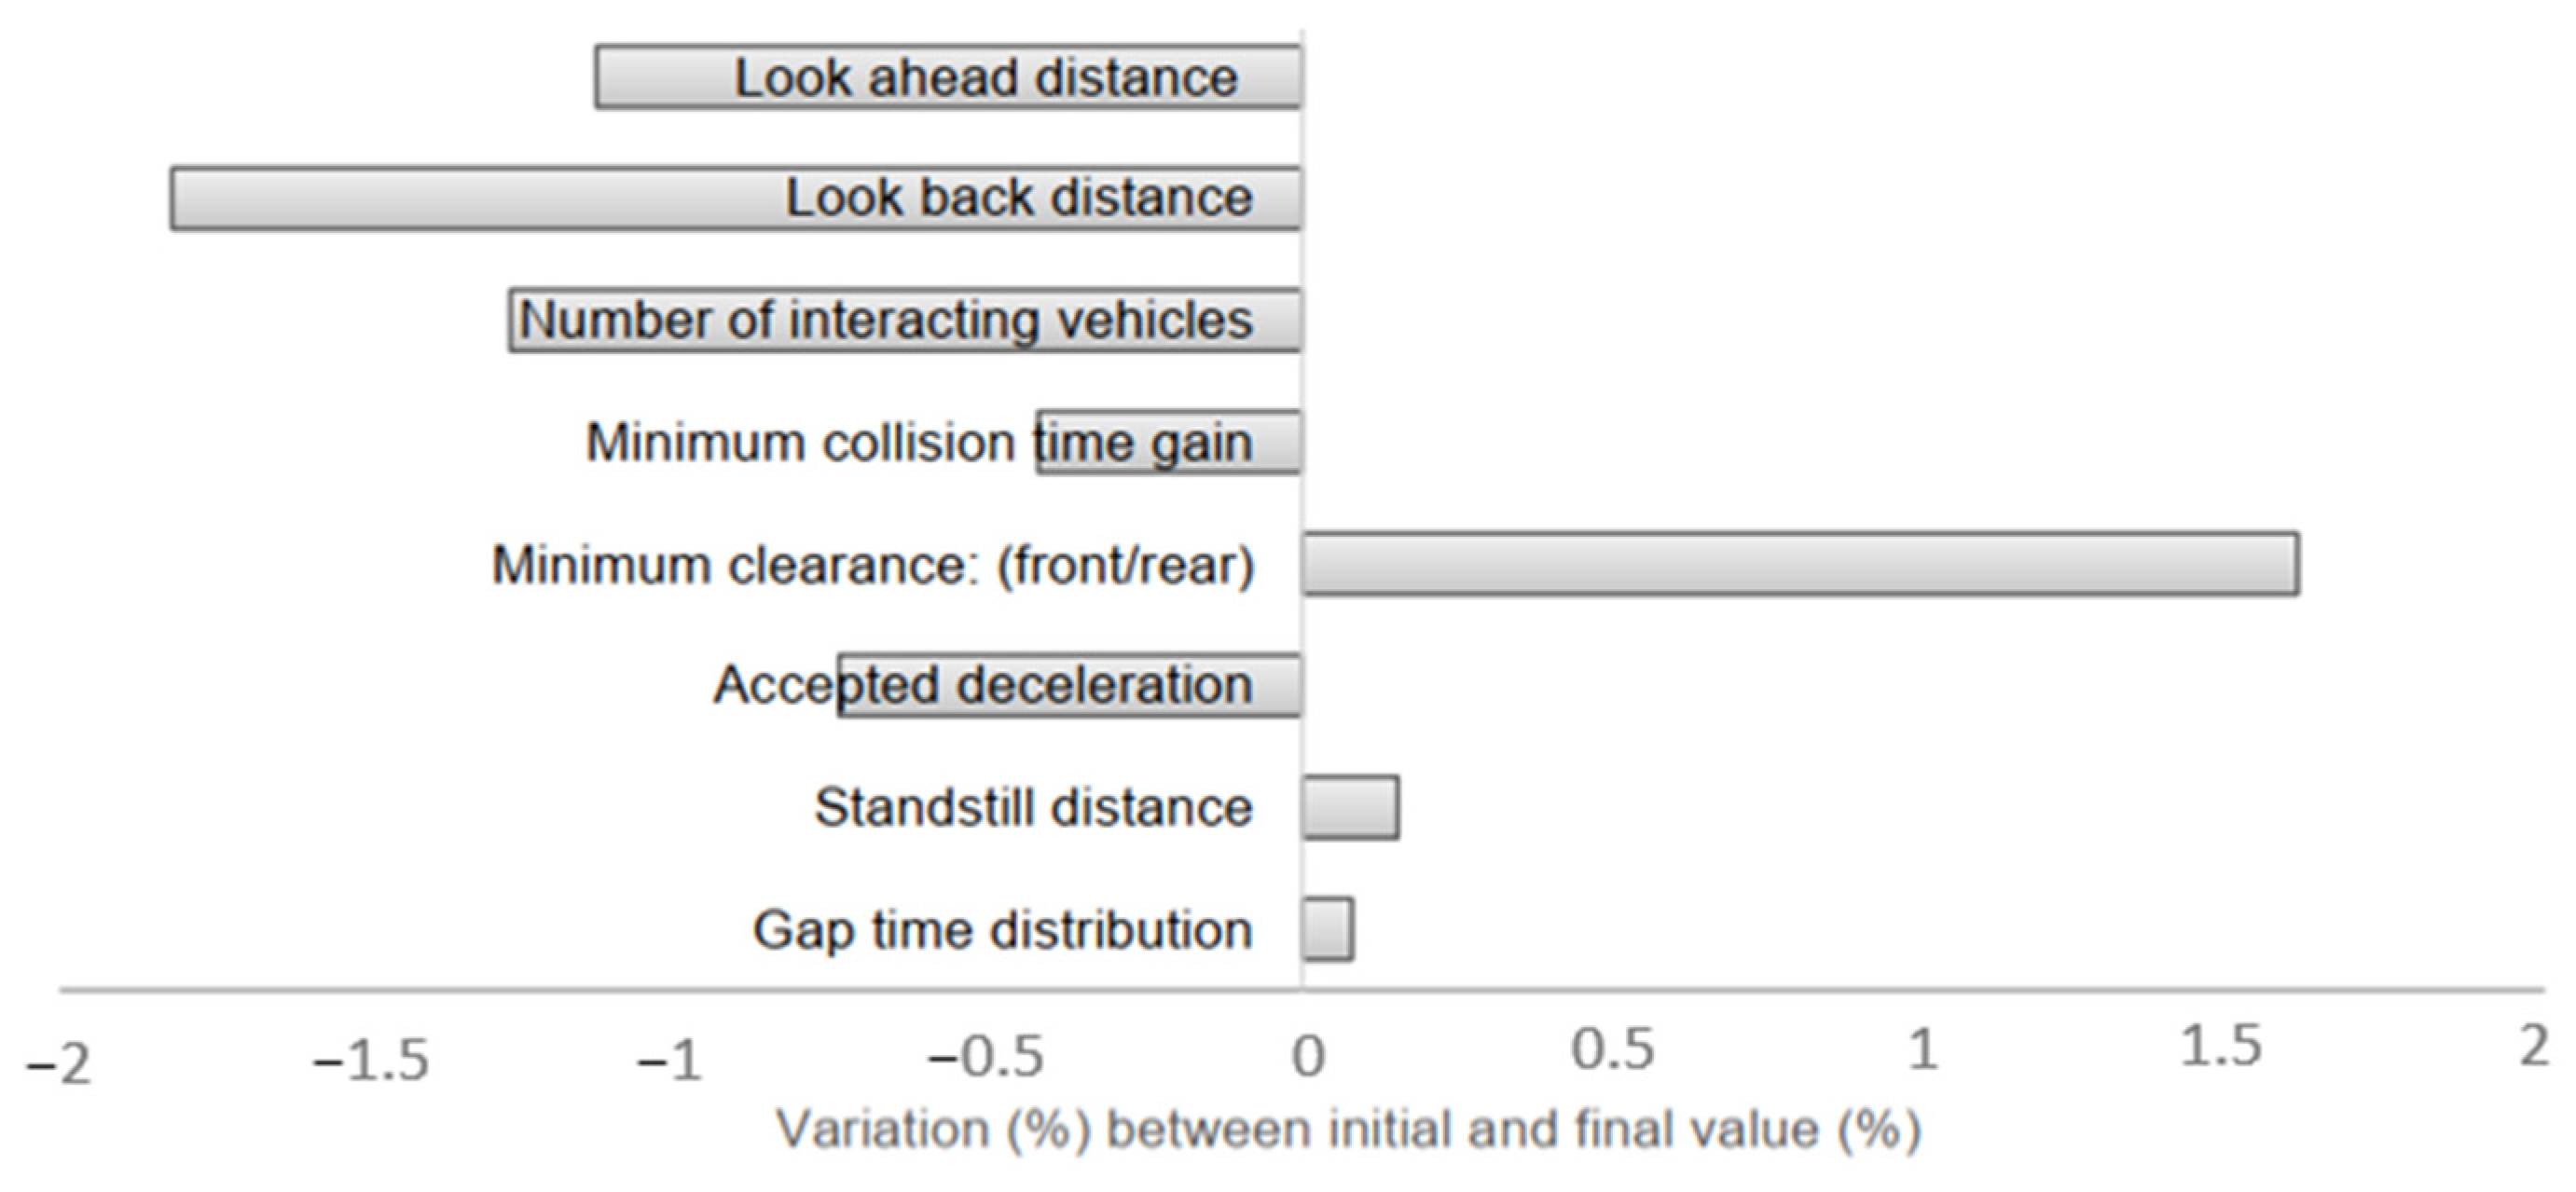
Figure 14 shows the percentage of variation between the initial and final values of individual driving parameters. The look-back distance, number of interacting vehicles, and minimum clearance (front/rear) show domination over any other parameters, in regard to their impact on the travel time. At this point, further sensitivity analyses can be carried out for the three most influential driving parameters: the number of interacting vehicles, minimum clearance (front/rear), and look-back distance.
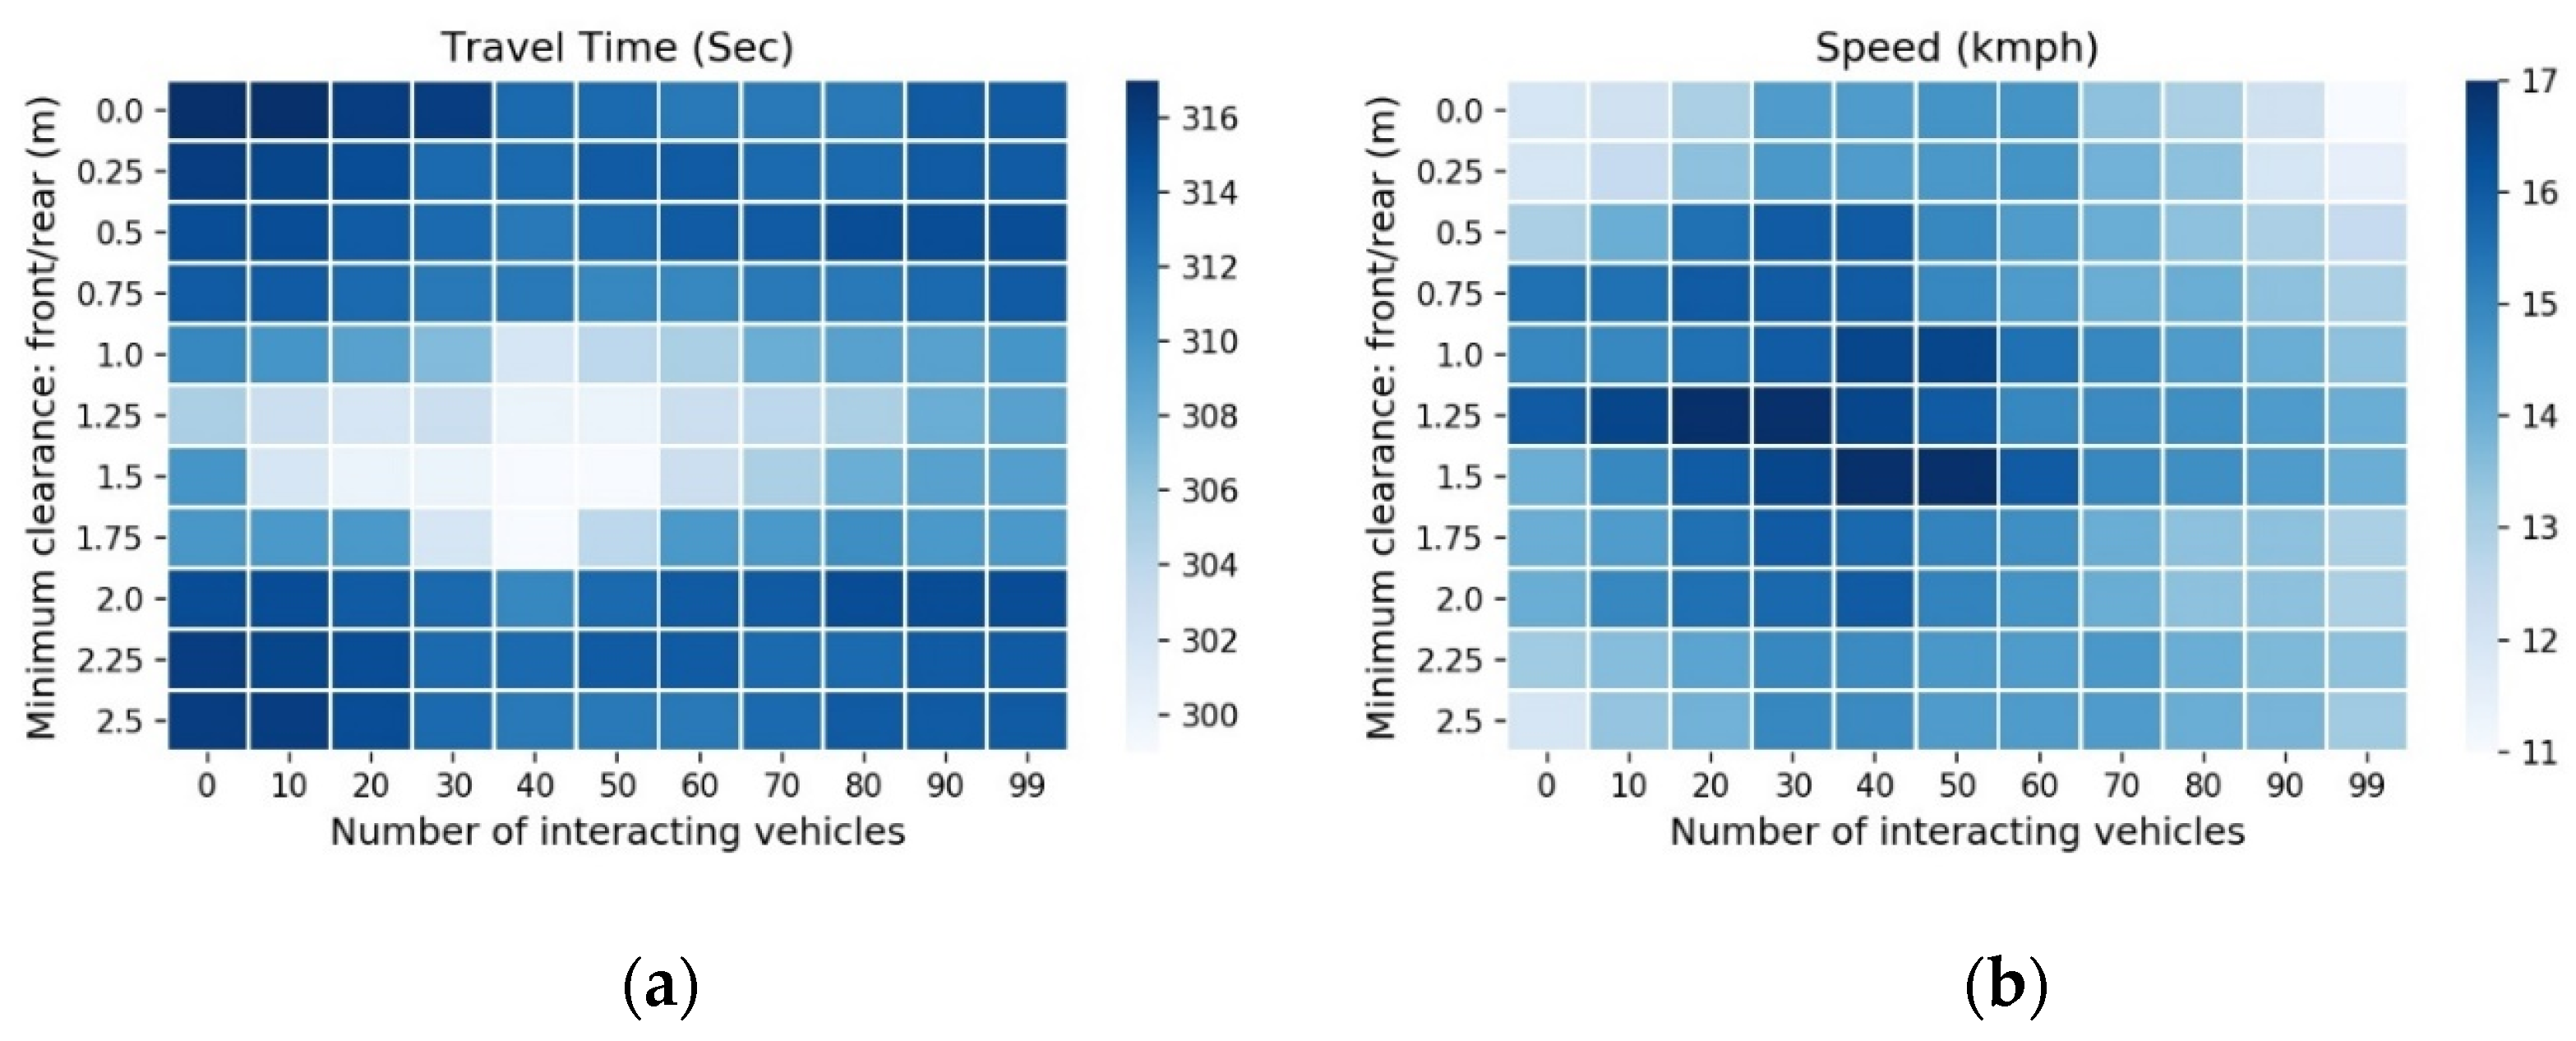
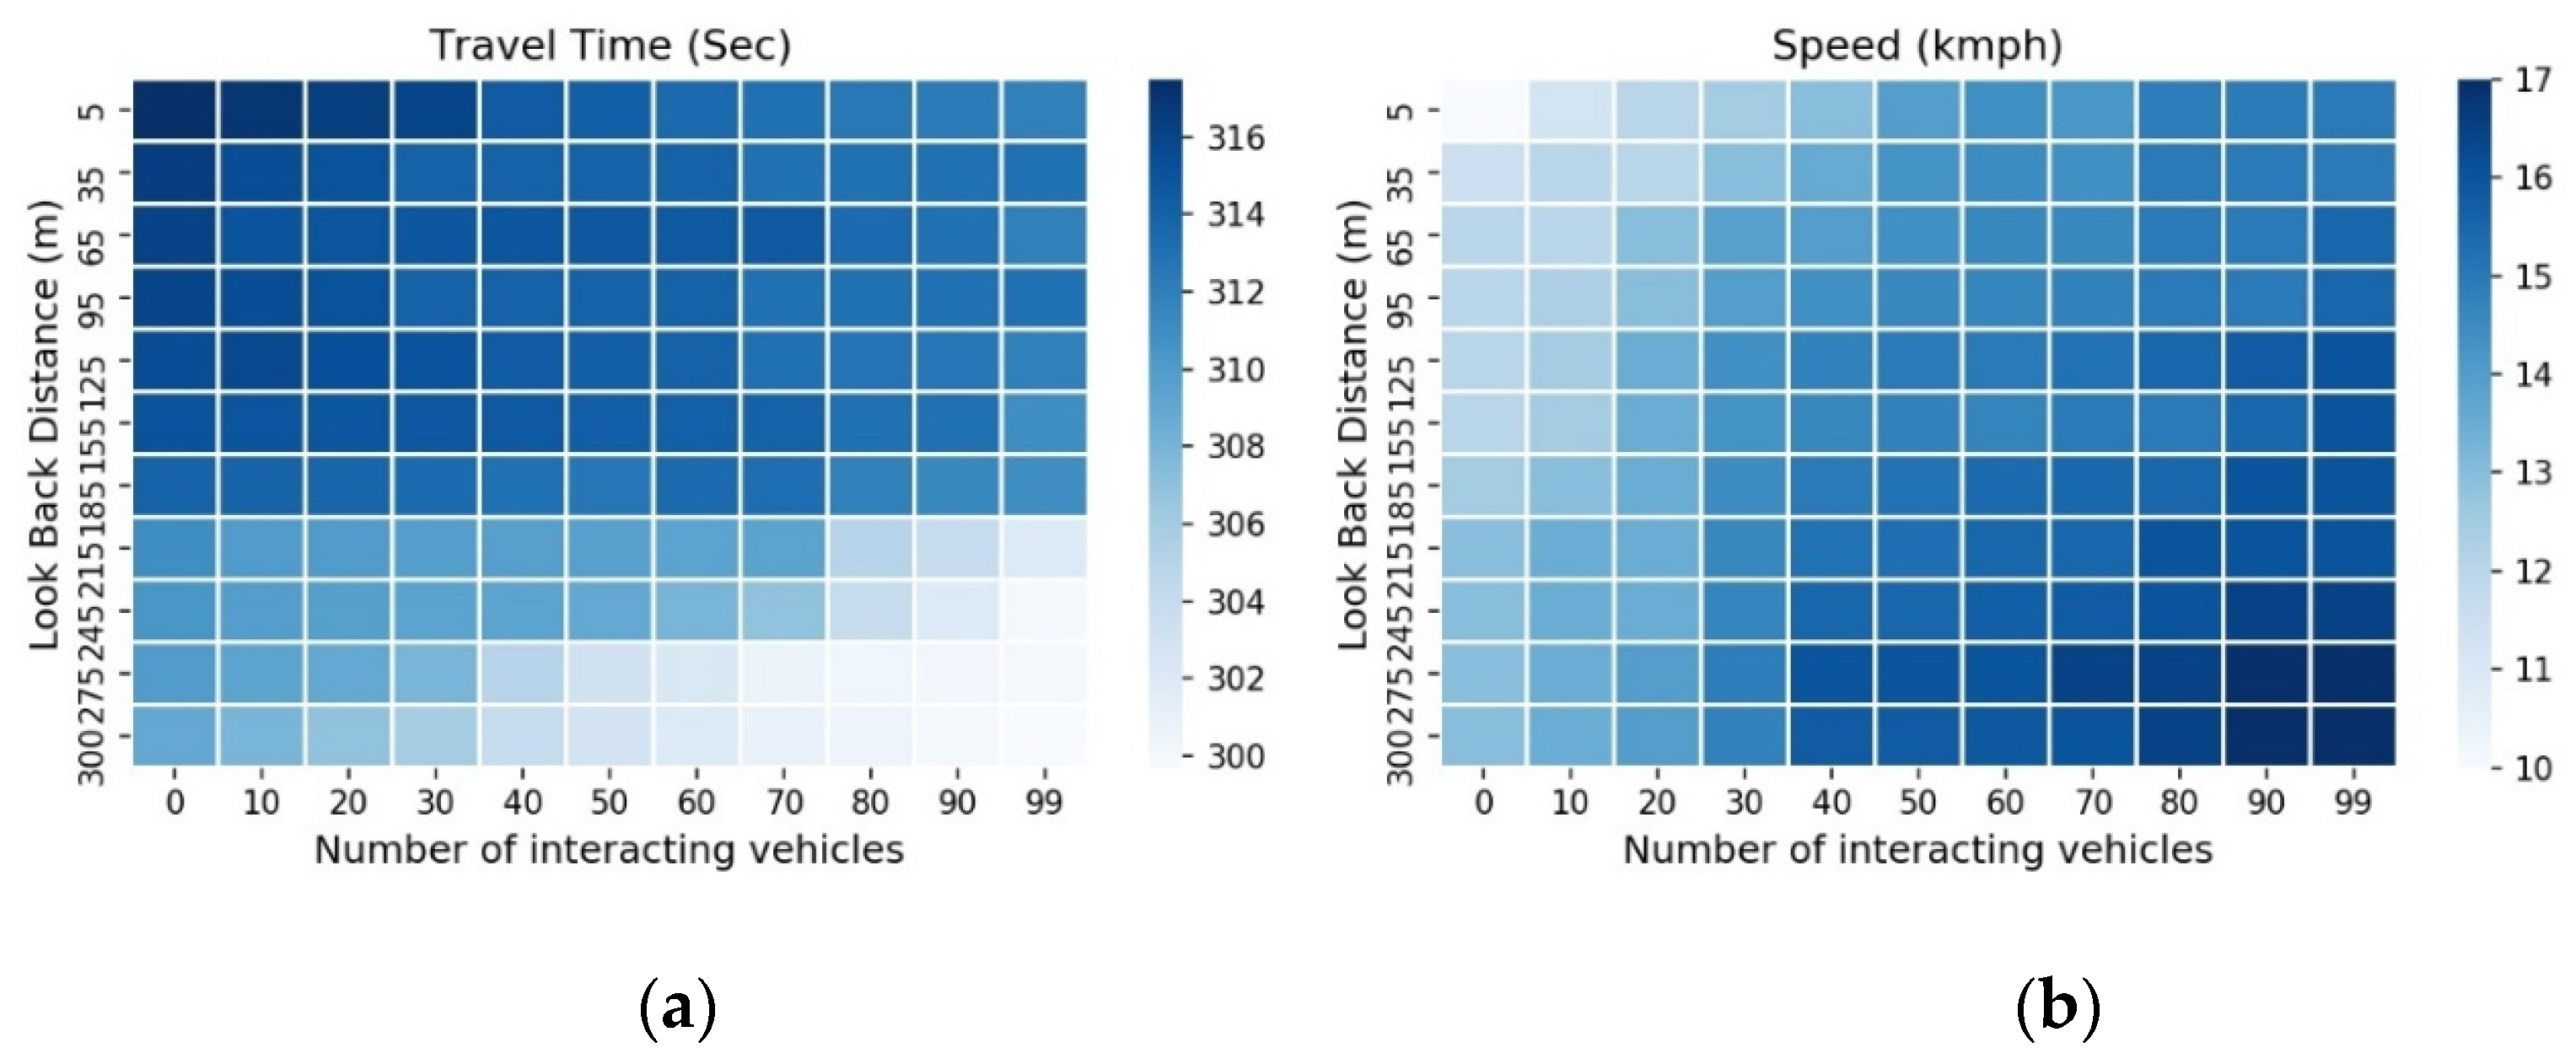
The final stage of the sensitivity analysis has been planned for two sets of driving parameters: 1. The minimum clearance (front/rear) and number of interacting vehicles and 2. the look-back distance and number of interacting vehicles. These two sets will create an experimental arrangement of two cross-correlational sensitivity analyses, where the number of interacting vehicles is presented in both setups. Two traffic performance indicators, travel time and speed, have been used to strengthen the outcomes of the SA.
The results of the final SA are presented in
Figure 15 and
Figure 16 using a heat map. The heat map is a good demonstration for the impact study that was generated from the combination of the driving parameters. The heat map in
Figure 15 depicts how two driving parameters, one with proportional and another with inverse proportional behaviors, respond jointly in the scenarios. The lowest region of travel time, the optimum, is found in the range between 1.0 and 1.75 m of minimum clearance: the front/rear and 30–50 of number of interacting vehicles. Similarly, the performance indicator speed becomes distinguishably high in the same range of driving parameters. This strengthens the impression of the travel time heat map. On the contrary, the heat map in
Figure 16 depicts how two inversely proportional driving parameters correspond to one another in the scenarios. In this category of a cross-correlational SA, the travel time significantly decreases and the speed increases for a higher number of interacting vehicles and greater look-back distance.
5.4. Discussion
It is evident that CAVs behave better than AVs in every circumstance after an attempt to imitate humanlike behaviors in connected and/or autonomous vehicles (C/AVs). Two distinct observations were shown. A greater traffic performance occurs when there is a 50–70% influx of these new vehicle types: AVs or CAVs with human-driven vehicles. On the contrary, a greater traffic performance occurs when there is a higher influx of these new vehicle types in the mixed traffic of HVs–AVs–CAVs. These situations can be explained in two ways. When automation by means of AVs or CAVs takes place in traffic, it has an advantage over human-driven vehicle. So, if there is a proportion of HVs–AVs–CAVs of 40–20–40%, there is 60% automation present on the road. According to another plan, if only CAVs or AVs are replaced by HVs, then automation appears differently. In this state, the number of interacting vehicles becomes important. For this study it was five, which means that five vehicles can interact with each other. More automation cannot help after the yield point of 50–70%. These locally linked vehicles benefit from a narrower radial range. With an increasing number of interacting vehicles, the traffic performance will get better with a higher influx of automation in the traffic. This illustrates the need for technical advancements in the real world. A traffic performance-based analysis, like this one, demonstrates the advantages of adding CAVs to the traffic in greater numbers, in contrast to a traffic flow and road capacity-based study [
6].
6. Conclusions
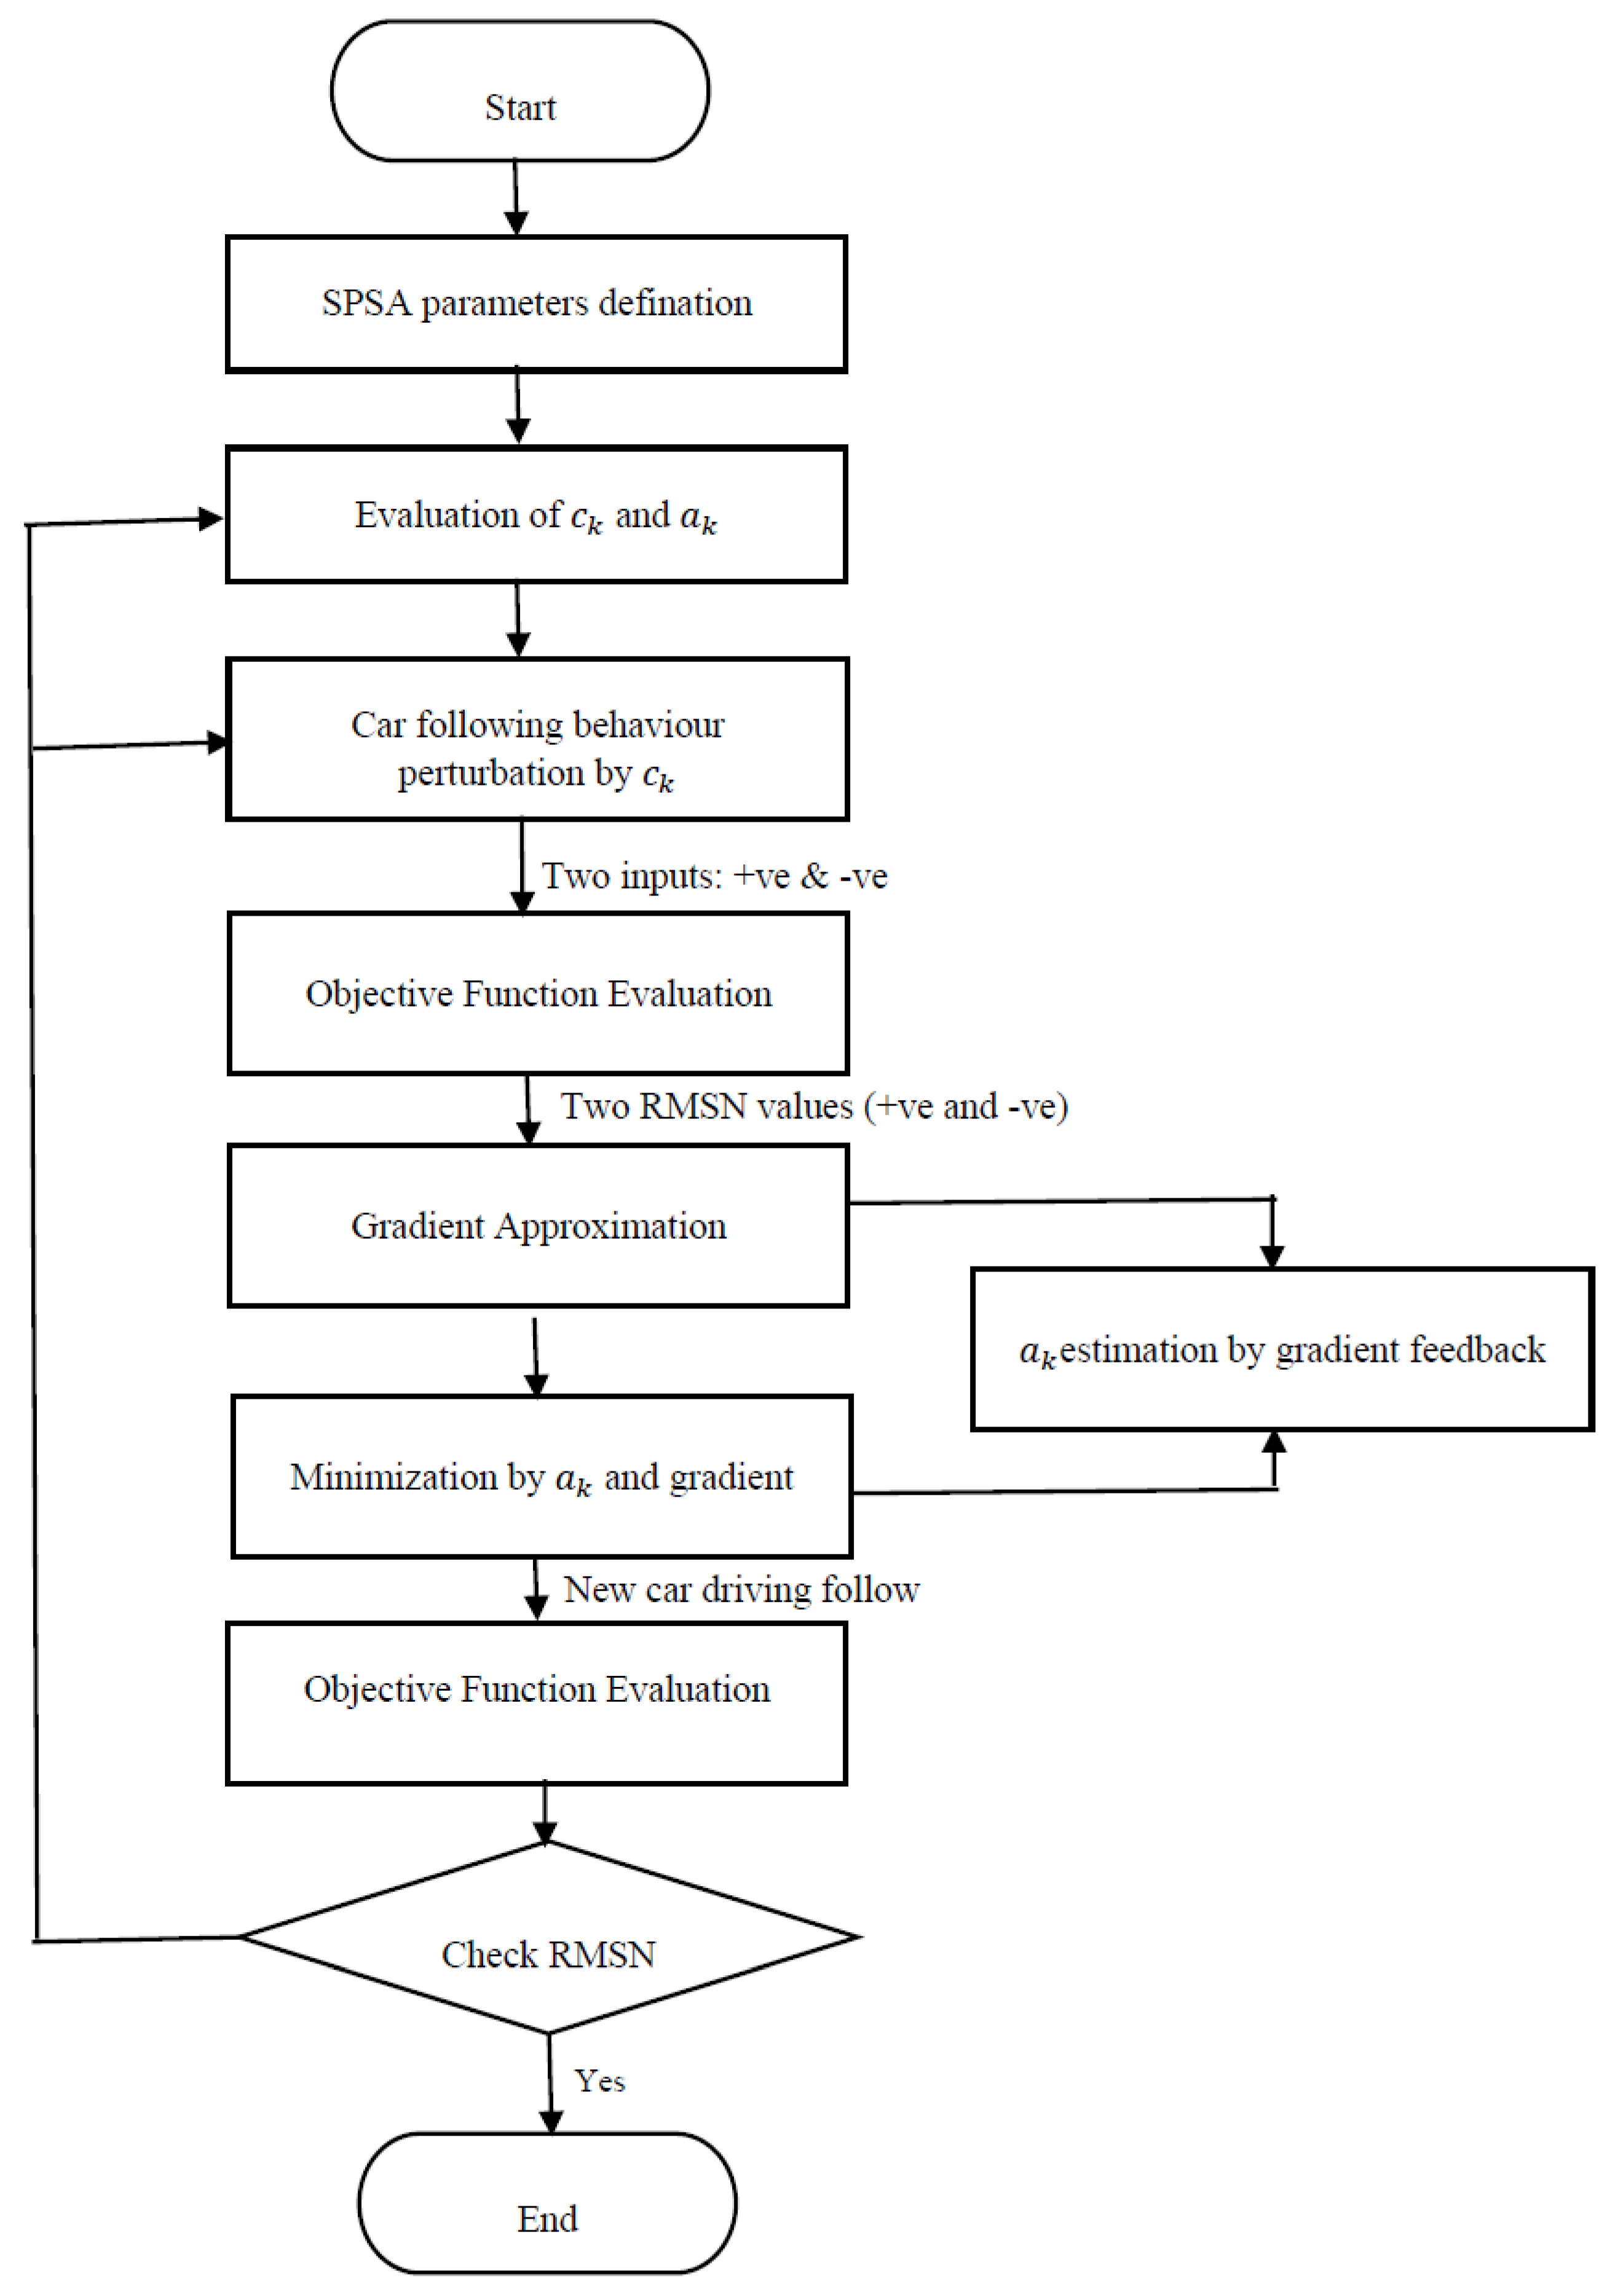
The lack of real or natural data can be compensated by the similarity in the driving behaviors of HVs and CAVs. If CAVs are assumed to behave like human-driven vehicles and this is evaluated against natural data, this could be a benchmark for microscopic transportation simulation. Interestingly, it can be good data input for calibration and validation until we get natural data from CAVs in real traffic scenarios. This will reduce the dependency on test bed data for the assessment of CAVs in mixed traffic to get a more realistic representation of urban areas. Out of many alternative calibration algorithms [
34] being used in practice, the SPSA has proven to be efficient for this study, considering the simulation time and the goodness of fit. The integration of autonomous vehicles with human-driven vehicles in the same lanes is an environmentally friendly and sustainable solution. The mixed traffic solution is viable with a proper implementation strategy. When modern technology is integrated into the existing infrastructure, the best outcomes can be reached with a relatively low investment and environmental impact. Along with this consideration in the calibration and validation, this study also defined three driving behaviors and humanlike car-following methods. The Wiedemann 99 is modified as the car-following method for the model development.
From the analysis, it is clear that the introduction of CAVs in a higher number into mixed traffic could be beneficial if they have an interaction with many other CAVs. The pattern starts changing from 50 to 70% of influx. Below a 50% inflow, the system works inefficiently because of a lack of available connecting vehicles. After 70%, the system would work better if interacting vehicles were higher in number.
After analyzing eight parameters from driving behaviors using a sensitivity analysis, it becomes obvious that some of them play an influential role in the traffic performance. The minimum clearance, look-back distance, and number of interacting vehicles play dominating roles over the look-ahead distance, minimum collision time gain, accepted deceleration, standstill distance, and gap time distribution.
Only platoon building and traffic signal slowing are implemented from V2V and V2I features in this study. There are numerous other CAV advancements that can be studied, including a vehicle-to-pedestrian (V2P) model, controlled mobility pattern, and early congestion warning [
5]. Research into C/AVs that resemble human behaviors can be achieved using other car-following models besides Wiedermann’s psycho-physical model. Implementing the Gipps car-following model, which offers a safety distance concept, would be one interesting approach. The lane changing and lane merging behaviors can be a focus for upcoming research, while keeping car-following model fixed. This study also shows that a few car-following behaviors have a higher degree of influence on the performance. These can be used to study CAVs and AVs in future research.


