Article

Introducing a Novel Framework for the Analysis and Assessment of Transport Projects in City Regions

1
Chair of Urban Structure and Transport Planning, School of Engineering and Design, Technical University of Munich (TUM), D-80333 Munich, Germany
2
Chair of Urban Development, School of Engineering and Design, Technical University of Munich (TUM), D-80333 Munich, Germany
*
Author to whom correspondence should be addressed.
Sustainability 2024, 16(6), 2349; https://doi.org/10.3390/su16062349
Submission received: 29 January 2024 / Revised: 7 March 2024 / Accepted: 8 March 2024 / Published: 12 March 2024

Abstract

:
A profound appraisal framework has been developed and refined in transport economics and planning literature for decades, mainly characterised by welfare economic theory, cost–benefit analysis, and transport demand modelling. In summary, the appraisal methodology and its applications have concentrated on single infrastructure measures, marginal impacts identified through ceteris paribus comparisons, forecasts based on trends from the past, and monetary assessments of all quantifiable impacts. However, this framework has been continuously contested in transport planning literature, for instance, for its focus on travel demand and short-term travel time savings. Therefore, we suggest a novel approach for planning and assessing transport schemes in city regions, combining accessibility analyses, quantitative target indicators, and cost-effectiveness analysis. We develop and test this approach by assessing a proposed underground rail project in the Munich city region, the U5 southeast extension. In this case, we define an accessibility target level and estimate the potential for push measures along with the U5 project. We find modest impacts on quantitative targets in the Munich city region: Even when the U5 southeast extension is bundled with push measures in selected transport cells, the contribution to passenger transport-related carbon dioxide emission targets and primary energy consumption targets is low. Nevertheless, we demonstrate that the proposed assessment framework can support strategic transport planning in city regions. We argue for a change in perspective towards supply-side-oriented urban transport planning. Our proposed methodology is a first step in a different direction towards a sustainable mobility planning paradigm.

1. Introduction

Transport planning is facing substantial challenges, for instance, net climate-neutral transport, fair access to opportunities, and new priorities in designing urban environments. These concepts can be addressed with a planning paradigm of sustainable mobility [1]. In this regard, transport project packages, rather than isolated measures, are essential to sustainable spatial and transport development in city regions. Research shows that policy-makers are especially interested in the trade-offs of policies [2]. Hence, methodologies for informing the decision-making process and assessing measures ex-ante are important for transport planning.
Usually, transport appraisal methods are applied to prepare cases for public sector infrastructure investment decisions. The central pillar of transport appraisal is cost–benefit analysis (CBA), often called benefit–cost-analysis (BCA) in the North American realm, the official guidelines of which are quite similar in various countries [3]. However, it is often argued that CBA has significant limitations, for instance, due to its focus on short-term travel time savings, incompleteness, rigidity, and perception as a black box [4,5,6]. Even though there have been intense debates [7], no agreement has been reached in the transport planning and transport economics literature as to which alternative to CBA is most promising and suitable to address the challenges above.
In this paper, we want to contribute to developing alternative appraisal methods by introducing and testing a framework for analysing and assessing transport projects, specifically in city regions. To this end, we summarise the background of transport appraisal by juxtaposing its primary building blocks with possible alternatives in Section 2. Additionally, we describe the context of a case study of the U5 underground southeast extension in the Munich city region. In Section 3, we propose a methodology for designing push and pull measures for a specific intervention area of the Munich city region and assessing this scheme with a short list of indicators and cost-effectiveness analysis (CEA). Section 4 reports the findings of our case study. We discuss the proposed methodology and the results in Section 5. Section 6 concludes that the proposed methodology contributes to more integrated transport planning by bundling transport pull and push measures to achieve quantitative targets in city regions.

2. Background and Context

2.1. Theoretical Background

Transport appraisal methods can be defined as a means to provide policymakers with “[…] structured information regarding the expected positive and negative effects of transport policy options before they take a decision” [8] (p. 1). For this purpose, a comprehensive methodology for transport appraisal has evolved over the last decades. It mainly covers two aspects: first, methods for analysing the impacts of transport projects and policies compared to a reference case, and second, methods for assessing these impacts with respect to a normative assessment criterion. In a review of national guidelines for transport appraisal, Mackie et al. [3] conclude that the practically applied transport appraisal methodologies are broadly similar in various countries: Usually, CBA is embedded in a broader framework, including non-monetised benefits. In a CBA, monetary values are assigned to the impacts of a policy. Benefits and costs are then summarised in a benefit–cost ratio or net present value (NPV). Due to the transformation in monetary units, impacts in various original metrics become commensurable. In contrast to other methods for indicator weighting, CBA uses market prices or inferred monetary values from revealed or stated preference approaches. Thereby, the weighting of impacts is rooted in the preferences of representative consumers. Because CBA sits at the heart of transport project appraisal, the core assessment criterion is allocative efficiency, operationalised in the form of the Kaldor–Hicks criterion of welfare economic theory [9,10]. Applied to transport projects, this criterion states that a project is efficiency-increasing if the monetised positive impacts potentially outweigh the monetised negative impacts and costs for society. Then, the benefit–cost ratio is greater than one, and the NPV of benefits and costs is positive.
Current research on appraisal methods in transport economics and transport planning literature can be categorised into two strands: On the one hand, following the seminal report of the UK SACTRA committee [11], a whole body of literature has investigated possible extensions of the CBA-based assessment framework. In a standard CBA, consumer and producer surplus changes capture all indirect economic effects of a transport project [12]. However, once the assumptions of perfectly competitive markets and constant returns to scale are relaxed, environmental externalities, as well as technological externalities, can be included in the assessment. The literature on wider economic impacts starts with relaxing these assumptions [13,14]. In recent years, methods for measuring wider economic impacts have been developed and integrated into transport appraisal guidance, primarily in English-speaking countries [15].
On the other hand, a strand of research about alternative appraisal methods has evolved, mainly in the transport planning literature. This research is less driven by economic theory and more motivated by the idea that transport planning approaches gradually shift from a demand-oriented paradigm of “predict and provide” [16] towards a paradigm of “sustainable mobility” [1]. It focuses more on multi-criteria analyses and participatory approaches [17,18].
However, the practically applied guidelines for the appraisal of publicly funded transport projects have not yet followed this paradigm shift towards sustainable mobility planning. The transport appraisal guidelines frequently cited in the literature primarily use the economic CBA approach, even if further quantitative and qualitative analyses supplement it [3]. One reason is that government budgetary codes usually prescribe a value-for-money assessment, especially when local transport schemes are co-funded by federal governments. Thereby, the inherent question in national guidelines is still as follows: what are the impacts of a project, and do the benefits justify the costs of implementation in a forecast world of transport demand? Only then will a project be eligible for public funding.
Under this regulatory and methodological regime, it is becoming increasingly difficult to justify transformative transport investments based on allocative efficiency [19]. Transport planners and decision-makers unfamiliar with the concept of economic efficiency might perceive CBA as a black box, too rigid, time-consuming, and too focused on monetary impacts [4]. This conception creates friction between economic appraisal methods and the sustainable mobility paradigm. Essentially, the planning logic and the economic logic diverge.

2.2. New Avenues in Transport Appraisal

Taking the sustainable mobility paradigm seriously would require substantial and detailed changes in the transport appraisal methodology. Hence, promising alternative characteristics for each building block of transport appraisal are operationalised in this paper to develop and test a novel appraisal methodology.
First, backcasting has been suggested as an alternative concept to mere forecasting methodologies [20]. The backcasting approach is a clear benefit for decision guidance, as it reveals the magnitude of societal or political targets and the contribution of solutions to achieving them. Hence, dedicated target values for each indicator must be established to complement the forecasting of reference and project cases, shifting the focus from single transport projects to an integrated analysis of transport targets and possible solutions.
Second, it has been suggested to combine push and pull measures in packages to enhance the effectiveness and acceptance of sustainable transport policies [1]. Consequently, there is a need to assess these mutually supportive project bundles jointly. In the standard assessment methodology, marginal project impacts are calculated based on ceteris paribus comparisons of a project case with a reference case. In this study, an additional case is constructed to analyse and assess the impacts of an entire bundle of push and pull measures.
Third, treating (public) transport supply as a service of general interest requires shifting the perspective from a purely demand-oriented view towards a more supply- and accessibility-based perspective on a city-regional scale. The focus on travel demand and travel time savings in traditional transport appraisal has been discussed intensively in the literature without having reached a final consensus. Metz [6,7] initiated a debate by suggesting that travel time savings disappear in the long run. Under the condition of constant travel time budgets of approximately one hour per person per day, faster traffic will lead to changes in land use patterns and longer travel distances instead of travel time savings. Hence, he concludes that the long-term benefit of transport infrastructure is additional access rather than travel time savings. As a response, it has been argued that travel time savings are still a useful indication of the benefits of additional access, capturing the various responses to transport improvements [21,22]. Givoni [23] acknowledges that there is no perfect methodology and suggests reducing the importance of travel time savings in the decision-making process, focusing on decision-guiding rather than decision-making. Therefore, this paper proposes an accessibility-based methodology as an alternative avenue for decision guidance.
Fourth, cost-effectiveness has been suggested as an alternative metric for decision-making [24]. Thereby, decision-makers are not presented with an aggregate metric such as economic welfare increase that is difficult to interpret for non-economists. Instead, a cost-effectiveness ratio is presented for each indicator, encouraging the in-depth interpretation of various indicators.
Fifth, while a single metric like the benefit–cost ratio in CBA has advantages, it risks concealing divergent components and indirect effects in the welfare metrics of consumer and producer surplus. However, there is a benefit of simple metrics for each target indicator that are still comparable to other policies and projects, even outside the realm of transport. Hence, this paper calculates effectiveness–cost ratios for each target indicator, e.g., abatement of carbon dioxide emissions per cost.
For this study, we propose an alternative appraisal methodology that acknowledges the discussed deficits of the implicit “predict and provide” paradigm inherent in the standard CBA approach and employs the alternatives described above for a paradigm of “sustainable mobility”. Therefore, our research approach is multi-faceted, combining different alternative ideas in a consistent framework for guiding decisions on transport development in city regions. Our overarching research question is as follows:
How can we combine alternative methodologies such as accessibility analyses, quantitative targets, and cost-effectiveness analysis to develop and test an appraisal methodology for packages of transport measures in city regions?
Table 1 summarises the key characteristics of traditional transport appraisal methods and contrasts them with promising alternatives, laying the groundwork for developing the new approach discussed in this paper.

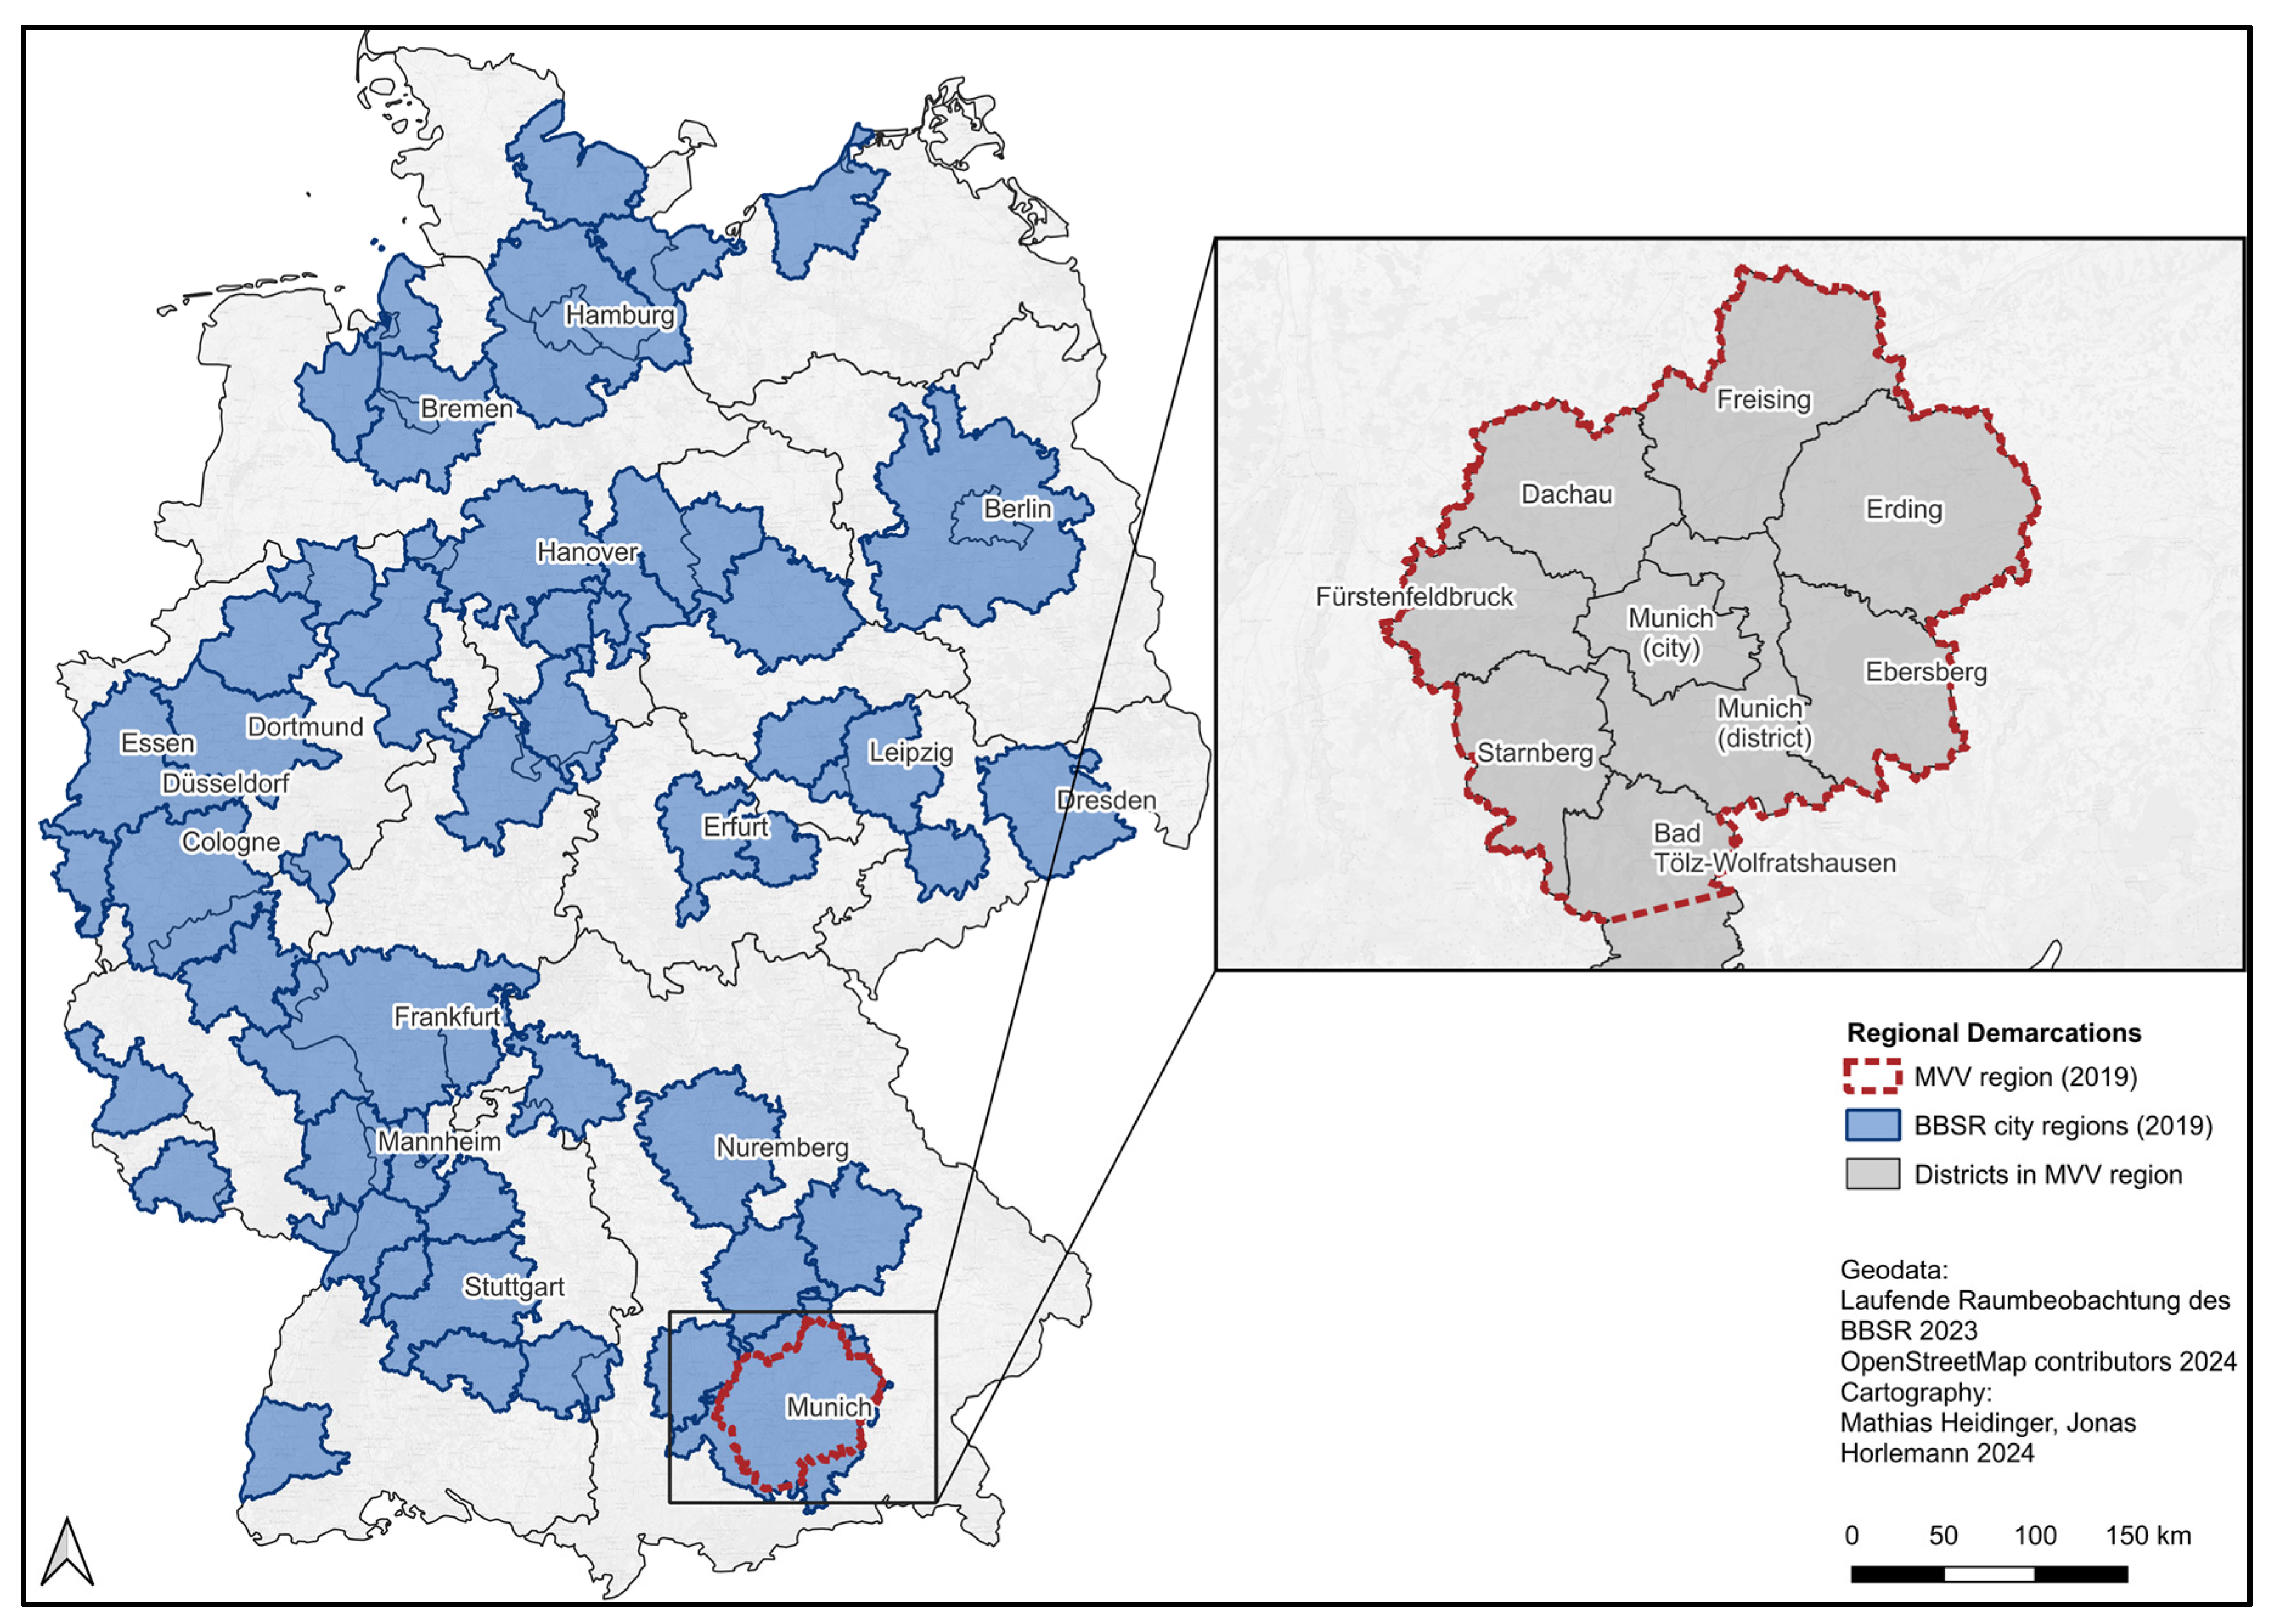
2.3. Case Study: The U5 Southeast Underground Line Extension in the Munich City Region

The case described in this paper is located in the Munich area, Germany. City regions represent the dominant contemporary functional spatial scale for urban economic interactive processes and, hence, a preferred scale for transport appraisal, as they aim to overcome restrictions of (arbitrary) administrative units. They can more profoundly capture the everyday mobility patterns, particularly of commuters. For reasons of data availability and communicability, we hence choose the region of the Munich Transport and Tariff Association (MVV) in 2019, hereafter denoted as the MVV region, as an approximation of the Munich city region. The MVV region is located in the southeast of Germany, consisting of the City of Munich and eight districts (Landkreise), with a total population of approximately 2.9 million inhabitants in 2019. It is shown in Figure 1.
The MVV region is economically thriving, exhibiting significant population and economic growth already for several decades. It is heterogeneous, contrasting densely populated and sparsely populated areas, and spatially rather monocentric [27]. As the region’s centre, the City of Munich shares substantial transport and especially commuter relations with the surrounding areas. For instance, Belz et al. [28] report that approximately 13% of the trips of the inhabitants of neighbouring districts start or end in the City of Munich. With 444,000 employees commuting from outside, Munich has the largest commuter inflow of all German cities [29]. Therefore, measures concerning the regional connectivity of the City of Munich with the surrounding districts are of high political and practical relevance. One project in this context is the potential southeast extension of the underground rail line U5.
The U5 underground line in Munich was opened between 1984 and 1988 and mainly facilitates west–east transit within the City of Munich. Its current eastern terminus is located in the city district of Neuperlach, close to the city’s boundary. Since 2014, there have been ongoing initiatives by the District of Munich’s Council to extend the U5 further southeast into the District of Munich to enhance regional connectivity and public transport travel times. This extension would be approximately five kilometres long and include three additional stations: Neubiberg, Ottobrunn, and Campus Taufkirchen. These could be served with a 10 min headway frequency during peak hours. Independently of the underground line extension, the population in the impacted municipalities is expected to grow by approximately 20% and the number of jobs by approximately 50% by 2035, according to projections by the MVV and the municipalities in the District of Munich. This is also driven by plans to expand the existing aerospace industry cluster in Taufkirchen. As a result, the U5 southeast extension is anticipated to link approximately 100,000 inhabitants and approximately 80,000 jobs in the impacted municipalities to the Munich underground network by 2035, providing direct connections to Munich’s main station. Without the U5 southeast extension, passengers would continue to rely on bus connections to the underground network or urban transit (S-Bahn). The project is one of the major public transport projects in the Munich city region. It is also included in both local transportation plans of the City of Munich and the District of Munich in the category “under investigation” [30,31]. The location of the U5 within the MVV region and the possible U5 southeast extension are shown in Figure 2.
For the case study in this paper, we draw upon data from the MVV [32] and from a preliminary official assessment of the U5 southeast extension [33]. Furthermore, the District of Munich, City of Munich, MVV, Munich Transport Operating Company (MVG), and expert advisers from the transport consultancy Intraplan have been participating in developing the methodology and the case study.

3. Methodology

The proposed methodology is characterised by the four steps summarised in Figure 3. These steps operationalise the alternative building blocks of a novel assessment framework from Table 1. For instance, the change in perspective towards an accessibility-based analysis and target indicators is part of the definition of scope. The proposed sequential calculation of scheme impacts using an additional case, including push measures, is reflected in the second step of the framework. In the third step, the impacts are analysed in original units, and in the final step, the CEA methodology is applied to assess the impacts.
The structure of the paper follows this four-step framework. The definition of scope and the three different cases for structuring the analysis are described and applied to the case of the U5 southeast extension in the following methodological part. In Section 4, we report the impact analysis and assessment findings.

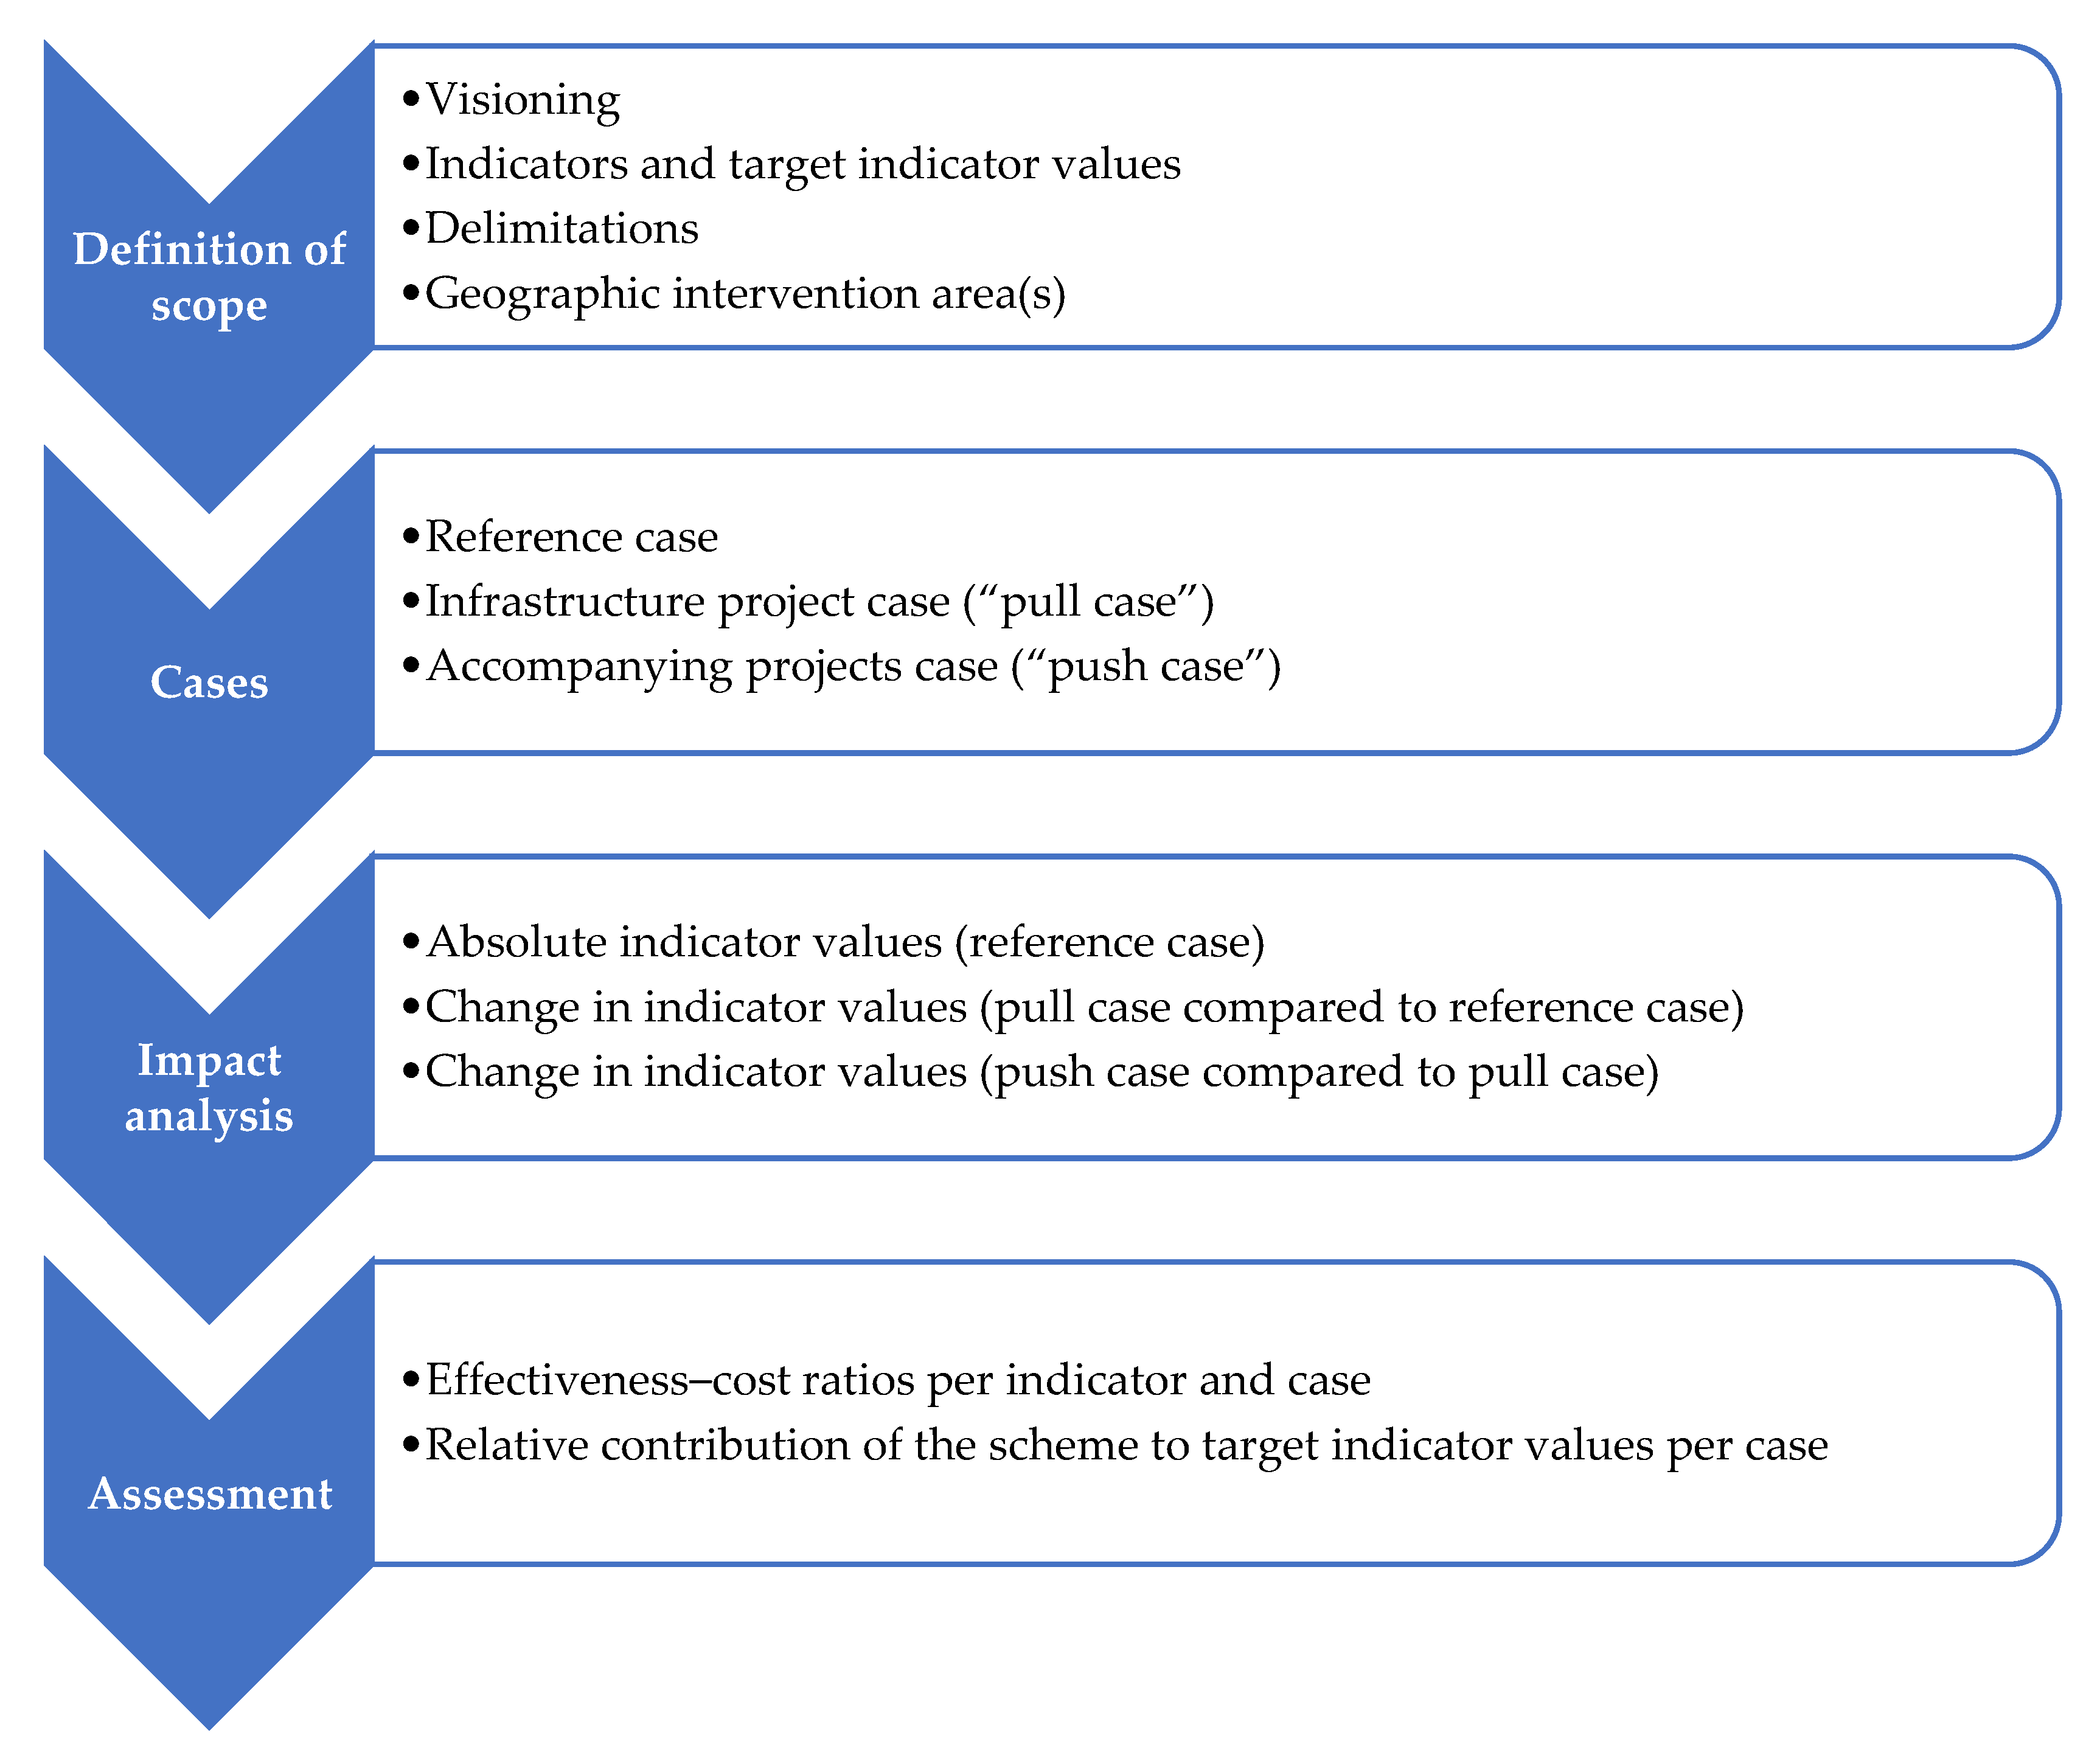
3.1. Definition of Scope

The definition of scope is a critical part of the proposed framework as it affects the list of indicators to be calculated, the target values per indicator, and the delimitations of the assessment. It begins with formulating a vision of how the transport system should develop and how success will be measured in the entire city region. The following premise is underlying this study: “The Munich city region shall take significant action to transform its transport system in line with a sustainable development path. The transport system shall ensure accessibility for all citizens while achieving net zero carbon dioxide emissions and less primary energy consumption in accordance with current legislation”.
Next, a strategy in line with this premise must be formulated, which in the case of this study is as follows: “The cities and districts within the catchment area of the MVV are doing their part to reduce transport-related carbon dioxide emissions. They will take measures to reduce residual emissions that will still occur even when EU-wide, federal, and state regulations are fully implemented. To this end, the public transport network will be significantly expanded. According to the push and pull principle of transport planning [34], each expansion of the public transport network is to be combined with accompanying push measures so that the effectiveness of the overall measure package increases”.
After defining the strategy, a list of quantitative indicators is determined to assess measures and track progress. Table 2 summarises the selected indicators for the case study.
While selecting the indicators, the scope of the analysis and its delimitations need to be defined for the geographical area, the time horizon, the types of transport, and the transport relations. In this case, study, the following delimitations are used:
  • Geographical area: Due to data availability, communicability, and functional adequacy (see Section 2.3), we use the MVV region in 2019 as a spatial delimitation.
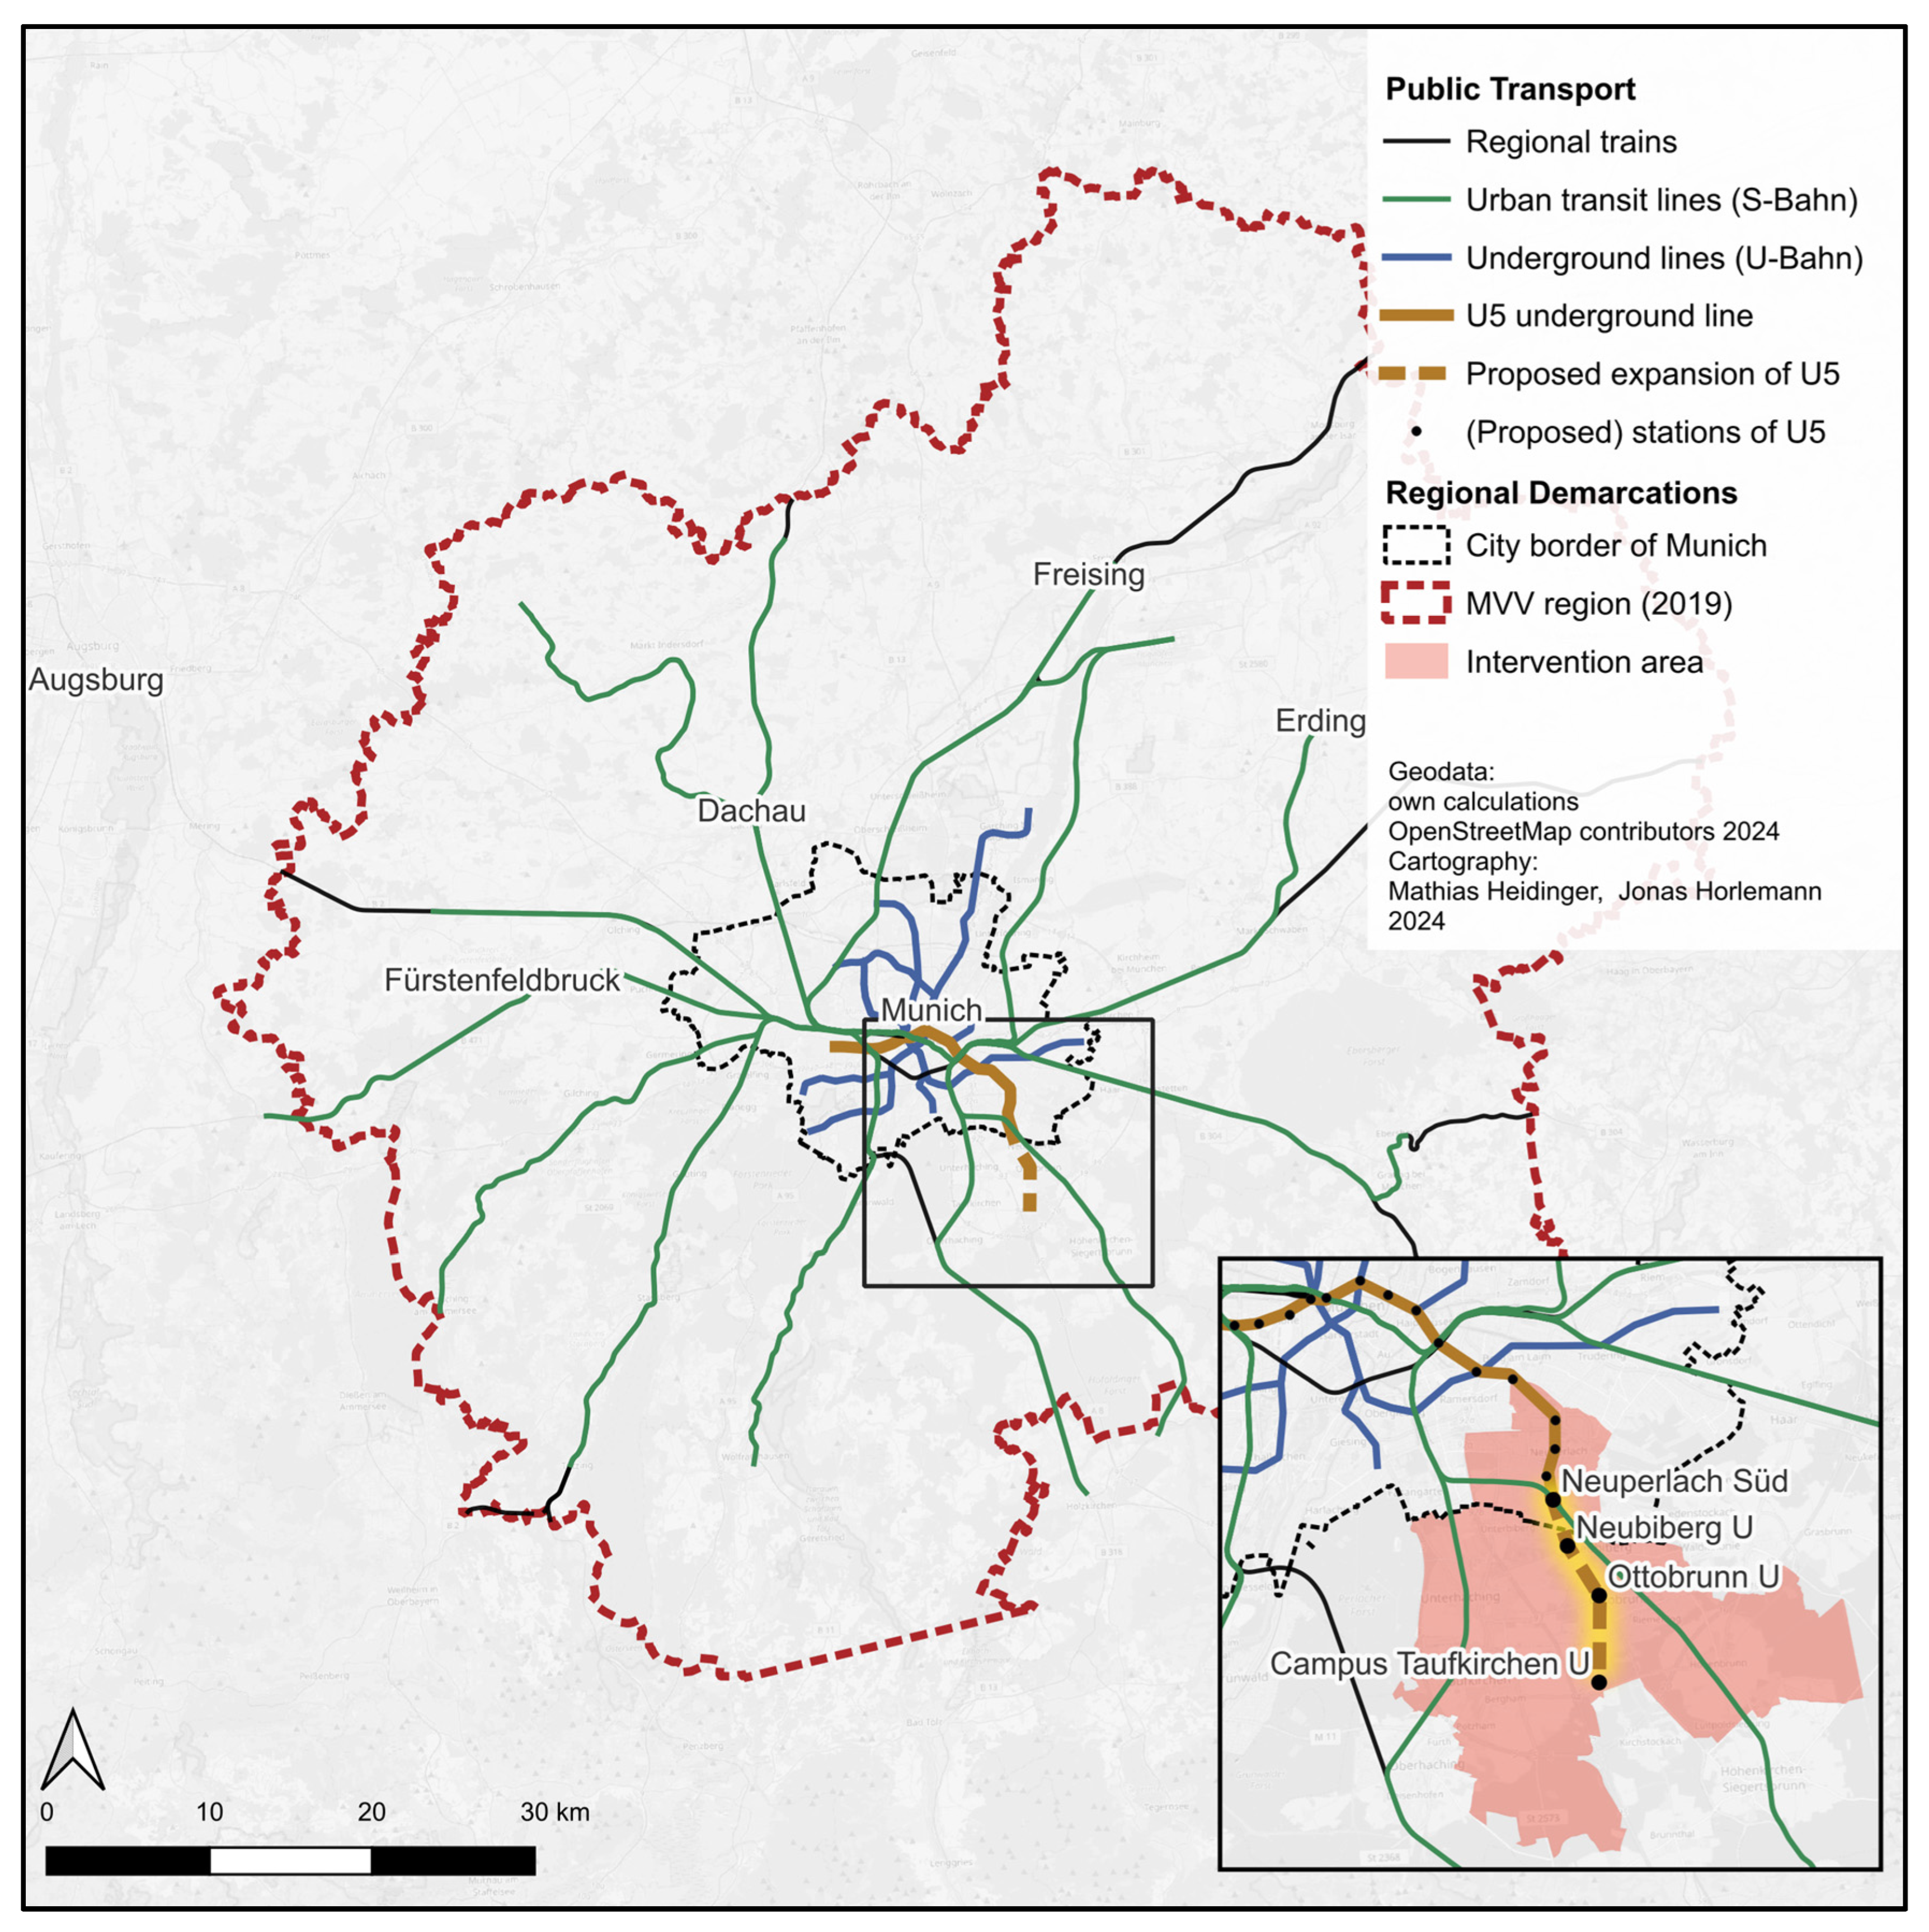
  • Intervention area: For testing the proposed methodology, one intervention area within the MVV region is defined as a sub-unit of the geographical area. This intervention area covers the geographical area of the U5 southeast extension and the area for accompanying push measures. It is shown in Figure 2.
  • Years: The base year of the analysis is 2019. Indicator values are calculated for the years 2019 to 2055. A legal target for the climate neutrality of the transport system in Germany by 2045 has been established [35]. Allowing for some additional years of possible overshoot, we use the period until 2055 as the planning horizon for the MVV region. However, some compromises due to data availability are necessary. For instance, accessibility indicators are only modelled for the forecast year 2035. It was chosen for reasons of data availability. Additionally, this forecast year is currently used for official transport project assessments in the MVV region, ensuring comparability. For the years beyond 2035, travel demand projections were not available. Therefore, the transport demand impacts of the U5 southeast extension and accompanying push measures are assumed constant for the rest of the project’s life cycle.
  • Types of transport: We only consider passenger transport in our study due to data availability and the fact that we assess a scheme with a public transport project that has a negligible impact on freight transport.
  • Transport relations: Our study aims to analyse and assess the transport-related impacts within the MVV region. Hence, we only consider the transport relations starting and ending within the MVV region. The case study does not consider the through, inbound, and outbound traffic of the MVV region. In Germany, long-distance road, rail, and waterway networks are planned on a national scale in the process of the German Federal Transport Infrastructure Plan [36]. Consequently, if the methodology were applied at a broader geographic scale or even at the national level, then more transport relations would be included within the scope of assessment.
Next, we describe the indicators and their calculations in detail.

3.1.1. Accessibility to Jobs

We construct a dimensionless index for measuring the accessibility of the population to workplaces in the MVV region by car, public transit, and bike in 2035. We use a gravity-based accessibility measure, incorporating travel impedance, relation-specific modal split, and a travel impedance decay parameter calibrated for the MVV region. First, accessibility is calculated per transport cell:
A i = 1 j w j j w j e β k μ i j k r i j k × 100
with A i = accessibility per cell, i = origin cell, j = destination cell, k = transport mode (car, public transit, bike), w = workforce per cell (employed and self-employed), β = travel impedance decay parameter (−0.0336 for MVV region), μ = modal share, and r = travel impedance in minutes.
Next, we construct a compound accessibility index for the entire MVV region by using the population at origin cells as weights:
A = 1 i p i i p i A i
with A = compound accessibility index and p = population per cell.
Data for transport cells, population, and workforce per cell are obtained from the MVV [32] and a preliminary assessment study of the U5 southeast extension on behalf of the District of Munich [33]. The MVV data incorporate forecasts of the population and workforce by the City of Munich. For the rest of the MVV region, the MVV forecast relies on official statistics of population forecasts per municipality by the Federal State of Bavaria and data on employment by the German Federal Employment Agency. In the preliminary assessment study of the U5 southeast extension, the data were reconciled with the municipalities in the vicinity. Therefore, planned business park developments and a student campus are included in the data. The data reflect the state of knowledge in 2021.
The components of the travel impedance function are similar to the German national guideline for standardised appraisal of public transport infrastructure investments and are documented therein [37]. They consider evaluated time for access, egress, switching, waiting, in-vehicle time, and, among other things, the quality of stations and vehicles. Travel time, travel impedance, and demand matrices for the forecast year 2035 are taken from the preliminary assessment study of the U5 southeast extension [33]. Since biking has gained relevance for regional transport relations, we impute bike impedance and demand matrices based on the bicycle network of OpenStreetMap [26], r5r routing [38], and mode shares from a German national travel survey [39]. Additionally, we use OpenStreetMap data about settlement areas and locations of buildings to determine the centre per transport cell and calculate the average distances between buildings per transport cell. These data are then used to determine the start and end points for bike routing and to calculate access and egress times for biking to the centre of each transport cell. Lastly, these data are used to impute missing intra-cell transport impedances. We implemented the calculations in the programming language R.
Next, we derive a target value for the compound accessibility index introduced in Formula (2). One methodology to develop scenarios and target indicators per scenario would be the approach of visioning and backcasting by Banister and Hickman [20]. In this case study, however, we concentrate on only one vision for developing and testing the assessment methodology. In line with the vision stated above and for the purpose of this case study, we stipulate that accessibility to jobs within the MVV region must stay constant. To this end, the compound accessibility index for the MVV region in the reference case 2035 is defined as the adequate target level that must be achieved.

3.1.2. Carbon Dioxide Emissions

We calculate carbon dioxide emissions from passenger transport within the MVV region for each transport system s:
e m i s s i o n s s = v s × f s C O 2 × 10 6
with e m i s s i o n s = carbon dioxide emissions in tons CO2 per year, s = transport system (car, regional train, urban transit (S-Bahn), underground rail, tram, bus), v = vehicle kilometres per year, and f CO 2 = carbon dioxide emission factor in gramme CO2 per vehicle kilometre.
Indirect emissions from fuel and electricity production are included in the emission factors. Upstream carbon dioxide emissions from infrastructure construction and vehicle manufacturing are omitted in this case study.
Emissions from freight transport are not calculated. Our scope of analysis is the regional transport relations within the MVV. Hence, emissions from through traffic, inbound, and outbound traffic are not computed.
Carbon dioxide emissions of the national transport sector need to be reduced to net zero by 2045, according to the German Federal Climate Change Act [35]. In the case study, yearly targets are derived based on the assumption that passenger transport within the MVV region must curb emissions by the same ratios as defined in the Federal Climate Change Act. These targets have been tightened to align with the Bavarian Climate Change Act [40], assuming that all sectors contribute equally to the goal of net climate neutrality in Bavaria by 2040.

3.1.3. Primary Energy Consumption

We calculate carbon dioxide emissions from passenger transport within the MVV region for each transport system s:
p r i m a r y   e n e r g y s = v s × f s e n e r g y × 10 9
with p r i m a r y   e n e r g y = primary energy consumption in GJ per year, s = transport system (car, regional train, urban transit (S-Bahn), underground rail, tram, bus), v = vehicle kilometres per year, and f e n e r g y   = primary energy consumption factor in Joule per vehicle kilometre.
Energy consumption from freight transport is not calculated. Our scope of analysis is the regional transport relations within the MVV. Hence, energy consumption from through traffic, inbound traffic, and outbound traffic is not measured. By computing primary energy consumption, we also consider losses from energy conversion.
Considering price increases and possible energy shortages, energy consumption has come into focus for stakeholders in the MVV region. Hence, a target for transport-related primary energy consumption is included in the case study. It is derived from German federal legislation [41]. This energy efficiency act aims to reduce primary energy consumption by at least 39% by 2030, 51% by 2040, and 57% by 2045, compared to 2008. The analysis assumes that transport-related primary energy consumption within the MVV region must be reduced proportionally to these national targets.

3.1.4. Costs

We calculate a net present value (NPV) covering the costs of the U5 southeast extension and accompanying push measures from the assumed opening of the project in 2035 until the end of the assessment period in 2055. In accordance with the German national appraisal guideline [37], we include the following cost categories:
  • Public transit operating costs;
  • Infrastructure costs: project-specific investment costs, reinvestment, and residual values in 2055 according to standardised life cycles per infrastructure component;
  • Maintenance cost: according to standardised maintenance cost rates per infrastructure component.
We use factor costs, i.e., net of tax. For ease of interpretation and comparability to the other assessment indicators, we calculate the NPV. All costs in the assessment period are discounted to the NPV in 2019 (at 2016 prices), using the same social discount rate of 1.7% as in the German national appraisal guideline. For reasons of comparability, we express costs in 2016 prices.
Costs of the U5 southeast extension are taken from a cost estimation from the preliminary assessment study of the U5 project [33]. For push measures in selected transport cells, costs for infrastructure redesign and maintenance costs are considered. The cost estimation is based on a cost factor for 100 metres of street redesign and the length of residential streets to be redesigned to achieve the car travel time extensions per transport cell.
For reasons of data availability, we only measure the change in costs due to the transport scheme and do not estimate the sum of all investment, maintenance, and operating costs per year in the entire MVV region.

3.2. Cases

The traditional framework of transport appraisal distinguishes between a reference case and a project case. Then, the impacts of a specific project are calculated as differences in indicator values between the project case and the reference case.
In this paper, the reference case captures the forecast developments of the transport system in the MVV region. It includes all transport network changes expected to be effective by 2035 and additional public transit projects by 2045. It also incorporates a forecast of structural data, i.e., population and workforce per cell, and forecasted travel demand and travel time matrices. Lastly, the development of carbon dioxide emission factors and primary energy consumption factors per vehicle kilometre is projected based on assumptions of fleet change, efficiency gains, and changes in the mix of the electric power supply.
In contrast to traditional transport appraisal methods, this paper does not use a single project case to calculate the impacts of a scheme. Instead, the project case is split into two sequentially modelled cases. This procedure allows for separating the effects of the U5 southeast extension as a public transport infrastructure project and accompanying push measures that restrict car usage.
Firstly, the pull case differs from the reference case only regarding the U5 southeast extension. Its impacts can be identified by modelling the impacts of a change in the transit network and calculating the passengers that are “pulled” into the public transport system. In our case study, the methodology of constructing the pull case is similar to the German national appraisal guideline [37]. Hence, the pull case consists of the following:
  • Changes in the public transit network due to the U5 southeast extension in 2035 (in terms of additional underground stations, changes in the operating concept of underground services, changes in bus services);
  • Resulting changes in the travel impedance matrices;
  • Resulting changes in the travel demand matrices;
  • Resulting changes in carbon dioxide emissions and primary energy consumption;
  • Changes in investment, maintenance, and operating costs.
Secondly, a push case is constructed with the pull case as a baseline. According to Marshall [34], push measures make the conditions for car driving less attractive, pushing travellers to reduce or shift trips to other modes of transport, destinations, or time. Pull measures improve the conditions for alternative modes of transport, such as public transport or bike. Policies including both types of measures are usually the most effective. Sometimes, this is also referred to as the principle of “carrots and sticks” [42]. In our push case, it is assumed that push measures are implemented in the form of extensive street redesigns, the reallocation of road space, car-reduced neighbourhoods, facilities for vehicle sharing, parking restrictions, speed restrictions, etc. These measures are operationalised by calculating travel time extensions for car traffic per transport cell. Hence, push measures in this case study are defined as interventions that reduce the attractiveness of car traffic in specific transport cells. They are designed to affect the intra-cell, inbound, and outbound traffic relations of a cell, not through traffic. The idea is to address mobility behaviour starting and ending in the intervention area and shift it to public transit.
In this case study, we concentrate on designing a methodology that accomplishes the following:
  • Shows where these push measures could be implemented from a regional accessibility perspective;
  • Shows their effect on mobility behaviour, carbon dioxide emissions, and primary energy consumption in relation to the costs of the scheme. Other positive impacts of push measures on urban environments, quality of life, and quality of stay are neglected here, as well as possible negative impacts on the economic welfare of car users.
The travel time extensions for car usage in each transport cell in the intervention area are calculated as follows:
1.
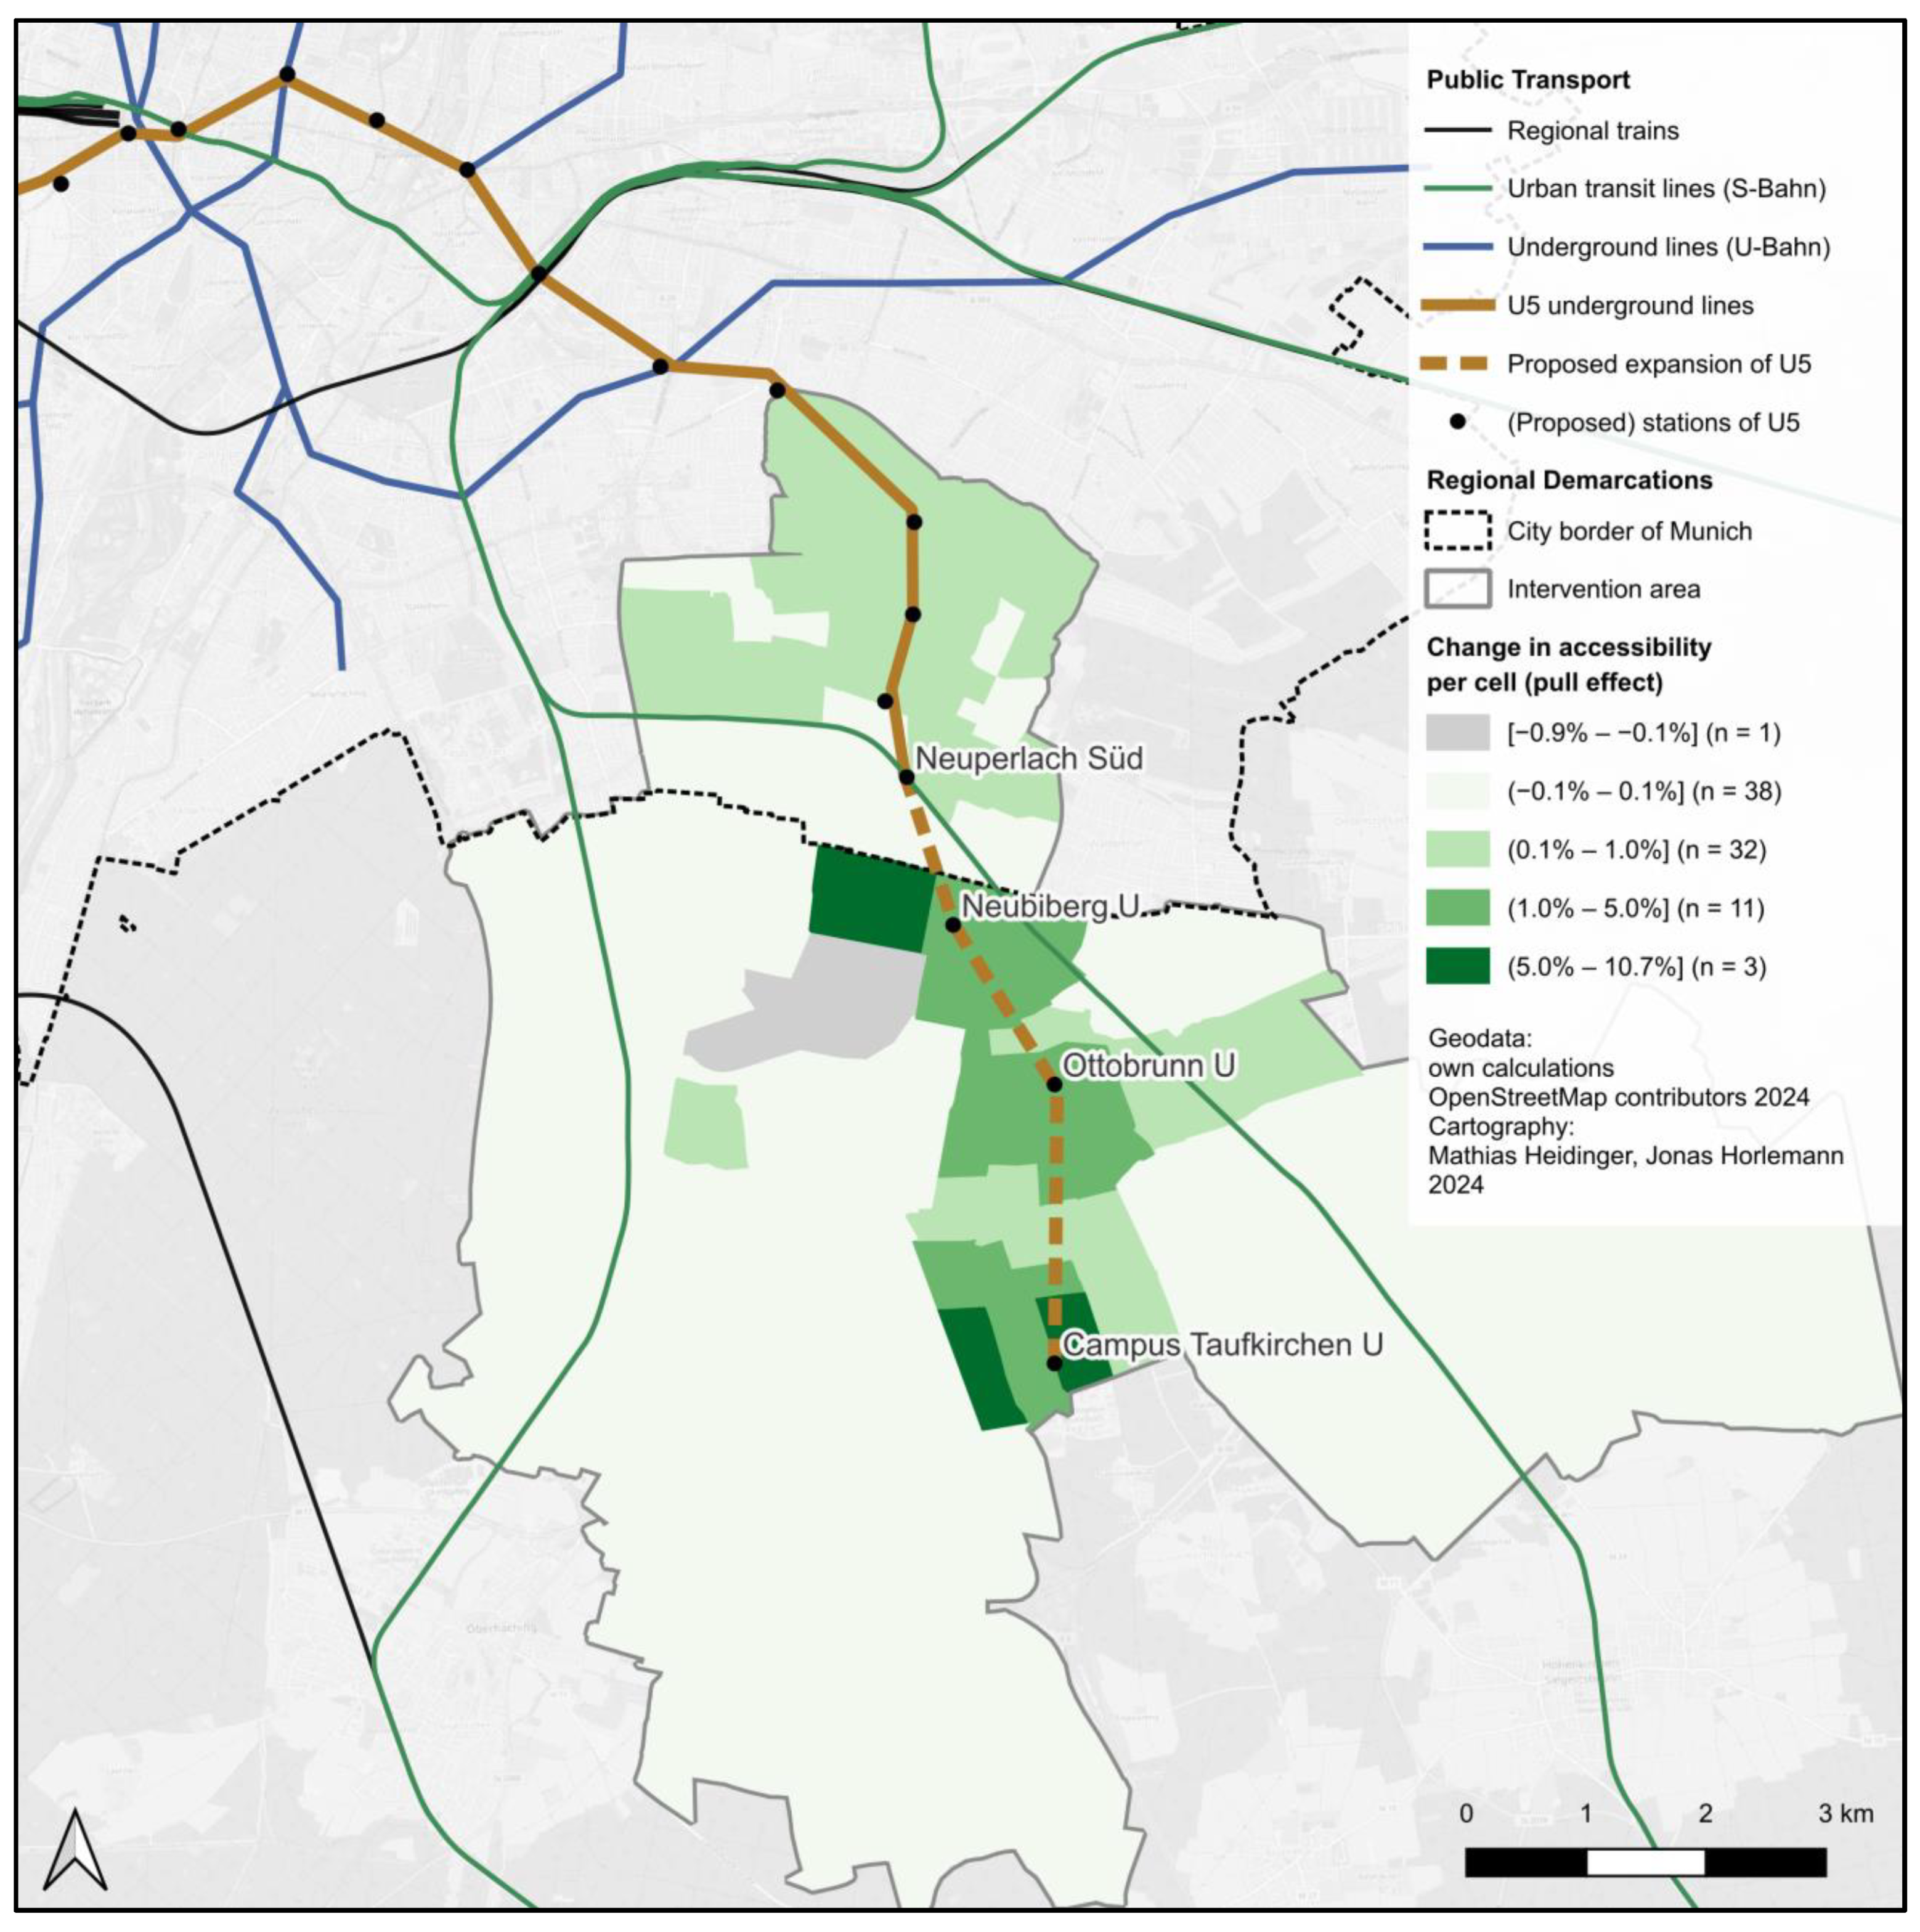
The effect of the U5 project on public transit accessibility in the intervention area is determined by calculating the change in public transit accessibility in the pull case compared to the reference case (rc). For this, the modal share in Formula (1) is neglected, and only accessibility for k = transit is calculated per cell:
A i , t r a n s i t = A i , t r a n s i t p u l l A i , t r a n s i t r c = 100 × 1 j w j × j w j e β r i j , t r a n s i t p u l l j w j e β r i j , t r a n s i t r c
2.
A i ,   t r a n s i t can be expressed as a change of “weighted average public transit impedance in minutes per cell in the intervention area to reach jobs in the MVV region” by using a logarithmic transformation of accessibility per cell:
r ¯ i , t r a n s i t p u l l = log ( A i , t r a n s i t p u l l ) β log ( A i , t r a n s i t r c ) β
3.
Next, this accessibility improvement in the public transit system is regarded as a potential to make car traffic per transport cell less attractive by implementing push measures. Hence, in the first term of Equation (7), car impedance surcharges per cell are set equal to the negative change in weighted average public transit impedance per cell in the intervention area. In the second term of Equation (7), this is scaled by the ratio of transit demand and car demand ( d i j = travel demand per origin–destination relation in passengers per weekday) per cell:
r i , c a r p u s h = r ¯ i , t r a n s i t p u l l × j d i j , t r a n s i t r c j d i j , c a r r c
If a transport cell has a high ratio of transit to car demand, this indicates that sufficient services are available. It is, therefore, more accessible for car users to shift to public transit. Thus, these transport cells receive a higher car impedance surcharge in the push case. Instead, if the ratio of transit to car demand per transport cell is low, the car impedance surcharge is lower. Thereby, push measures are assigned to cells that both benefit from the pull project and allow travellers to shift to public transit.
4.
In the final step, car impedance surcharges are converted into car travel time extensions in the push case, where ρ c a r is a conversion factor from the transport model:
t i , c a r p u s h = r i , c a r ρ c a r
Note that adding car travel time extensions per transport cell will affect all inbound and outbound travel relations, as well as travel time within cells. As a result, transport relations that do not benefit from the pull project might be affected, too. Hence, accessibility in the MVV region might decrease disproportionately. This is solved by numeric optimisation to estimate car impedance surcharges per cell while holding the compound accessibility indicator in the entire MVV region constant. The initial values of this optimisation are set as described above. Then, the squared difference between the compound accessibility index in the reference case and the compound accessibility index in the push case, including car impedance surcharges per cell, is minimised. The optimisation problem is described in Appendix A.
This approach ensures that an adequate level of accessibility as part of a sustainable mobility strategy for the MVV region is maintained. In the case study, the accessibility target is defined as the level of the compound accessibility index in the reference case in 2035. Consequently, the compound accessibility index for the MVV region must remain constant before and after implementing the transport scheme. However, accessibility per cell, i.e., accessibility in different locations, can vary. This reflects the fact that by any intervention, it is nearly impossible to have only winners. There will almost always be winners and losers, be they people, transport users, or geographic areas. We argue that planning should provide an appropriate level of accessibility for the MVV region. Then, people and businesses can make their own location decisions.
An elasticity model is used to estimate the change in car vehicle kilometres due to the push measures in the case study. For this purpose, an elasticity of car demand with respect to travel time changes of −0.5 is adopted, as found in Wardman’s meta-study [43].
The change in car travel demand in the push case compared to the pull case is calculated according to Formula (9):
Δ d i j , c a r p u s h = t i j , c a r p u s h t i j ,   c a r p u l l t i j ,   c a r p u l l × ϵ c a r × d i j , c a r p u l l
with d i j = travel demand per origin–destination relation in passengers per weekday, i = origin cell, j = destination cell, pull = pull case, push = push case, ϵ c a r = elasticity of car travel demand with respect to car travel time changes, and t = travel time in minutes. The car travel times in the push case ( t i j , c a r p u s h ) in Formula (9) include the car travel time extensions due to push measures at origin and/or destination. Next, an occupancy rate of 1.3 person-kilometres per vehicle kilometre and a demand scaling factor of 300 working days per year are applied to project the change in yearly vehicle kilometres. This procedure corresponds to the parameters specified in the German national appraisal guideline [37], which were calibrated for regional transport relations. Based on the change in car vehicle kilometres, the effects on passenger transport-related carbon dioxide emissions and primary energy consumption are calculated.
If no additional public transport services are introduced in the push case to compensate for the additional demand, only the change in car vehicle kilometres affects transport emissions and primary energy consumption in the push case compared to the pull case. Therefore, we examine whether additional public transport services are required to meet the additional demand resulting from the push measures. For this purpose, the mode shift to public transit and bikes is calculated using cross-elasticities as described in Acutt and Dodgson [44]. We calculate the change in transit demand per origin–destination relation according to Formula (10):
Δ d i j , t r a n s i t p u s h = t i j ,   c a r p u s h t i j ,   c a r p u l l t i j ,   c a r p u l l × ϵ i j , t r a n s i t , c a r × d i j , t r a n s i t p u l l
with ϵ i j , t r a n s i t , c a r = cross-elasticity of transit travel demand with respect to car travel time changes. The cross-elasticity is calculated per origin–destination relation according to Formula (11), using the elasticity of car demand, the ratio of car and transit demand per origin–destination relation, and the diversion factor ( δ c a r ) from car to transit. The diversion factor measures the proportion of car travellers diverting to or from car when the car travel time increases due to push measures.
ϵ i j , t r a n s i t , c a r = ϵ c a r × d i j , c a r p u l l d i j , t r a n s i t p u l l × δ c a r
For the scope of this sensitivity analysis, we set the diversion factor from car to transit to −0.5. This is in a range of reported values in the literature, e.g., by [45] for the Oslo region. We find that the maximum additional public transit demand for all origin–destination relations in the push case is 27 passengers per day. Hence, we conclude that this low additional public transit demand from push measures can be transported without additional public transit services in the push case. Otherwise, the additional services would have to be included in the calculation of operating costs, public transit emissions, and energy consumption.
In the proposed framework, the infrastructure project is bundled with accompanying push measures. The intervention area is based on the administrative and geographic boundaries where the measures are implemented, even though the impacts of the scheme also occur in other areas of the city region. We argue that the administrative geographic area is suitable for bundling projects into packages for the following reasons:
  • Administrative responsibilities: Since all projects in a package are assessed jointly, the implementation of the entire package must be guaranteed. This is most likely if the projects fall under the responsibility of certain administrative authorities—municipalities or city districts—that can credibly guarantee implementation.
  • Communication with citizens and various stakeholders: The acceptance of accompanying projects, e.g., street redesigns and parking reductions, is likely to increase if they are associated with improvements from a public transport infrastructure project. The idea of acceptance is also reflected in the concept of “push and pull measures” [34] or “carrots and sticks” [42].
  • Strategic action and scaling for the city region: Geographically distinct intervention areas create the opportunity to develop a transport programme for the city region on a larger scale. Our proposed framework can assist this process by building on the analyses and assessment results to rank and prioritise schemes for many intervention areas.
  • Clear attribution of impacts: There is a clear causal relationship between the transport project package and resulting changes in travel demand, carbon dioxide emissions, and primary energy consumption. It is irrelevant where the impacts occur. Therefore, we functionally attribute all indicator impacts to the project package of one intervention area, even if parts of the impacts occur outside the intervention area. For instance, imagine one person who lives inside the intervention area and whose workplace is outside the intervention area. Due to the scheme, this person might shift from using a car to taking public transit for their trip to work. Then, a part of the journey occurs within the intervention area and another part outside. In our framework, the reduction in car vehicle kilometres from the entire journey length would be functionally attributed to the transport scheme in the intervention area. This makes it possible to analyse and assess measures in several regional intervention areas and clearly attribute their effects without double-counting. Hence, stakeholders in a city region could develop project and policy packages for distinct intervention areas, and the methodology could assess the contribution of different intervention areas to region-wide targets for improving the plans and ranking them.

4. Findings

In the following sections, we report the target indicator values for our case study in the MVV region. Afterwards, the impacts of the project bundle, including the U5 southeast extension and accompanying push measures, on the selected indicators are analysed. Lastly, these impacts are assessed with a CEA.

4.1. Target Indicator Values

As Figure 4 shows, there is a large gap between the carbon dioxide emission target and projected emissions in the reference case. Even under the rather optimistic assumptions in the reference case, e.g., fleet electrification, a switch to renewable energy, and no travel demand growth after 2035, emissions from 2019 to 2055 accumulate to 75 Mt CO2. The emission targets imply a remaining budget of 46 Mt CO2 for the same period. Thus, excess carbon dioxide emissions from passenger transport within the MVV region accumulate to 29 Mt CO2.
The result is similar for primary energy consumption, as shown in Figure 5. While primary energy consumption is expected to decrease, primarily due to the shift to renewable energies, the decline is not fast enough to meet the targets. Primary energy consumption from 2019 to 2055 accumulates to 1188 PJ in the reference case. The targets imply a budget of 995 PJ for the same period. Hence, an accumulated excess primary energy consumption from passenger transport within the MVV region of 193 PJ is expected in the reference case.
In this case study, we define the target gap as the difference between target indicator values and projected indicator values in the reference case. In the following sections, the contribution of the scheme to closing the target gap is assessed.

4.2. Impact Analysis

First, we report the accessibility effects in the pull case compared to the reference case. We find that the weighted accessibility per cell improves around the proposed underground stations in the intervention area due to the U5 project, as expected. Figure 6 shows the relative pull effect in the intervention area, i.e., the percentage change of accessibility per cell in the pull case compared to the reference case. While most transport cells exhibit only slight changes in accessibility, the index increases by up to 10.7% in the vicinity of the proposed underground stations. However, 10 out of 85 transport cells exhibit slight accessibility decreases. These result from changes in bus services in the pull case, leading to slightly longer waiting times and, hence, travel times for some origin–destination relations. Nevertheless, the transport cell most affected by an accessibility decrease (−0.9%) is a landscape park without any affected population or workforce. The effect in the other nine cells with a slight accessibility decrease is negligible.
Next, push measures are computed in the form of car travel time extensions per cell, as described in the methodology section of this paper. The results are reported in Figure 7. Of 85 transport cells in the intervention area, 56 exhibit no or only minor potential for push measures. On the other hand, 11 transport cells have a potential for car travel time extensions of more than 30 s per cell. The largest car travel time extensions of up to approximately three minutes per cell concentrate around the new underground stations.
The effects of the car travel time extensions on mode choice and, thus, passenger transport-related carbon dioxide emissions and primary energy consumption are computed as described in the methodology section of this paper. Here, we only report the impact on the final indicators.
We find that the impacts of the U5 project are minimal compared with the reduction targets for carbon dioxide emissions and primary energy consumption from passenger transport within the MVV region. Considering changes in public transport services and modal shift away from cars, 18 kt CO2 are saved in the pull case compared to the reference case. The effect would be even smaller if carbon dioxide emissions from infrastructure construction were considered. If the push measures to restrict car usage are implemented, we expect an additional reduction of 9 kt CO2 in the period 2019 to 2055.
Table 3 summarises the indicators per case. First, the compound accessibility index for the MVV region increases in the pull case. Since the target in this case study is to hold accessibility constant, the index decreases by the same amount in the push case due to car travel time extensions. As defined in the methodology section of this paper, we limit the accessibility analysis to one forecast year, 2035, for reasons of data availability. However, dynamic analyses of accessibility would, in principle, be possible in future applications. The bundle of pull and push measures is projected to achieve a reduction of 27 kt CO2 and 395 TJ in the assessment period from 2019 to 2055. The estimated NPV of costs is EUR 291 million in 2016 prices, accounting for infrastructure, operating, and maintenance costs for both pull and push measures in the assessment period from 2019 to 2055.
The indicator values reported here will be the basis for the assessment in the next section. Even if the accessibility indicator is not part of the strict effectiveness–cost assessment, we see a benefit in reporting the accessibility analysis as part of the overall methodology. These results can support the planning and decision-making process.

4.3. Assessment

The proposed assessment methodology is designed to assist city regions in developing a transport programme with concrete project packages for distinct intervention areas. Therefore, it must be suitable for ranking and prioritising project packages. To this end, we choose CEA, a widely used method in health studies [46]. For a mathematical derivation of the method, see [47].
We use three assessment indicators: First, an effectiveness-cost ratio describes the scheme’s effectiveness per million EUR of costs (NPV) in 2016 prices. Second, its inverse ratio can be interpreted as a cost-effectiveness indicator and can be compared with the costs of carbon dioxide abatement schemes or prices of emissions trading systems. Third, the scheme’s contribution to achieving the target indicator values is assessed. In our case study, this can be interpreted as a contribution to avoiding excess emissions, defined by the gap between target indicator values and projections in the reference case. This indicator is useful for assessing a transport programme for an entire region with schemes in multiple intervention areas, ensuring that the entire programme reaches a certain threshold, ideally 100% of the target indicator value.
Implementing the U5 southeast extension together with accompanying push measures while holding accessibility at constant levels is expected to lead to a reduction of 92 tons of CO2 per million EUR. The cost-effectiveness ratio is EUR 10,858 per ton of CO2, which is more than 100 times as high as the average price of certificates in the European Emissions Trading System in 2022, which was approximately EUR 80 per ton of CO2 in 2022 prices [48].
The scheme in the intervention area is expected to achieve approximately 0.1% of the necessary reduction in carbon dioxide to achieve passenger transport emission targets in the entire MVV region. This effect is small considering the size of the intervention area: approximately five percent of the inhabitants of the MVV region will live in the intervention area in 2035. This indicates that the scheme would need to be about 50 times more effective to make a fair contribution to closing the target gap in the entire MVV region. Therefore, we conclude that the combined push and pull scheme’s impacts are low compared to the carbon dioxide emission target gap. Interpreting the assessment indicators with respect to primary energy consumption leads to similar conclusions.
Table 4 shows the assessment results. We differentiate the assessment according to the pull and the push effect. This differentiation reveals that the weak assessment results are primarily driven by the pull project, i.e., the U5 southeast extension. The results indicate that the push effect is substantially more cost-effective than the mere pull effect of public transit improvements due to the push measures’ lower investment, maintenance, and operating costs.
No assessment is conducted for the compound accessibility index because it was used to derive the accompanying push measures, and it stays constant between the reference case and the push case.
We conclude that the contribution of the U5 southeast extension to passenger transport-related carbon dioxide emission targets and primary energy consumption targets in the MVV region is low, even when bundled with push measures that maintain the level of accessibility in the reference case. Not only is the effectiveness low, but cost effectiveness seems inferior to other policy options, considering that marginal CO2 abatement costs are more than 100 times as high as current certificate prices in the European Emissions Trading Scheme.

5. Discussion

We discuss the proposed framework and its operationalisation in the case study with respect to several criteria below and summarise the arguments in Table 5.
First, we see a benefit of the proposed methodological framework as being flexible to include many more quantitative indicators, such as accidents, land use, or air quality. Furthermore, the framework can be adapted to different target values, making it transferable to other city regions and planning goals. For instance, specific accessibility targets based on the urban structure could be used instead of maintaining current levels of accessibility. Additionally, the application can be scaled up to develop a regional transport programme with more than one intervention area. However, at least in the case study, such a programme would be inconsistent with current infrastructure planning and funding frameworks. In Germany, local and regional public transport infrastructure funding is project-specific, transport mode-specific, and does not include funding for push measures. Currently, projects are co-funded by the national level [49]. Due to budgetary rules, each project must undergo a standardised CBA according to the national appraisal guideline [37]. So far, an integrated planning and funding process consistent with the methodological approach of target indicators for city regions and cost-effective solutions for distinct intervention areas does not exist in Germany. Hence, the approach in this paper would be more consistent with a planning and funding process like the federal agglomeration programmes in Switzerland [50]. These are space- and time-oriented: They comprise measures from several transport modes, as well as spatial and environmental development. The programmes are developed by Swiss agglomerations in a cyclical process repeating every four years, and the Swiss federal government co-funds the programmes at a rate of 30% to 50%. The methodology proposed in this framework is better suited to guide decisions in such a policy framework.
Second, we see a benefit in selecting quantitative indicators because they reveal the magnitude of targets and the rate of goal achievement. This means, however, that the proposed methodology only works for indicators that can be measured on a metric scale. Additionally, this paper’s selected indicators neglect the distributional aspects of transport projects. In future applications, metric indicators of social and distributional aspects could be integrated, for instance, a dedicated accessibility index for vulnerable people or a Gini index of the spatial or personal accessibility distribution.
Third, concerning the assessment, while the proposed methodology permits a focus on individually chosen target indicators, there is a risk of arbitrarily selecting these indicators. In contrast to other methods, such as CBA with indicators grounded in welfare economics, the premise of this paper is to achieve quantitative targets with cost-effective means. Hence, CEA is used. Consequently, the assessment is incomplete since CEA reports effectiveness–cost ratios for each indicator without weighting and aggregating them into a final metric for decision support, such as a benefit–cost ratio. Reporting effectiveness–cost ratios per indicator can be regarded as a benefit in communicating results but also as a restriction, as it gives no definite decision advice, only decision guidance.
Fourth, applying the proposed methodology in our case study demonstrates that it can be operationalised for assessing concrete projects in distinct intervention areas of city regions. Nevertheless, there is a considerable status quo bias since the chosen target in this paper is to hold accessibility constant at the level of the reference case. This goal constitutes a sharp difference from the traditional approach in transport appraisal. The latter identifies the various impacts of a scheme and primarily assesses the benefits over the costs. Then, a scheme is beneficial if it improves on most assessment indicators. By contrast, in the case of this paper, the implicit question is how to best reduce emissions and energy consumption without decreasing accessibility. A path worth pursuing might be testing accessibility target indicators based on the urban structure of an area in future applications.
Fifth, we see an additional benefit of the approach presented in this paper for bundling transport pull and push measures. Independent of the assessment methodology, it might support various transport planning contexts, such as scaling street interventions and car-reduced neighbourhoods in a city region. Future applications could address the current restrictions of the selected accessibility index being incomplete, especially because it is not differentiated to specific transport user groups. Additionally, we must acknowledge that the approach of calculating travel time extensions for cars in selected transport cells is on a conceptual level and is still to be translated into concrete push measures for implementation. Lastly, future applications could consider relation-specific push measures to complement transport cell-specific push measures.
Sixth, the case study results suggest low carbon dioxide mitigation potentials by public transport infrastructure investment. Even when the U5 southeast extension is bundled with accessibility-neutral push measures, the contribution to passenger transport-related carbon dioxide emission targets and primary energy consumption targets in the city region is low. If carbon dioxide emissions and energy consumption during the building phase were also considered, the effectiveness–cost ratios would be even lower. The low CO2 effectiveness–cost ratio seems to be a matter of fact and not a restriction of the methodology. However, there are various other rationales for public transport infrastructure schemes, especially social and economic ones, and the methodological approach in this paper is prepared to integrate these in the form of quantitative indicators in future applications.
Seventh, we see the proposed methodology as a contribution to sustainable mobility planning, even though we must acknowledge that a theory about the determinants and the distributional aspects of welfare in the realm of transport does not back the proposed framework. Hence, it should be discussed based on something other than theory, e.g., concerning its potential to stimulate debate on alternative appraisal methods and foster integrated planning. Several promising alternative concepts and methods to traditional appraisal procedures have been operationalised in this paper. Therefore, we see this paper as a contribution regarding the following aspects:
  • A new perspective complements mere forecasting approaches: Assuming all regulations and expected transport developments manifest in a projected reference case, the proposed methodology determines a city region’s residual scope of action to achieve its target indicator values.
  • A new key analysis variable focuses on transport supply rather than transport demand: In this paper, the key indicator is an accessibility index. Hence, the approach becomes less demand-oriented and more focused on accessibility objectives.
  • A new sequential calculation of three cases fosters integrated planning and assessment: The proposed methodology calculates a third case to bundle pull and push measures into a combined package for a specific intervention area of a city region. Additionally, the method breaks the vicious circle of infrastructure provision and induced traffic. As defined in the feedback model by Wegener [51], lower travel times and costs due to transport projects tend to increase the attractiveness of movement, thus changing location decisions, inducing movement, and, hence, new transport infrastructure construction. Mainstream transport appraisal typically neglects dynamic feedback loops due to transport and land use interactions by focusing on the user benefits of reduced travel times. This paper’s methodology can help avoid the transportation and land use feedback loop by holding accessibility constant, thereby counter-balancing accessibility improvements due to faster connections with push measures.
One way of shaping the transformation towards sustainable mobility can be described as “transition by design”. According to this understanding, the overarching goal is to create decision frameworks and guidance for long-term integrated urban and transport development to achieve sustainability targets. The methodology in this paper aligns with this goal. It could be adapted to include more sustainability indicators even though changing planning and funding processes is highly speculative, and assessing schemes for many distinct intervention areas of a region will take additional time and financial resources.
A different approach to “transition by design” is a concept we call “transition through rapid and effective action”. According to this understanding, there is no time left for changing planning and funding frameworks if legally binding carbon dioxide abatement targets are still to be achieved. As shown above, while the MVV region needs to be net climate-neutral by 2040, the infrastructure projects assessed are unlikely to even be built by then. In this agenda setting, the goal would be to identify the most cost-effective policies, ensuring that all selected policies will achieve the targets. The results in this paper suggest that the effectiveness of public transport infrastructure pull and push projects on carbon dioxide emissions is far from sufficient if accessibility must not decrease. Hence, “transition through rapid and effective action” would call for more effective schemes accepting accessibility reductions.
In either case, the methodology presented in this paper could guide decision-making processes. We regard it as a contribution towards strategic supply-side, accessibility-oriented urban transport planning and as a first step in a different direction towards a sustainable mobility planning paradigm.

6. Conclusions

This paper proposes and applies a novel approach for the ex ante assessment of transport projects in city regions. As an alternative to traditional building blocks of transport appraisal, the methodology combines an accessibility-focused perspective, a bundle of pull and push measures in a specific intervention area, quantitative target indicators as a complement to forecasting methods, and assessment based on effectiveness and costs.
Applying this approach to the case of the proposed U5 southeast extension and accompanying push measures in the Munich city region, we find a large gap between passenger transport-related carbon dioxide emission targets and projected emissions in a reference case. The same applies to passenger transport-related primary energy consumption. The contribution of the U5 southeast extension to closing these gaps is low, even when the project is bundled with push measures in the intervention area. Considering the substantial carbon dioxide emissions and primary energy consumption reduction targets, the findings indicate that large-scale public transport infrastructure projects perform poorly on an effectiveness–cost criterion if current accessibility levels are to be maintained.
Nevertheless, the proposed approach has several benefits. First, it has the potential to shift focus away from the individual impacts of large-scale transport infrastructure projects towards a process of integrated transport and spatial planning in a city region. Second, bundling pull and push measures fosters more comprehensive transport planning. Perhaps most importantly, it reveals the magnitude of transport-related targets and the interventions’ contribution to achieving them. Therefore, the proposed assessment framework can support strategic transport planning in city regions. Additionally, it can contribute to changing perspectives towards strategic accessibility-oriented urban transport planning and a sustainable mobility paradigm.
Future research could integrate further indicators, for instance, objectives of land use. This will reflect a more holistic set of sustainable development indicators by capturing the dimensions of transport (accessibility), environment (carbon dioxide, primary energy consumption), and space (spatial accessibility targets and transit-oriented development indicators).

Author Contributions

Conceptualization, J.H.; methodology, J.H.; validation, J.H. and M.H.; formal analysis, J.H. and M.H.; investigation, J.H. and M.H.; data curation, J.H. and M.H.; writing—original draft preparation, J.H.; writing—review and editing, J.H., M.H., F.W. and A.T.; visualization, J.H. and M.H.; supervision, F.W. and A.T.; project administration, J.H.; funding acquisition, J.H., M.H., F.W. and A.T. All authors have read and agreed to the published version of the manuscript.

Funding

The research of all authors was conducted thanks to funding from the German Ministry of Education and Research (BMBF). The funding is part of the BMBF initiative clusters4future and its mobility cluster MCube—Munich Cluster for the Future of Mobility in Metropolitan Regions (grant number 03ZU1105JA).

Data Availability Statement

The data presented in this study are available on request from the corresponding author.

Acknowledgments

We thank several anonymous reviewers for their valuable comments, which significantly improved this paper. Special thanks also go to Martin Arnold and the BeneVit project partners for their helpful advice.

Conflicts of Interest

The research was conducted in the BeneVit project within the mobility cluster MCube—Munich Cluster for the Future of Mobility in Metropolitan Regions. Led by the Technical University of Munich (TUM), MCube is an interdisciplinary mobility cluster bringing together actors from research, society, and business. Within BeneVit, the project partners Munich Transport and Tariff Association (MVV), Intraplan Consult, Munich Transport Operating Company (MVG), City of Munich, and District of Munich supported the development of the methods, provided data, and approved the manuscript. Any errors or shortcomings in this work are solely the authors’ responsibility. The funder BMBF had no role in the design of the study; in the collection, analyses, or interpretation of data; in the writing of the manuscript; or in the decision to publish the results.

Appendix A

Our gravity-based compound accessibility index is defined as
A = 1 i p i 1 j w j i j p i w j e β k μ i j k r i j k × 100
with A = compound accessibility index, A i = accessibility per cell, i = origin cell, j = destination cell, k = transport mode (car, public transit, bike), w = workforce per cell (employed and self-employed), p = population per cell, β = travel impedance decay parameter, μ = modal share, and r = travel impedance in minutes.
Imagine A rc is the compound accessibility index in the reference case. In the pull case, accessibility improves. Otherwise, it would not be a good pull case, and there would be no potential for push measures. Hence, ( A pull A rc ) > 0 .
Note that A is a function of modal split weighted travel impedances. In the pull case, public transit impedances decrease on average compared to the reference case. At the same time, the car impedance matrix is held constant in our sequential modelling approach. Hence, there is a potential to increase car impedance in the push case, thereby decreasing modal split weighted accessibility in the push case to the level of the reference case.
Thus, the objective function of the optimisation problem is
min   A push A rc 2
In line with our sequential modelling approach, A push is calculated with r i j ,   transit push = r i j ,   t r a n s i t pu ll and r i j ,   car push = r i j ,   c a r pu ll + s i , c a r + s j , c a r . The decision variables are car impedance surcharges s c a r per cell in the intervention area. These surcharges per cell affect intra-cell relations and all inbound and outbound relations to or from that cell.
Next, we set a constraint that these impedance surcharges per cell must be larger or equal to zero:
s i , c a r 0   for   all   cells
We use numerical optimisation to solve this problem. To this end, we use the “L-BFGS-B” algorithm for restricted optimisation implemented in the “stats” package within R.

References

  1. Banister, D. The Sustainable Mobility Paradigm. Transp. Policy 2008, 15, 73–80. [Google Scholar] [CrossRef]
  2. Annema, J.A.; Mouter, N.; Razaei, J. Cost-Benefit Analysis (CBA), or Multi-Criteria Decision-Making (MCDM) or Both: Politicians’ Perspective in Transport Policy Appraisal. Transp. Res. Procedia 2015, 10, 788–797. [Google Scholar] [CrossRef]
  3. Mackie, P.; Worsley, T.; Eliasson, J. Transport Appraisal Revisited. Res. Transp. Econ. 2014, 47, 3–18. [Google Scholar] [CrossRef]
  4. Beukers, E.; Bertolini, L.; Te Brömmelstroet, M. Why Cost Benefit Analysis Is Perceived as a Problematic Tool for Assessment of Transport Plans: A Process Perspective. Transp. Res. Part A Policy Pract. 2012, 46, 68–78. [Google Scholar] [CrossRef]
  5. Hickman, R.; Dean, M. Incomplete Cost—Incomplete Benefit Analysis in Transport Appraisal. Transp. Rev. 2018, 38, 689–709. [Google Scholar] [CrossRef]
  6. Metz, D. The Myth of Travel Time Saving. Transp. Rev. 2008, 28, 321–336. [Google Scholar] [CrossRef]
  7. Metz, D. Response to the Responses. Transp. Rev. 2008, 28, 713–715. [Google Scholar] [CrossRef]
  8. Mouter, N. Standard Transport Appraisal Methods. In Advances in Transport Policy and Planning; Mouter, N., Ed.; Elsevier: Cambridge, MA, USA, 2021; Volume 7, pp. 1–7. ISBN 978-0-323-85559-4. [Google Scholar]
  9. Berechman, J. Welfare Foundations of Project Appraisal. In The Evaluation of Transportation Investment Projects; Routledge: New York, NY, USA, 2009; pp. 27–47. ISBN 978-0-415-77715-5. [Google Scholar]
  10. Karlström, A. Appraisal. In Handbook of Choice Modelling; Hess, S., Daly, A., Eds.; Edward Elgar Publishing: Cheltenham, UK, 2014; ISBN 978-1-78100-315-2. [Google Scholar]
  11. Standing Advisory Committee on Trunk Road Assessment (SACTRA). Transport and the Economy: Full Report (SACTRA); The Stationery Office Books: London, UK, 1999; ISBN 0-11-753507-9. [Google Scholar]
  12. Jara-Diaz, S.R. On the Relation between Users’ Benefits and the Economic Effects of Transportation Activities. J. Reg. Sci. 1986, 26, 379–391. [Google Scholar] [CrossRef]
  13. Holvad, T.; Leleur, S. Transport Projects and Wider Economic Impacts. In Handbook on Transport and Development; Hickman, R., Givoni, M., Bonilla, D., Banister, D., Eds.; Edward Elgar Publishing: Cheltenham, UK, 2015; pp. 259–272. ISBN 978-0-85793-726-1. [Google Scholar]
  14. Laird, J.J.; Venables, A.J. Transport Investment and Economic Performance: A Framework for Project Appraisal. Transp. Policy 2017, 56, 1–11. [Google Scholar] [CrossRef]
  15. Wangsness, P.B.; Rødseth, K.L.; Hansen, W. A Review of Guidelines for Including Wider Economic Impacts in Transport Appraisal. Transp. Rev. 2017, 37, 94–115. [Google Scholar] [CrossRef]
  16. Goulden, M.; Ryley, T.; Dingwall, R. Beyond ‘Predict and Provide’: UK Transport, the Growth Paradigm and Climate Change. Transp. Policy 2014, 32, 139–147. [Google Scholar] [CrossRef]
  17. Macharis, C.; de Witte, A.; Ampe, J. The Multi-Actor, Multi-Criteria Analysis Methodology (MAMCA) for the Evaluation of Transport Projects: Theory and Practice. J. Adv. Transp. 2009, 43, 183–202. [Google Scholar] [CrossRef]
  18. Mouter, N.; Koster, P.; Dekker, T. Contrasting the Recommendations of Participatory Value Evaluation and Cost-Benefit Analysis in the Context of Urban Mobility Investments. Transp. Res. Part A Policy Pract. 2021, 144, 54–73. [Google Scholar] [CrossRef]
  19. Hickman, R. The Gentle Tyranny of Cost–Benefit Analysis in Transport Appraisal. In Transport Matters; Policy Press: Bristol, UK, 2019; pp. 131–152. ISBN 978-1-4473-2955-8. [Google Scholar]
  20. Banister, D.; Hickman, R. Transport Futures: Thinking the Unthinkable. Transp. Policy 2013, 29, 283–293. [Google Scholar] [CrossRef]
  21. Mackie, P. Who Knows Where the Time Goes? A Response to David Metz. Transp. Rev. 2008, 28, 692–694. [Google Scholar] [CrossRef]
  22. Van Wee, B.; Rietveld, P. ‘The Myth of Travel Time Saving’: A Comment. Transp. Rev. 2008, 28, 688–692. [Google Scholar] [CrossRef]
  23. Givoni, M. A Comment on ‘The Myth of Travel Time Saving’. Transp. Rev. 2008, 28, 685–688. [Google Scholar] [CrossRef]
  24. Cervero, R. Going beyond Travel Time Savings; World Bank: Washington, DC, USA, 2011. [Google Scholar]
  25. Bundesinstitut für Bau-, Stadt- und Raumforschung (BBSR). Laufende Raumbeobachtung, Raumgliederungen auf Regionsbasis: Großstadtregionen 2019. Available online: https://www.bbsr.bund.de/BBSR/DE/forschung/raumbeobachtung/downloads/archiv/download-referenzen.html (accessed on 5 January 2024).
  26. OpenStreetMap Contributors. OpenStreetMap 2024. Available online: https://www.openstreetmap.org/copyright/en (accessed on 29 January 2024).
  27. Thierstein, A.; Wulfhorst, G.; Bentlage, M.; Klug, S.; Gilliard, L.; Ji, C.; Steiner, H.; Sterzer, L.; Wenner, F.; Zhao, J. WAM Wohnen Arbeiten Mobilität—Veränderungsdynamik und Entwicklungsoptionen für die Metropolregion München (Living Working Mobility—Change Dynamics and Development Options for the Munich Metropolitan Region); Technical University of Munich: Munich, Germany, 2016. [Google Scholar]
  28. Belz, J.; Brand, T.; Eggs, J.; Ermes, B.; Follmer, R.; Gruschwitz, D.; Kellerhoff, J.; Pirsig, T.; Roggendorf, M. Mobilität in Deutschland—MiD Regionalbericht Stadt München, Münchner Umland und MVV-Verbundraum. Studie von Infas, DLR, IVT und Infas 360 im Auftrag des Bundesministeriums Für Verkehr und Digitale Infrastruktur (FE-Nr. 70.904/15); Bundesministerium für Verkehr und digitale Infrastruktur: Bonn, Germany; Berlin, Germany, 2019.
  29. Bundesinstitut für Bau-, Stadt- und Raumforschung (BBSR). Zahl der Pendlerinnen und Pendler gestiegen (Increase in the Number of Commuters). Available online: https://www.bbsr.bund.de/BBSR/DE/startseite/topmeldungen/pendeln-2022.html (accessed on 2 January 2024).
  30. Landeshauptstadt München, Referat für Stadtplanung und Bauordnung. Zwischenbericht Nahverkehrsplan (Interim Report Local Transport Plan); Landeshauptstadt München, Referat für Stadtplanung und Bauordnung: Munich, Germany, 2021.
  31. Plan:Mobil; Mathias Schmechtig NahverkehrsConsult. Fortschreibung des Nahverkehrsplans für den Landkreis München (Update of the Local Transport Plan for the District of Munich); Landratsamt München: Munich, Germany, 2020. [Google Scholar]
  32. Munich Transport and Tariff Association (MVV). MVV Database 2019–2035 (Unpublished); Munich Transport and Tariff Association (MVV): Munich, Germany, 2022. [Google Scholar]
  33. Intraplan. Benefit-Cost-Analysis U5 South, Commissioned by the District of Munich (Unpublished); Intraplan: Munich, Germany, 2023. [Google Scholar]
  34. Marshall, S. Introduction: Travel Reduction—Means and Ends. Built Environ. 1999, 25, 88–93. [Google Scholar]
  35. Federal Climate Change Act of 12 December 2019 (Federal Law Gazette I, p. 2513), as Last Amended by Article 1 of the Act of 18 August 2021 (Federal Law Gazette I, p. 3905). 2021. Available online: https://www.gesetze-im-internet.de/englisch_ksg/englisch_ksg.html (accessed on 7 March 2024).
  36. Fichert, F. Transport Policy Planning in Germany—An Analysis of Political Programs and Investment Masterplans. Eur. Transp. Res. Rev. 2017, 9, 28. [Google Scholar] [CrossRef]
  37. Intraplan; VWI Stuttgart. German National Guideline for Standardised Appraisal of Public Transport Infrastructure Investments, Version 2016+, Prepared on Behalf of the German Ministry for Digital and Transport; Intraplan: Munich, Germany; VWI Stuttgart: Stuttgart, Germany, 2022. [Google Scholar]
  38. Pereira, R.H.M.; Saraiva, M.; Herszenhut, D.; Braga, C.K.V.; Conway, M.W. R5r: Rapid Realistic Routing on Multimodal Transport Networks with R5 in R. Findings 2021, 1–10. [Google Scholar] [CrossRef]
  39. Nobis, C.; Kuhnimhof, T. Mobilität in Deutschland—Mid, Ergebnisbericht, Studie von infas, DLR, IVT und infas 360 im Auftrag des Bundesministers für Verkehr und digitale Infrastruktur (FE-Nr. 70.904/15); Bundesministerium für Verkehr und Digitale Infrastruktur: Berlin, Germany, 2018.
  40. Bavarian Climate Change Act of 23 November 2020 (Bavarian Law Gazette, p. 598, 656, BayRS 2129-5-1-U), as Last Amended by Article 1 of the Act of 23 December 2022 (Bavarian Law Gazette, p. 704). 2022. Available online: https://www.gesetze-bayern.de/Content/Document/BayKlimaG/true (accessed on 7 March 2024).
  41. German Energy Efficiency Act of 13 November 2023 (Federal Law Gazette I, p. 309). 2023. Available online: https://www.gesetze-im-internet.de/enefg/BJNR1350B0023.html (accessed on 7 March 2024).
  42. Meyer, M.D. Demand Management as an Element of Transportation Policy: Using Carrots and Sticks to Influence Travel Behavior. Transp. Res. Part A Policy Pract. 1999, 33, 575–599. [Google Scholar] [CrossRef]
  43. Wardman, M. Meta-Analysis of British Time-Related Demand Elasticity Evidence: An Update. Transp. Res. Part A Policy Pract. 2022, 157, 198–214. [Google Scholar] [CrossRef]
  44. Acutt, M.Z.; Dodgson, J.S. Cross-Elasticities of Demand for Travel. Transp. Policy 1995, 2, 271–277. [Google Scholar] [CrossRef]
  45. Flügel, S.; Fearnley, N.; Toner, J. What Factors Affect Cross-Modal Substitution?—Evidences from the Oslo Area. Int. J. Transp. Dev. Integr. 2018, 2, 11–29. [Google Scholar] [CrossRef]
  46. Svensson, M.; Hultkrantz, L. A Comparison of Cost-Benefit and Cost-Effectiveness Analysis in Practice: Divergent Policy Practices in Sweden. Nord. J. Heal. Econ. 2017, 5, 41–53. [Google Scholar] [CrossRef]
  47. Willan, A.R.; Briggs, A.H. Cost-Effectiveness Analysis. In Statistical Analysis of Cost-Effectiveness Data; Statistics in Practice; Wiley: Chichester, UK, 2006; pp. 43–65. ISBN 978-0-470-85628-4. [Google Scholar]
  48. Nissen, C.; Gores, S.; Healy, S.; Hermann, H. Trends and Projections in the EU ETS in 2023, The EU Emissions Trading System in Numbers; European Environment Agency: Copenhagen, Denmark, 2023.
  49. Municipal Transport Financing Act (Gemeindeverkehrsfinanzierungsgesetz) in the Version Published on January 28, 1988 (Federal Law Gazette I P. 100), Which Was Last Amended by Article 323 of the Ordinance of June 19, 2020 (Federal Law Gazette I p. 1328). 2020. Available online: https://www.gesetze-im-internet.de/gvfg/index.html#BJNR002390971BJNE000101307 (accessed on 7 March 2024).
  50. Bundesamt für Raumentwicklung (ARE). Programm Agglomerationsverkehr (Agglomeration Traffic Programme). Available online: https://www.are.admin.ch/are/de/home/verkehr-und-infrastruktur/programme-und-projekte/agglomerationsprogramme-verkehr-und-siedlung.html (accessed on 3 January 2024).
  51. Wegener, M. Overview of Land Use Transport Models. In Handbook of Transport Geography and Spatial Systems; Hensher, D.A., Button, K.J., Haynes, K.E., Stopher, P.R., Eds.; Emerald Group Publishing Limited: Leeds, UK, 2004; pp. 127–146. ISBN 978-1-61583-253-8. [Google Scholar]
Figure 1. City regions of Germany and MVV region in the case study (Source: own work, using geodata by [25,26]).
Sustainability 16 02349 g001
Figure 2. The U5 underground line and the possible U5 southeast extension within the MVV region (Source: own work, using geodata by [26,32]).
Sustainability 16 02349 g002
Figure 3. Overview of the four methodological steps.
Sustainability 16 02349 g003
Figure 4. Carbon dioxide emissions from passenger transport within the MVV region: comparison of target and reference case (source: own work).
Sustainability 16 02349 g004
Figure 5. Primary energy consumption from passenger transport within the MVV region: comparison of target and reference case (source: own work).
Sustainability 16 02349 g005
Figure 6. Percentage change in modal split weighted accessibility per transport cell in the push case in 2035 compared to the reference case in 2035. Values are only reported for transport cells within the intervention area (source: own work and calculations, using geodata by [26,32]).
Sustainability 16 02349 g006
Figure 7. Car travel time extensions in minutes per cell in the intervention area, affecting all intra-cell, inbound, and outbound trips by car (source: own work and calculations, using geodata by [26,32]).
Sustainability 16 02349 g007
Table 1. Stylised comparison of traditional transport appraisal characteristics and alternatives used for this study.
Traditional Transport AppraisalPromising Alternative
Perspective:ForecastingForecasting + targets
Calculation of scheme impacts:Ceteris paribus comparison:
reference case/project case
Sequential comparison of three cases:
reference case/project case (“pull”)/project case with accompanying measures (“push”)
Key variable:Travel demandAccessibility
Metric:Economic welfare: transport consumer and producer surpluses, plus technological externalitiesCost-effectiveness
Formal assessment:CBA 1CEA 2, plus contribution of the scheme to achieve target indicators
Underlying paradigm:“Predict and provide” as long as benefits exceed costsSustainable mobility
Research priorities:Complete assessment of all scheme impacts, including wider economic impacts;
Spatial and social incidence of costs and benefits
Testing of multi-faceted approaches of integrated planning to break the vicious circle of infrastructure investment, spatial relocation, induced traffic, and the resulting need for more infrastructure investment;
Process-orientation instead of project-orientation: regional programmes to achieve quantitative targets instead of isolated planning of individual schemes;
Project packages (“push and pull”)
1 CBA: cost–benefit analysis; 2 CEA: cost-effectiveness analysis.
Table 2. List of quantitative indicators in the case study.
IndicatorDescription
Accessibility to jobsIndex describing the accessibility of the population to workplaces in the MVV region by car, public transit, and bike in 2035.
Carbon dioxide emissionsCarbon dioxide emissions from passenger transport within the MVV region.
Primary energy consumptionPrimary energy consumption from passenger transport within the MVV region.
CostsCosts for infrastructure investment, maintenance, and operation, expressed as NPV in EUR at 2016 prices.
Table 3. Indicator values per case.
UnitTarget
Indicator Value
Reference
Case
Change in
Pull Case vs.
Reference Case
Change in
Push Case vs.
Pull Case
Change in
Push Case vs.
Reference Case
Forecast for 2035:
Accessibility to jobs 1[-]21.214521.2145+0.0178−0.01780
Total for the assessment period 2019 to 2055:
Carbon dioxide emissions 2[kt CO2]46,13075,109−18−9−27
Primary energy consumption 2[TJ]995,2101,187,587−214−181−395
Costs 3[million EUR2016]not calculatednot calculated+283+8+291
1 compound accessibility index for MVV region; 2 from passenger transport within the MVV region; 3 NPV 2019 in 2016 prices.
Table 4. Assessment results for the period 2019 to 2055.
Effectiveness-Cost
Ratio 1
Cost-Effectiveness
Ratio 2
Contribution to
Close the Target Gap 3
Carbon dioxide emissions 4
Pull effect−63 t CO2/million EUR201615,804 EUR2016/t CO20.06%
Push effect−1084 t CO2/million EUR2016922 EUR2016/t CO20.03%
Pull + Push effect−92 t CO2/million EUR201610,858 EUR2016/t CO20.09%
Primary energy consumption 4
Pull effect−756 GJ/million EUR20161323 EUR2016/GJ0.11%
Push effect−22,049 GJ/million EUR201645 EUR2016/GJ0.09%
Pull + Push effect−1357 GJ/million EUR2016737 EUR2016/GJ0.20%
1 change in indicator value per case, divided by NPV of costs per case; 2 NPV of costs per case, divided by change of indicator value per case; 3 change in indicator value per case, divided by the target gap. The target gap is defined as the difference between the target indicator value and the indicator value in the reference case; 4 from passenger transport within the MVV region.
Table 5. Summary of advantages and restrictions of the proposed framework and its application to the case of the U5 southeast extension and push measures in the MVV region.
CriteriaAdvantagesRestrictions
1. FrameworkFlexible and scalable for developing transport programmes for city regionsSpatial scale and integrated project packages often inconsistent with current planning and funding frameworks
2. IndicatorsRevealing quantitative targets and the contribution to these targetsSocial distribution of effects neglected;
Methodology only suitable for quantitative indicators
3. AssessmentNew premise: achieving quantitative targets with cost-effective meansIncomplete assessment, no weighting and no aggregate indicators for decision support
4. Case StudyPossible adaptation: accessibility targets based on urban structureStatus quo bias due to the target of constant accessibility at the level of the reference case
5. ModellingCombination of accessibility improvements due to public transport investment with spatial push measures is transferrable to other contextsAccessibility not differentiated according to specific user groups;
Push measures (cell-specific car travel time extensions) still to be translated into concrete measures for implementation;
So far, only cell-specific and no relation-specific push measures considered
6. ResultsCO2 mitigation potential by public transport infrastructure projects seems lowVarious other justifications for transport schemes not reflected in the indicators of the case study
7. Contribution to sustainable mobility planningDeduction of target indicator values to complement mere forecasting approaches;
Analysis focusing on transport supply (accessibility) rather than transport demand;
Fostering integrated planning
Methodology not backed by theory about the determinants and distributional aspects of welfare in the realm of transport
Disclaimer/Publisher’s Note: The statements, opinions and data contained in all publications are solely those of the individual author(s) and contributor(s) and not of MDPI and/or the editor(s). MDPI and/or the editor(s) disclaim responsibility for any injury to people or property resulting from any ideas, methods, instructions or products referred to in the content.

